Special Report
America's Most Violent (and Peaceful) States

Published:
Last Updated:
As it stands, the nationwide violent crime rate today is about half what it was in 1993. While the United States is a much more peaceful place than it has been in decades, millions of Americans still live in relatively violent areas.
How peaceful or violent a given state is depends on more than the violent crime rate alone. Some violent crimes are more egregious than others, and factors such as the incarceration rate and the presence of firearms can also reflect how violent or peaceful a given state is.
24/7 Wall St. created a weighted index to identify the most violent and the most peaceful states. Though there are a handful of exceptions, more violent states tend to be in the South, while the most peaceful states are concentrated in the Northeast.
Click here to see how violent or peaceful your state is.
Click here to see our detailed findings and methodology.

50. Vermont
> Violent crime rate: 118.0 per 100,000 (the lowest)
> Murder rate: 1.6 per 100,000 (3rd lowest)
> Median household income: $56,990 (20th highest)
> May unemployment rate: 3.1% (9th lowest)
By a number of metrics, Vermont is the least violent state in the nation. There were 118 violent crimes reported per 100,000 Vermont residents in 2015, the lowest violent crime rate of any state. There were 10 reported murders in the state, the third fewest when adjusted for population. The lack of criminal activity in Vermont is likely one reason for the state’s small prison population. Just 288 in every 100,000 Vermont residents is incarcerated in a state prison, less than half the national rate of 607 inmates per 100,000 Americans.
Another possible explanation for the state’s relative peacefulness is its mostly rural makeup. The state has few large metropolitan areas, which often drive up crime rates in other states.
[in-text-ad]

49. Maine
> Violent crime rate: 130.1 per 100,000 (2nd lowest)
> Murder rate: 1.7 per 100,000 (4th lowest)
> Median household income: $51,494 (21st lowest)
> May unemployment rate: 3.2% (13th lowest)
Maine is one of many small New England states that are among the least violent in the country. While nationwide there were 373 violent crimes reported per 100,000 Americans in 2015, in Maine there were 130 incidents reported per 100,000 residents, the second least of any state and one-third the national rate. The state’s incarceration rate is also very low — half of the national rate. Just 301 people in every 100,000 Maine residents are incarcerated in a state prison, compared to 607 inmates per 100,000 Americans nationwide.
Joblessness and crime often go hand in hand, with lower crime in areas with low unemployment and vice versa. In Maine, just 3.2% of the workforce is currently unemployed, among the least of any state.

48. New Hampshire
> Violent crime rate: 199.3 per 100,000 (4th lowest)
> Murder rate: 1.1 per 100,000 (the lowest)
> Median household income: $70,303 (7th highest)
> May unemployment rate: 2.9% (6th lowest)
Just 199 violent crimes were reported per 100,000 New Hampshire residents in 2015, the fourth least of any state. There were 14 homicides in New Hampshire that year, the least of any state when adjusted for population. New Hampshire has one of the lowest gun ownership rates in the country, and just 57% of murders in the state involved a firearm — one of the smallest shares nationwide.
An estimated 90% of all crimes involve financial motivations, and many of the states with the highest violent crime rates struggle with widespread poverty and unemployment. In New Hampshire, just 8.2% of residents live below the poverty line, and only 2.9% of the labor force is unemployed, far less than the corresponding national figures of 14.7% and 4.3%.

47. Rhode Island
> Violent crime rate: 242.5 per 100,000 (11th lowest)
> Murder rate: 2.7 per 100,000 (12th lowest)
> Median household income: $58,073 (19th highest)
> May unemployment rate: 4.1% (25th lowest)
The availability of firearms is correlated with the incidence of gun-related homicides and violent crime overall. In Rhode Island, fewer than 1 in 10 residents live in a household with a firearm, compared to 1 in 3 Americans nationwide. Guns factor into just 37% of all homicides and 24% of suicides in Rhode Island, the second and third smallest shares of any state.
Rhode Island has approximately 35% less violent crime per capita than the U.S. as a whole and about half the incarceration rate. There were 243 violent crimes reported per 100,000 Rhode Island residents in 2015, far less than the national rate of 373 incidents per 100,000 Americans. Just 303 in every 100,000 Rhode Island residents are incarcerated in state prisons, the fifth lowest incarceration rate of any state.
[in-text-ad-2]
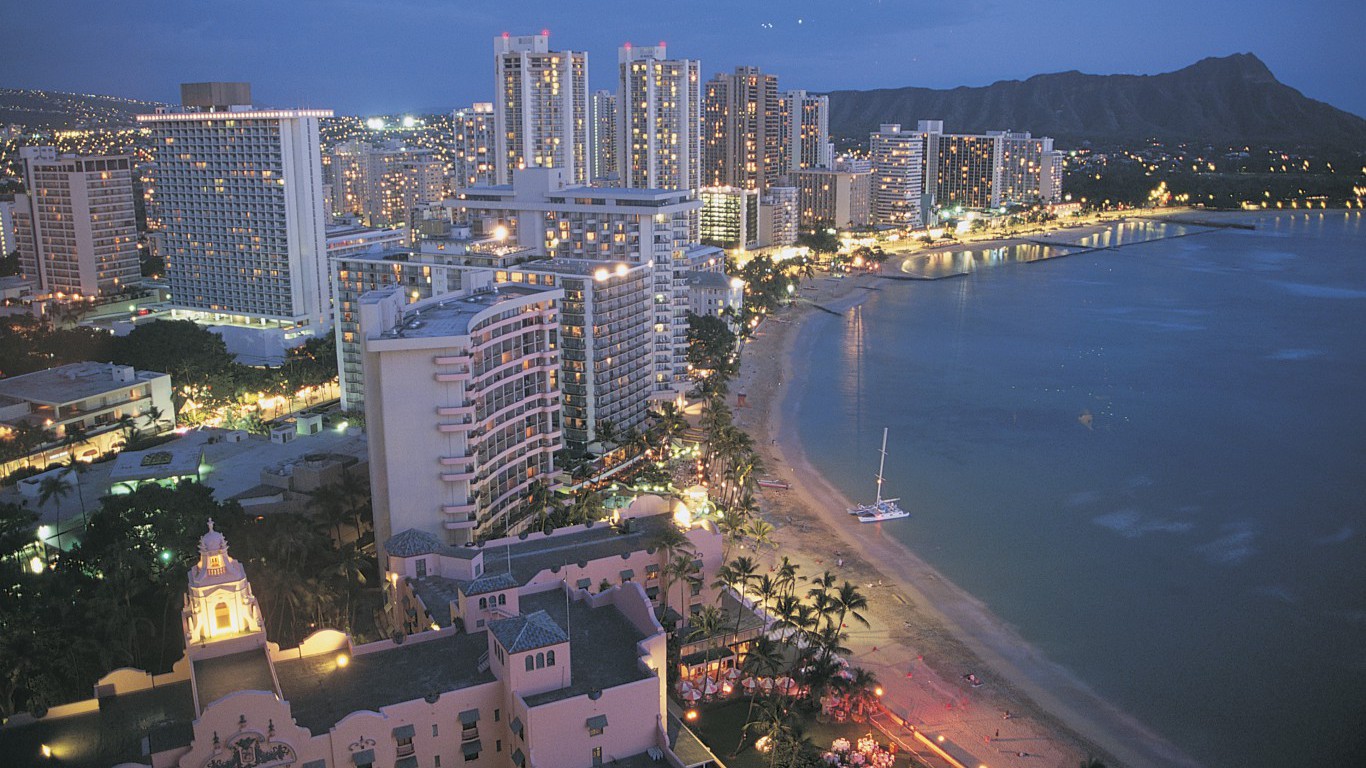
46. Hawaii
> Violent crime rate: 293.4 per 100,000 (20th lowest)
> Murder rate: 1.3 per 100,000 (2nd lowest)
> Median household income: $73,486 (2nd highest)
> May unemployment rate: 2.7% (3rd lowest)
Hawaii requires residents to obtain a permit with a waiting period of 14 days minimum before they can get a gun. And in June 2016, it became the first state to register its gun owners in an FBI database. The strict gun laws may potentially reduce the availability of firearms in the state. Guns are involved in only 21% of homicides and 20% of suicides in Hawaii — each the smallest share of any state.
There were 293 violent crimes reported per 100,000 Hawaii residents in 2015, far less than the national rate of 373 incidents per 100,00 Americans. There were 19 homicides, the second lowest murder rate when adjusted for population. While Hawaii has one of the lower violent crime rates in the country, the state has the most property crimes — burglary, larceny, and motor vehicle theft — per capita nationwide. One reason for the high property crime rate may be the state’s active tourism industry. Tourists often carry large amounts of money and other valuables, and may be less likely to be available to testify against criminals in court, which makes them frequent targets for criminals.

45. Minnesota
> Violent crime rate: 242.6 per 100,000 (12th lowest)
> Murder rate: 2.4 per 100,000 (9th lowest)
> Median household income: $63,488 (12th highest)
> May unemployment rate: 3.7% (17th lowest)
Minnesota is one of many states with low poverty, high educational attainment, and low unemployment where violent crime is relatively uncommon and residents are less than half as likely to be incarcerated as the average American. There were just 243 violent crimes reported per 100,000 Minnesota residents in 2015, far less than the national rate of 373 incidents per 100,000 Americans.
Unlike in more violent states, Minnesota’s metropolitan areas do not drive the state’s crime rate significantly higher. While the Minneapolis-St.Paul-Bloomington metropolitan area is the most dangerous in the state, its violent crime rate of 286 incidents per 100,000 residents is far lower than the national average. In three of the five metropolitan areas in Minnesota — Rochester, Mankato-North Mankato, and St. Cloud — the violent crime rate is less than half the national figure.
[in-text-ad]

44. Utah
> Violent crime rate: 236.0 per 100,000 (9th lowest)
> Murder rate: 1.8 per 100,000 (5th lowest)
> Median household income: $62,912 (13th highest)
> May unemployment rate: 3.2% (13th lowest)
There were just 236 violent crimes reported per 100,000 people in Utah in 2015, far less than the national rate of 373 incidents per 100,000 Americans. Prison populations tend to be lower in areas where crime rates are lower, and with one of the lowest violent crime rates, Utah also has one of the lowest incarceration rates of any state. Utah’s prison population has declined after the state passed the Justice Reinvestment Initiative, a package of criminal justice reforms that reclassified some non-violent felonies as misdemeanors. Today, 391 in every 100,000 Utah residents are incarcerated in state prisons, far less than the national rate of 607 inmates per 100,000 Americans.
While Utah has less violent crime per capita than the nation as a whole, violence against women in the state is relatively common. There are far more rapes and domestic violence homicides per capita in Utah than the nation overall, and law enforcement officials in the state are less likely to process rape kits than the average U.S. police officer.

43. Massachusetts
> Violent crime rate: 390.9 per 100,000 (18th highest)
> Murder rate: 1.9 per 100,000 (6th lowest)
> Median household income: $70,628 (6th highest)
> May unemployment rate: 4.2% (23rd highest)
Massachusetts has some of the strictest gun laws of any state. Massachusetts law prohibits certain semiautomatic assault weapons and requires gun owners to pass a number of background checks and complete a gun safety course. Gun violence is relatively uncommon in Massachusetts. Firearms are used in just 21% of all suicides in the state, less than half the 51% national figure. Additionally, there were just 1.2 gun-related homicides reported per 100,000 Massachusetts residents in 2015, the 10th least of any state.
Despite the lower gun violence in Massachusetts, there were 391 violent crimes reported per 100,000 residents in 2015, slightly more than the national rate of 373 incidents per 100,000 Americans. According to one of the state’s district attorneys, crime in Massachusetts is at a 41-year low.

42. Connecticut
> Violent crime rate: 218.5 per 100,000 (6th lowest)
> Murder rate: 3.3 per 100,000 (17th lowest)
> Median household income: $71,346 (5th highest)
> May unemployment rate: 4.9% (7th highest)
The typical Connecticut household earns $71,346 a year, the fifth highest median household income of any state. Just 10.5% of the population lives in poverty, the sixth smallest share. While the relationship between income and violence is complicated, individuals that are part of households below the poverty line are more than twice as likely to be victims of violent crime as residents of high-income households. There were just 218 violent crimes per 100,000 Connecticut residents in 2015, a lower crime rate than in all but five states.
Connecticut’s incarceration rate has been declining in recent years and is now at its lowest point in more than two decades. Today, 440 in every 100,000 Connecticut residents is in a state prison, less than the national incarceration rate of 607 prisoners per 100,000 Americans.
[in-text-ad-2]

41. New Jersey
> Violent crime rate: 255.4 per 100,000 (13th lowest)
> Murder rate: 4.1 per 100,000 (22nd lowest)
> Median household income: $72,222 (4th highest)
> May unemployment rate: 4.1% (25th lowest)
Wealthier states are often more peaceful than poorer ones. Rounding out the list of the top 10 most peaceful states, New Jersey is another example of this pattern. The typical household in the Garden State earns $72,222 a year, more than the median income in all but three other states. Additionally, there are only 255 violent crimes — such as rape, robbery, and murder — for every 100,000 state residents, well below the 373 per 100,000 U.S. violent crime rate.
As is the case in many Northeastern states that rank as relatively peaceful, gun ownership is not especially common in New Jersey. Only 11.3% of state residents belong to households that own a gun.

40. Iowa
> Violent crime rate: 286.1 per 100,000 (18th lowest)
> Murder rate: 2.3 per 100,000 (8th lowest)
> Median household income: $54,736 (25th highest)
> May unemployment rate: 3.1% (9th lowest)
An area’s economy can be a bellwether for the prevalence of crime. In Iowa, a strong job market may partially explain relatively peaceful conditions. Only 3.1% of the state’s workforce is out of a job, well below the 4.3% unemployment rate nationwide. Similarly, there were only 286 violent crimes for every 100,000 residents in 2015 compared to 373 violent crimes per 100,000 nationwide.
While safer states tend to have fewer firearms, Iowa is an exception. More than 1 in 3 Iowans are part of households that own a gun, a slightly larger share than the 29.1% national gun ownership rate.
[in-text-ad]
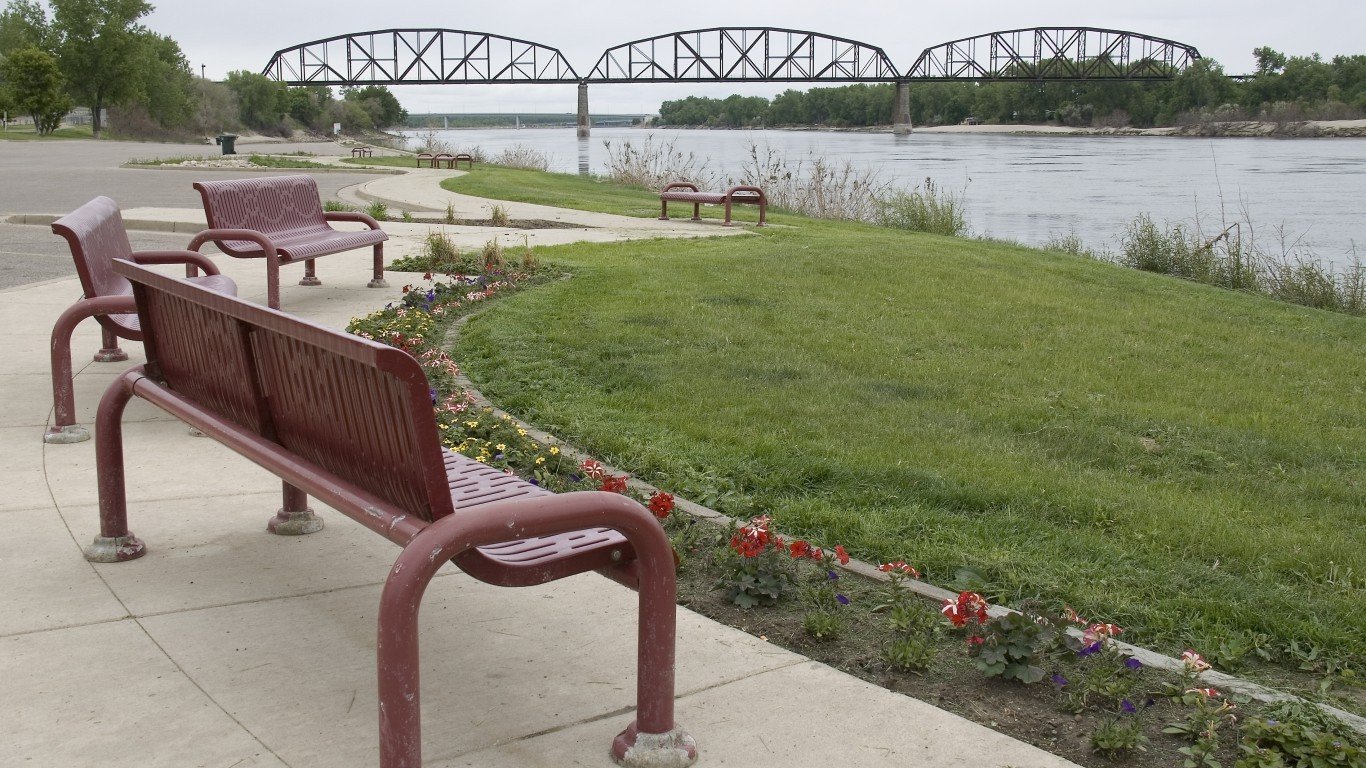
39. North Dakota
> Violent crime rate: 239.4 per 100,000 (10th lowest)
> Murder rate: 2.8 per 100,000 (13th lowest)
> Median household income: $60,557 (16th highest)
> May unemployment rate: 2.5% (2nd lowest)
Over the past decade, an oil boom in North Dakota has led to increased economic activity and population throughout the state. While areas with greater wealth and prosperity tend to have less crime, the income growth in North Dakota has led to a substantial increase in both violent and property-related offenses. Drug use and arrests have risen, and there were 21 homicides reported in 2015 — the most since 1993.
Despite the spike in crime, North Dakota is still among the safest U.S. states. There were 239 violent crimes per 100,000 state residents in total in 2015, far less than the national rate of 373 incidents per 100,000 Americans. The state’s prison population is also relatively small. Roughly 423 in every 100,000 North Dakotans is in a state prison, approximately 70% of the U.S. incarceration rate.

38. Washington
> Violent crime rate: 284.4 per 100,000 (17th lowest)
> Murder rate: 2.9 per 100,000 (14th lowest)
> Median household income: $64,129 (10th highest)
> May unemployment rate: 4.5% (17th highest)
Washington state is more peaceful than the country as a whole and is one of the most peaceful states in the Western United States. There were only 284 violent crimes for every 100,000 state residents in 2015 compared to 373 incidents per 100,000 people nationwide.
Less violent states tend to have higher levels of educational attainment, and Washington is no exception. Some 34.2% of adults in the state have at least a bachelor’s degree, and 90.8% have at least a high school diploma — each above the corresponding national shares of 30.6% and 87.1% respectively.

37. Oregon
> Violent crime rate: 259.8 per 100,000 (14th lowest)
> Murder rate: 2.5 per 100,000 (10th lowest)
> Median household income: $54,148 (25th lowest)
> May unemployment rate: 3.6% (15th lowest)
There were 99 homicides in Oregon in 2015 — or 2.5 murders per 100,000 residents, among the lowest of all states.
A number of socioeconomic measures, including educational attainment rates and job availability, are tied to less violence in a given geography. Some 32.2% of adults in Oregon have at least a bachelor’s degree, and 90.0% have at least a high school diploma — each above the respective national shares of 30.6% and 87.1%. Additionally, only 3.6% of Oregon’s workforce are out of a job, a considerably smaller share than the 4.3% U.S. unemployment rate.
[in-text-ad-2]

36. New York
> Violent crime rate: 379.7 per 100,000 (23rd highest)
> Murder rate: 3.1 per 100,000 (15th lowest)
> Median household income: $60,850 (15th highest)
> May unemployment rate: 4.4% (20th highest)
Approximately 40% of the New York state population lives in New York City, where 586 violent crimes were reported per 100,000 residents in 2015 — far more than the 373 incidents per 100,000 Americans reported nationwide. Across the state, however, the violent crime rate is roughly in line with the nation as a whole. There were 380 violent crimes reported in the state per 100,000 residents.
Like a number of states, New York’s prison population has declined in recent years as the result of reduced crime and criminal justice reform policies that reclassify some non-violent felonies as misdemeanors. Today, 383 in every 100,000 New Yorkers are in state prison, the second lowest incarceration rate of any state where violent crime per capita exceeds the U.S. as a whole.

35. Idaho
> Violent crime rate: 215.6 per 100,000 (5th lowest)
> Murder rate: 1.9 per 100,000 (7th lowest)
> Median household income: $48,275 (11th lowest)
> May unemployment rate: 3.2% (13th lowest)
Idaho has one of the lowest murder rates of any state in the country. There were 1.9 murders for every 100,000 people in the state in 2015, less than half the murder rate across the country as a whole.
Guns are, more often than not, the weapon used in homicides across Idaho. An estimated 80% of murders in the state were carried out with a firearm, the fifth largest share in the country. The disproportionately high share of firearm-related homicides may be explained by their relative availability. Some 56.9% of state residents belong to a household with a gun, well above the 29.1% gun ownership rate nationwide.
[in-text-ad]

34. Nebraska
> Violent crime rate: 274.9 per 100,000 (15th lowest)
> Murder rate: 3.3 per 100,000 (18th lowest)
> Median household income: $54,996 (24th highest)
> May unemployment rate: 2.9% (6th lowest)
Positive economic conditions can be a bellwether for lower violent crime rates. In Nebraska, only 2.9% of the workforce is out of a job, and 12.6% of the population lives below the poverty line, each below the 4.3% and 14.7% corresponding national rates. Favorable economic conditions likely play a role in Nebraska’s relatively low violent crime rate. There were 275 violent crimes reported per 100,000 state residents in 2015, far less than the national rate of 373 incidents per 100,000 Americans and one of the lower violent crime rates of any state.

33. Wyoming
> Violent crime rate: 222.1 per 100,000 (8th lowest)
> Murder rate: 2.7 per 100,000 (11th lowest)
> Median household income: $60,214 (17th highest)
> May unemployment rate: 4.1% (25th lowest)
A relatively low incidence of rape and the nation’s lowest robbery rate contribute to a low overall violent crime rate in Wyoming. There were only 222 incidents of violent crime per 100,000 state residents in 2015, one of the lowest such rates of all states.
While the state’s violent crime rate is relatively low, a far larger than typical share of Wyoming households feel the need to own a gun. Wyoming is one of only six states nationwide where over half of all households own a gun. The presence of a gun can lead to its misuse, and each year, there are about 15 suicides carried out with a firearm for every 100,000 state residents, the most of any state.

32. Colorado
> Violent crime rate: 321.0 per 100,000 (23rd lowest)
> Murder rate: 3.2 per 100,000 (16th lowest)
> Median household income: $63,909 (11th highest)
> May unemployment rate: 2.3% (the lowest)
In Colorado, 39.2% of adults have at least a bachelor’s degree, and just 2.3% of the labor force is unemployed — the second highest educational attainment rate and the lowest unemployment rate in the country. While economic opportunity often leads to lower crime rates, there were 321 violent crimes and 2,642 property crimes reported per 100,000 Colorado residents in 2015, roughly in line with the corresponding national rates. The state’s crime rate is partially driven by the Pueblo metropolitan area, where rising drug use and gang violence has led to a sharp increase in crime in the past several years.
Like a number of states, Colorado has partially reduced its prison population in recent years through a number of parole reform policies aimed at lowering its high recidivism rate. Today, 583 in every 100,000 Colorado residents are in state prison, similar to the national incarceration rate of 607 inmates per 100,000 Americans.
[in-text-ad-2]

31. Virginia
> Violent crime rate: 195.6 per 100,000 (3rd lowest)
> Murder rate: 4.6 per 100,000 (24th highest)
> Median household income: $66,262 (8th highest)
> May unemployment rate: 3.8% (18th lowest)
Low violent crime rates are often correlate with high educational attainment rates and positive economic conditions. Some 37.0% of adults in Virginia have at least a bachelor’s degree, and the state has one of the highest median household incomes and one of the lowest poverty rates among all states. Virginia is also one of only four states with a violent crime rate below 200 incidents per 100,000 people.
However, Virginia also has a relatively high incarceration rate, and a larger than typical share of suicides in the state are carried out with a firearm.
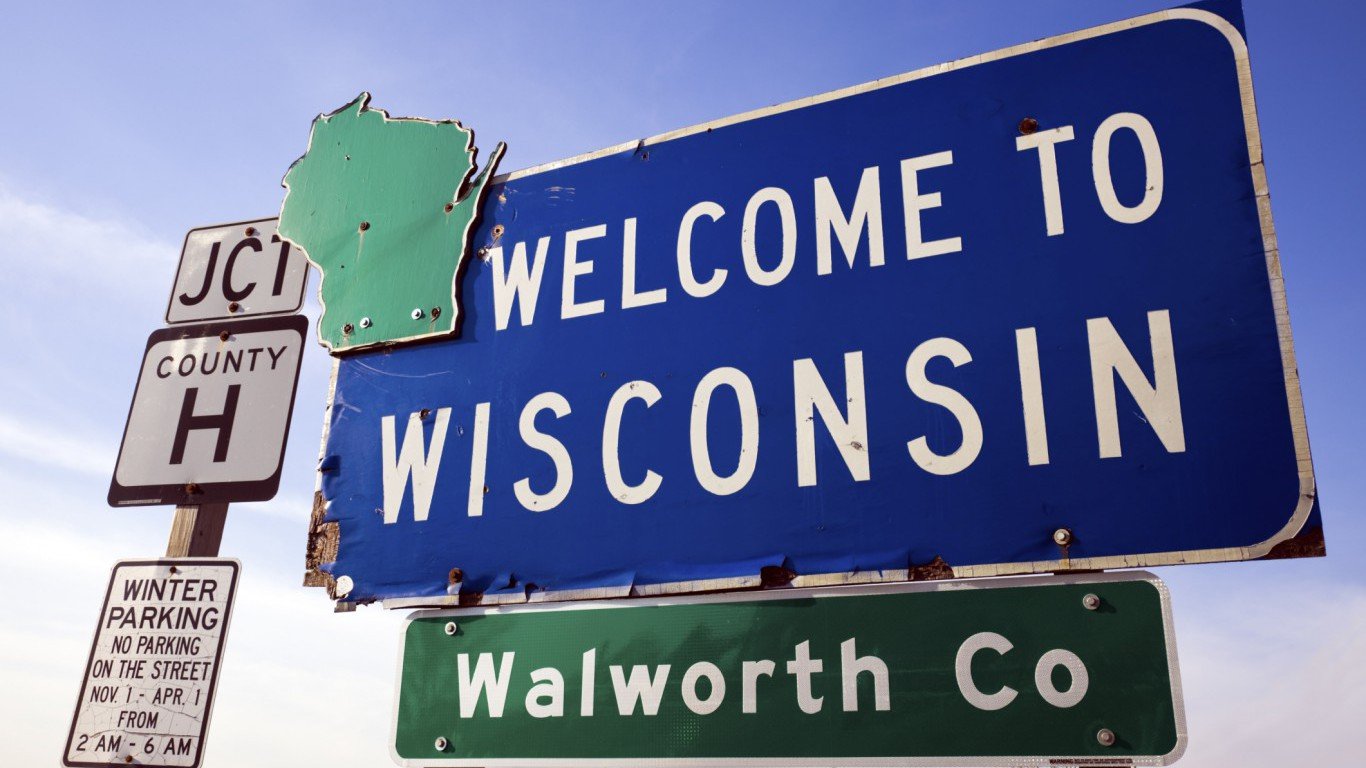
30. Wisconsin
> Violent crime rate: 305.8 per 100,000 (21st lowest)
> Murder rate: 4.2 per 100,000 (23rd lowest)
> Median household income: $55,638 (23rd highest)
> May unemployment rate: 3.1% (9th lowest)
There were 306 violent crimes reported in Wisconsin per 100,000 residents, less than the national rate of 373 incidents per 100,000. The state does not have as many dangerous large urban areas, which tend to drive up crime rates across states. While the Milwaukee-Waukesha-West Allis metropolitan area is one of the most dangerous cities in the U.S., the violent crime in the rest of the state’s metro areas is a combined 185 incidents per 100,000 residents, less than half the national rate.
Unlike the United States as a whole, Wisconsin’s prison population has been increasing in recent years and is set to reach a record size by 2019. Today, 606 in every 100,000 Wisconsin residents are incarcerated in a state prison, in line with the national incarceration rate.
[in-text-ad]

29. Ohio
> Violent crime rate: 291.9 per 100,000 (19th lowest)
> Murder rate: 4.3 per 100,000 (24th lowest)
> Median household income: $51,075 (17th lowest)
> May unemployment rate: 4.9% (7th highest)
As is the case in many states, violent crime and homicides are largely confined to major cities in Ohio. Toledo is the most dangerous city the state and one of the most dangerous in the country, with some 1,129 violent crimes reported for every 100,000 residents. Cities like Dayton and Cincinnati also have violent crime rates that are well more than double the U.S. violent crime rate of 373 incidents per 100,000. Across the state, about 9 in every 10 violent crimes take place in a metropolitan area.
Balanced out by lower incidences outside of major urban centers, the violent crime across Ohio as a whole is not especially high. At 292 incidents per 100,000 people, violent crime is less common in Ohio than in most other states.
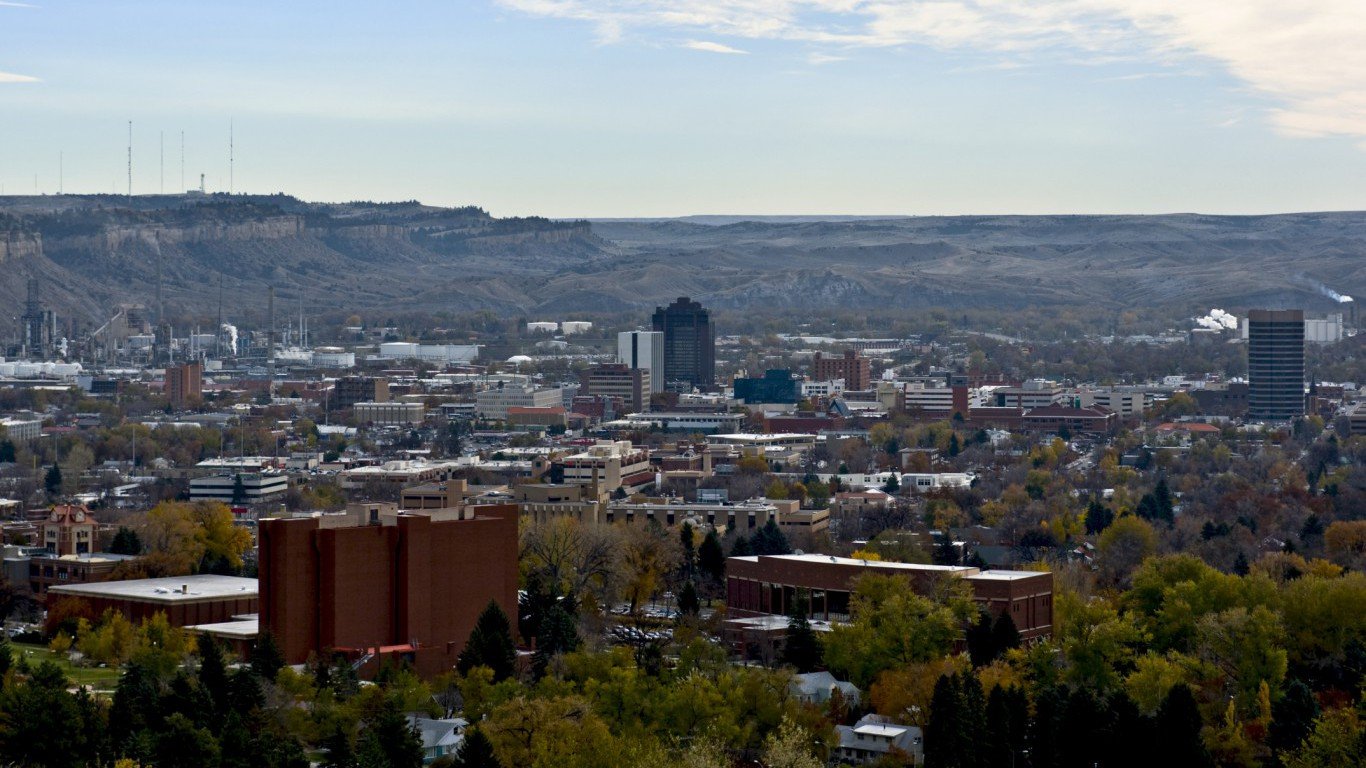
28. Montana
> Violent crime rate: 349.6 per 100,000 (25th highest)
> Murder rate: 3.5 per 100,000 (19th lowest)
> Median household income: $49,509 (14th lowest)
> May unemployment rate: 3.9% (20th lowest)
Higher educational attainment rates typically line up with lower violent crime rates. In Montana, about 94% of adults have graduated from high school, the largest share among states. Still, the state’s violent crime rate of 350 incidents per 100,000 is only slightly below the U.S. rate of 373 per 100,000.
Despite less violent crime per capita, a relatively large share of state residents feels the need to have a gun in the house. Some 52.3% of state residents live in households with a firearm, the sixth highest gun ownership rate of all states.
27. West Virginia
> Violent crime rate: 337.9 per 100,000 (24th lowest)
> Murder rate: 3.8 per 100,000 (21st lowest)
> Median household income: $42,019 (3rd lowest)
> May unemployment rate: 4.5% (17th highest)
West Virginia is about average compared to the rest of the country when it comes to violent crime and murder rates. The state, however, has an issue with suicide, particularly suicide with a gun. The state has the fifth highest annual firearm suicide rate among all states, at 10.8 self-inflicted gun deaths per 100,000 residents.
Higher gun suicide rates tend to occur in states with higher gun ownership, and in West Virginia, more than half of all individuals live in a household where a firearm is present, the fourth largest share of any state. While West Virginians are more likely to commit suicide with a gun, firearms tend to be less involved in murders in the state. Only about half of all homicides in the state involve a gun, one of the smaller shares nationwide.
[in-text-ad-2]

26. South Dakota
> Violent crime rate: 383.1 per 100,000 (22nd highest)
> Murder rate: 3.7 per 100,000 (20th lowest)
> Median household income: $53,017 (23rd lowest)
> May unemployment rate: 2.9% (6th lowest)
South Dakota’s violent crime rate of 383 incidents per 100,000 people is roughly in line with the corresponding national rate. Though the state has a slightly higher gun ownership rate than the nation as a whole, only 44% of all homicides in South Dakota were carried out with a firearm, a smaller share than in all but two other states.
As is the case nationwide, aggravated assault drives South Dakota’s violent crime rate. However, rape contributes more than the typical share to overall violent crime in the state. There were 58 rapes for every 100,000 people in the state in 2015, more than in all but six other states.

25. California
> Violent crime rate: 426.3 per 100,000 (13th highest)
> Murder rate: 4.8 per 100,000 (22nd highest)
> Median household income: $64,500 (9th highest)
> May unemployment rate: 4.7% (13th highest)
California has one of the higher violent crime rates in the country, with 427 reported murders, rapes, robberies and aggravated assaults per 100,000 people. However, the state’s violence is far from evenly distributed across its area. In fact, about 98% of the state’s murders and violent crimes occur in the state’s major metropolitan areas — such as Stockton-Lodi, one of the most dangerous metro areas in the country.
While violent crime is high, suicide, a form of violence, is relatively uncommon in the Golden State. About 10.5 suicides occur in the state annually per 100,000 residents, fewer than in all but six other states.
[in-text-ad]

24. Illinois
> Violent crime rate: 383.8 per 100,000 (21st highest)
> Murder rate: 5.8 per 100,000 (14th highest)
> Median household income: $59,588 (18th highest)
> May unemployment rate: 4.6% (16th highest)
When it comes to violence in the United States, many Americans may immediately think of Chicago, a city plagued by gun violence. Every two and a half hours someone is shot in Chicago — and year-to-date, 336 people have been shot to death in the city. Indeed, about 94% of all homicides in the state occur in major metropolitan areas.
However, as a whole, Illinois closely resembles the nation. The state’s violent crime rate of 384 incidents per 100,000 is only slightly higher than the U.S. violent crime rate. Additionally, only 26.2% of Illinois residents belong to households that own a firearm, one of the lower shares among all states.

23. North Carolina
> Violent crime rate: 347.0 per 100,000 (25th lowest)
> Murder rate: 5.1 per 100,000 (18th highest)
> Median household income: $47,830 (10th lowest)
> May unemployment rate: 4.5% (17th highest)
A perfectly peaceful state would not have a need for police officers — and North Carolina has a relatively large police force. There are about 341 law enforcement employees for every 100,000 state residents, more than in all but five other states.
Despite the high share of state residents working in law enforcement, violent crime as a whole is slightly less common in the state than it is across the nation as a whole. Homicide, however, is slightly more common in North Carolina. There were 5.1 murders in the state for every 100,000 people in 2015 compared to 4.9 murders per 100,000 nationwide.

22. Kentucky
> Violent crime rate: 218.7 per 100,000 (7th lowest)
> Murder rate: 4.7 per 100,000 (23rd highest)
> Median household income: $45,215 (5th lowest)
> May unemployment rate: 5.0% (5th highest)
Kentucky’s violent crime rate of 219 incidents per 100,000 residents is one of the lowest in the country. Despite its low violent crime rate, Kentucky is not ranked among the most peaceful states.
This is in part because of the state’s high firearm ownership as well as a high incarceration rates. There are over 760 people imprisoned in the state per 100,000 people, ninth highest among states. Firearms ownership is relatively high in the state, and guns account for about two-thirds of Kentucky suicides. Nationwide, guns are involved in about half of all suicides.
[in-text-ad-2]

21. Kansas
> Violent crime rate: 389.9 per 100,000 (19th highest)
> Murder rate: 4.4 per 100,000 (25th lowest)
> Median household income: $53,906 (24th lowest)
> May unemployment rate: 3.7% (17th lowest)
A slightly higher than typical share of Kansas residents, at 32.2%, live in gun-owning households. Perhaps due in part to their increased prevalence, guns are involved in a majority of murders in Kansas. Some 73% of homicides in the state are carried out with a firearm, a larger share than in all but a dozen other states. Still, murder is slightly less common in Kansas than it is across the United States. There were 4.4 homicides in the state for every 100,000 residents in 2015 compared to 4.9 murders per 100,000 people nationwide.

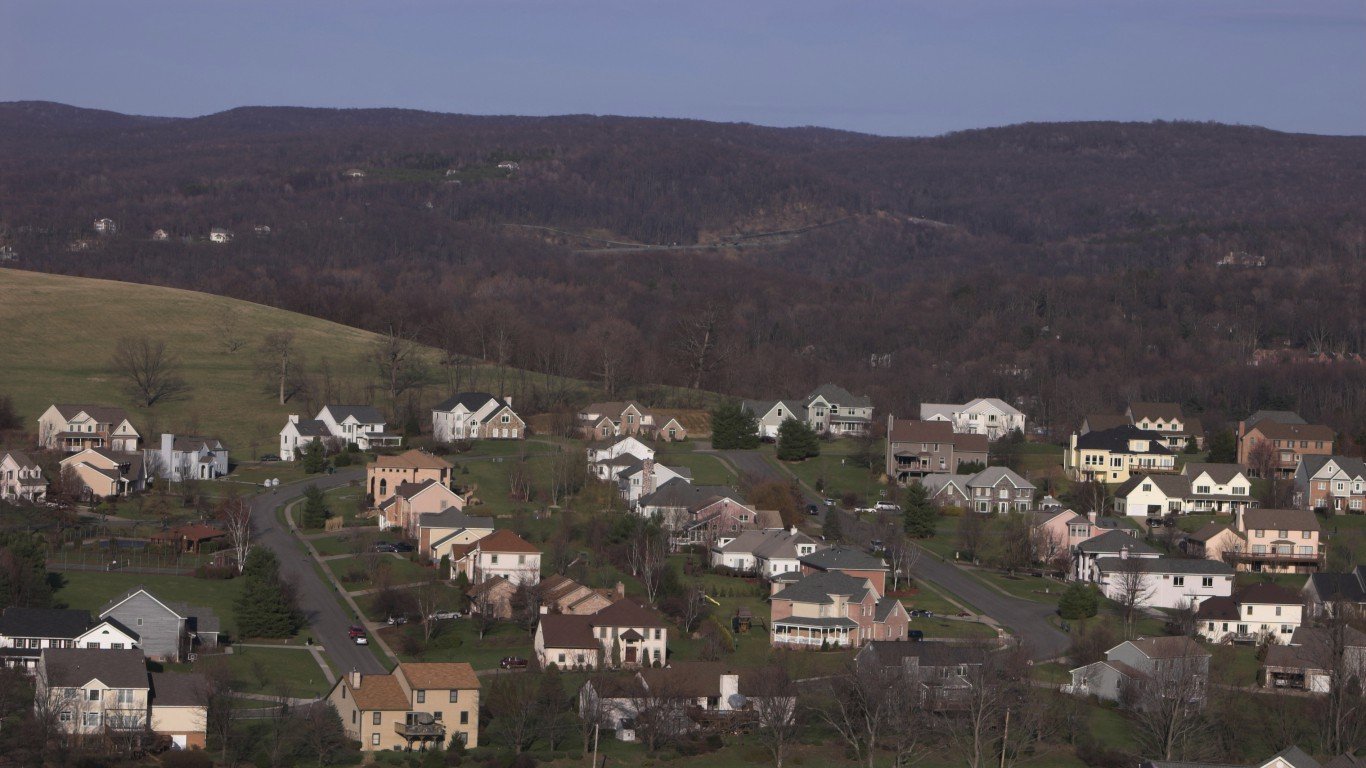
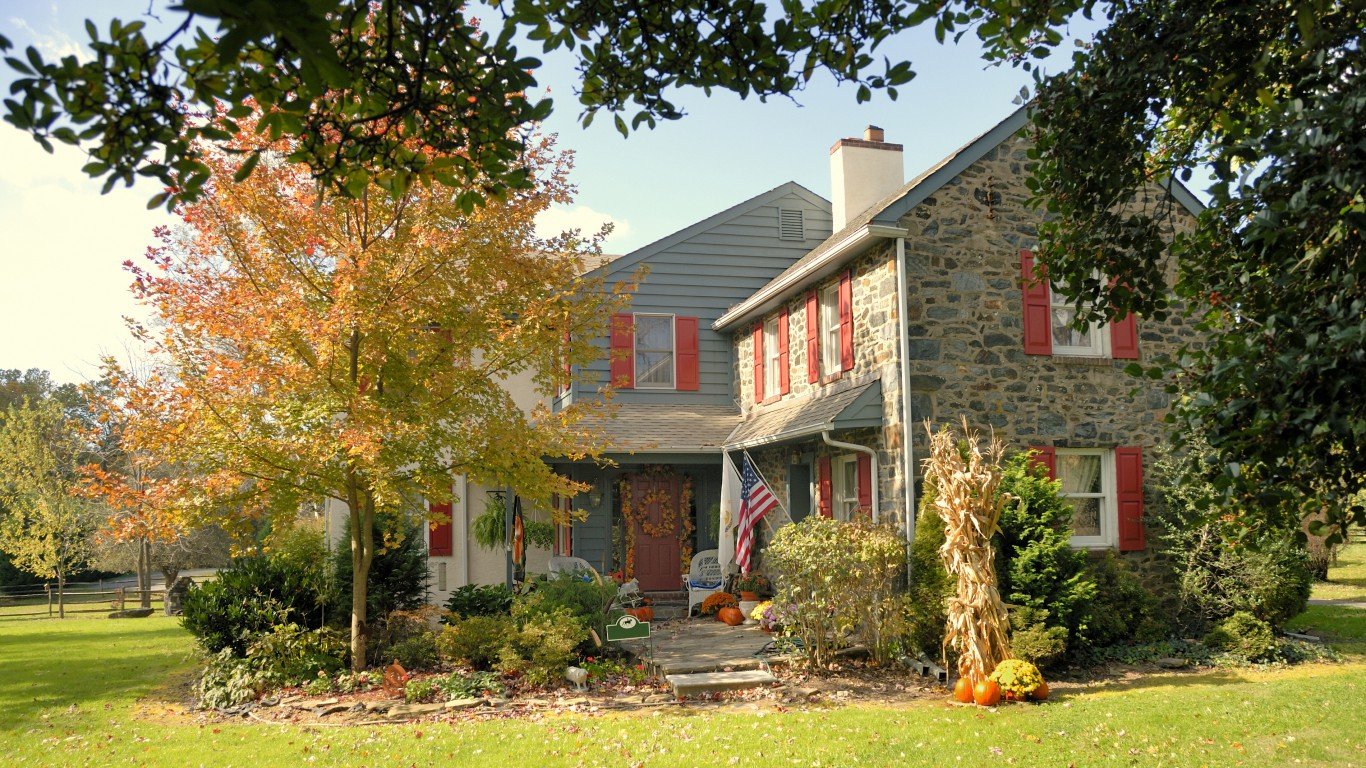
20. Pennsylvania
> Violent crime rate: 315.1 per 100,000 (22nd lowest)
> Murder rate: 5.1 per 100,000 (19th highest)
> Median household income: $55,702 (21st highest)
> May unemployment rate: 5.0% (5th highest)
Although Pennsylvania’s gun ownership and violent crime rates are lower than the corresponding nationwide rates, the state is not among the most peaceful in the nation. It is the high incidence of homicide and incarceration that largely make the state a more violent place than most.
Some 655 people are in state prison for every 100,000 Pennsylvania residents compared to a nationwide incarceration rate of 607 inmates per 100,000 Americans. Additionally, there were 5.1 murders for every 100,000 people in the state in 2015, slightly higher than the 4.9 per 100,000 U.S. homicide rate.
[in-text-ad]

19. Michigan
> Violent crime rate: 415.5 per 100,000 (15th highest)
> Murder rate: 5.8 per 100,000 (15th highest)
> Median household income: $51,084 (18th lowest)
> May unemployment rate: 4.2% (23rd highest)
Michigan has the 15th highest violent crime rate and the 15th highest murder rate across all 50 states. As is the case nationwide, the vast majority of violence — about 9 in every 10 cases — occurs in the state’s metropolitan areas. The state’s violent crime rate is 416 incidents per 100,000 residents. However, in the metropolitan areas of Flint and Saginaw the violent crime rates are 580 and 606 incidents per 100,000 people. Detroit has the second highest violent crime rate of any U.S. city, with a whopping 1,760 incidents per 100,000 residents.
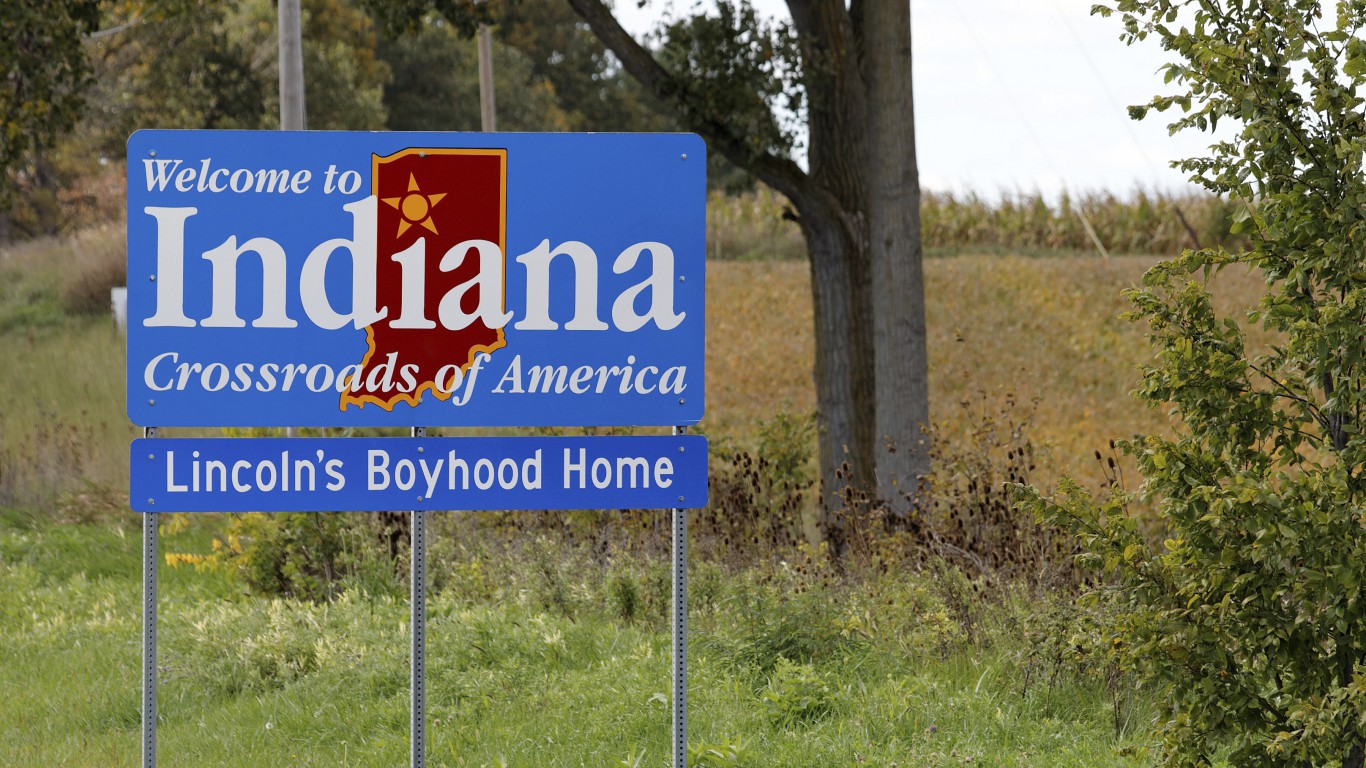
18. Indiana
> Violent crime rate: 387.5 per 100,000 (20th highest)
> Murder rate: 5.6 per 100,000 (16th highest)
> Median household income: $50,532 (16th lowest)
> May unemployment rate: 3.2% (13th lowest)
About 1 in 3 Indiana residents live in a gun-owning household, one the higher shares of all states. As is the case in many of the states that report a higher than average gun ownership rate, guns are more likely to be used in both homicides and suicides in Indiana. More than 3 in every 4 murders in the state are carried out with a firearm, the tenth highest share among all states. Additionally, 53.7% of all suicides involve a firearm compared to the corresponding national share of 50.7%.
Indianapolis, the state’s capital and largest city, is one of the most dangerous of U.S. metro areas. There were 675 violent crimes per 100,000 people in Indianapolis in 2015, well above the 373 per 100,000 U.S. violent crime rate.

17. Arizona
> Violent crime rate: 410.2 per 100,000 (17th highest)
> Murder rate: 4.5 per 100,000 (25th highest)
> Median household income: $51,492 (20th lowest)
> May unemployment rate: 5.1% (4th highest)
With about 800 of every 100,000 state residents imprisoned, Arizona has one of the highest incarceration rates in the country. The high incarceration rate is likely mostly due to both the state’s high non-violent crime rate, and the above average violent crime rate.
While it is not necessarily the case that high levels of law enforcement are indicative of higher violence, Arizona has one of the largest police forces among states, with 332 law enforcement workers per 100,000 people.
[in-text-ad-2]

16. Texas
> Violent crime rate: 412.2 per 100,000 (16th highest)
> Murder rate: 4.8 per 100,000 (21st highest)
> Median household income: $55,653 (22nd highest)
> May unemployment rate: 4.8% (12th highest)
Some 3,203 people were killed by firearms in Texas in 2015, more than in any other state. The likelihood of gun deaths, accidental or otherwise, rises with the availability of guns. Nearly 36% of residents in the Lone Star State live in gun owning households, a larger share than the 29.1% national gun ownership rate. Across Texas, 58% of suicides and 71% of homicides are carried out with firearms, each among the larger shares of any state.
As is the case nationwide, approximately 9 in every 10 violent crimes in Texas occur in major metropolitan areas. In both the Lubbock and Odessa metro areas, there are more than twice as many violent crimes per capita than in the U.S. as a whole.
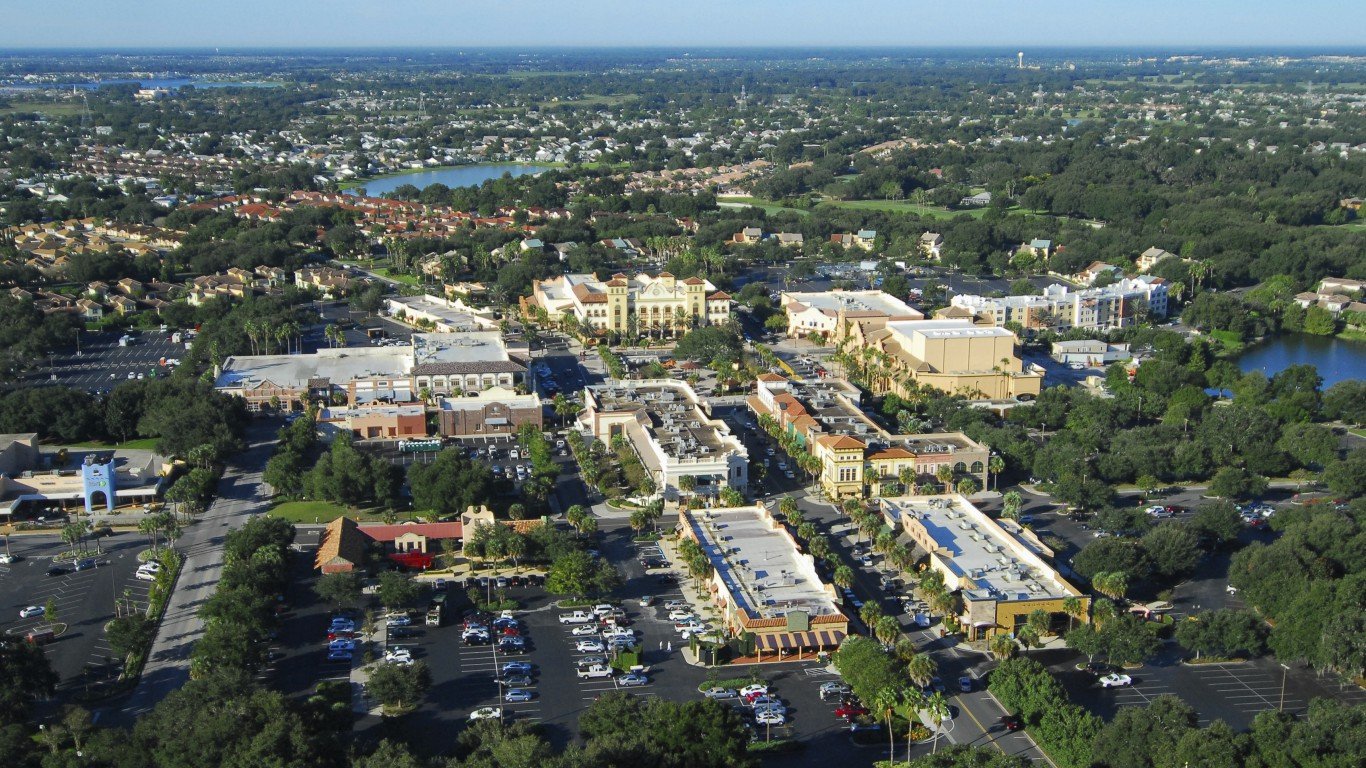
15. Florida
> Violent crime rate: 461.9 per 100,000 (11th highest)
> Murder rate: 5.1 per 100,000 (20th highest)
> Median household income: $49,426 (13th lowest)
> May unemployment rate: 4.3% (21st highest)
Some 96.1% of murders and all other violent crimes in Florida occur in major metropolitan areas. The Tallahassee metro area’s violent crime rate of 769 incidents per 100,000 residents is more than double the U.S. violent crime rate.
A high incarceration rate further solidifies Florida’s status as a more violent state. There are about 755 people in Florida prisons for every 100,000 residents, one of the higher shares of all states and well above the 607 inmates per 100,000 U.S. rate.
[in-text-ad]

14. Maryland
> Violent crime rate: 457.2 per 100,000 (12th highest)
> Murder rate: 8.6 per 100,000 (3rd highest)
> Median household income: $75,847 (the highest)
> May unemployment rate: 4.2% (23rd highest)
Following riots triggered by the death of Freddie Gray while in police custody, 2015 was a record year for murder in Baltimore, Maryland’s largest city. Baltimore high homicide rate drove the state’s murder rate significantly higher. There were 8.6 homicides in Maryland for every 100,000 residents in 2015, the third highest murder rate of all states.
Unlike most relatively violent states, gun ownership is not especially common in Maryland. Only 20.7% of people in the state live in households that own firearms, well below the 29.1% U.S. gun ownership rate.

13. Georgia
> Violent crime rate: 378.3 per 100,000 (24th highest)
> Murder rate: 6.0 per 100,000 (12th highest)
> Median household income: $51,244 (19th lowest)
> May unemployment rate: 4.9% (7th highest)
Gun ownership is about as common in Georgia as it is across the country as a whole. An estimated 31.6% of Georgians live in gun-owning households, a slightly larger share than the 29.1% of Americans nationwide. Despite an average gun ownership rate, both suicides and homicides are far more likely to be carried out with a firearm than in most states. Some 64% of all suicides and 82% of murders were committed with a firearm, each among the highest shares compared to all states.
The incarceration rate is also high in state. There are 866 people incarcerated in a state facility for every 100,000 Georgia residents, the fifth highest share of all states.
12. Delaware
> Violent crime rate: 499.0 per 100,000 (8th highest)
> Murder rate: 6.7 per 100,000 (8th highest)
> Median household income: $61,255 (14th highest)
> May unemployment rate: 4.7% (13th highest)
Despite reporting the lowest gun ownership rate in the country, Delaware struggles with gun violence. About 83% of all murders in the state are carried out with firearms, the third largest share of all states. Additionally, there are about 5.5 handgun murders in the state for every 100,000 residents, more than in all but three other states.
Violence can be commonplace in prisons, and a large prison population is a further indication of a violent place. There are about 708 people incarcerated in state facilities for every 100,000 Delaware residents, one of the higher incarceration rates nationwide.
[in-text-ad-2]

11. Arkansas
> Violent crime rate: 521.3 per 100,000 (6th highest)
> Murder rate: 6.1 per 100,000 (11th highest)
> Median household income: $41,995 (2nd lowest)
> May unemployment rate: 3.4% (14th lowest)
An estimated 19.1% of Arkansas residents live in poverty, the fourth largest share in the country. While the relationship between income and violence is complicated, individuals in households below the poverty line are more than twice as likely to be victims of violent crime as residents of high-income households. There were 521 violent crimes reported per 100,000 Arkansas residents in 2015, far more than the national rate of 373 incidents per 100,000 Americans and the sixth most of any state.
Guns cause more deaths in Arkansas than in most states. In 2015, 16.9 in every 100,000 Arkansas residents were mortally wounded by a firearm, more than in all by 10 other states. Arkansas has the second highest gun ownership rate of any state.

10. Oklahoma
> Violent crime rate: 422.0 per 100,000 (14th highest)
> Murder rate: 6.0 per 100,000 (13th highest)
> Median household income: $48,568 (12th lowest)
> May unemployment rate: 4.3% (21st highest)
There were 422 violent crimes per 100,000 residents in Oklahoma in 2015, significantly more than the national rate of 373 incidents per 100,000 Americans. One of the most dangerous states in the country, Oklahoma also has one of the largest prison populations. The Bureau of Justice Statistics estimates that 1,015 in every 100,000 Oklahomans are incarcerated in state prisons, the highest rate in Oklahoma history and the second highest rate of any U.S. state.
A number of dangerous cities in Oklahoma drive up the state’s crime rate. In each of the state’s three metropolitan areas — Lawton, Tulsa, and Oklahoma City — the violent crime rate exceeds the national rate. In the Lawton metro area, there were 747 violent crimes per 100,000 residents in 2015, the 15th most of any U.S. city.
[in-text-ad]

9. Mississippi
> Violent crime rate: 275.8 per 100,000 (16th lowest)
> Murder rate: 8.7 per 100,000 (2nd highest)
> Median household income: $40,593 (the lowest)
> May unemployment rate: 4.9% (7th highest)
Mississippi is one of many poor, rural states in the South among the most violent in the country. An estimated 22.0% of the Mississippi population lives in poverty, the largest share of any state. While the relationship between income and violence is complicated, individuals in households below the poverty line are more than twice as likely to be victims of violent crime as residents of high-income households. Despite a low overall violent crime rate, there were 8.7 homicides reported per 100,000 residents in Mississippi in 2015, the second most of any state.
Guns factor into violence more in Mississippi than in nearly any other state. Firearms are the cause of death in 69.4% of all suicides in the state, the largest share nationwide. Overall, approximately 20 in every 100,000 Mississippi residents were mortally wounded by a firearm in 2015, the third highest ratio of any state.
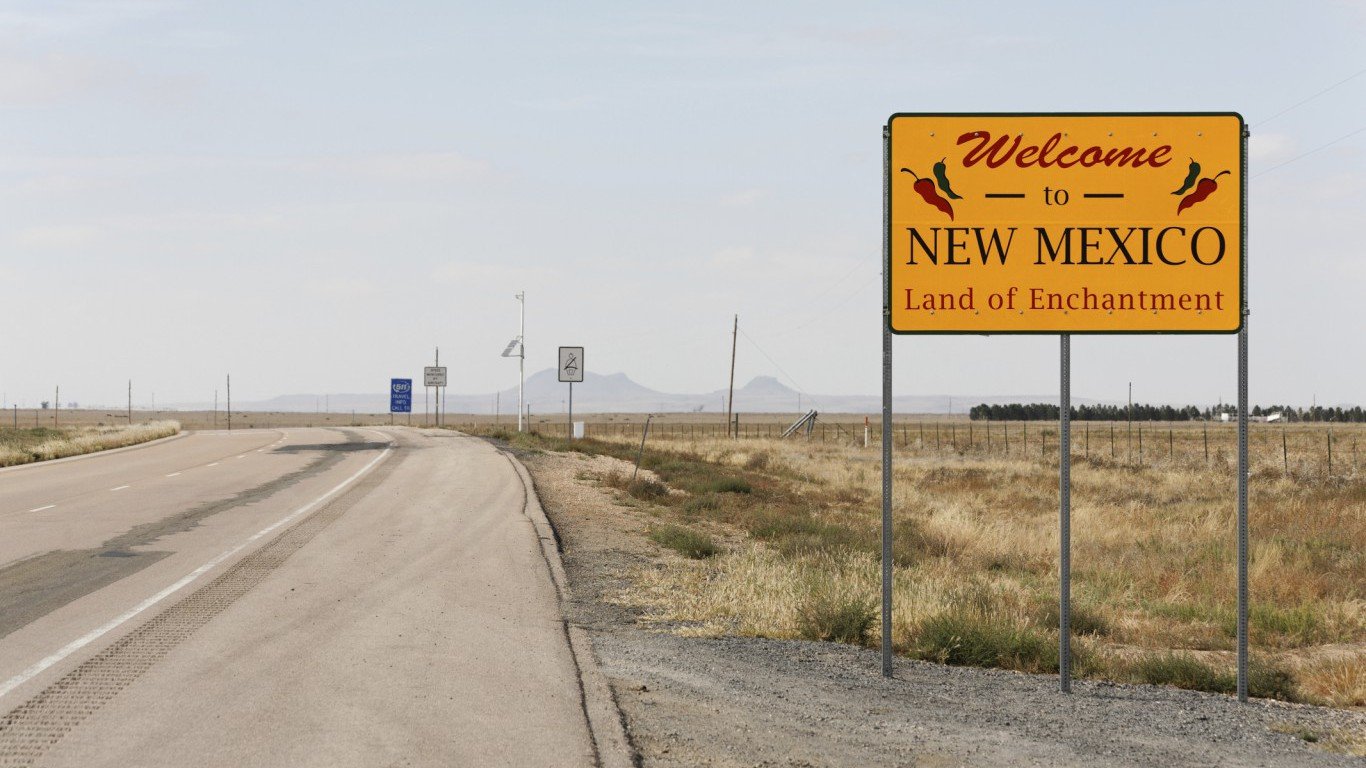
8. New Mexico
> Violent crime rate: 656.1 per 100,000 (3rd highest)
> Murder rate: 5.6 per 100,000 (17th highest)
> Median household income: $45,382 (6th lowest)
> May unemployment rate: 6.6% (2nd highest)
States with favorable economic conditions tend to be relatively peaceful. In New Mexico, the poor economy is likely closely tied to the high prevalence of violence. Some 6.6% of the state’s labor force is out of a job, and 20.4% of the population lives in poverty, each the second largest share of any state.
There were 656 violent crimes for every 100,000 residents in New Mexico last year, the third highest violent crime rate in the country. As is the case in many of the most violent states, guns are relatively common in New Mexico. Roughly half of the state’s residents live in gun owning households, well above the 29% share of Americans nationwide.

7. South Carolina
> Violent crime rate: 504.5 per 100,000 (7th highest)
> Murder rate: 8.1 per 100,000 (5th highest)
> Median household income: $47,238 (8th lowest)
> May unemployment rate: 4.1% (25th lowest)
Some 44.4% of South Carolina’s population lives in gun-owning households, a far larger share than the 29.1% U.S. gun ownership rate. In South Carolina, there are 6.4 handgun murders for every 100,000 people, the highest handgun murder rate in the country after only Missouri and Louisiana.
Firearms are also used to commit a disproportionate share of suicides in South Carolina. About 63.5% of all suicides in the state involve a firearm, higher than in the vast majority of states and the 50.7% comparable U.S. share.
[in-text-ad-2]

6. Missouri
> Violent crime rate: 497.4 per 100,000 (9th highest)
> Murder rate: 8.3 per 100,000 (4th highest)
> Median household income: $50,238 (15th lowest)
> May unemployment rate: 3.9% (20th lowest)
In Missouri, there were about 497 violent crimes for every 100,000 residents in 2015, well above the 373 incidents per 100,000 U.S. violent crime rate. The state’s crime rate is driven in large part by violence in St. Louis. With 1,817 violent crimes per 100,000 people in 2015, St. Louis is the most violent city in both Missouri and the United States.
Across the state, guns present a considerable problem. About 84% of all murders in Missouri are carried out with firearms, the largest share of any state after only Illinois. Additionally, in Missouri, there are 6.9 murders carried out with a handgun for every 100,000 people annually, the second highest handgun murder rate of any state.

5. Tennessee
> Violent crime rate: 612.1 per 100,000 (4th highest)
> Murder rate: 6.2 per 100,000 (10th highest)
> Median household income: $47,275 (9th lowest)
> May unemployment rate: 4.0% (21st lowest)
Aggravated assault is more common in Tennessee than in nearly every other state. There were 452 instances of aggravated assault for every 100,000 Tennessee residents in 2015, the highest share of any state other than Alaska. Driven by aggravated assault, Tennessee has the fourth highest violent crime rate in the country.
As is the case nationwide, violent crime in Tennessee is largely concentrated in major metropolitan areas. Across the broader Memphis metro area, there were 1,041 violent crimes for every 100,000 residents in 2015 — a higher violent crime rate than in all but two other metro areas nationwide.
[in-text-ad]

4. Nevada
> Violent crime rate: 695.9 per 100,000 (2nd highest)
> Murder rate: 6.2 per 100,000 (9th highest)
> Median household income: $52,431 (22nd lowest)
> May unemployment rate: 4.7% (13th highest)
Crime rates are often higher in states with less economic opportunity and lower educational attainment. In Nevada, just 23.6% of adults have a bachelor’s degree, far less than the 30.6% national rate and the sixth least of any state. Additionally, 4.7% of the state’s labor force is unemployed, one of the higher jobless rates of any state. There were 696 violent crimes per 100,000 residents in 2015, the most of any state other than Louisiana.
One of the largest drivers of crime in Nevada are the state’s urban areas. There were 814 violent crimes reported per 100,000 residents in the Las Vegas-Henderson-Paradise metro area in 2015, the eighth most of any U.S. metro area. In total, 96.5% of violent crimes documented by the FBI in Nevada were reported in the state’s metro areas, one of the largest shares of any state.

3. Alabama
> Violent crime rate: 472.4 per 100,000 (10th highest)
> Murder rate: 7.2 per 100,000 (7th highest)
> Median household income: $44,765 (4th lowest)
> May unemployment rate: 4.9% (7th highest)
Alabama is one of many poor Southern states with a high violent crime and incarceration rate. There were 472 violent crimes per 100,000 Alabama residents in 2015, the 10th most of any state. While the state’s prison population has declined slightly in recent years, today 883 in every 100,000 Alabama residents are incarcerated in state prisons, the fourth most nationwide.
Firearms cause more deaths in Alabama than in nearly any other state. While guns are used in 50.7% of all suicides nationwide, in Alabama guns are used in 69.0% of all suicides, the second largest share of any state. Overall, 20 in every 100,000 Alabama residents were mortally wounded by a gun in 2015, the third most firearm victims per capita nationwide.

2. Alaska
> Violent crime rate: 730.2 per 100,000 (the highest)
> Murder rate: 8.0 per 100,000 (6th highest)
> Median household income: $73,355 (3rd highest)
> May unemployment rate: 6.7% (the highest)
Alaska’s violent crime rate of 730 incidents per 100,000 people is the highest of any state and is nearly double the national rate. The FBI Uniform Crime rate includes rape, robbery, aggravated assault, and murder as violent crimes, and the state ranks worst in the country in both aggravated assault and rape. Particularly egregious, the state’s rape rate of 122 reported incidents per 100,000 people is more than triple the U.S. figure.
Potentially related to the state’s high level of violence is the availability of firearms. An estimated 61.7% of Alaska’s households own a gun, the highest share among states. The state also has the highest rate of firearm deaths, accidental or otherwise, per 100,000 people.
[in-text-ad-2]
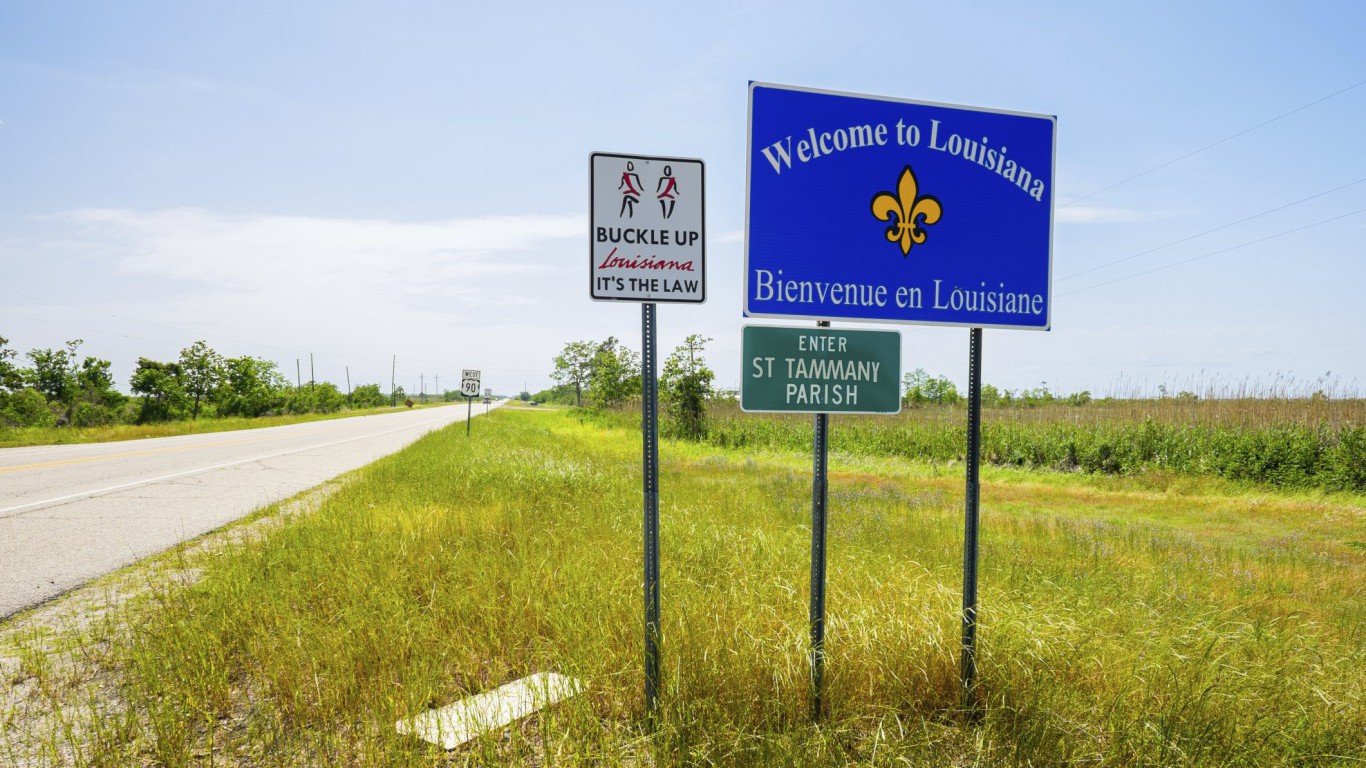
1. Louisiana
> Violent crime rate: 539.7 per 100,000 (5th highest)
> Murder rate: 10.3 per 100,000 (the highest)
> Median household income: $45,727 (7th lowest)
> May unemployment rate: 5.7% (3rd highest)
Louisiana ranks as the most violent state in the country. This is largely due to the state’s nation-leading homicide rate, which at 10.3 murders and incidents of nonnegligent manslaughter per 100,000 people is more than double the national murder rate. Approximately 80% of homicides in the state are carried out with handguns, one of the larger shares of any state. Firearms also account for about two-thirds of all suicides in the state, the third largest share nationwide..
Louisiana’s incarceration rate is also nation-leading, with 1,049 people imprisoned in the state for every 100,000 residents. Louisiana is one of only two states, along with Oklahoma, to have an incarceration rate in excess of 1,000 per 100,000 people.
Detailed Findings:
Violent crimes consist of rape, robbery, aggravated assault, and homicide. The most heavily weighted components of our index were these direct manifestations of violence. The annual murder rate received full weight, as did the annual violent crime rate, excluding murder.
Incarceration rates were also factored into our index, in part because in a perfectly peaceful state there would be no need to send anyone to prison. Additionally, prisons tend to be exceptionally violent places where nonviolent offenders are commonly the targets of violence.
The fourth and final component of our index is the share of suicides carried out with a firearm — a form of manifest violence not captured by the standard violent crime rate. Nearly 43,000 Americans took their own lives in 2014; about half of these cases involved a gun.
Firearm suicide is also a close approximation for the prevalence of guns in each state. While owning a gun is not inherently violent, many Americans buy guns for self defense, and high ownership rates might be indicative of some level of violence in the area. Additionally, the presence of guns greatly increases the likelihood of gun violence — accidental or otherwise. Of the 15 states with the highest gun ownership rates, 14 have a higher firearm fatality rates than the nation as a whole.
Across the United States, about 90% of violent crimes occur in major metropolitan areas even though urban areas are home to only about 80% of the U.S. population. Indeed, high crime rates in many of the most violent states are driven by urban crime. In Louisiana, the most violent state in the country, both Monroe and Alexandria metro areas have violent crime rates that are more than double the U.S. violent crime rate.
One of the strongest determinants of the prevalence of violence or peace in a given state is its economic environment. More violent states tend to be characterized by lower incomes and fewer job opportunities, while more peaceful states are often relatively affluent, with low unemployment.
For example, of the 10 most peaceful states, nine have lower unemployment rates than the 4.3% U.S. figure and nine have a higher annual median income than the $55,775 the typical U.S. household earns. Conversely, of the 10 most violent states, seven have a higher unemployment rate than the U.S. as a whole, and only one has a higher median household income than is typical nationwide.
Education also appears to play a role in the presence of violence on the state level. While nine of the 10 most peaceful states are home to a greater share of college-educated adults than the nation as a whole, in all 10 of the most violent states, educational attainment is lower than is typical nationwide.
Methodology:
To identify the most violent and most peaceful states, 24/7 Wall St. created an index based on four measures. We were inspired by the 2012 United States Peace Index from the Institute for Economics and Peace. We gave full weight in the index to two of the four measures: the number of murders and the number of violent crimes (excluding murder) per 100,000 people, both of which came from the FBI’s 2015 Uniform Crime Report. Incarceration rates, which capture state prisons only, were given a three-quarter weighting and came from the Bureau of Justice Statistics. Firearm suicides as a percent of total suicides are for 2008 through 2014 to adjust for outliers and are from the Centers for Disease Control and Prevention. This was the fourth component of the index, receiving a one-quarter weight. These data sets are frequently based on disparate and inconsistent population totals, so all state rates for the purposes of this index were calculated based on 2015 one-year Census American Community Survey population counts. The annualized suicide and firearm-suicide rates for 2008 to 2014 used the CDC’s population count as the denominator. Data on crime for cities and metropolitan areas also came from the FBI and incorporate the FBI’s population estimates.
In addition to these indexed measures, we reviewed the gun ownership rate in each state as of 2013, obtained from a study published in 2015 by the Mailman School of Public Health at Columbia University. The survey asked state residents whether they live in a household with at least one firearm of any kind.
Poverty rates, median household incomes, and the percentages of adults with at least a high school diploma or with at least a college degree in each state also came from the ACS. Unemployment rates came from the Bureau of Labor Statistics and are seasonally adjusted for May 2017.
Want retirement to come a few years earlier than you’d planned? Or are you ready to retire now, but want an extra set of eyes on your finances?
Now you can speak with up to 3 financial experts in your area for FREE. By simply clicking here you can begin to match with financial professionals who can help you build your plan to retire early. And the best part? The first conversation with them is free.
Click here to match with up to 3 financial pros who would be excited to help you make financial decisions.
Thank you for reading! Have some feedback for us?
Contact the 24/7 Wall St. editorial team.


 24/7 Wall St.
 24/7 Wall St.