Professional sports is big business in the United States. Total revenue across the four major team sport organizations — the MLB, NHL, NBA, and NFL — topped $30 billion in 2015.
Revenue in professional sports comes from a range of channels. While endorsements, advertising, TV deals, and merchandising all factor into team revenue, ticket sales remain important, as both a source of revenue, as well as a gauge of fan loyalty.
Year over year ticket sale changes for a given team are subject to a range of factors. 24/7 Wall St. reviewed 10-year changes in average home game attendance for professional hockey, baseball, basketball, and football teams across North America to identify the teams that are losing the most fans. For 17 teams, average home game attendance declined by more than 10% over the past decade.
Click here to see the sports teams running out of fans.
Click here to read our detailed findings and methodology.
Source: Keith Allison / Wikimedia Commons
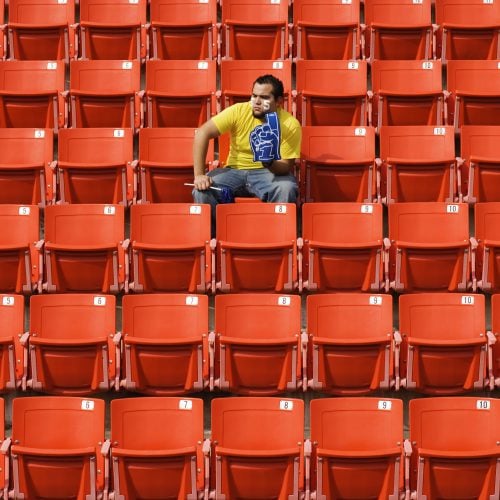
17. Washington Redskins
> 10 yr. attendance change: -10.6%
> Sport: Football
> Avg. home game attendance: 78,304
> Avg. capacity filled: 85.4%
The Washington Redskins are one of two NFL franchises to report a more than 10% decline in attendance between 2006 and 2016. In 2006, coming off a relatively successful season culminating in a divisional game loss to the Seattle Seahawks, FedExField was regularly filled to capacity for home games. In contrast, the stadium was only filled, on average, to about 85% capacity last season. The relative lack of interest in the team this year was punctuated by the preseason release of once-promising quarterback and 2012 offensive rookie of the year award winner, Robert Griffin III. RGIII was at one point expected to be Washington’s savior.
[in-text-ad]
Source: Crash Underride / Wikimedia Commons
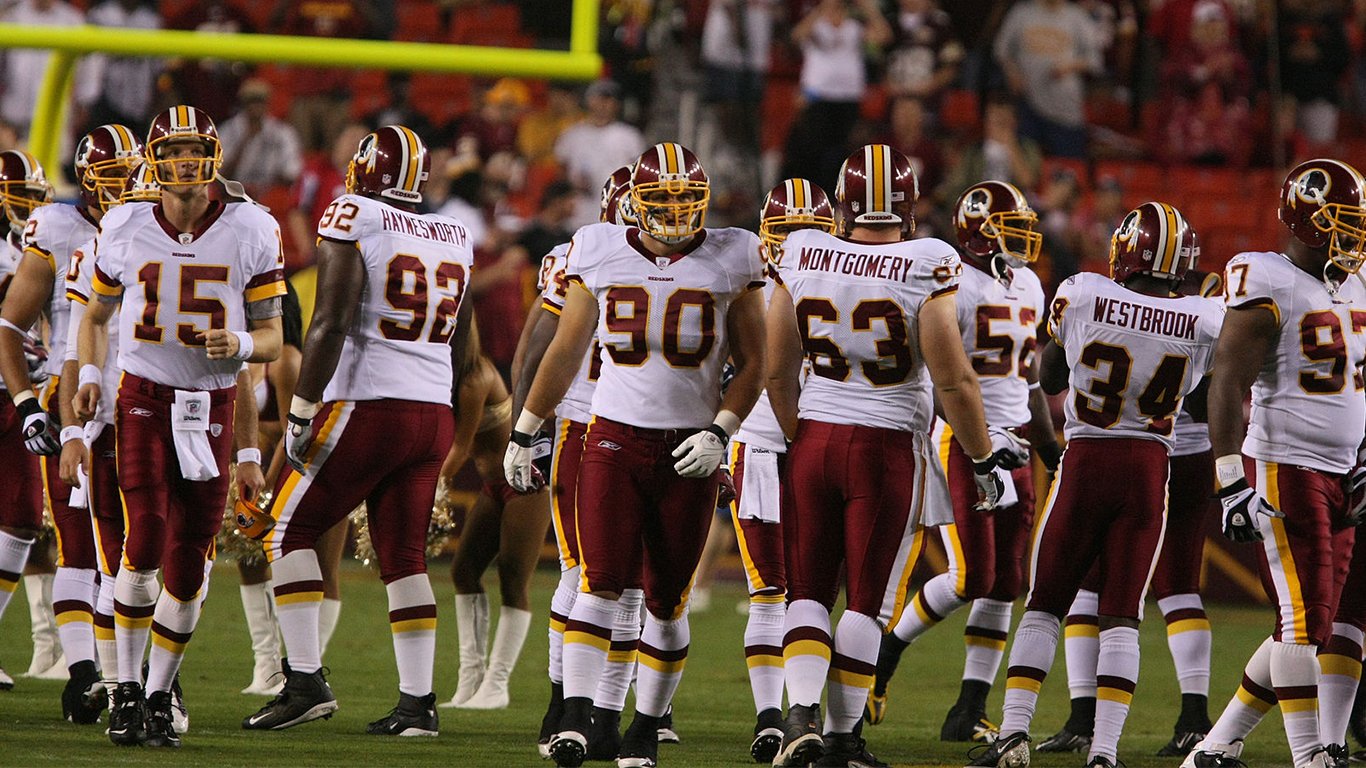
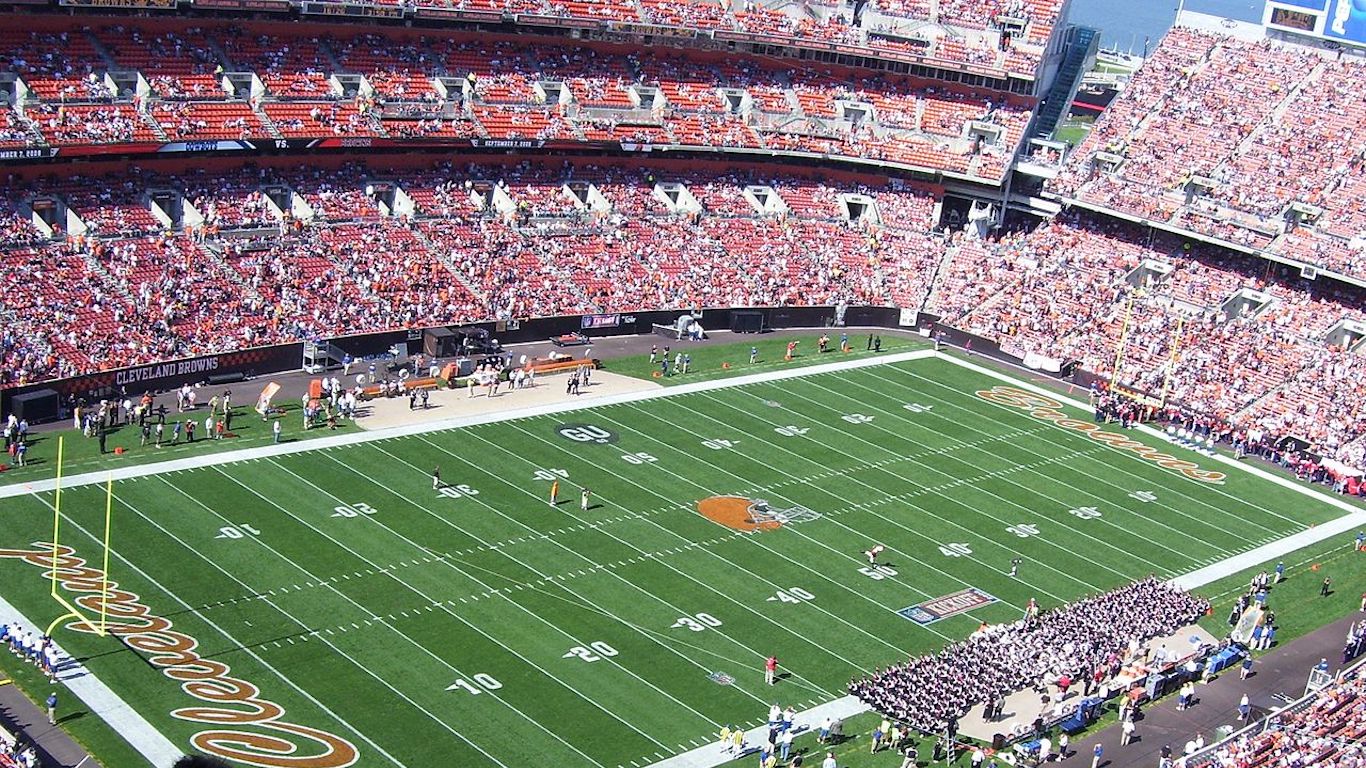
16. Cleveland Browns
> 10 yr. attendance change: -11.1%
> Sport: Football
> Avg. home game attendance: 64,311
> Avg. capacity filled: 87.9%
Coming off the March dismissal of once promising Heisman-winning first-round quarterback pick Johnny Manziel, the Cleveland Browns had trouble filling seats in 2016. The anti-climatic end of Manziel’s disappointing tenure with the team may partially explain why home attendance is down over 11% from 2006. The Browns’ consistently poor record also helps explain generally poor attendance at FirstEnergy Stadium. Over the past 14 seasons, Cleveland has only finished better that dead last in their division twice and the team has only played one playoff game since 1995. FirstEnergy Stadium was only filled to about 88% of its total capacity on average last year.
Source: https://www.flickr.com/photos/redlegsfan21/
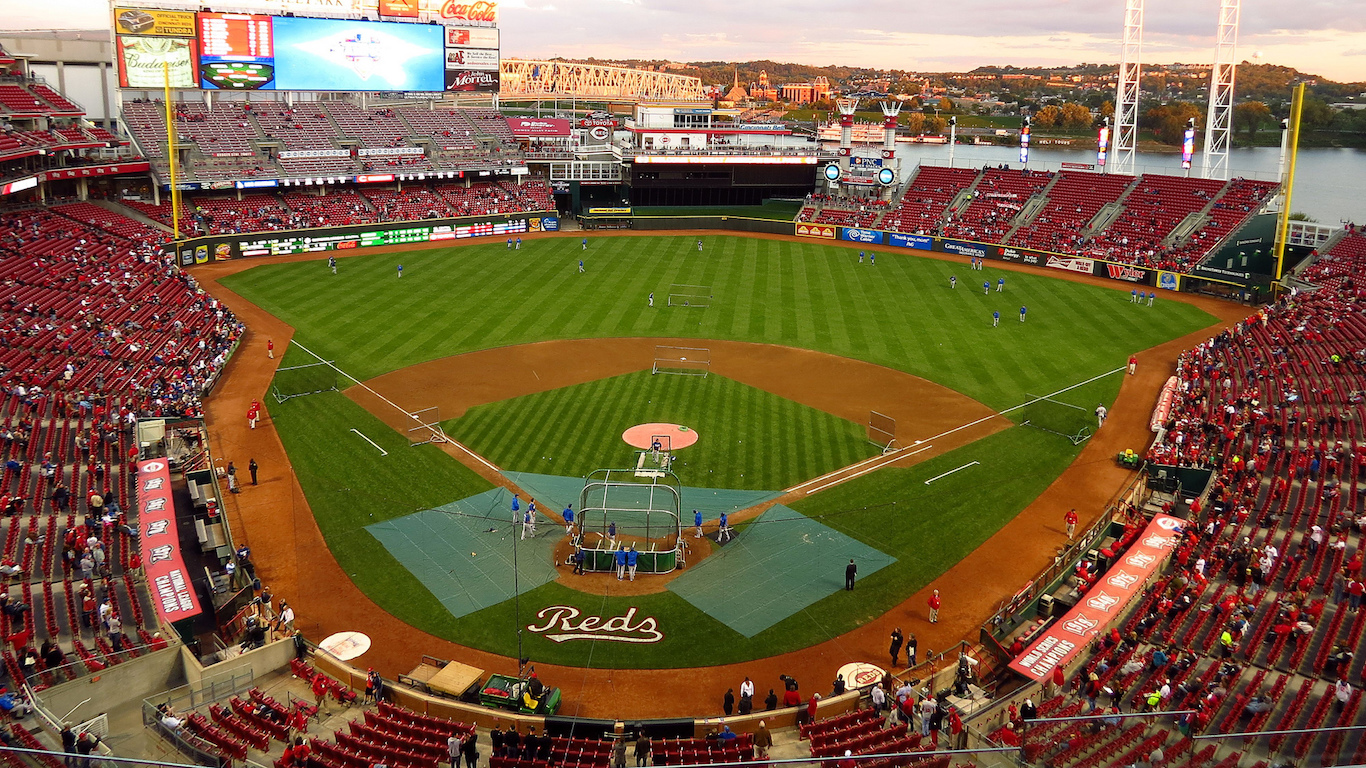
15. Cincinnati Reds
> 10 yr. attendance change: -11.3%
> Sport: Baseball
> Avg. home game attendance: 23,383
> Avg. capacity filled: 55.3%
Home game attendance for the Cincinnati Reds is down 11.3% compared to 2006. Over the last 11 seasons, the team has had three disappointing playoff appearances. The Reds have had losing records in each of the last three seasons, finishing at the bottom of their division in both 2015 and 2016. Currently, the Reds have the worst record in their division and rank third to last in the National League.
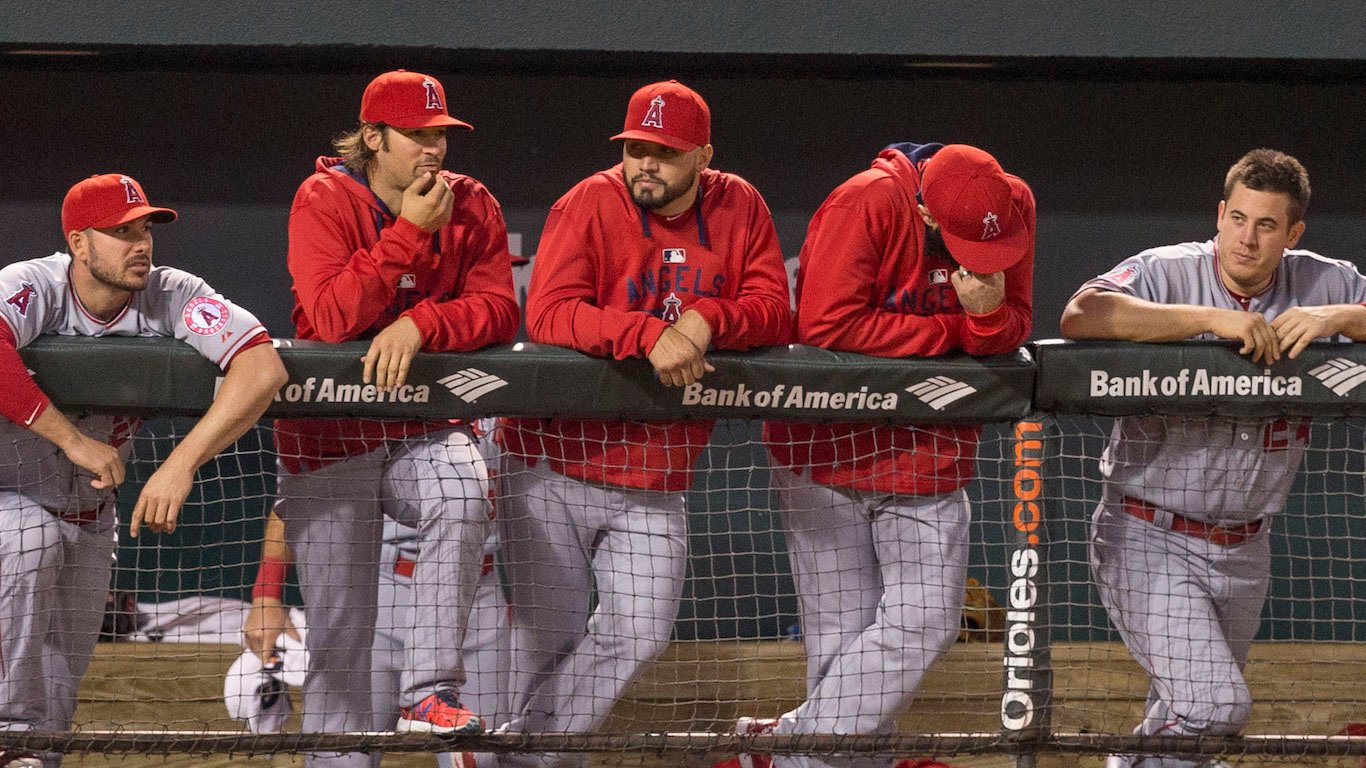
Source: https://www.flickr.com/photos/keithallison/
14. Los Angeles Angels
> 10 yr. attendance change: -11.5%
> Sport: Baseball
> Avg. home game attendance: 37,236
> Avg. capacity filled: 82.7%
The second most populous city in the United States, Los Angeles is a major market for professional sports. The city, however, may not be big enough for its two MLB teams — the Angels and Dodgers — as attendance at Angels home games is suffering. Over the last decade, attendance at Angel Stadium has fallen by 11%, while average attendance at Dodger Stadium, much closer to the center of downtown Los Angeles, remains effectively unchanged. Currently, the LA Dodgers are at the top of their division, while the Angels, with a losing record, trail the Houston Astros, Seattle Mariners, and the Texas Rangers in the American League West.
[in-text-ad-2]
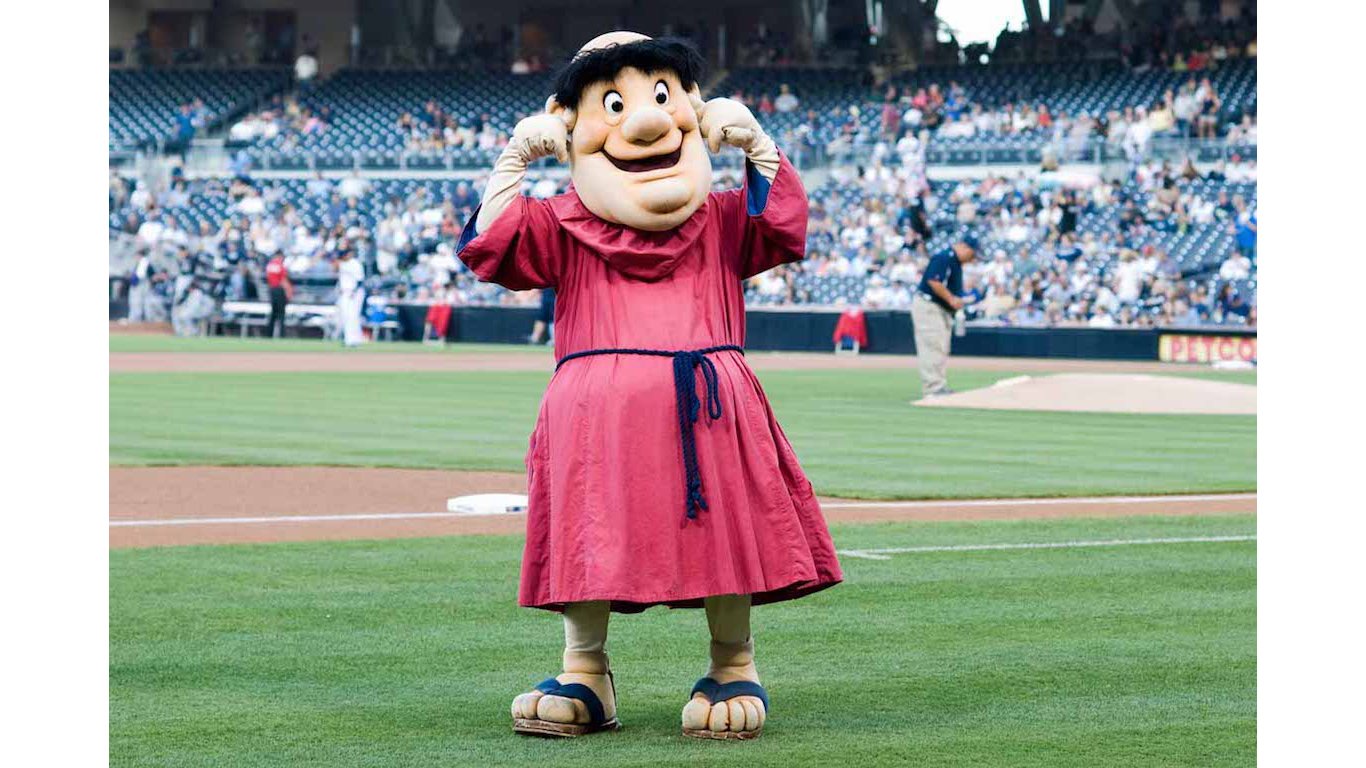
Source: SD Dirk / Flickr
13. San Diego Padres
> 10 yr. attendance change: -11.6%
> Sport: Baseball
> Avg. home game attendance: 29,029
> Avg. capacity filled: 72.3%
Finishing first in their division, the San Diego Padres had two consecutive playoff appearances in 2005 and 2006. Over the 10 seasons since, they have not returned to the playoffs once. Average home game attendance at Petco Park fell by 11.6% between the Padres’ 2006 season and their most recent season, in which they finished last in their division. Currently, the San Francisco Giants, the Philadelphia Phillies and the Cincinatti Reds are the only teams in the National League with worse records than the Padres.
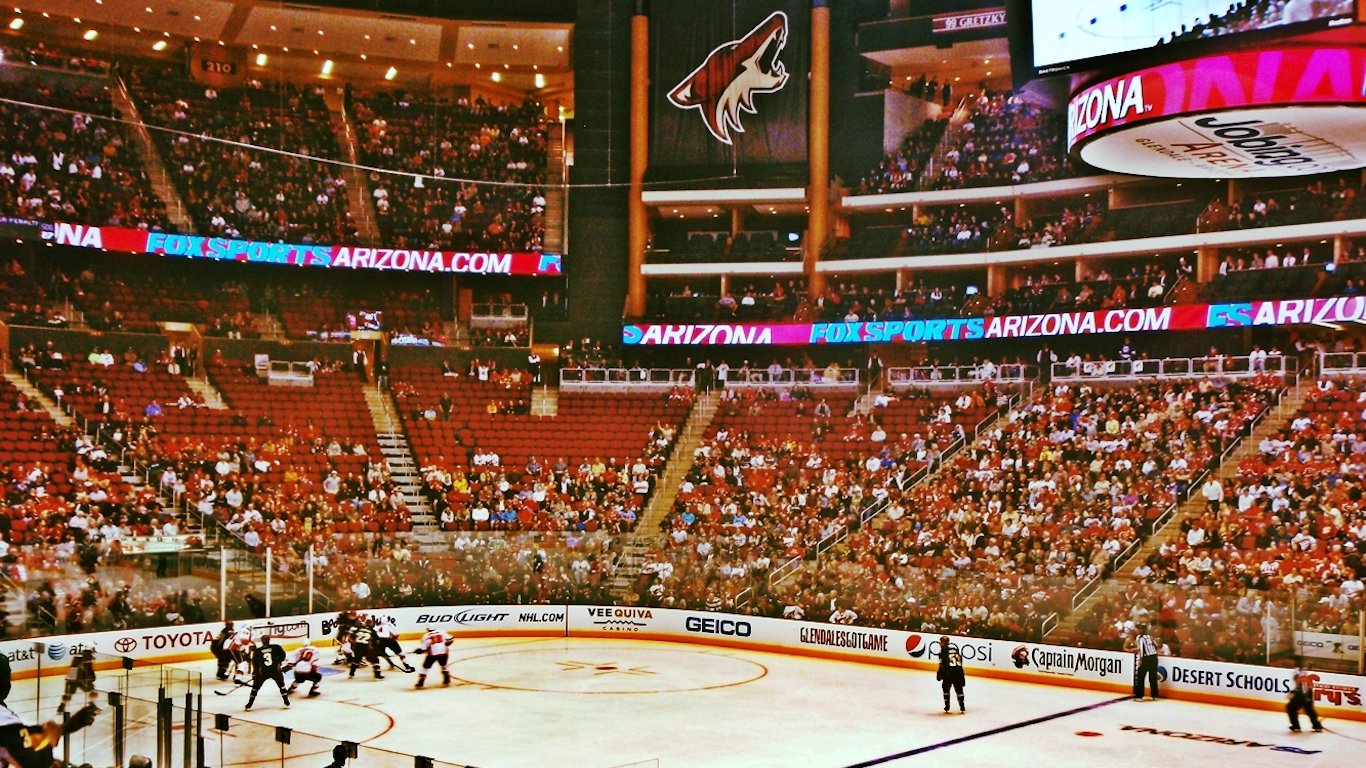
Source: https://www.flickr.com/photos/5of7/
12. Arizona Coyotes
> 10 yr. attendance change: -12.6%
> Sport: Hockey
> Avg. home game attendance: 13,094
> Avg. capacity filled: 76.5%
Finishing near the bottom of their division, the Arizona Coyotes had a disappointing 2016-2017 season. The team closed the season with fewer wins than all but two other teams in the league. The Coyotes were only able to fill their stadium to about three-quarters capacity on average throughout the season. A decade prior, average home game attendance topped 85%. At the time, this was a poor attendance record compared to the rest of the league, but nevertheless it was far better than today’s average.
The Coyotes are relatively new to Arizona. Formerly based in Winnipeg, the team relocated to Phoenix for the 1996-1997 season, abandoning a small, but loyal Canadian fan base.
[in-text-ad]
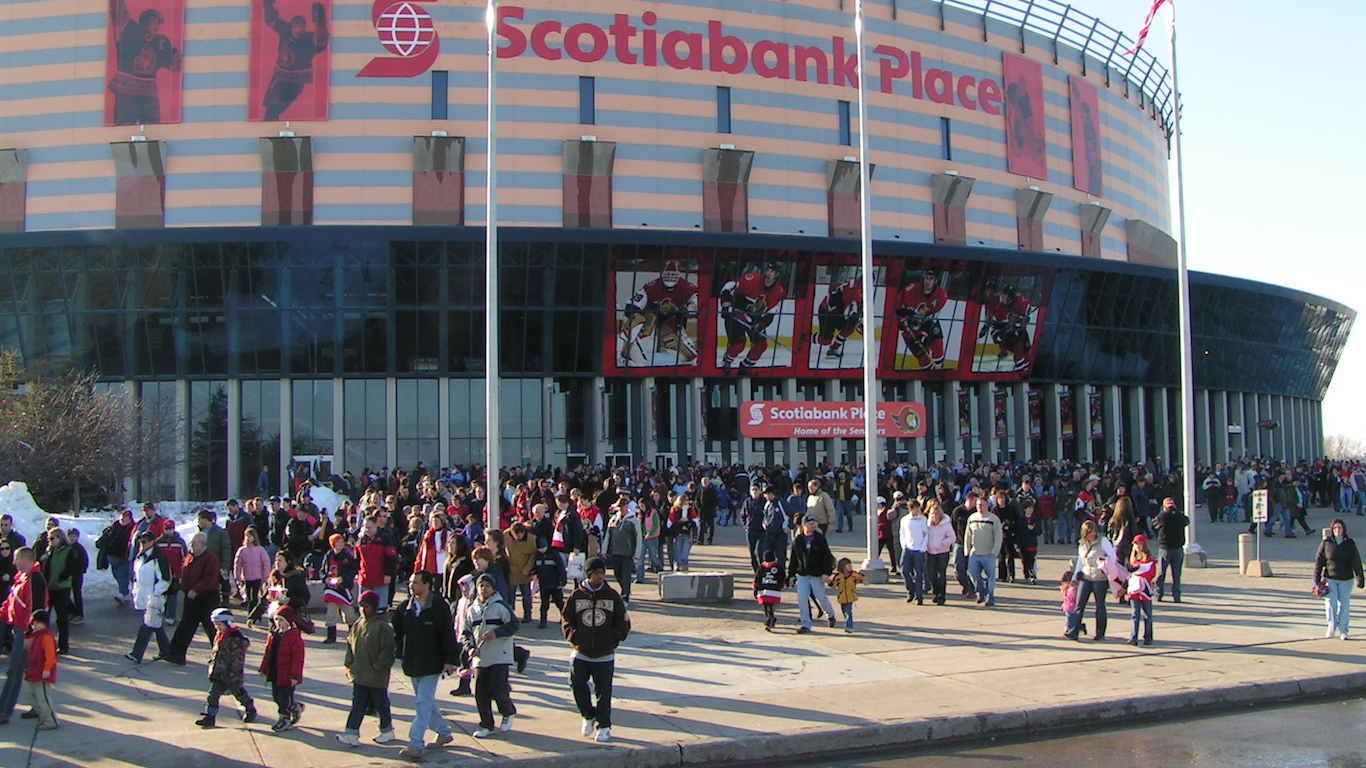
Source: Janothird / Wikimedia Commons
11. Ottawa Senators
> 10 yr. attendance change: -13.6%
> Sport: Hockey
> Avg. home game attendance: 16,744
> Avg. capacity filled: 87.4%
Unlike many teams on this list, the Ottawa Senators performed well during the 2016-2017 season. The Senators finished second in their division, and then had a strong playoff run, eventually losing in Game Seven of the Eastern Conference Finals to the Pittsburgh Penguins, who would go on to win the Stanley Cup. The Senators regularly filled Scotiabank Place — now Canadian Tire Centre — to capacity 10 years ago. Since then, average attendance has dropped by 13.6%. As evidence of the team’s attendance problems. Ottawa notoriously failed to sell out its first home game of the Eastern Conference semifinals against the Rangers.

Source: https://www.flickr.com/photos/dph1110/
10. Denver Nuggets
> 10 yr. attendance change: -14.3%
> Sport: Basketball
> Avg. home game attendance: 14,770
> Avg. capacity filled: 77.1%
A decade ago, the Denver Nuggets were a powerhouse. Drafting Carmelo Anthony in 2003, the team made the playoffs in each of the seven full seasons the now 10 time all-star forward was with the team. The Nuggets lost Anthony in a 2011 trade along with some fan enthusiasm. The team has not had a playoff appearance in the last four seasons, and average home game attendance in 2016 was 14.3% lower than it was in 2006.
Source: U.S. Air Force photo / Dave Armer
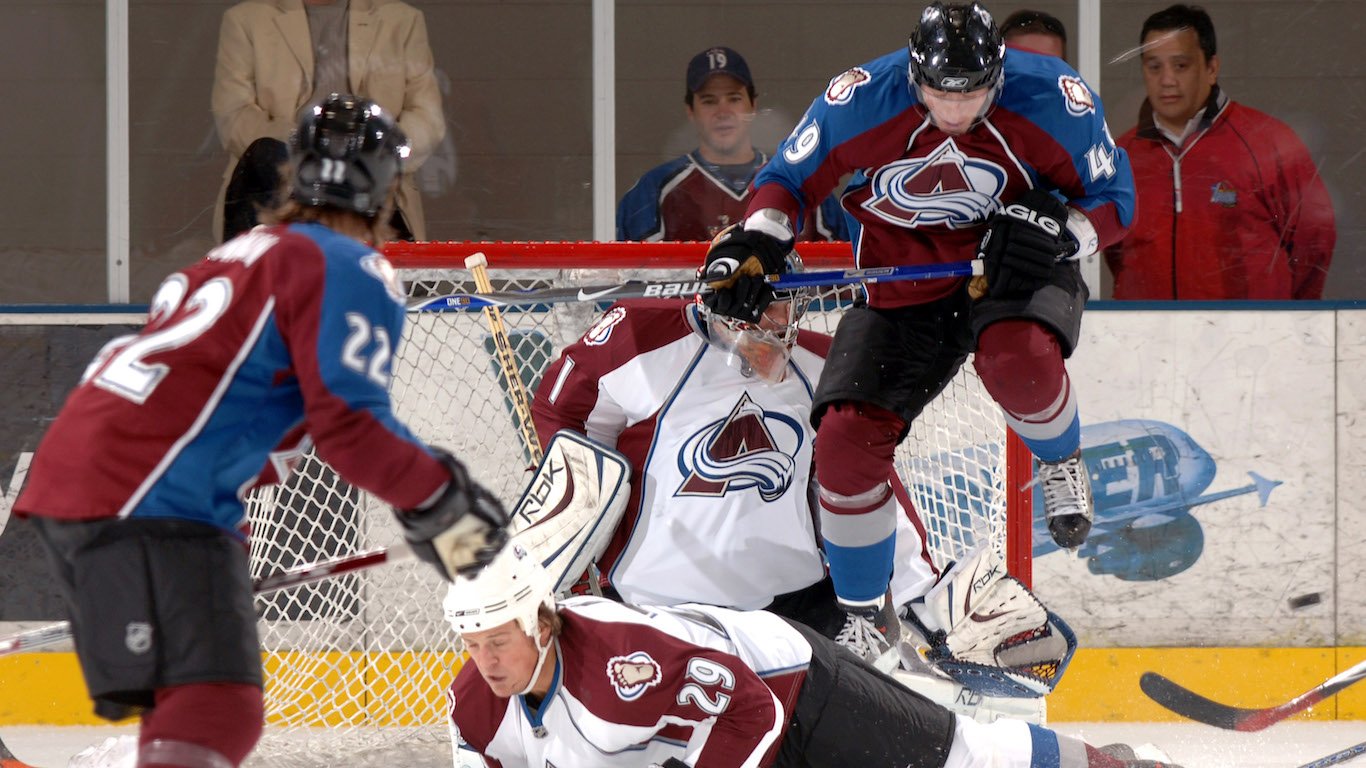
9. Colorado Avalanche
> 10 yr. attendance change: -15.8%
> Sport: Hockey
> Avg. home game attendance: 14,835
> Avg. capacity filled: 82.4%
The Colorado Avalanche were once a dynasty in the NHL. The team moved to Denver from Quebec in 1995, winning the Stanley Cup in the first season in their new home city. Coming off that legendary first year, the team made the playoffs in each of the following nine full seasons, winning the Stanley Cup once more in 2001. The team missed the playoffs for the first time in 2007, and has only been back to the postseason three times since. Fan enthusiasm appears to have faded along with the Avalanche’s dominance. Finishing last in their division in the most recent season, average home game attendance is down 15.8% from a decade ago.
Source: Public Domain
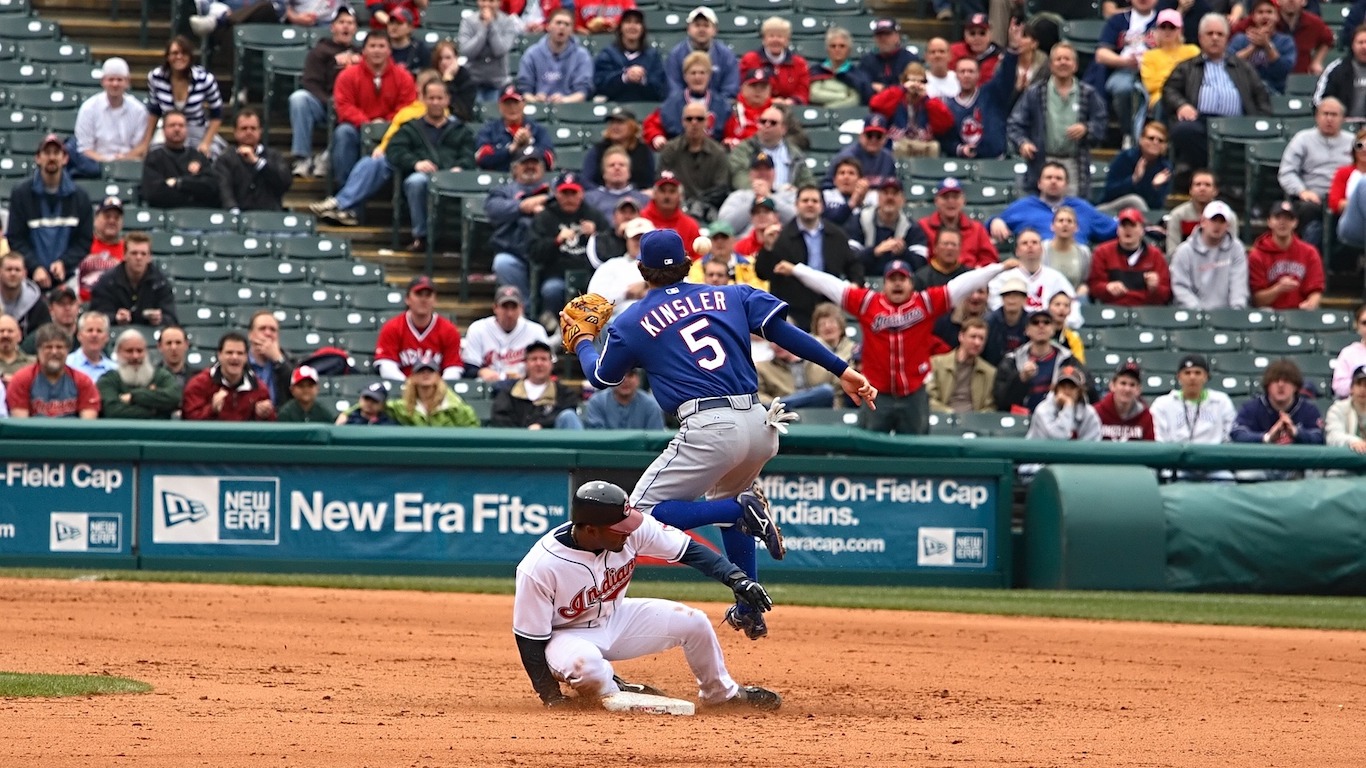
8. Cleveland Indians
> 10 yr. attendance change: -20.3%
> Sport: Baseball
> Avg. home game attendance: 19,650
> Avg. capacity filled: 55.8%
Despite making it to the World Series for the first time in nearly two decades, the Cleveland Indians had difficulty filling seats in the 2016 season. An average of only 19,650 fans turned out for home games last season, down from nearly 25,000 in the 2006 season.
The Indians’ logo and mascot have been the subject of controversy in recent years. Many find the Chief Wahoo logo, which the team has sported since the 1940s, offensive to Native Americans. The league is currently pressuring the team change the logo. Though the extent to which bad press related to the mascot hurts home game ticket sales is not clear, many potential fans may be turned off by the controversy.
[in-text-ad]
Source: Elb2000 / Wikimedia Commons
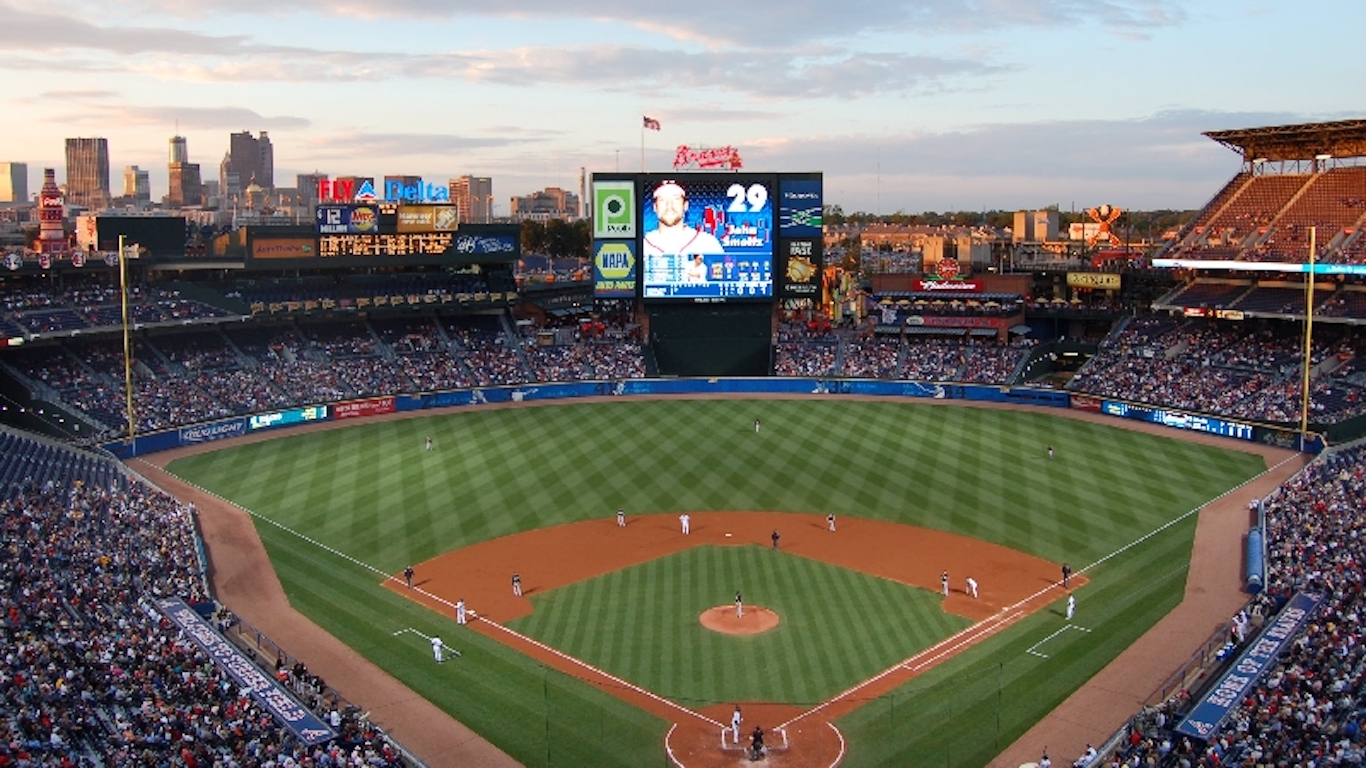
7. Atlanta Braves
> 10 yr. attendance change: -21.7%
> Sport: Baseball
> Avg. home game attendance: 24,949
> Avg. capacity filled: 50.3%
The Atlanta Braves had five World Series appearances — including one win — throughout the 1990s. From 1991 through 2005, the team only missed the postseason once. The Braves’ stature in the league has faded considerably in recent years, however. Atlanta, which only managed three playoff appearances between 2006 and 2016, finished each of their last three seasons with losing records. A decade ago, average attendance at home games topped 31,000. As of 2016, average attendance at Turner Field fell below 25,000 per home game. The Braves’ attendance issues are up in air at the moment — the team is in the midst of its first season at the brand new SunTrust Park.
Source: Amy K Posner / Wikimedia Commons
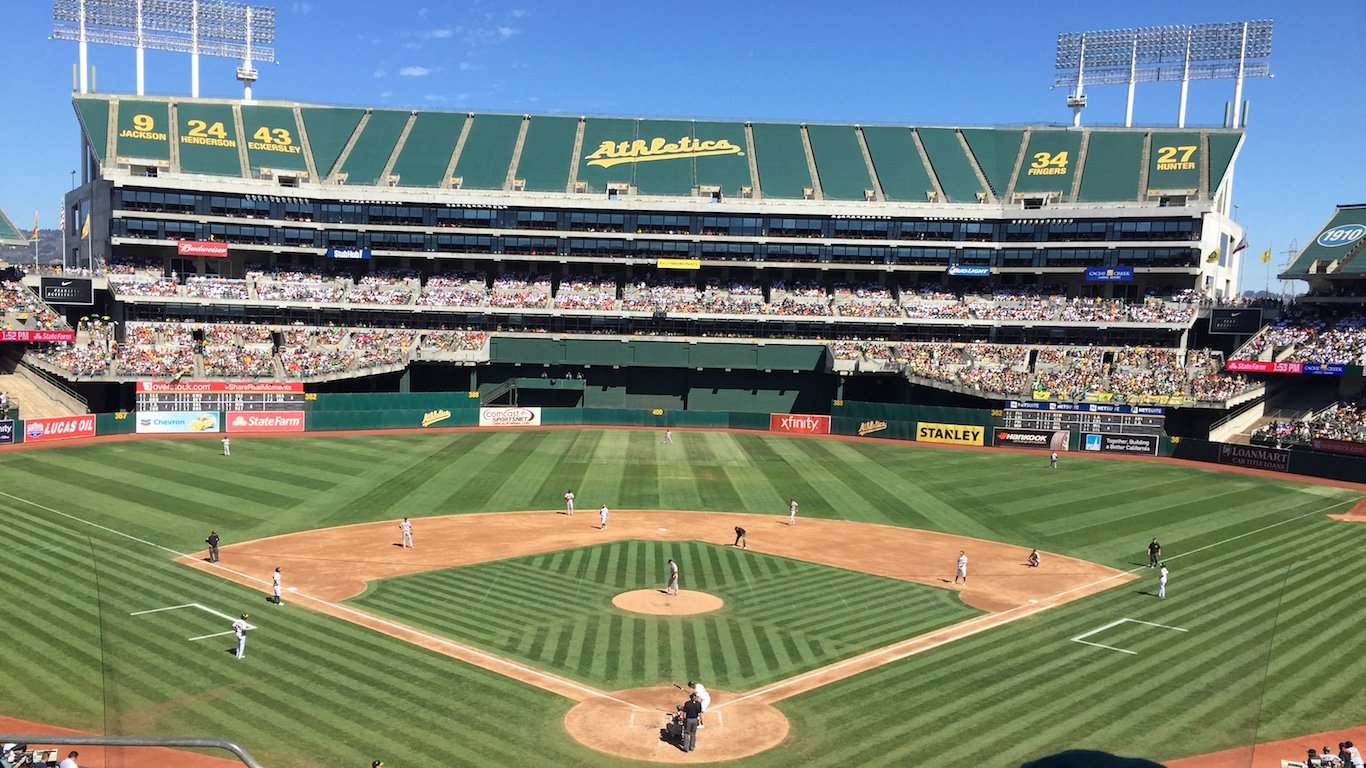
6. Oakland Athletics
> 10 yr. attendance change: -23.0%
> Sport: Baseball
> Avg. home game attendance: 18,784
> Avg. capacity filled: 53.6%
Finishing first in their division, the Oakland Athletics had a strong 2006 season. That year, home game attendance regularly topped 24,000. Last season, the A’s finished last in their division, and their lackluster performance appears to have put a damper on fan enthusiasm. Falling below 19,000, average home game attendance fell by 23% from 2006.
The A’s currently share a stadium with the Oakland Raiders, a team that will be relocating to Las Vegas in pursuit of greater revenue generated from attendance.
Source: EricEnfermero / Wikimedia Commons
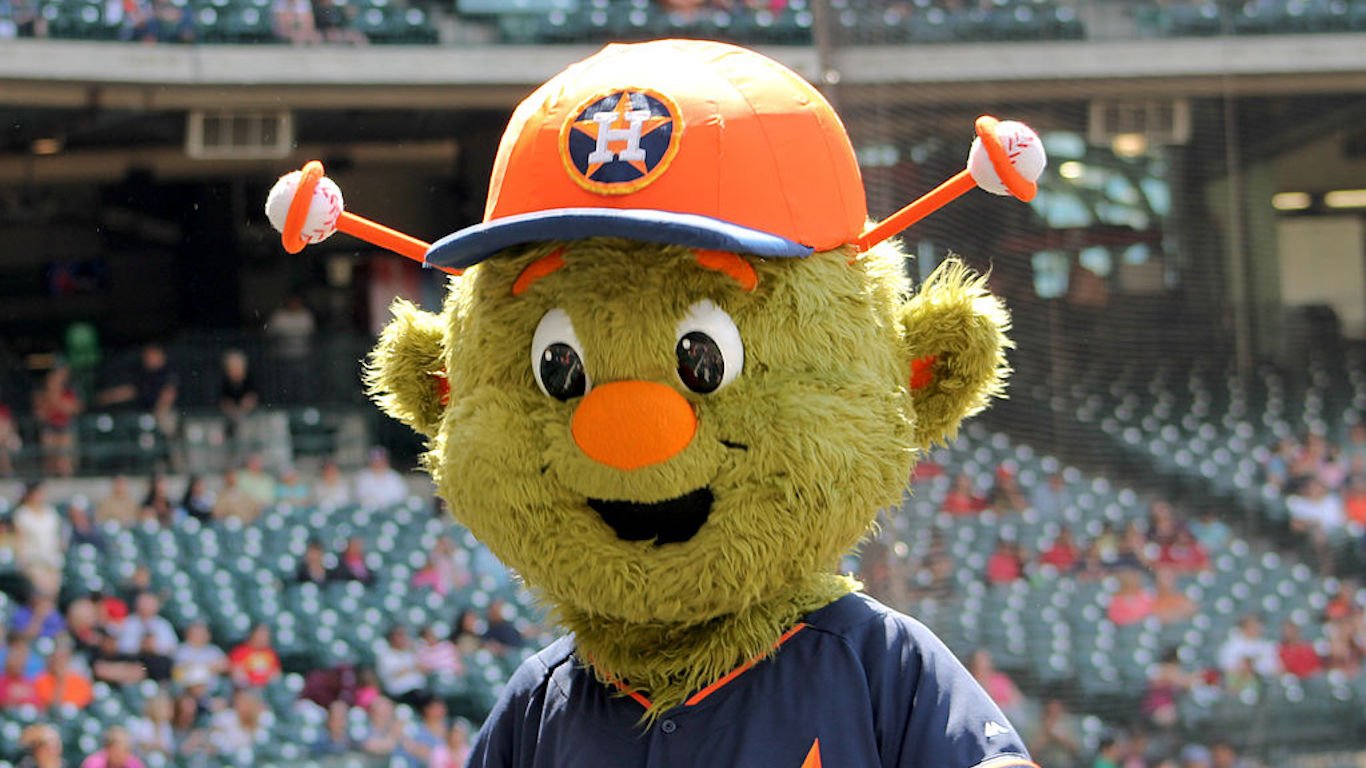
5. Houston Astros
> 10 yr. attendance change: -23.7%
> Sport: Baseball
> Avg. home game attendance: 28,476
> Avg. capacity filled: 68.3%
Home to over 2 million people, Houston is the fourth largest city in the United States and a major market for professional sports. Still, attendance at Houston Astros games is dwindling. The average number of fans attending home games fell 23.7% from the 2006 season to the 2016 season.
The 2017 season may mark a turnaround in fan enthusiasm for the Astros. The team is currently ranked second among all MLB teams and is leading the American League by a 10 game margin.
Source: Kevin Ward / Wikimedia Commons
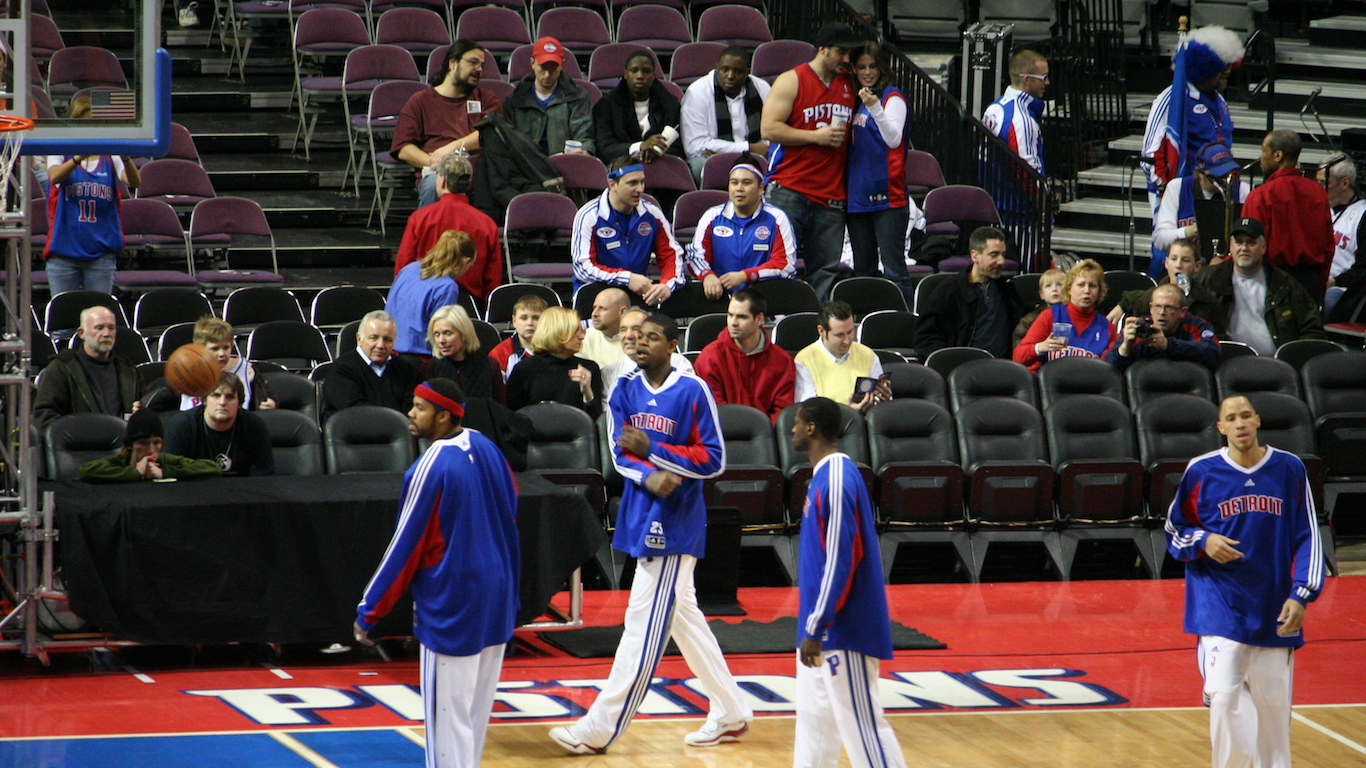
4. Detroit Pistons
> 10 yr. attendance change: -27.6%
> Sport: Basketball
> Avg. home game attendance: 15,979
> Avg. capacity filled: 72.4%
No professional basketball team has reported a greater 10-year decline in home game attendance than the Detroit Pistons. In 2006, the Pistons regularly filled their home stadium, The Palace of Auburn Hills, to capacity. In their most recent season however, average attendance fell below three-quarters of the stadium’s total capacity.
Declining attendance may be due to the team’s disappointing performance in recent years. While the Pistons finished first in their division each year between 2004 and 2008, they finished last in their division in the 2016-2017 season and have only had one playoff appearance in the last eight years.
[in-text-ad]
Source: https://www.flickr.com/photos/daverose215/
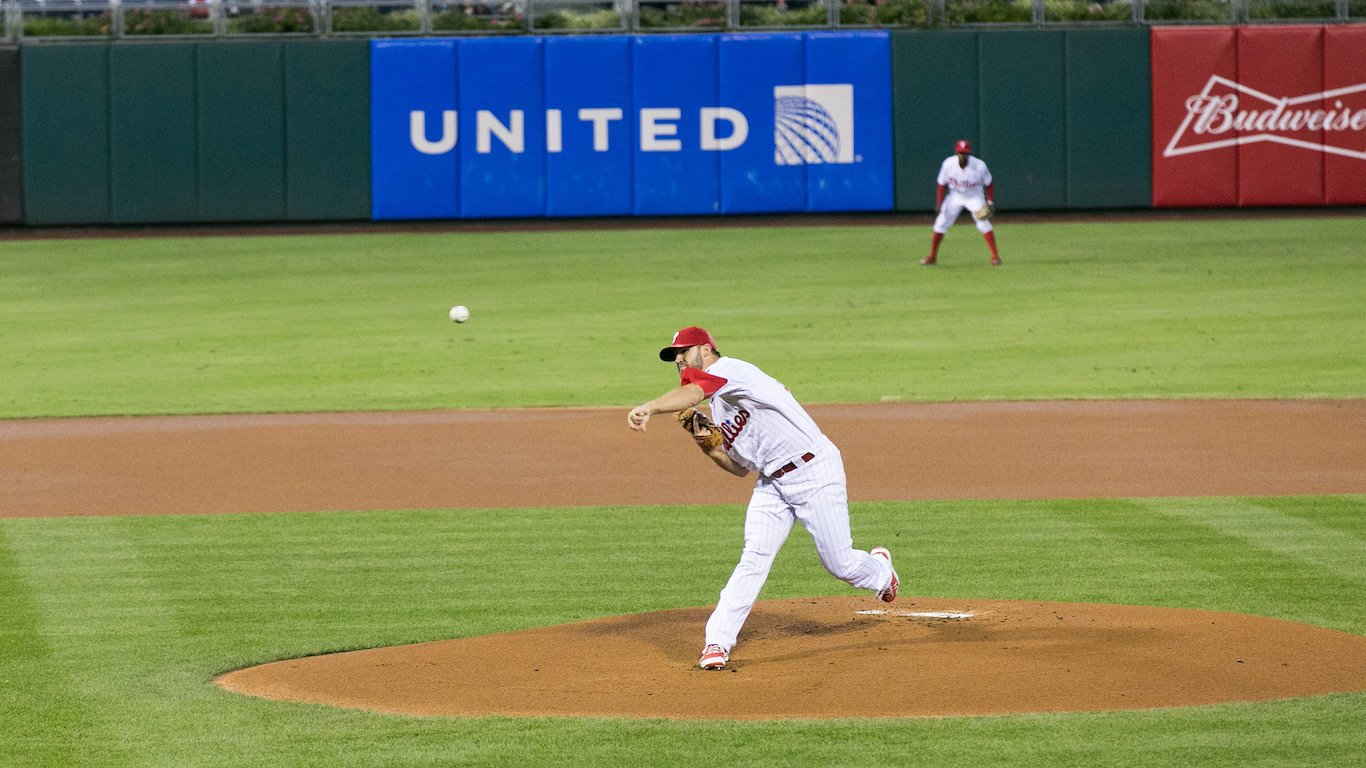
3. Philadelphia Phillies
> 10 yr. attendance change: -30.9%
> Sport: Baseball
> Avg. home game attendance: 23,643
> Avg. capacity filled: 54.2%
Many teams in Major League Baseball have struggled to fill seats in recent years. Few teams are having as much trouble as the Phillies, however. In 2006, home game attendance regularly topped 34,000. Last season, average attendance was less than 24,000 a game. Though the team has had two World Series appearances, including one World Series win in the last 10 years, it is now stuck in a five-season playoff drought. That drought does not appear likely to end this year, as the team is currently ranked dead last in the MLB.
 24/7 Wall St.
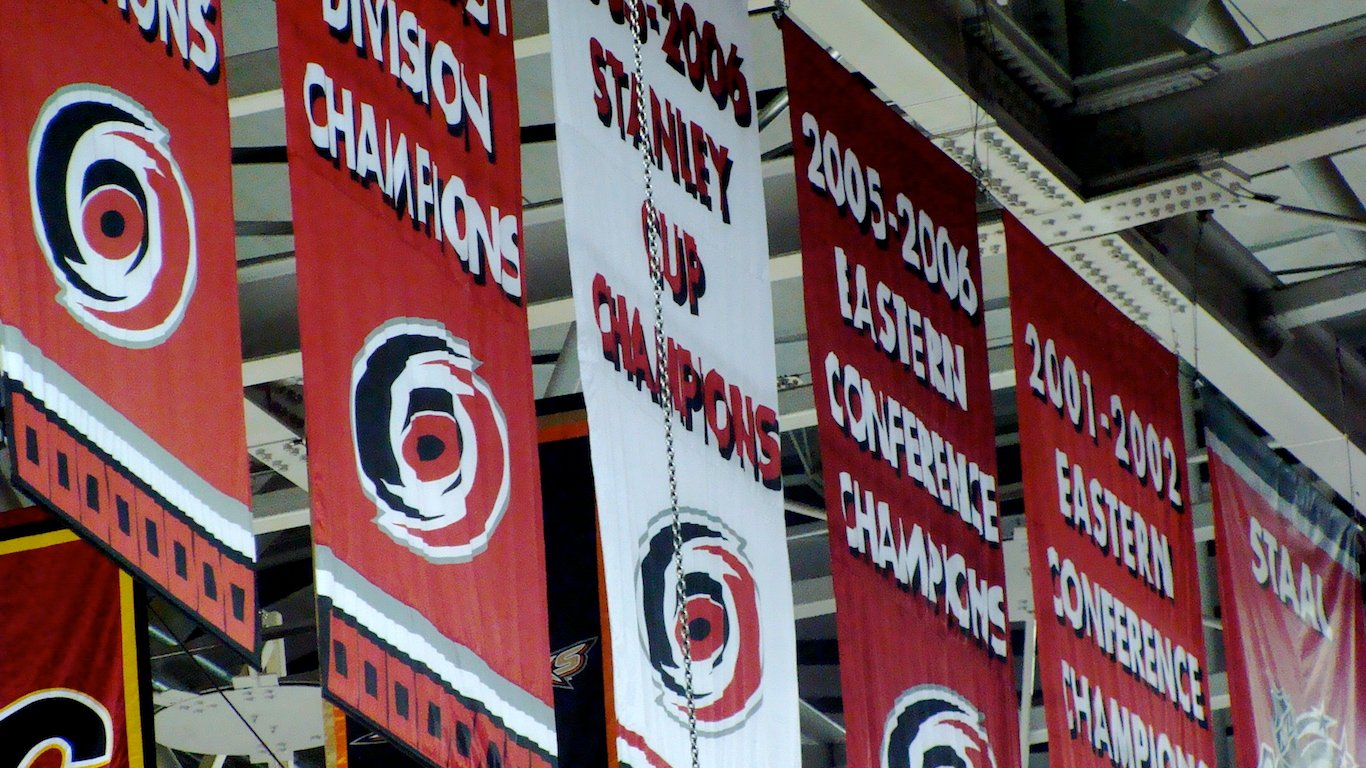
Source: Aaron Caldwell / Wikimedia Commons
2. Carolina Hurricanes
> 10 yr. attendance change: -32.3%
> Sport: Hockey
> Avg. home game attendance: 11,776
> Avg. capacity filled: 63%
Relatively new to the region, the Carolina Hurricanes relocated from Hartford, Connecticut to Raleigh, North Carolina in 1997. Lackluster performances in recent years appear to be hurting ticket sales. The team regularly made postseason appearances throughout its first decade in Raleigh and won the Stanley Cup at the end of the 2005-2006 season. The following season, home game attendance regularly topped 17,000. However, last season marked the eighth consecutive year without a playoff appearance, and average home game attendance was below 12,000, a 32% decline from a decade prior.
Source: Mr.Konerko / Wikimedia Commons
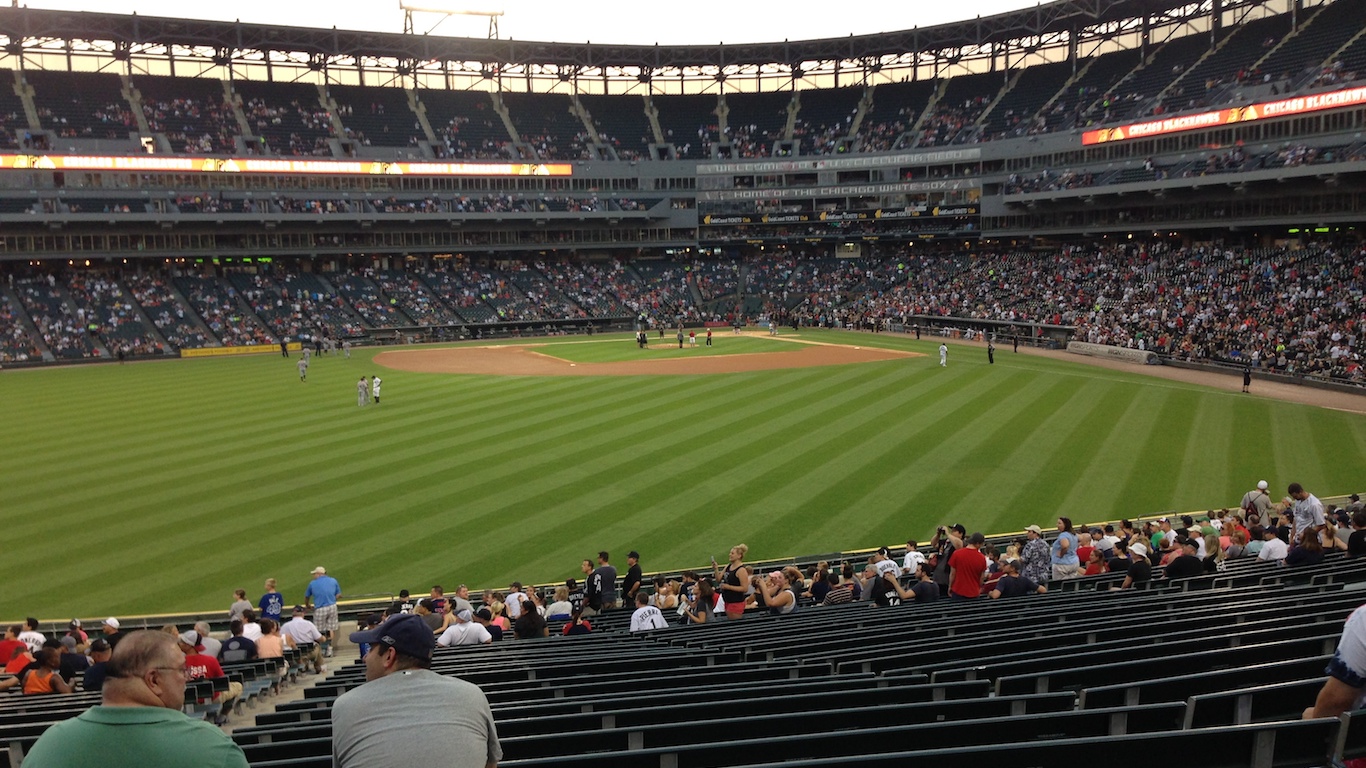
1. Chicago White Sox
> 10 yr. attendance change: -40.2%
> Sport: Baseball
> Avg. home game attendance: 21,828
> Avg. capacity filled: 53.7%
Debate rages in the Windy City about which baseball team is favored by more local patrons of the national pastime — the Cubs or White Sox.If recent home game attendance is any indication, Chicago is a Cubs town. Though the two teams’ respective stadiums are roughly the same size, turnout for Cubs games during the 2016 season was nearly double the average turnout at White Sox games. Between 2006 and 2016, attendance at the White Sox’s home stadium, Guaranteed Rate Field, fell by over 40%, the steepest decline of any professional sports team in the United States. Over the same time period, Cubs attendance has remained effectively unchanged.
The White Sox may have recently lost some of their less loyal fans as the Cubs won the 2016 World Series, breaking the storied 71-year curse.
Detailed Findings:
Fan attendance can decline for any number of reasons — but poor performance is usually the culprit when ticket sales are down. Multiple consecutive losing seasons can try fans’ loyalty and ultimately hurt ticket sales. Many teams on this list have gone years without a playoff appearance. The Philadelphia Phillies, for example, a team with a 31% 10-year attendance decline at home games, has not had a postseason appearance in five years, and it is currently in last place in the league.
Ticket sales are also a measure of how loyal a team’s fan base is. Some teams on this list, including the Arizona Coyotes and Carolina Hurricanes, have only been based in their home cities since the mid-1990s. Fan loyalty for these teams may not be as strong as it is in cities that have hosted the same team for many decades.
Other teams on this list are further affected by a split market. Cities like Chicago and Los Angeles have two baseball teams each. With one market for two teams in the same sport, both the Chicago White Sox and the Los Angeles Angels are among the teams losing the most fans. In each case, the team losing fans has had fewer playoff appearances over the last decade than the team sharing their city.
Support for teams can also wane in the absence of a standout athlete. Before the Denver Nuggets had a 14% decline in average home game attendance, the team’s roster featured superstar Carmelo Anthony, one of the best and most exciting players in the NBA. After Anthony was traded to the New York Knicks in 2011, the Nuggets lost visibility nationwide and sold fewer tickets.
Several teams on this list have also been the subject of controversy in recent years. Both the Washington Redskins and Cleveland Indians have come under fire for their logos and mascots, which many consider to be offensive to Native Americans. While the extent to which bad press hurts home game ticket sales is not clear, many potential fans may be turned off by the clubs’ insensitivity.
Methodology:
To determine the teams losing the most fans, 24/7 Wall St. reviewed 10-year percentage changes in average attendance at regular-season home games in the NHL, NBA, MLB, and NFL. Attendance figures are from ESPN and are as of the most recent completed season and the season 10 years prior. To avoid attendance declines based on a reduction in stadium capacity, franchises that built a new facility or moved to a new city in the intervening years were excluded. The average percentage of capacity filled during home games in a season for the NHL, NBA, and NFL also came from ESPN and is as of the most recently completed regular season. In the case of the MLB, average capacity filled is based on the average home game attendance from ESPN and officially listed stadium capacities. All current-season records are as of the morning of July 17, 2017. Due to insufficient attendance data, the Indianapolis Colts, Oakland Raiders, Miami Dolphins, and Minnesota Vikings — all NFL clubs — were not considered.
Sponsored: Want to Retire Early? Here’s a Great First Step
Want retirement to come a few years earlier than you’d planned? Or are you ready to retire now, but want an extra set of eyes on your finances?
Now you can speak with up to 3 financial experts in your area for FREE. By simply clicking here you can begin to match with financial professionals who can help you build your plan to retire early. And the best part? The first conversation with them is free.
Click here to match with up to 3 financial pros who would be excited to help you make financial decisions.
Thank you for reading! Have some feedback for us?
Contact the 24/7 Wall St. editorial team.
Editors' Picks

