Special Report
16 Most Segregated Cities in America

Published:
Last Updated:
Next year will mark the 50-year anniversary of the Civil Rights Act of 1968, also known as the Fair Housing Act. The landmark bill prohibited by law long-standing practices of housing segregation based on race by landlords and local governments. Despite the law, housing discrimination never fully disappeared, and the effects of decades of discrimination are evident in U.S. cities — many of which still highly segregated.
The forced segregation of black Americans in neighborhoods with suboptimal schooling, poor public transportation, and fewer job opportunities has led to worse social and economic outcomes for residents in those neighborhoods.
To identify America’s 16 most segregated cities, 24/7 Wall St. calculated the percentage of metropolitan area black residents who live in predominantly black census tracts. While certain racially homogeneous neighborhoods exist in every large metropolitan area, some cities are far more starkly divided. In several U.S. metropolitan areas, more than one-fourth of the African American population lives in neighborhoods that are at least 80% black. In two metro areas, more than half of black residents live in a predominately African American neighborhoods.
Click here to see the most segregated cities in America.
Click here to see our detailed findings and methodology.
16. Washington-Arlington-Alexandria, DC-VA-MD-WV
> Black ppl. in black neighborhoods: 29.1%
> Black population: 24.9%
> Black poverty rate: 13.2%
> White poverty rate: 4.6%
Our nation’s capital and, for many people, the physical representation of unity and freedom in the United States, Washington D.C. is also one of the most segregated cities in the United States. About one-quarter of the population is black, a relatively large share compared to both the country as a whole and most metro areas. Some 13.8% of the population of the 100 largest metropolitan areas in the country is black.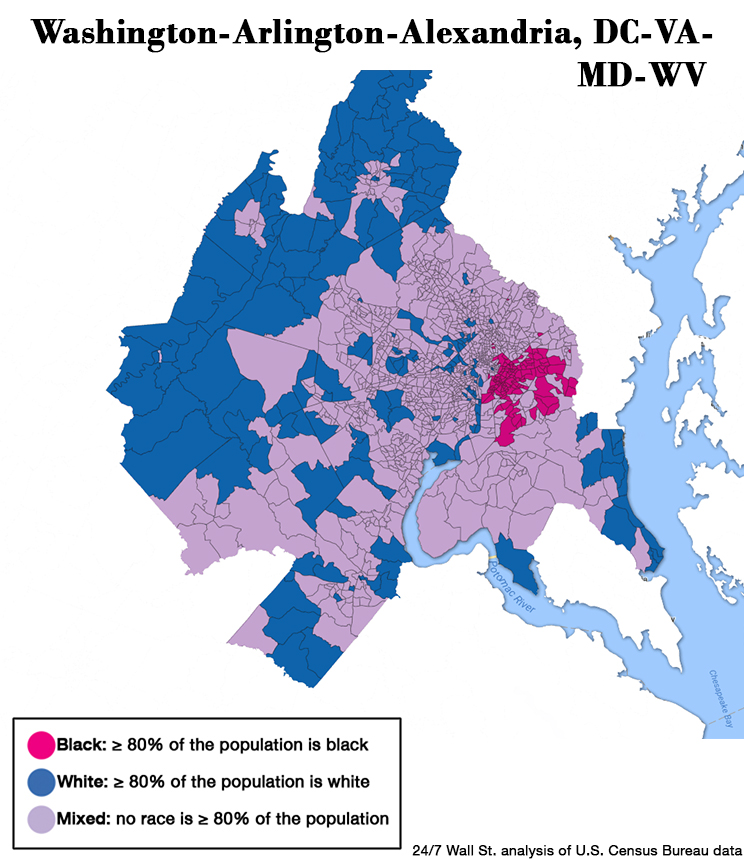 Source: Evan Comen / Google Fusion Tables
Segregation in Washington largely occurs along the Anacostia River, with many poor, black neighborhoods concentrated in the southeastern parts of the city. Wealthier white communities, meanwhile, are situated in surrounding suburbs such as Arlington, Virginia and Frederick, Maryland. Dozens of tracts in Southeast Washington D.C. have less than 1% white residents, and many tracts in the northeast have less than 1% African American residents.
Click image to enlarge
15. Dayton, OH
> Black ppl. in black neighborhoods: 29.6%
> Black population: 15.4%
> Black poverty rate: 34.1%
> White poverty rate: 12.6%
Unlike other highly segregated, large cities like Washington, D.C., Dayton has a relatively small nonwhite population. More than 77% of the Ohio metropolitan area’s 800,000 residents are white. Of those, 467,000, or over three-quarters, live in mostly white neighborhoods. Also, about 13% of the white population is impoverished. Of the area’s relatively small black population, about 30% live in predominately black neighborhoods, and almost 35% live in poverty. In all, 62.8% of Dayton’s population lives in a neighborhood that primarily consists of their respective race, one of the largest shares of segregated residents nationwide. Source: Evan Comen / Google Fusion Tables
In 1966, some of the worst race riots in the Dayton’s history were likely caused by the city’s discriminatory housing policies that resulted in the heavy racial segregation that persists today. As school systems nationwide were ordered to desegregate, Dayton was the last Ohio city to be awarded racially unitary status — that is, the federal government no longer found its schools segregated based on race. Still, although the city no longer enforces segregation by law, the Dayton school system remains largely segregated today.
Click image to enlarge
14. Atlanta-Sandy Springs-Roswell, GA
> Black ppl. in black neighborhoods: 31.3%
> Black population: 32.5%
> Black poverty rate: 21.6%
> White poverty rate: 9.0%
Atlanta is one of the most diverse metropolitan areas in the country. Today, nearly one-third of the Atlanta population is black, seventh most among the 100 largest metropolitan areas. Nearly one-third of the black population lives in mostly black neighborhoods.
Atlanta is one of the more segregated major metropolitan areas in the United States, as about 31% of the area’s black population lives in a predominantly black neighborhood. However, compared to many racially segregated cities, while inequalities still exist, outcomes are not as bad for Atlanta’s black residents as they are for black residents in other cities. Atlanta has one of the highest African American adult educational attainment rates, one of the highest black homeownership rates, and one of the higher median incomes among large metropolitan areas for black households. Atlanta’s African Americans still fall well behind the metropolitan area’s white residents by all these measures, however.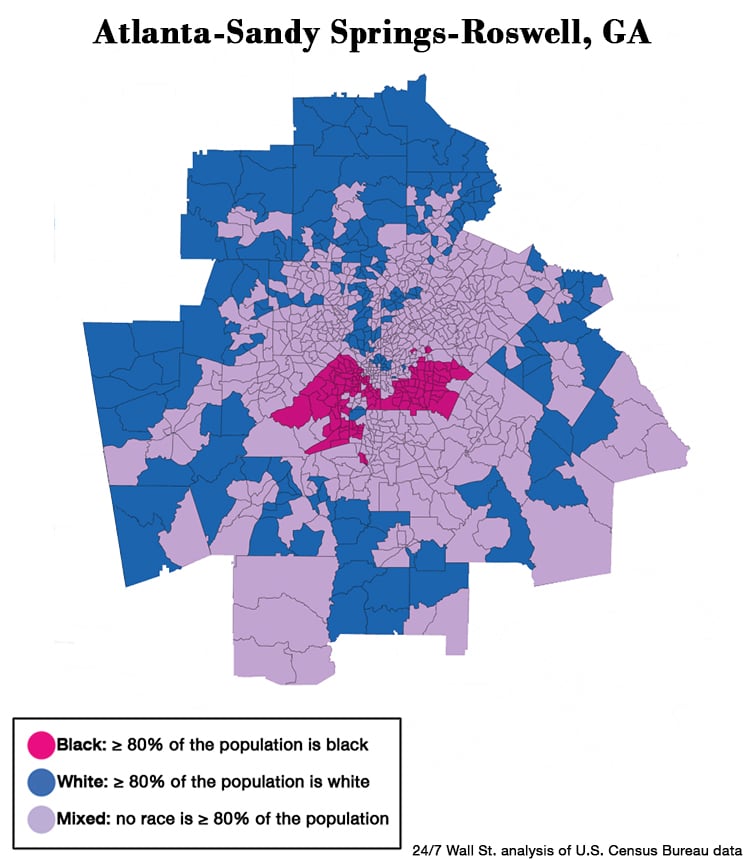 Source: Evan Comen / Google Fusion Tables
Click image to enlarge
13. Baton Rouge, LA
> Black ppl. in black neighborhoods: 31.7%
> Black population: 35.3%
> Black poverty rate: 27.9%
> White poverty rate: 10.8%
One of the most immediate and severe consequences of segregation in American cities is the ongoing differences in educational outcomes. Because property taxes are a major component of local school funding, regional income is one of the largest determinants of school quality and educational attainment.
Like in most of the country, there is a large income gap along racial lines in Baton Rouge. The typical black household in the Louisiana capital earns $34,914 a year, nearly half the $65,842 the typical white area household earns. Because Baton Rouge is one of the most segregated metropolitan areas in the United States, this translates to a significant disparity along racial lines in educational outcomes. The high school education attainment rate among black metropolitan area adults is just 80.9%, roughly 10 percentage points less than the 90.8% white high school education attainment rate — one of the larger disparities of any major metro area.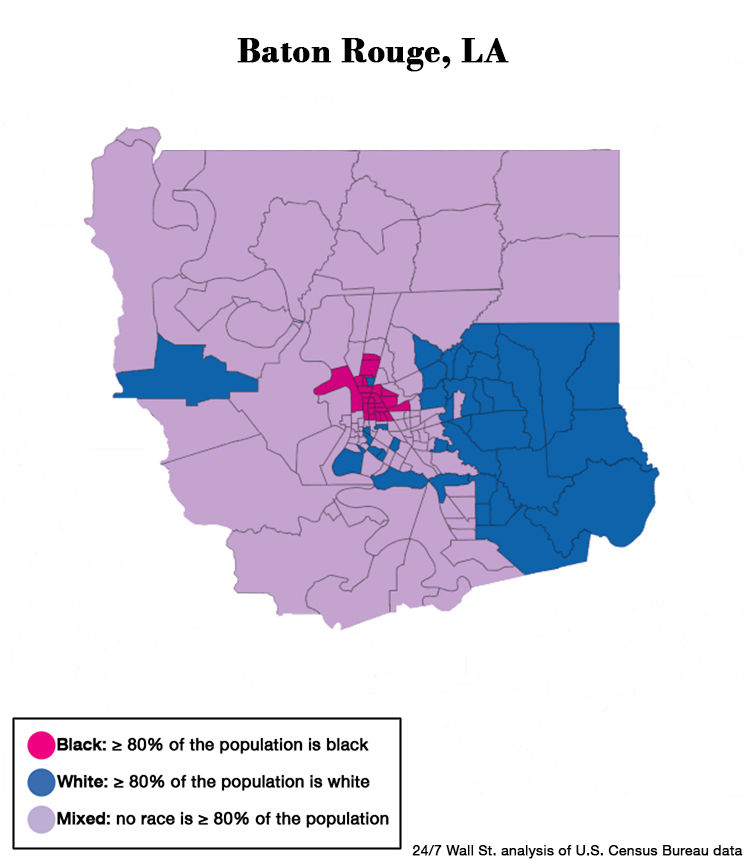 Source: Evan Comen / Google Fusion Tables
Click image to enlarge
12. Philadelphia-Camden-Wilmington, PA-NJ-DE-MD
> Black ppl. in black neighborhoods: 32.3%
> Black population: 20.2%
> Black poverty rate: 25.1%
> White poverty rate: 7.1%
Philadelphia has a long history of racial violence and segregation. One of the first race riots of the civil rights era erupted in the city in August 1964 after two police officers forcibly pulled a black woman from her car. The riots resulted in over 700 arrests and 200 cases of property damage. In 1985, the Philadelphia Police Department firebombed a house containing some members of a racial activist group after one of its members had shot and killed a police officer. In total, 11 people were killed, and the resulting fire destroyed 61 homes.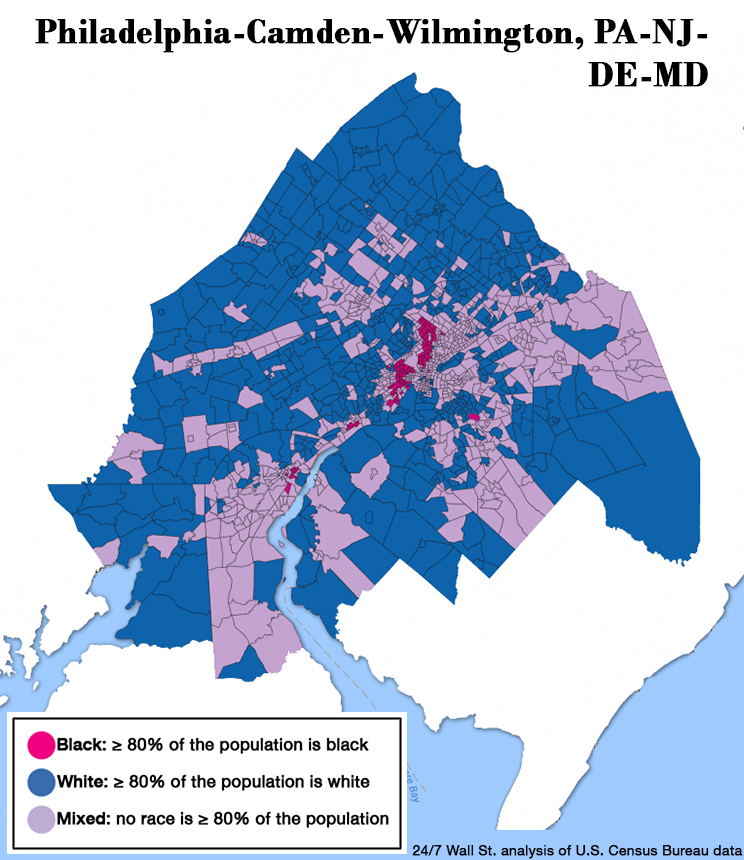 Source: Evan Comen / Google Fusion Tables
Today, about 43% of the City of Brotherly Love’s population lives in a racially homogeneous neighborhood, about 10 percentage points higher than the average across the 100 largest U.S. metropolitan areas. Of the city’s black population, 15.6% both earn poverty wages and live in high poverty neighborhoods, compared to less than 1% of the city’s white population.
Click image to enlarge
11. Milwaukee-Waukesha-West Allis, WI
> Black ppl. in black neighborhoods: 36.1%
> Black population: 16.4%
> Black poverty rate: 37.6%
> White poverty rate: 7.5%
Across the nation’s 100 largest metropolitan areas, slightly less than 1 in 3 residents live in a neighborhood where at least 80% of the population shares their race. In Milwaukee, 56.6% of residents live in such neighborhoods. The city’s quarter million black residents, which make up about 16% of the metro area’s population, live largely in Milwaukee County, while the metropolitan area’s majority-white population lives in the city’s suburbs, in Waukesha, Ozaukee, and Washington counties. Source: Evan Comen / Google Fusion Tables
Likely a consequence of ongoing racial segregation is the major difference in poverty rates between the city’s white and black residents. Likely a consequence of ongoing racial segregation is the major difference in poverty and education attainment between the city’s white and black residents. Just 1.2% of Milwaukee’s white residents live in neighborhoods that are largely impoverished, and 38.6% have a college degree. Almost 30% of the metro area’s black residents live in high poverty, and only 12.7% have a bachelor’s degree.
Click image to enlarge
10. St. Louis, MO-IL
> Black ppl. in black neighborhoods: 39.3%
> Black population: 18.2%
> Black poverty rate: 29.9%
> White poverty rate: 8.5%
One of the most famously disastrous cases of racially segregated government housing happened in St. Louis. In the mid-1950s, the federal government constructed several dozen 11 story middle-class public housing towers in two projects that would collectively be called Pruitt-Igoe. For a time, the towers were segregated — blacks lived in Pruitt, while white families lived in Igoe. After racial discrimination was outlawed and black and white residents were allowed to live together in the combined Pruitt-Igoe, most whites moved out, and a lack of care led the structures to fall into disrepair. Both crime and vacancy rates rose, until the towers were demolished and all remaining tenants were relocated.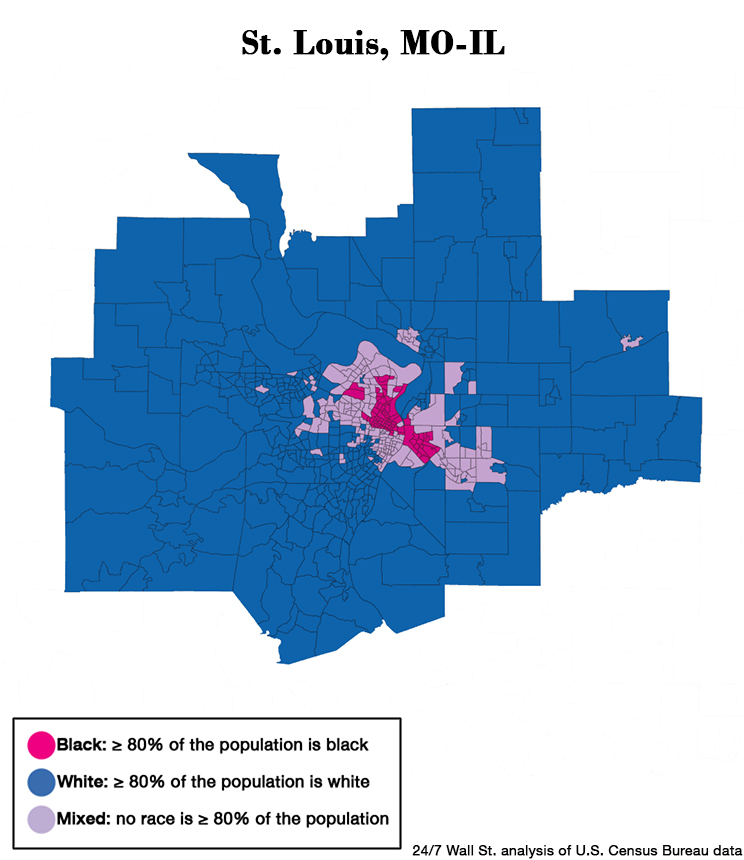 Source: Evan Comen / Google Fusion Tables
Richard Rothstein, researcher for the Economic Policy Institute, says that Pruitt-Igoe and other segregated public housing projects in St. Louis contributed to current racial inequalities in the St. Louis area, including the substantially higher educational attainment rates among the city’s white residents, as well as a poverty rate among black residents that is three and a half times higher than among the white population.
Click image to enlarge
9. Birmingham-Hoover, AL
> Black ppl. in black neighborhoods: 39.4%
> Black population: 28.4%
> Black poverty rate: 27.3%
> White poverty rate: 11.0%
Birmingham is often considered one of the most important cities in the development of the American civil rights movement during the 1960s. Martin Luther King Jr. focused his efforts to end segregation throughout the United States in Birmingham, and the city was the site of numerous sit-ins, marches, and nonviolent protests. The highly publicized violence with which peaceful protesters were met, as well as the bombing of the 16th Street Baptist Church that killed four young girls, galvanized the movement and caused it to spread throughout the country.
Given the city’s historic significance in the civil rights movement, it is especially regrettable to see how how segregated the city is today. Over half of the city’s 1.1 million residents live a racially homogeneous neighborhood that shares the same race as them. As is the case across the country, the city’s black population is far more likely to be poor, and far less likely to be employed and well educated, compared to the city’s white population. Less than 1% of the metro area’s white residents both live in poverty and live in neighborhoods where a large share of the population is also poor, compared to more than 15% of Birmingham’s black residents.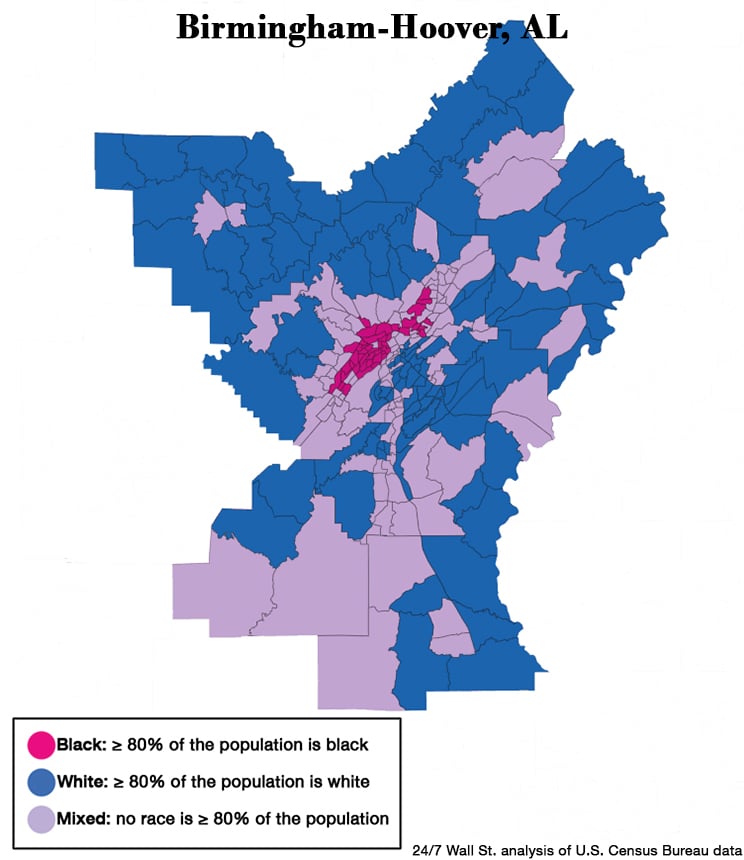 Source: Evan Comen / Google Fusion Tables
Click image to enlarge
8. Baltimore-Columbia-Towson, MD
> Black ppl. in black neighborhoods: 41.6%
> Black population: 28.5%
> Black poverty rate: 19.9%
> White poverty rate: 6.4%
The Baltimore-Columbia-Towson metro area is one of the most segregated places in the United States. Roughly half of the area’s white population lives in predominantly white neighborhoods, just as 41.6% of the area’s black population lives in predominantly black neighborhoods.
As is the case in many of the most segregated cities, Baltimore’s present day racial division is the product of a long history of racist policies designed to keep white neighborhoods white. In 1910, it was illegal for a black family to move to a block where over half of all residents were white, and vise-versa. As recently as the 1970s, the Baltimore County executive made it a priority to keep black families out of the county. Segregation does not stop at housing, and in fact contributes to most aspects of life, including poverty, education, police practices, and public order. As recently as April 2015, following the death of Freddie Grey in police custody, the city erupted in violent civil unrest for more than a week.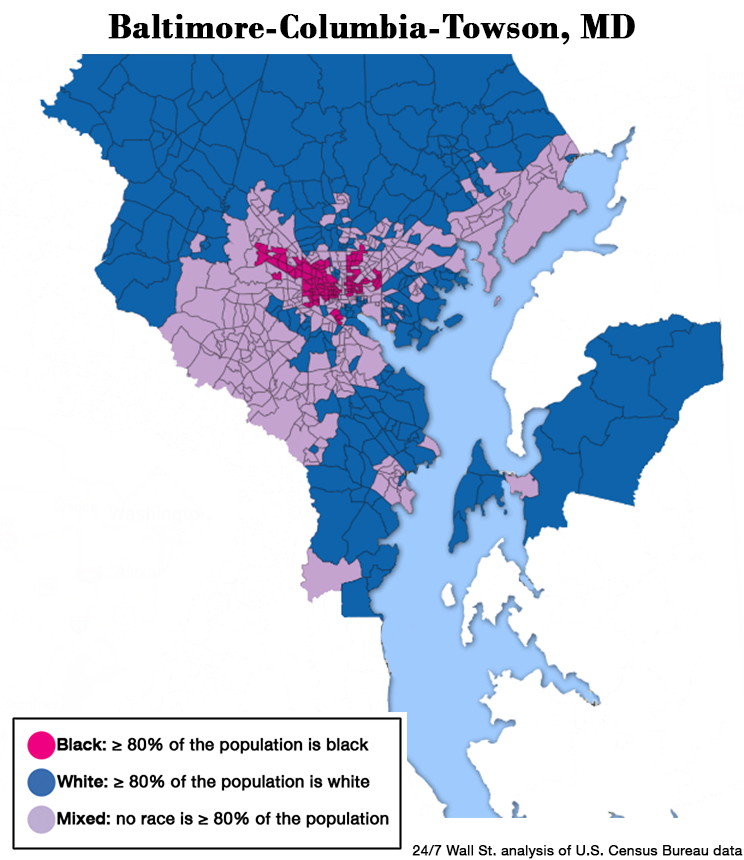 Source: Evan Comen / Google Fusion Tables
Click image to enlarge
7. Buffalo-Cheektowaga-Niagara Falls, NY
> Black ppl. in black neighborhoods: 43.0%
> Black population: 11.9%
> Black poverty rate: 36.9%
> White poverty rate: 9.3%
Along with Cleveland and Detroit, the Buffalo metro area is one of several highly segregated Rust Belt cities. The Buffalo-Cheektowaga-Niagara Falls metro area is one of only four nationwide where more than 80% of white residents live in predominantly white neighborhoods.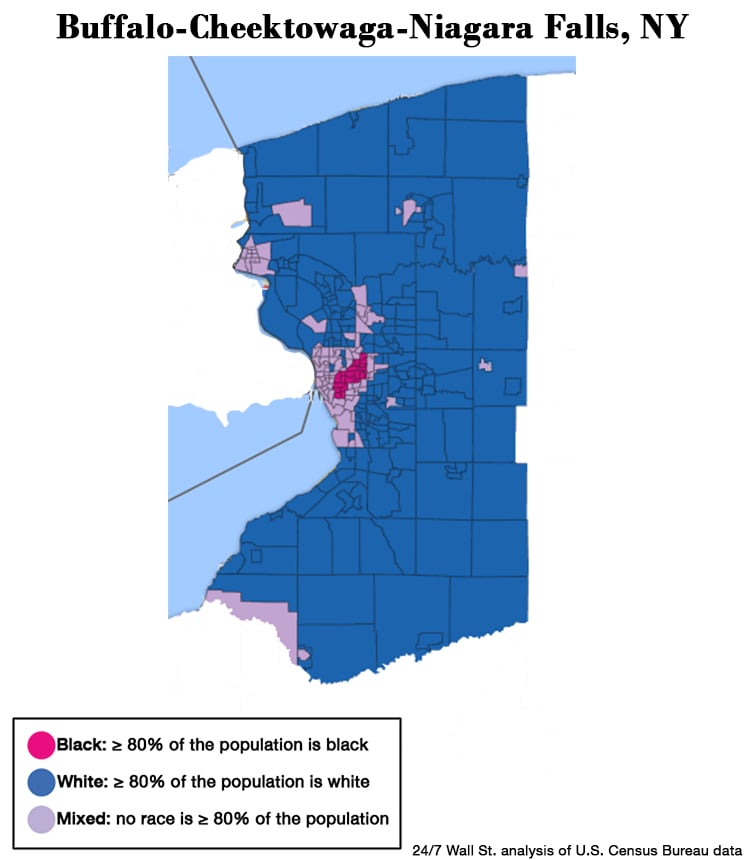 Source: Evan Comen / Google Fusion Tables
Black neighborhoods in the Buffalo area are more likely to be poor with less economic opportunity than white neighborhoods. The median income among white households is double the corresponding income among black households, and 36.9% of the metro area’s black residents live in poverty, well above the 9.3% white poverty rate. Additionally, at 14.9%, unemployment among the black labor force is well more than double the area’s 5.9% white unemployment rate.
Click image to enlarge
6. New Orleans-Metairie, LA
> Black ppl. in black neighborhoods: 43.1%
> Black population: 34.3%
> Black poverty rate: 31.0%
> White poverty rate: 10.2%
Before tragedy struck in 2005 with Hurricane Katrina, public schools in New Orleans were notoriously segregated. After the disaster, the state took over most of the schools in the city, converting them to charter schools, meaning students would not be tied to a particular school based on where they live. Still, according to a Brookings Institution report published this year, city schools became even more segregated than they were before — and the broader New Orleans metro area is one of the most segregated in the United States.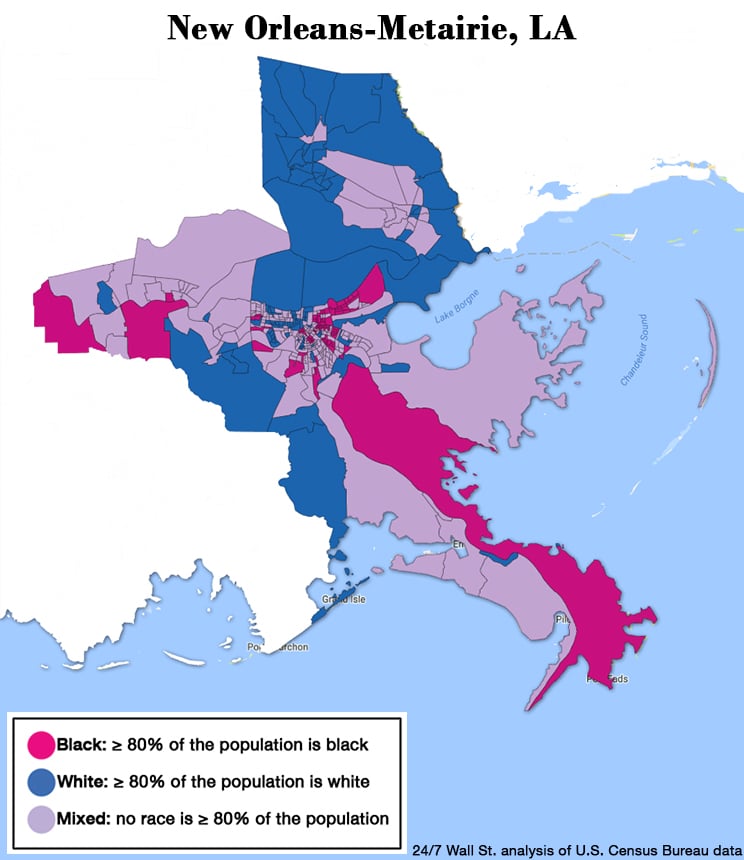 Source: Evan Comen / Google Fusion Tables
An estimated 43.1% of black families live in predominantly black neighborhoods, which are often far poorer than white neighborhoods. The typical black household in New Orleans-Metairie earns $30,249 a year, less than half the amount the typical area white household earns.
Click image to enlarge
5. Cleveland-Elyria, OH
> Black ppl. in black neighborhoods: 45.4%
> Black population: 19.7%
> Black poverty rate: 34.2%
> White poverty rate: 9.3%
White Cleveland residents began moving out of the inner-city in droves around the beginning of WWII, when they were given favorable mortgage financing deals, largely unavailable to black residents. Only about 1% of the metropolitan area’s black population lived in suburbs by 1965. The effects of racist policies that promoted the so-called “white flight” are still evident today. An estimated 45.4% of black metro area residents live in predominantly black neighborhoods, and the black homeownership rate is only 37.4%, roughly half the 74.5% white homeownership rate.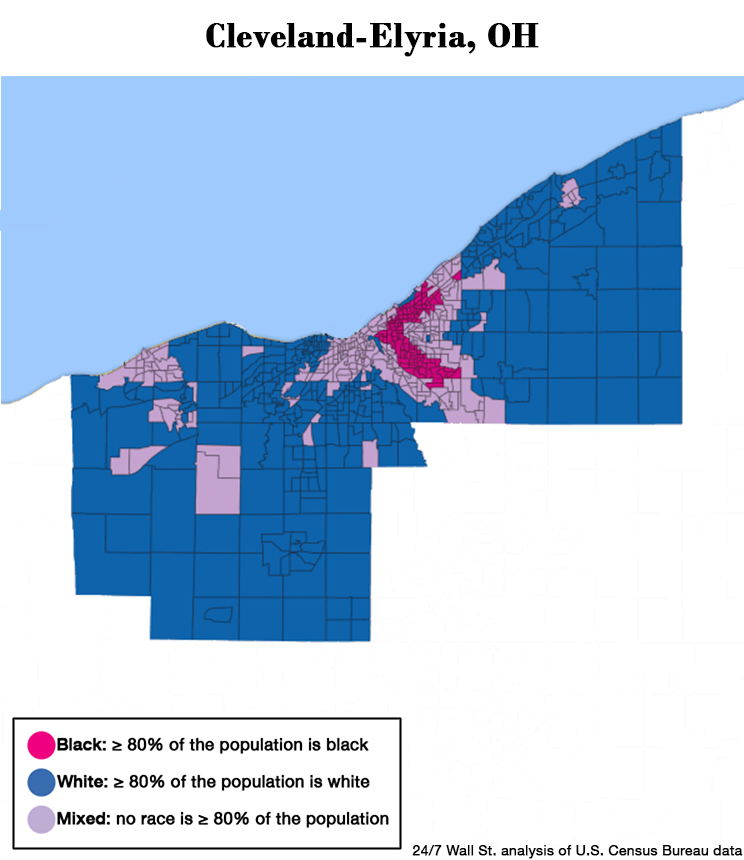 Source: Evan Comen / Google Fusion Tables
The area’s black population also appears to lack many of the economic opportunities that benefit the white population. For example, more than 1 in 5 black workers in Cleveland-Elyria are out of a job, more than three times the area’s 6.2% white unemployment rate.
Click image to enlarge
4. Memphis, TN-MS-AR
> Black ppl. in black neighborhoods: 46.4%
> Black population: 46.0%
> Black poverty rate: 28.4%
> White poverty rate: 8.6%
About 12% of the U.S. population is African American, and in none of the 100 largest metropolitan areas do black people represent a majority of the population. In Memphis, 46% of the population is black, the largest share of any major metropolitan area other than Jackson, Mississippi.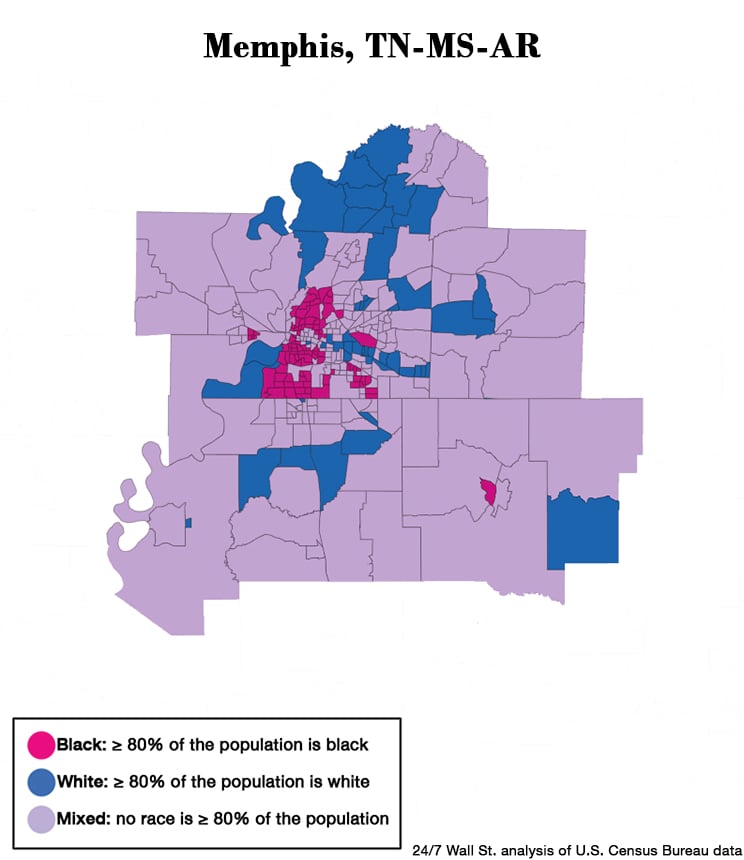 Source: Evan Comen / Google Fusion Tables
There are many negative consequences of living in high-poverty neighborhoods that extend beyond the basic struggles of poverty. Those living in areas where a bulk of residents earn poverty wages are less likely to have access to educational and employment opportunities and are far more likely to remain in poverty. In Memphis, extreme poverty affects African Americans far more than white residents. Just 2.3% of white Memphis residents live in neighborhoods where are least 40% of the population is poor, compared 20.5% of the black population.
Click image to enlarge
3. Jackson, MS
> Black ppl. in black neighborhoods: 47.7%
> Black population: 48.5%
> Black poverty rate: 30.0%
> White poverty rate: 9.5%
Jackson, Mississippi residents who are black are far more likely to live in predominantly black neighborhoods than African Americans in nearly every other U.S. metro area. The metro area’s black population is concentrated in downtown neighborhoods within the city proper. While in many of the most segregated U.S. metro areas the black population is far worse off economically it is nationwide, Jackson is an exception in many ways. For example, only 12.8% of the area’s black workers are unemployed, the third smallest black unemployment rate on this list. Additionally, Jackson’s 53.9% black homeownership rate is the highest of any major metro area. However, Jackson also has the highest white homeownership rate among large metropolitan areas, which, at nearly 80%, dwarfs that of the African American population.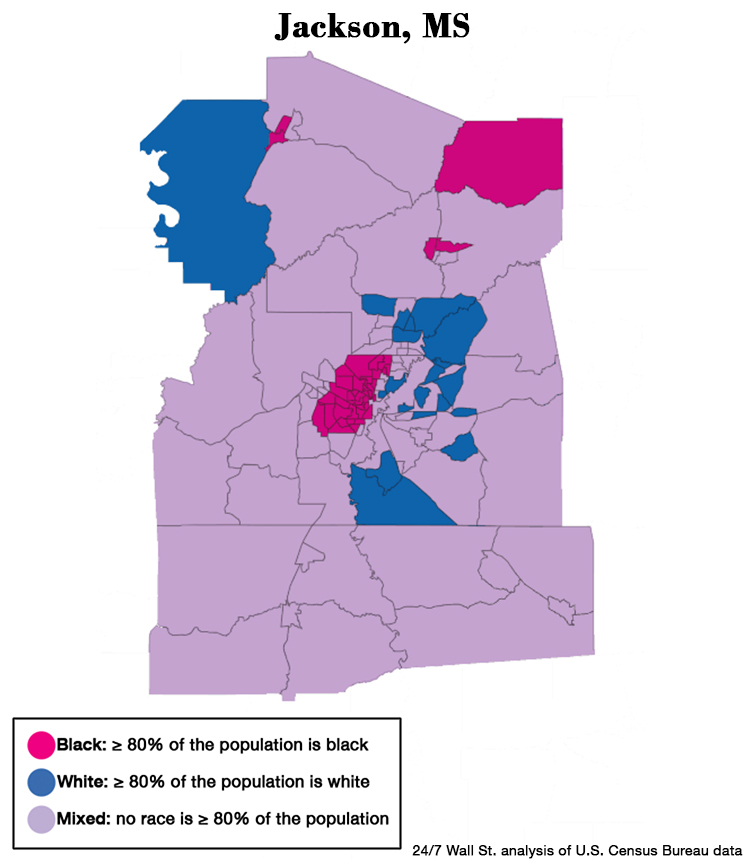 Source: Evan Comen / Google Fusion Tables
Click image to enlarge
2. Chicago-Naperville-Elgin, IL-IN-WI
> Black ppl. in black neighborhoods: 50.1%
> Black population: 16.7%
> Black poverty rate: 29.0%
> White poverty rate: 7.2%
Attracting many immigrants into America in the 19th and 20th century, the Chicago metro area has long had one of the most diverse populations of any U.S. city. In recent history, however, exclusionary zoning, white flight, and racial prejudice have intensified segregation in the city and worsened economic outcomes for minorities. Today, more than 50% of all African Americans in Chicago live in neighborhoods in which at least 4 in 5 residents are also black, the second largest share in the nation.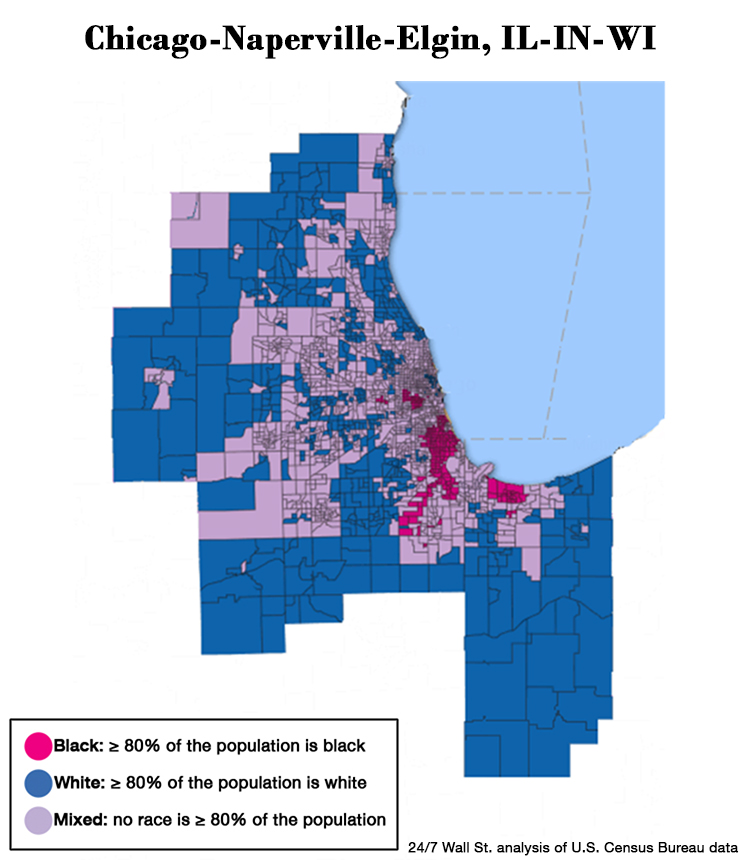 Source: Evan Comen / Google Fusion Tables
While 7.2% of white residents in Chicago live in poverty, 29.0% of black residents do. The black poverty rate is more than four times the white rate and is the second largest poverty disparity between blacks and whites of any metro area.
Click image to enlarge
1. Detroit-Warren-Dearborn, MI
> Black ppl. in black neighborhoods: 55.3%
> Black population: 22.3%
> Black poverty rate: 33.3%
> White poverty rate: 10.8%
Once the fourth largest city by population and wealthiest by income per capita, Detroit’s economic decline over the past several decades has been one of the deepest of any U.S. city. The population of Detroit’s city proper today is approximately one-third what it was at its 1950 peak of 1.8 million people, and it continues to decline at a near nation-leading pace. As wealthier, white residents left the city in search of jobs and better living conditions, many poorer, black residents could not afford to move and stayed in the declining city. Such white flight intensified segregation in the city and worsened economic outcomes for minorities. Segregation in the city is delineated by 8 Mile Road, a beltway that acts as a physical and cultural divide between the city’s wealthy, white population and its poor, African American communities. Today, 55.3% of Detroit’s African American population lives in neighborhoods where at least 4 in 5 residents are black, the largest share of any U.S. metro area. Source: Evan Comen / Google Fusion Tables
Click image to enlarge
Detailed Findings:
The United States has a long and troubling history of race-based housing segregation. Until the Fair Housing act was passed in 1968, municipalities and private realtors were able to legally force African Americans to live in separate neighborhoods. The long-term consequences of these policies, coupled with the continuing trend of white flight, has entrenched segregation and the resulting inequalities in U.S. metropolitan areas.
There are many negative effects of ongoing segregated housing in U.S. metropolitan areas. For example, black families in America tend to have lower incomes than white families, and so largely black neighborhoods are far more likely to be highly impoverished. In the largest metropolitan areas, 25% of the black population lives in poverty, compared to 9% of whites. In some of the cities on this list, more than one-third of black residents live in poverty.
A number of studies have shown that people living in highly poor neighborhoods suffer from negative consequences that extend beyond poverty. Because of both the higher likelihood that African Americans live in poverty and because of racial segregation in cities, the concentrated poverty rate in the largest metro areas is virtually nonexistent for whites — just 1.4% of the white population lives in highly poor neighborhoods. Meanwhile, 12.4% of black residents live in such neighborhoods.
In these highly segregated cities, black residents are even more likely to live in extreme concentrated poverty. In seven of the cities on this list, more than 20% of black residents live in neighborhoods where at least 40% of the population is poor. In Detroit, the most segregated major metropolitan area in the country, 1 in 3 black residents live in highly impoverished neighborhoods.
Another serious consequence of segregation in these metropolitan areas is the effect it can have on the public school system. School funding is largely determined by property tax revenues. In metropolitan areas with low-income black neighborhoods and affluent white areas, the white schools will likely be much better funded. This means the children living in black neighborhoods face much greater obstacles for success.
Not surprisingly, the less racially integrated metropolitan areas in particular have poor educational outcomes for African Americans. In New Orleans, for example, 90.8% of white adults have a high school diploma, while the high school attainment rate for black adults is 79.6%.
Methodology:
To identify America’s most segregated cities, 24/7 Wall St. calculated the percentage of metropolitan area black residents who live in predominantly black census tracts — statistical subdivisions with an average of about 4,000 people. The greater the share of black metro residents living in the area’s racially homogenous neighborhoods, the greater the degree of segregation. We only considered census tracts with at least 500 residents in the 100 largest metropolitan areas. Population data are based on five-year estimates through 2015 from the U.S. Census Bureau’s American Community Survey. For the purpose of this story, we only considered segregation of white and black populations.
Because a certain level of racial diversity is necessary for segregation to be measured with confidence, only 74 of the 100 largest metro areas could be compared. The remaining 26 were not considered because they do not contain any predominantly black census tracts.
While racial segregation was the primary focus of our analysis, segregation by income is also an important component. Our analysis included the share of a metro area’s population living in extreme poverty — census tracts with poverty rates higher than 40%. This portion of our analysis excluded tracts with fewer than 500 residents, as well as tracts where more than 50% of the population was enrolled in either undergraduate or graduate school.
We also reviewed median household income, poverty rates, educational attainment rates, unemployment rates, and homeownership rates among black and white populations in each metro area from the ACS. All data are five-year estimates.
Are you ready for retirement? Planning for retirement can be overwhelming, that’s why it could be a good idea to speak to a fiduciary financial advisor about your goals today.
Start by taking this retirement quiz right here from SmartAsset that will match you with up to 3 financial advisors that serve your area and beyond in 5 minutes. Smart Asset is now matching over 50,000 people a month.
Click here now to get started.
Thank you for reading! Have some feedback for us?
Contact the 24/7 Wall St. editorial team.

