States That Are Falling Apart
August 18, 2017 by Sam StebbinsThe U.S. economy is the largest in the world, topping a GDP of $18.6 trillion in 2016. An economic powerhouse as massive and diversified as the United States depends on a network of highways, bridges, airports, and dams to thrive. And while the economy has grown every year since the recession officially ended in 2009, our nation’s infrastructure is not fairing as well.
An estimated 17% of American dams — 15,500 in total — are categorized as high hazard potential, meaning their failure would almost certainly result in loss of life. Meanwhile, 11.2% of roads are in poor condition, which ultimately lead to vehicle damage and traffic delays. Vehicle repairs, fuel, and wasted time cost motorists an estimated $272 billion in 2014. Perhaps most troubling is the state of disrepair of bridges across the country as tens of thousands are classified as structurally deficient by the federal government.
Infrastructure repair is one rare issue that often garners bipartisan support in Washington. While President Donald Trump previously proposed spending $1 trillion on fixing the country’s infrastructure, he recently abandoned his plans to form a Council on Infrastructure.
The estimated cost of repairing roads, bridges, and dams in the United States is projected to top $2.4 trillion by 2025. Other necessary infrastructure repairs, including railways, airports, and wastewater infrastructure would cost an additional $2.2 trillion. 24/7 Wall St. created an index using the share of bridges, roads, and dams that are in a state of disrepair or potentially hazardous, to identify the states with the best and worst infrastructure.
Click here to see the states that are falling apart.
Click here to see our detailed findings and methodology.
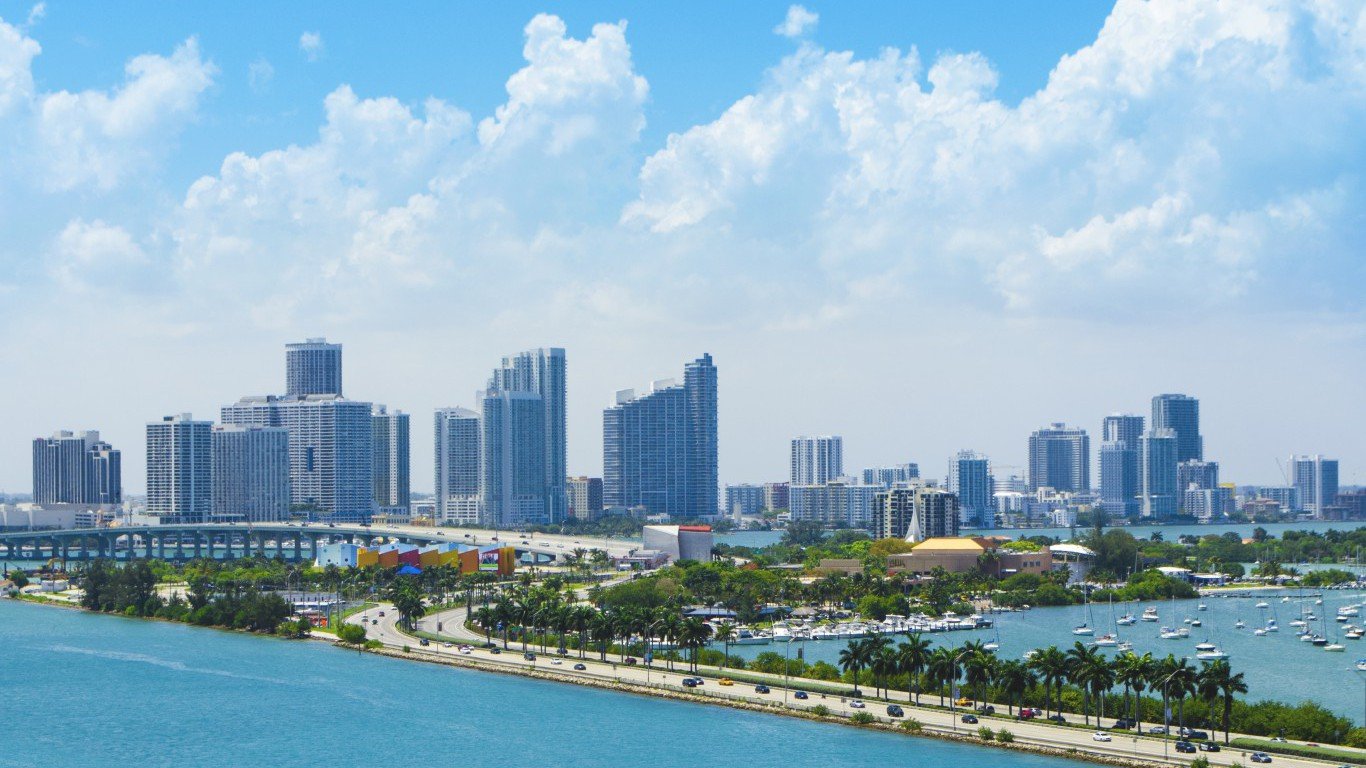
50. Florida
> Roads in poor condition: 3.2% (3rd lowest)
> Deficient bridges: 2.1% (3rd lowest)
> Dams at high hazard risk: 6.3% (9th lowest)
> Highway spending as pct. of total: 8.7% (8th highest)
[in-text-ad]

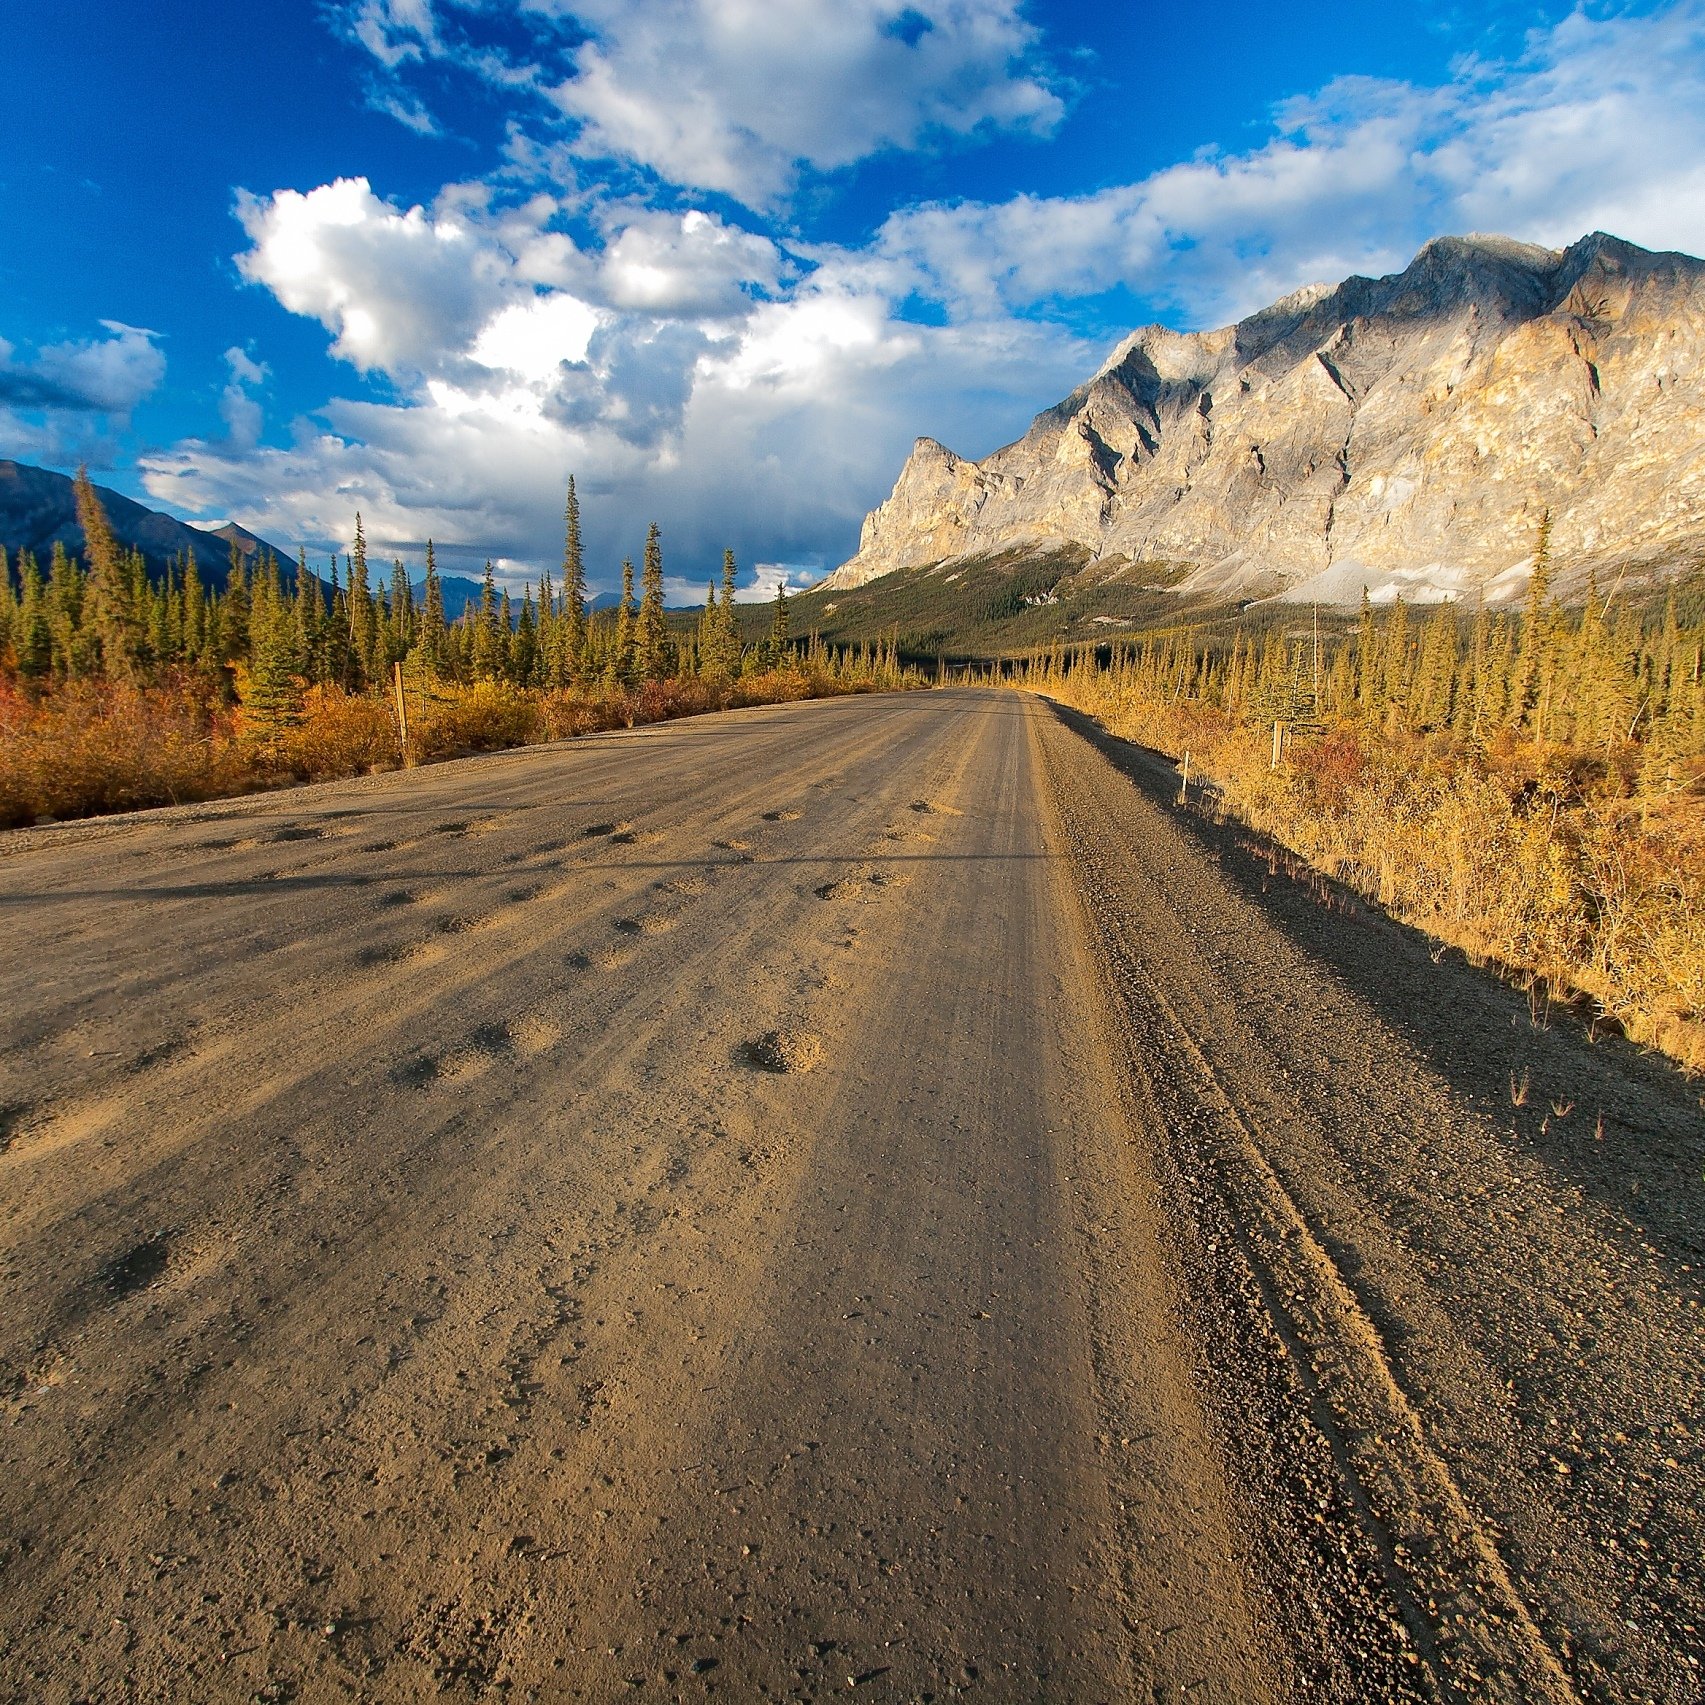
49. Kansas
> Roads in poor condition: 2.2% (the lowest)
> Deficient bridges: 8.6% (25th highest)
> Dams at high hazard risk: 4.3% (3rd lowest)
> Highway spending as pct. of total: 7.2% (18th highest)
 24/7 Wall St.
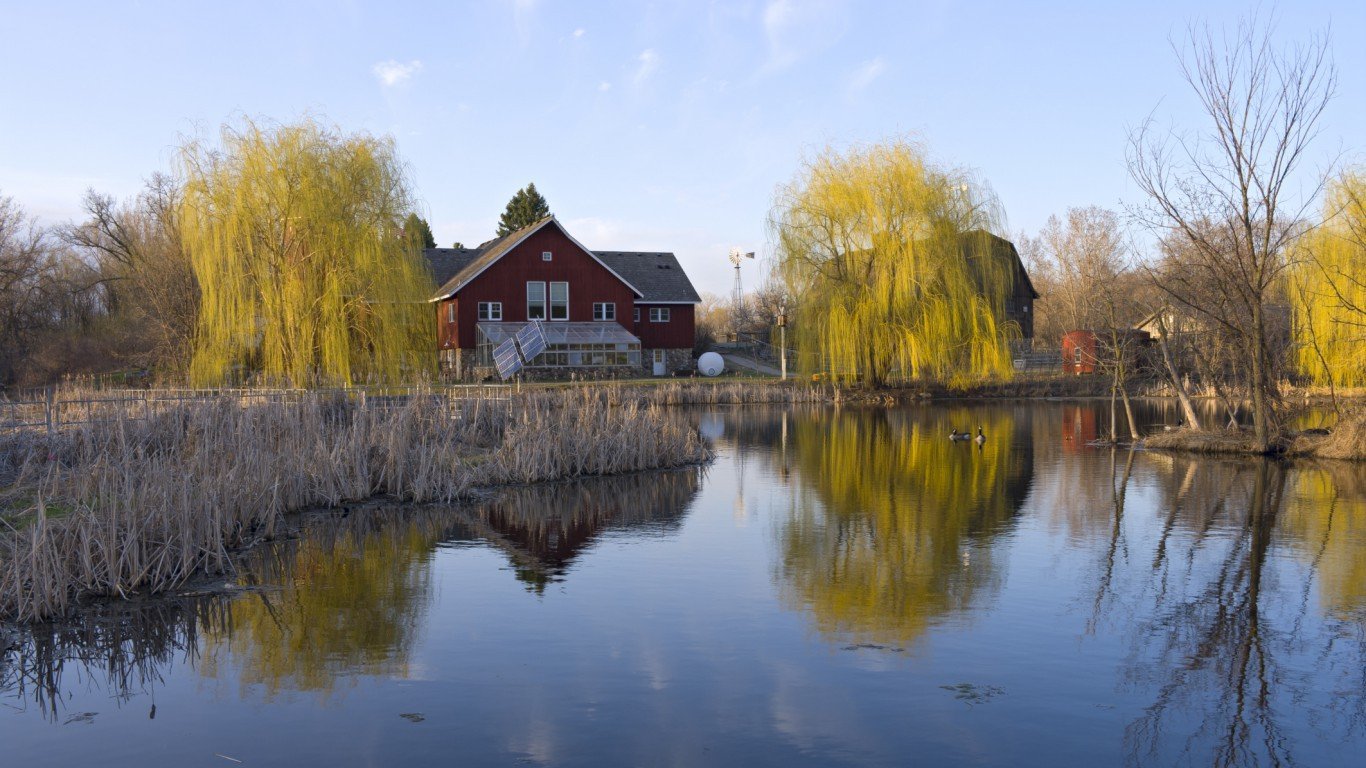
48. Minnesota
> Roads in poor condition: 6.6% (22nd lowest)
> Deficient bridges: 6.0% (16th lowest)
> Dams at high hazard risk: 5.0% (5th lowest)
> Highway spending as pct. of total: 6.9% (22nd highest)
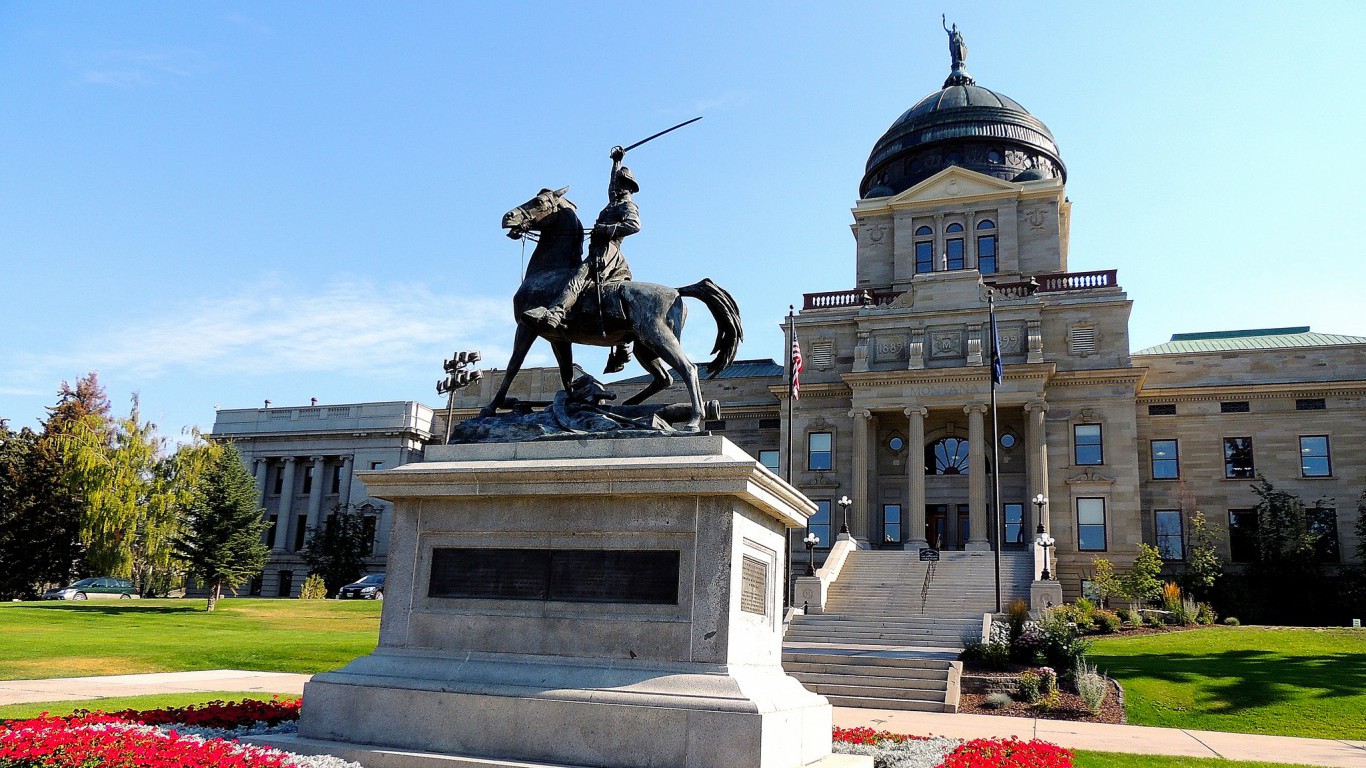
47. Montana
> Roads in poor condition: 4.0% (10th lowest)
> Deficient bridges: 8.8% (23rd highest)
> Dams at high hazard risk: 6.6% (10th lowest)
> Highway spending as pct. of total: 10.2% (3rd highest)
[in-text-ad-2]

46. Georgia
> Roads in poor condition: 3.9% (8th lowest)
> Deficient bridges: 4.7% (6th lowest)
> Dams at high hazard risk: 11.0% (15th lowest)
> Highway spending as pct. of total: 4.1% (7th lowest)
45. Wyoming
> Roads in poor condition: 3.4% (6th lowest)
> Deficient bridges: 11.0% (16th highest)
> Dams at high hazard risk: 6.0% (8th lowest)
> Highway spending as pct. of total: 8.5% (10th highest)
[in-text-ad]
44. Alabama
> Roads in poor condition: 3.2% (4th lowest)
> Deficient bridges: 7.6% (21st lowest)
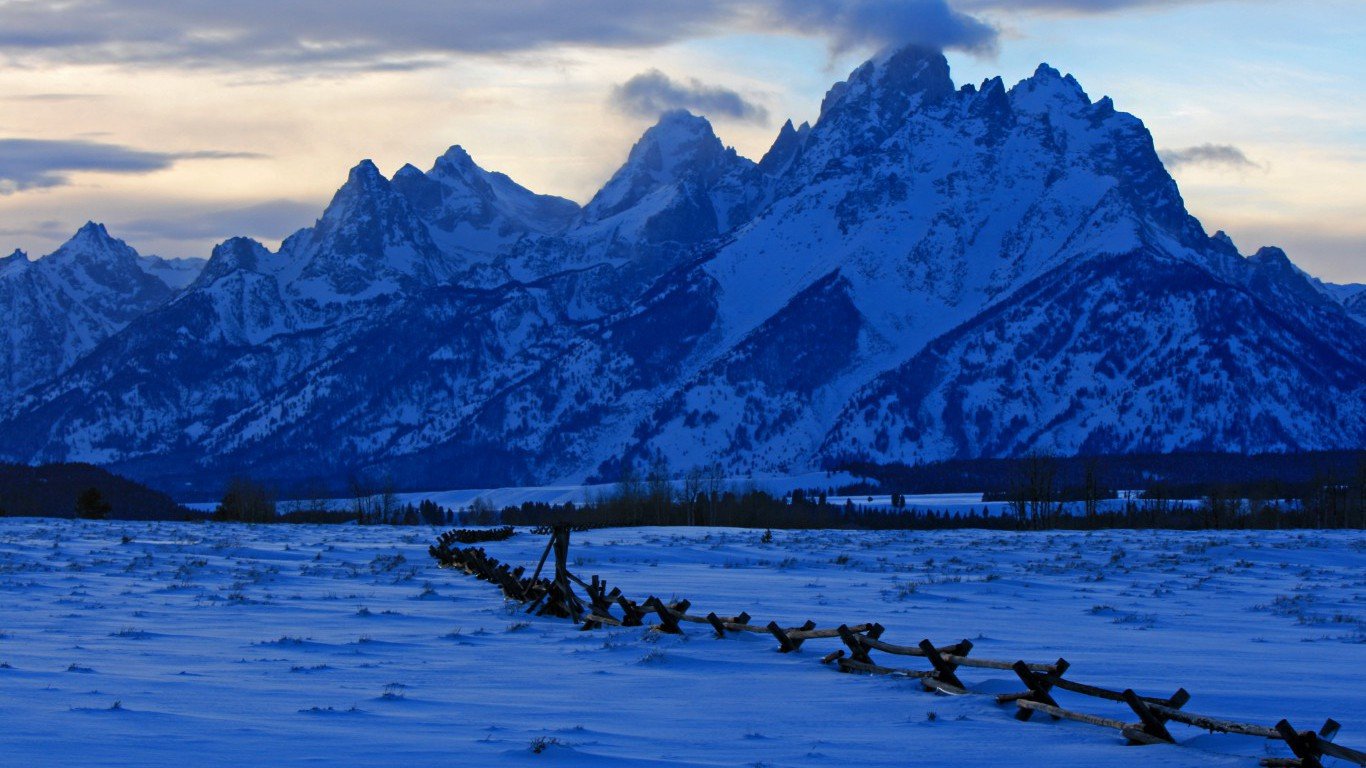
> Dams at high hazard risk: 10.0% (14th lowest)
> Highway spending as pct. of total: 6.2% (25th lowest)

43. North Dakota
> Roads in poor condition: 3.2% (2nd lowest)
> Deficient bridges: 15.0% (7th highest)
> Dams at high hazard risk: 5.5% (6th lowest)
> Highway spending as pct. of total: 14.8% (the highest)

42. South Carolina
> Roads in poor condition: 4.9% (13th lowest)
> Deficient bridges: 10.3% (17th highest)
> Dams at high hazard risk: 8.6% (11th lowest)
> Highway spending as pct. of total: 4.1% (6th lowest)
[in-text-ad-2]

41. Nebraska
> Roads in poor condition: 6.7% (24th lowest)
> Deficient bridges: 15.4% (6th highest)
> Dams at high hazard risk: 4.8% (4th lowest)
> Highway spending as pct. of total: 7.4% (16th highest)
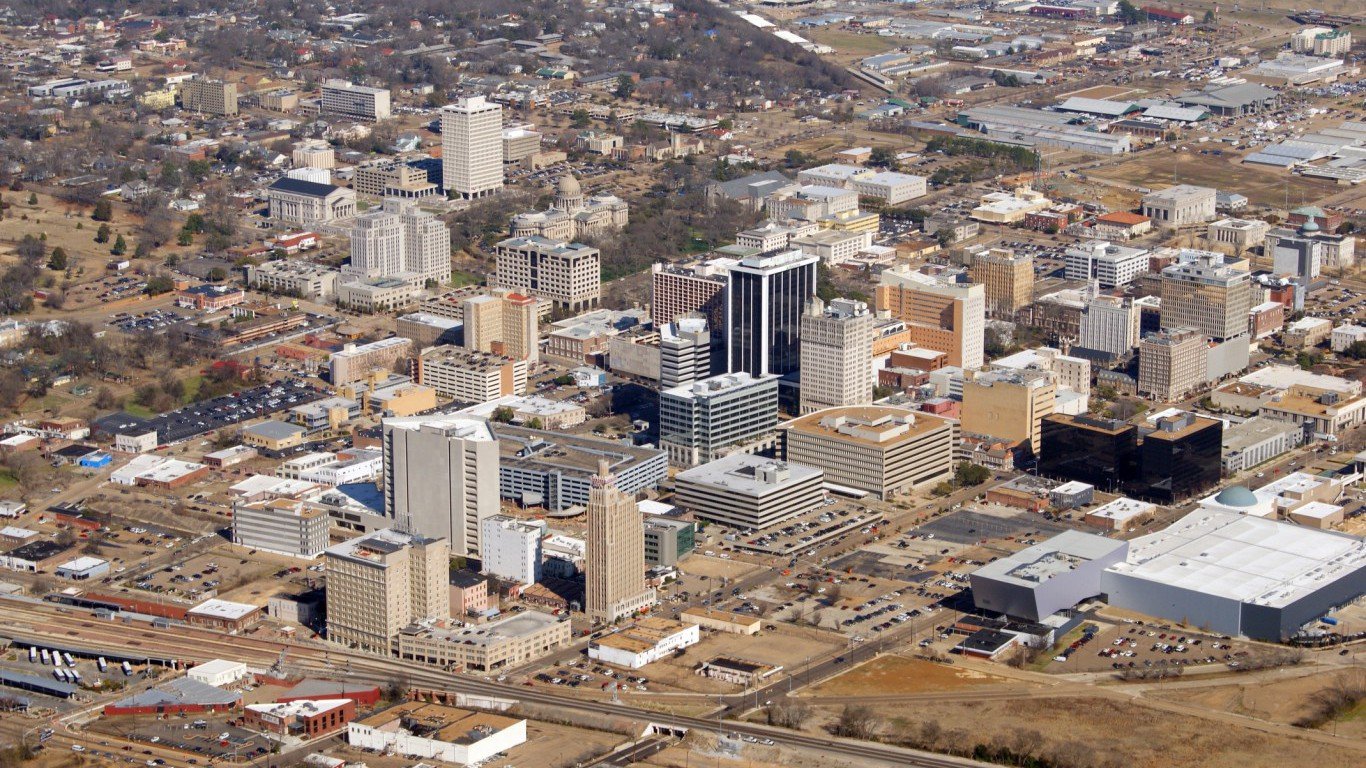
40. Mississippi
> Roads in poor condition: 9.2% (21st highest)
> Deficient bridges: 12.3% (12th highest)
> Dams at high hazard risk: 5.8% (7th lowest)
> Highway spending as pct. of total: 6.3% (24th highest)
[in-text-ad]
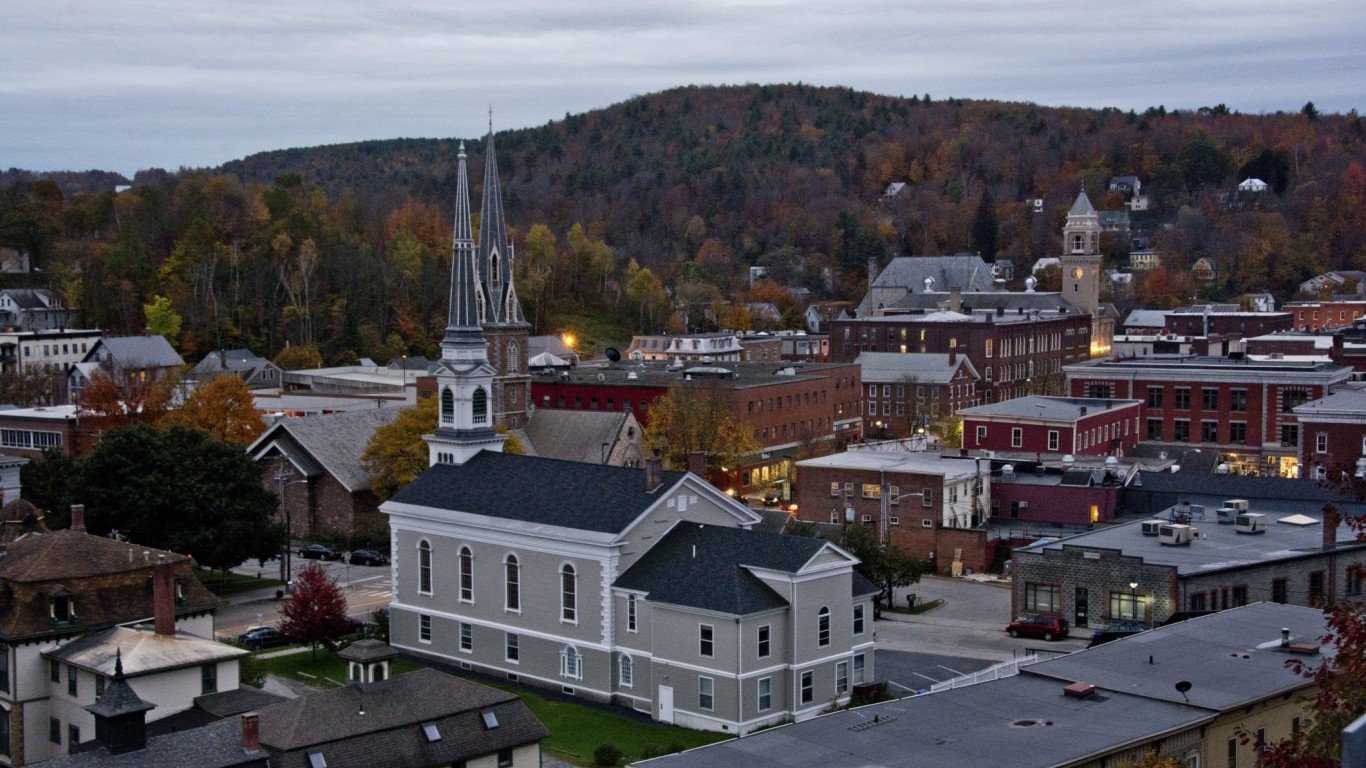
39. Vermont
> Roads in poor condition: 5.8% (18th lowest)
> Deficient bridges: 5.6% (12th lowest)
> Dams at high hazard risk: 16.2% (20th lowest)
> Highway spending as pct. of total: 7.8% (15th highest)
 24/7 Wall St.
38. Texas
> Roads in poor condition: 10.4% (19th highest)
> Deficient bridges: 1.7% (2nd lowest)
> Dams at high hazard risk: 16.7% (21st lowest)
> Highway spending as pct. of total: 6.1% (24th lowest)
37. South Dakota
> Roads in poor condition: 6.4% (19th lowest)
> Deficient bridges: 19.6% (4th highest)
> Dams at high hazard risk: 3.5% (2nd lowest)
> Highway spending as pct. of total: 12.8% (2nd highest)
[in-text-ad-2]

36. Oregon
> Roads in poor condition: 6.6% (21st lowest)
> Deficient bridges: 5.3% (10th lowest)
> Dams at high hazard risk: 18.0% (23rd lowest)
> Highway spending as pct. of total: 4.2% (9th lowest)
35. Arkansas
> Roads in poor condition: 8.3% (23rd highest)
> Deficient bridges: 6.3% (17th lowest)
> Dams at high hazard risk: 15.2% (18th lowest)
> Highway spending as pct. of total: 6.8% (23rd highest)
[in-text-ad]
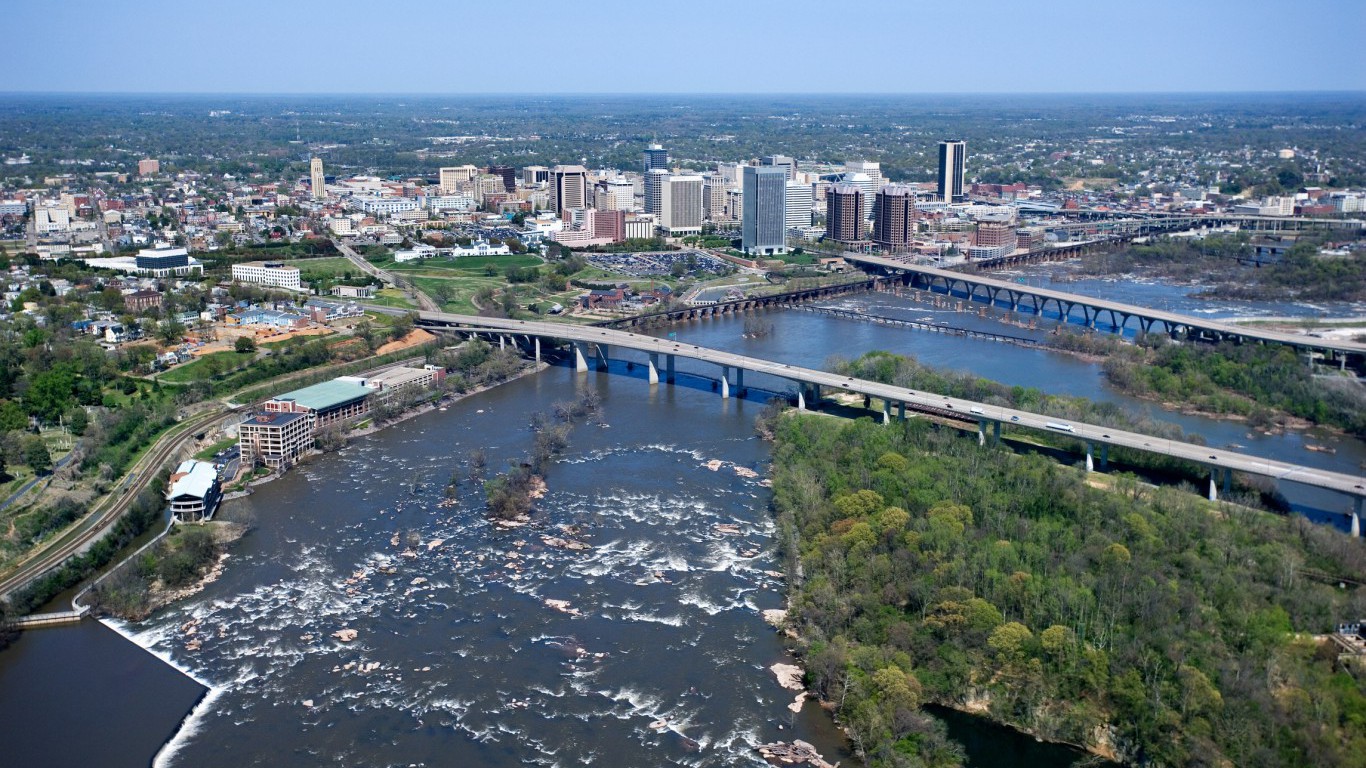
34. Virginia
> Roads in poor condition: 8.7% (22nd highest)
> Deficient bridges: 6.7% (19th lowest)
> Dams at high hazard risk: 16.0% (19th lowest)
> Highway spending as pct. of total: 9.2% (5th highest)
 24/7 Wall St.
33. Tennessee
> Roads in poor condition: 4.9% (14th lowest)
> Deficient bridges: 5.0% (9th lowest)
> Dams at high hazard risk: 22.2% (25th highest)
> Highway spending as pct. of total: 4.9% (14th lowest)

32. Maine
> Roads in poor condition: 6.5% (20th lowest)
> Deficient bridges: 14.4% (9th highest)
> Dams at high hazard risk: 11.6% (16th lowest)
> Highway spending as pct. of total: 7.3% (17th highest)
[in-text-ad-2]
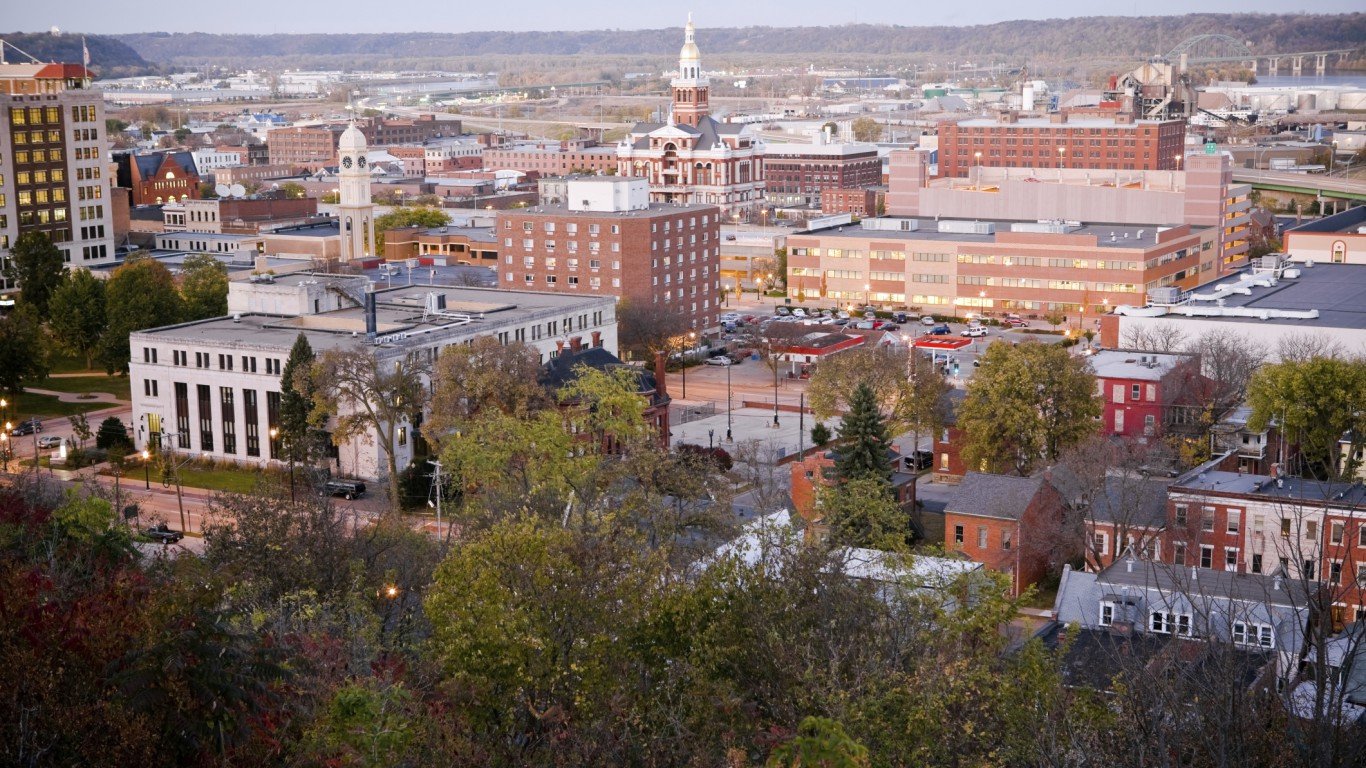
31. Iowa
> Roads in poor condition: 10.1% (20th highest)
> Deficient bridges: 20.5% (2nd highest)
> Dams at high hazard risk: 2.6% (the lowest)
> Highway spending as pct. of total: 9.1% (6th highest)
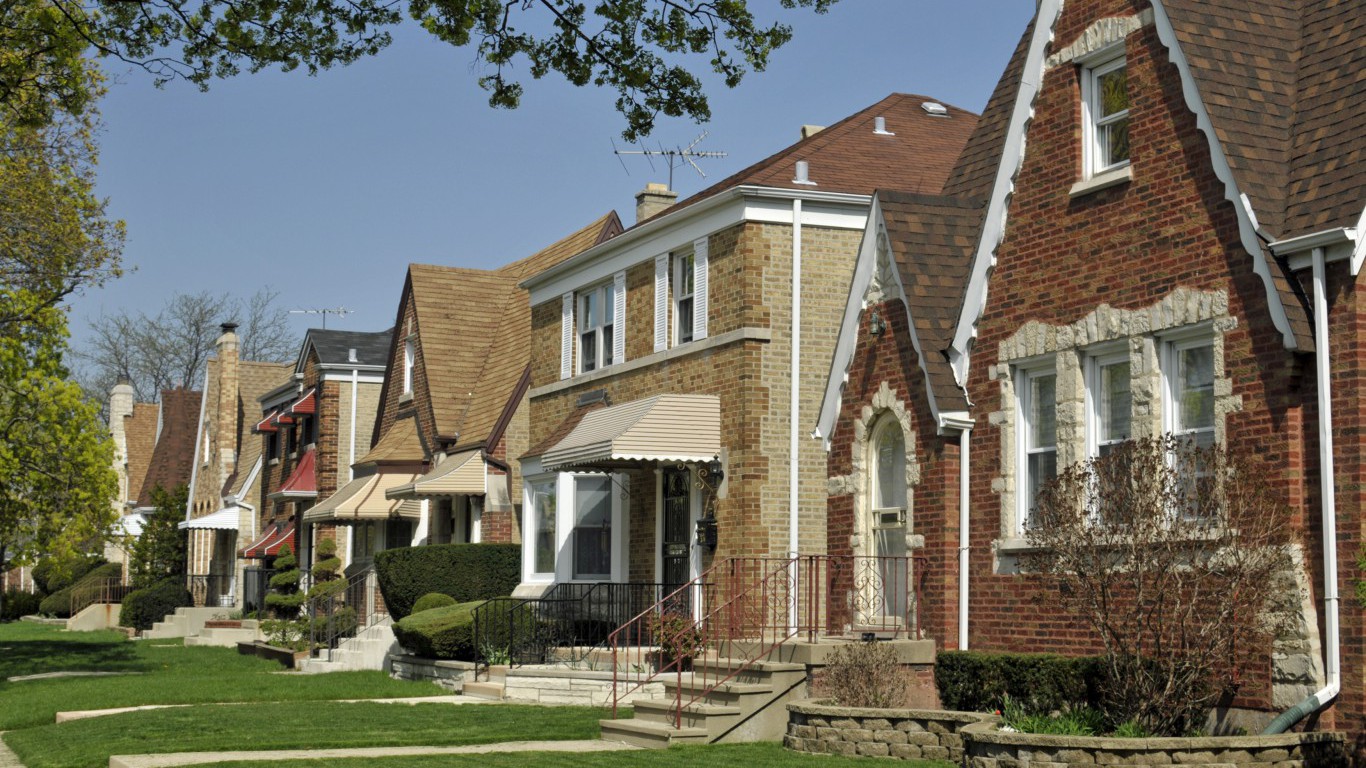
30. Illinois
> Roads in poor condition: 10.5% (17th highest)
> Deficient bridges: 8.4% (25th lowest)
> Dams at high hazard risk: 14.4% (17th lowest)
> Highway spending as pct. of total: 8.0% (13th highest)
[in-text-ad]
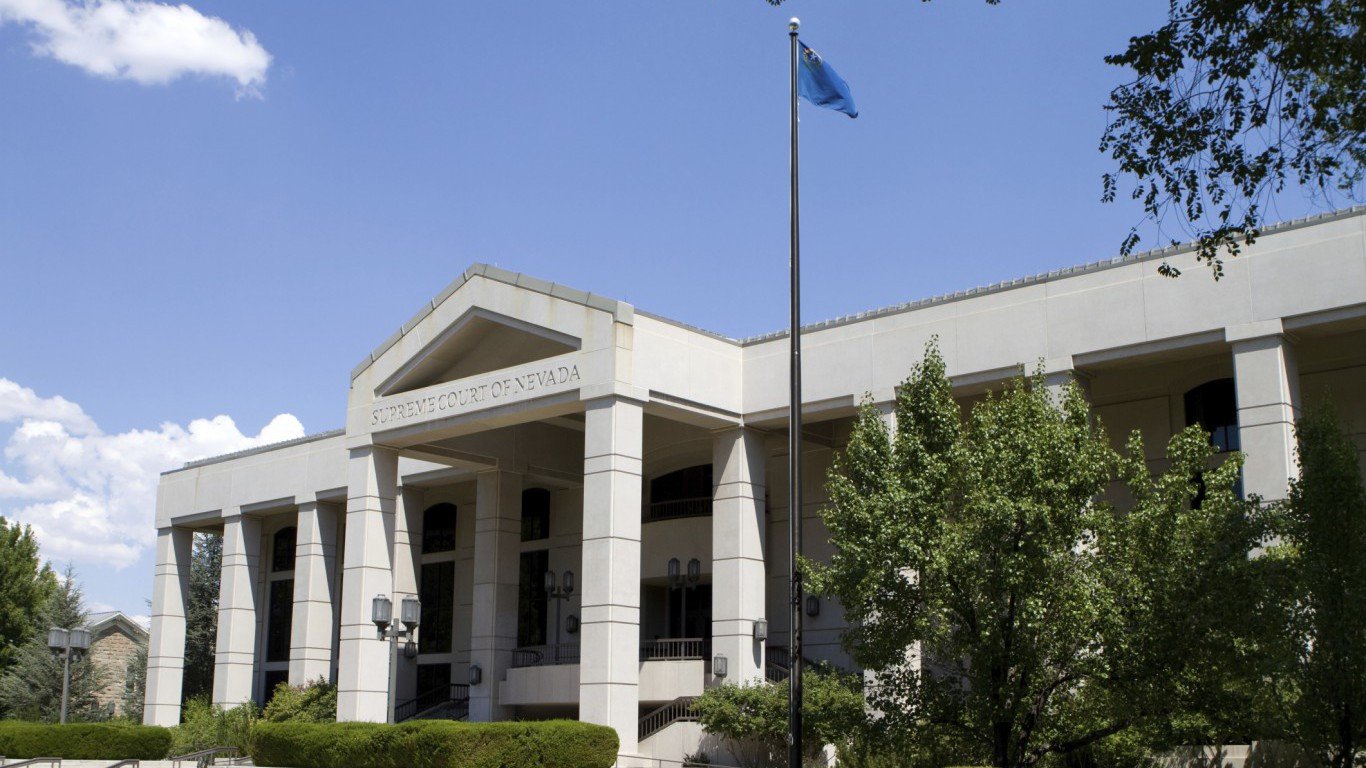
29. Nevada
> Roads in poor condition: 3.6% (7th lowest)
> Deficient bridges: 1.6% (the lowest)
> Dams at high hazard risk: 28.2% (14th highest)
> Highway spending as pct. of total: 4.2% (8th lowest)
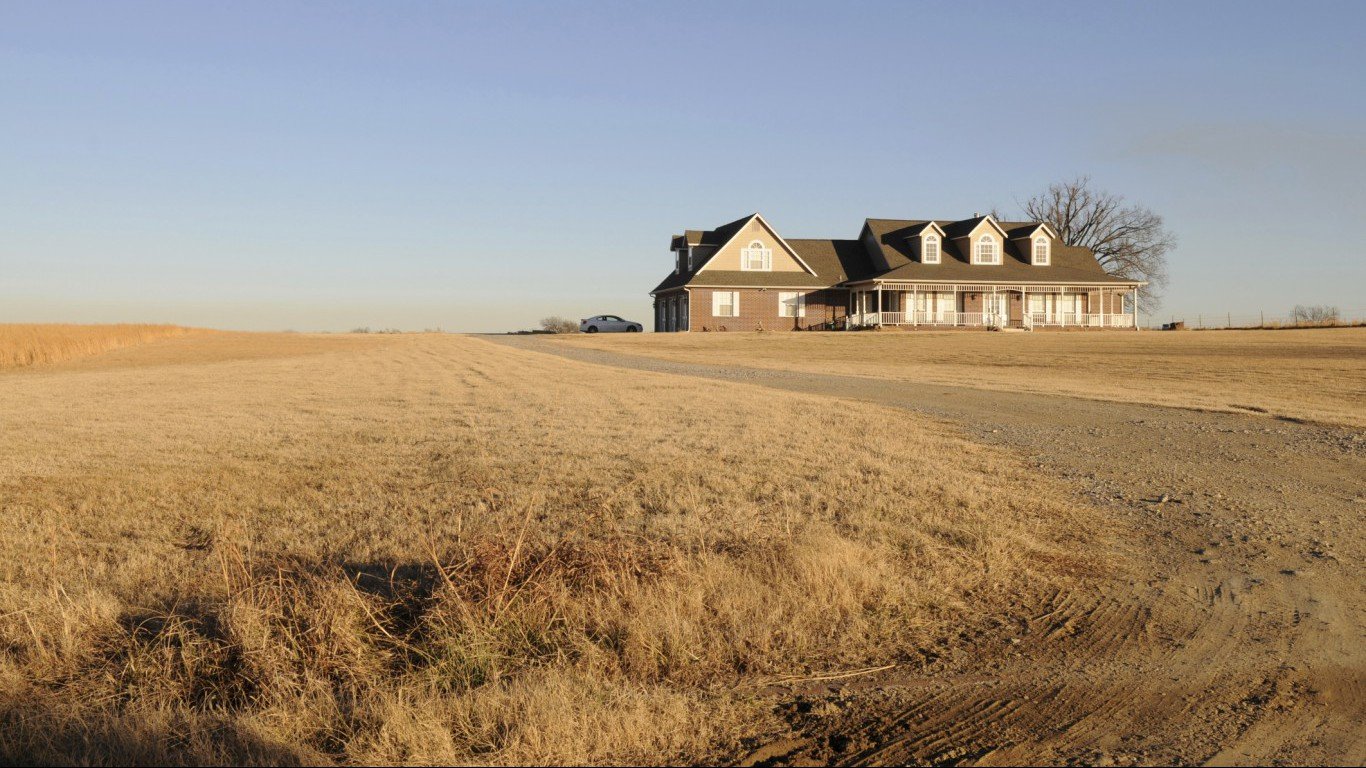
28. Oklahoma
> Roads in poor condition: 11.3% (16th highest)
> Deficient bridges: 15.0% (8th highest)
> Dams at high hazard risk: 8.8% (13th lowest)
> Highway spending as pct. of total: 8.7% (7th highest)

27. Kentucky
> Roads in poor condition: 3.3% (5th lowest)
> Deficient bridges: 8.1% (24th lowest)
> Dams at high hazard risk: 24.8% (19th highest)
> Highway spending as pct. of total: 8.2% (11th highest)
[in-text-ad-2]
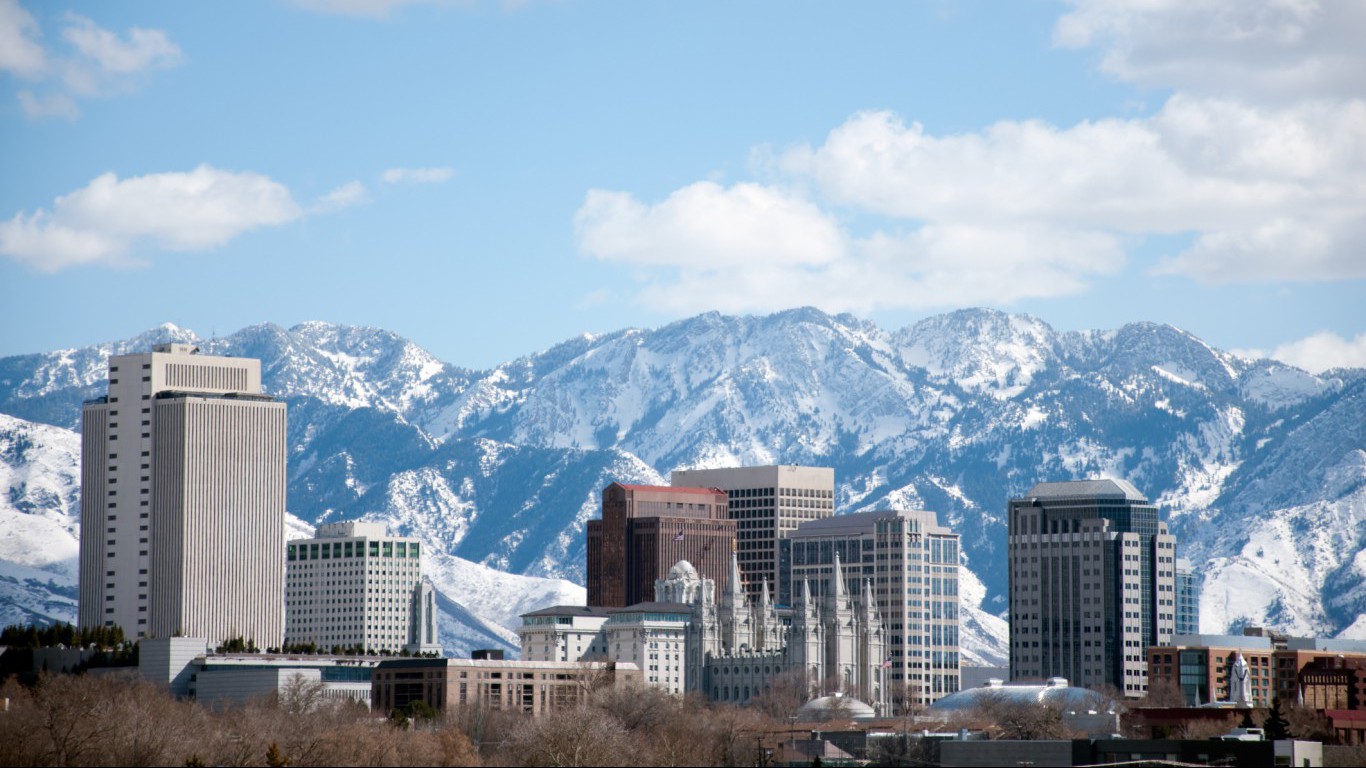
26. Utah
> Roads in poor condition: 5.5% (16th lowest)
> Deficient bridges: 3.1% (5th lowest)
> Dams at high hazard risk: 29.1% (12th highest)
> Highway spending as pct. of total: 5.1% (16th lowest)

25. Idaho
> Roads in poor condition: 4.4% (12th lowest)
> Deficient bridges: 9.2% (21st highest)
> Dams at high hazard risk: 24.1% (21st highest)
> Highway spending as pct. of total: 8.0% (12th highest)
[in-text-ad]

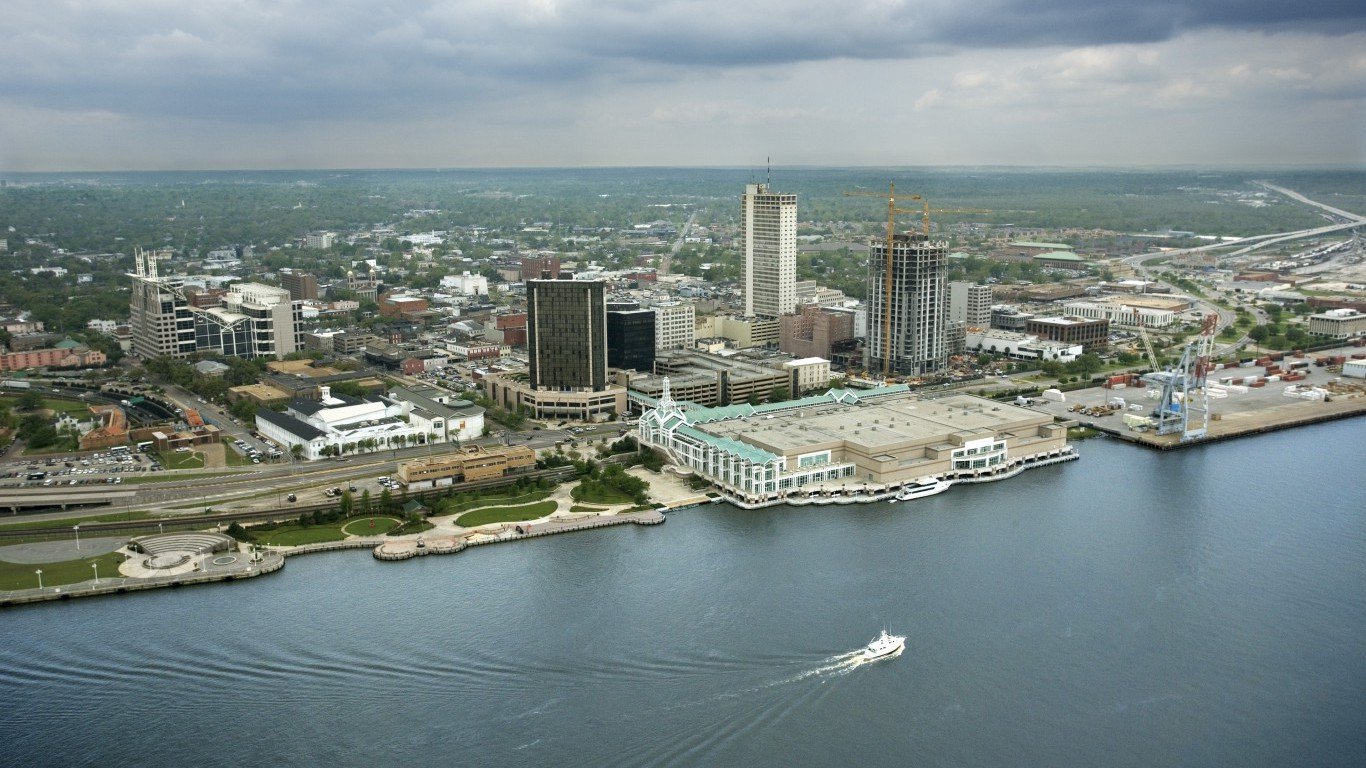
24. Louisiana
> Roads in poor condition: 16.4% (11th highest)
> Deficient bridges: 13.5% (10th highest)
> Dams at high hazard risk: 8.6% (12th lowest)
> Highway spending as pct. of total: 5.2% (18th lowest)
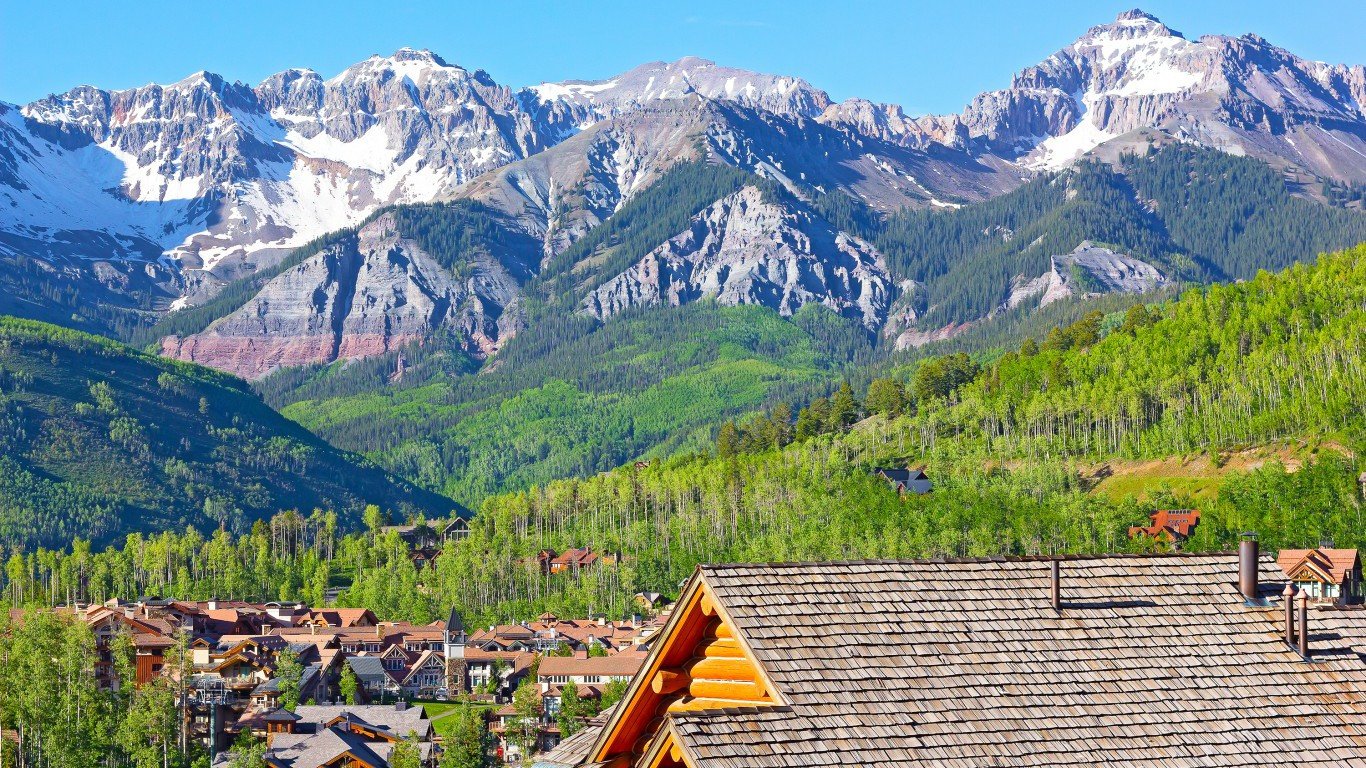
23. Colorado
> Roads in poor condition: 10.5% (18th highest)
> Deficient bridges: 5.7% (14th lowest)
> Dams at high hazard risk: 24.5% (20th highest)
> Highway spending as pct. of total: 4.9% (15th lowest)
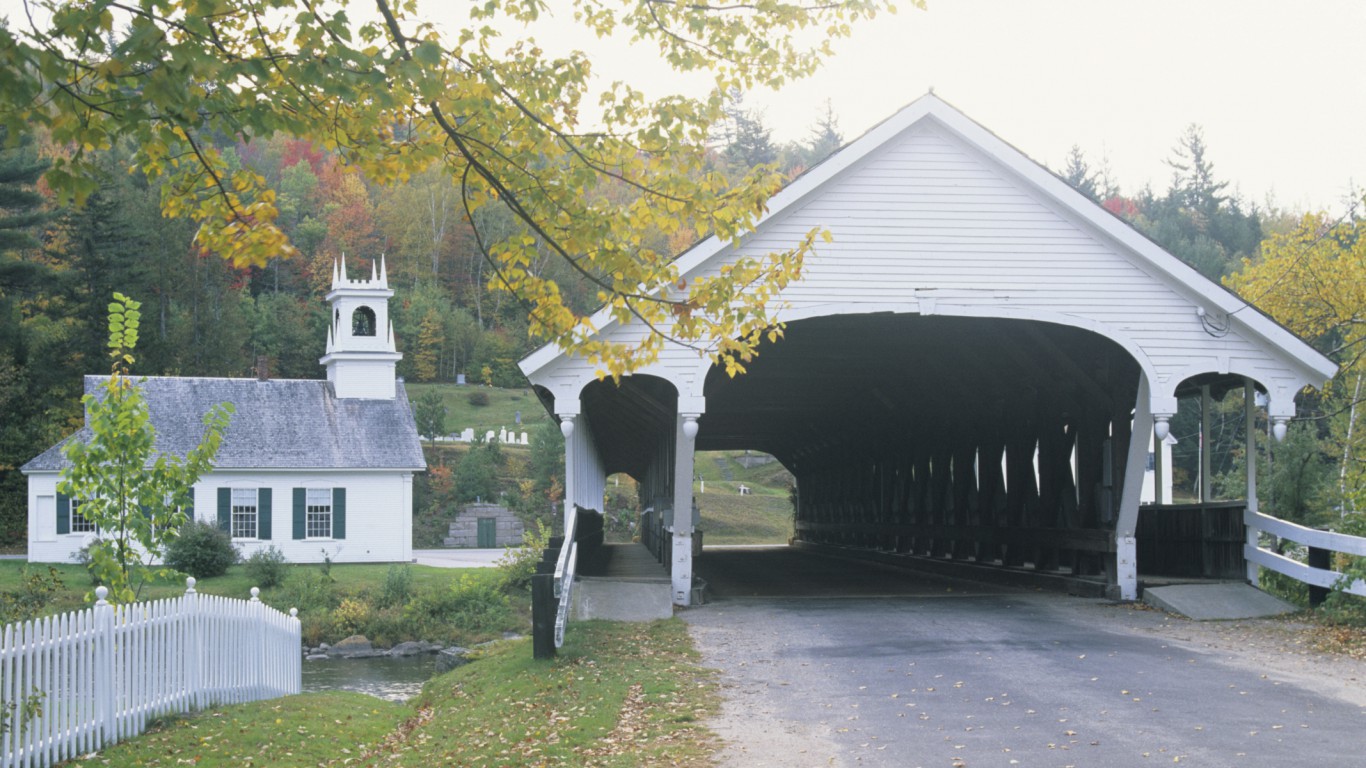
22. New Hampshire
> Roads in poor condition: 8.2% (24th highest)
> Deficient bridges: 12.2% (13th highest)
> Dams at high hazard risk: 21.2% (25th lowest)
> Highway spending as pct. of total: 7.1% (19th highest)
[in-text-ad-2]

21. Michigan
> Roads in poor condition: 15.0% (13th highest)
> Deficient bridges: 11.1% (14th highest)
> Dams at high hazard risk: 16.9% (22nd lowest)
> Highway spending as pct. of total: 3.7% (4th lowest)
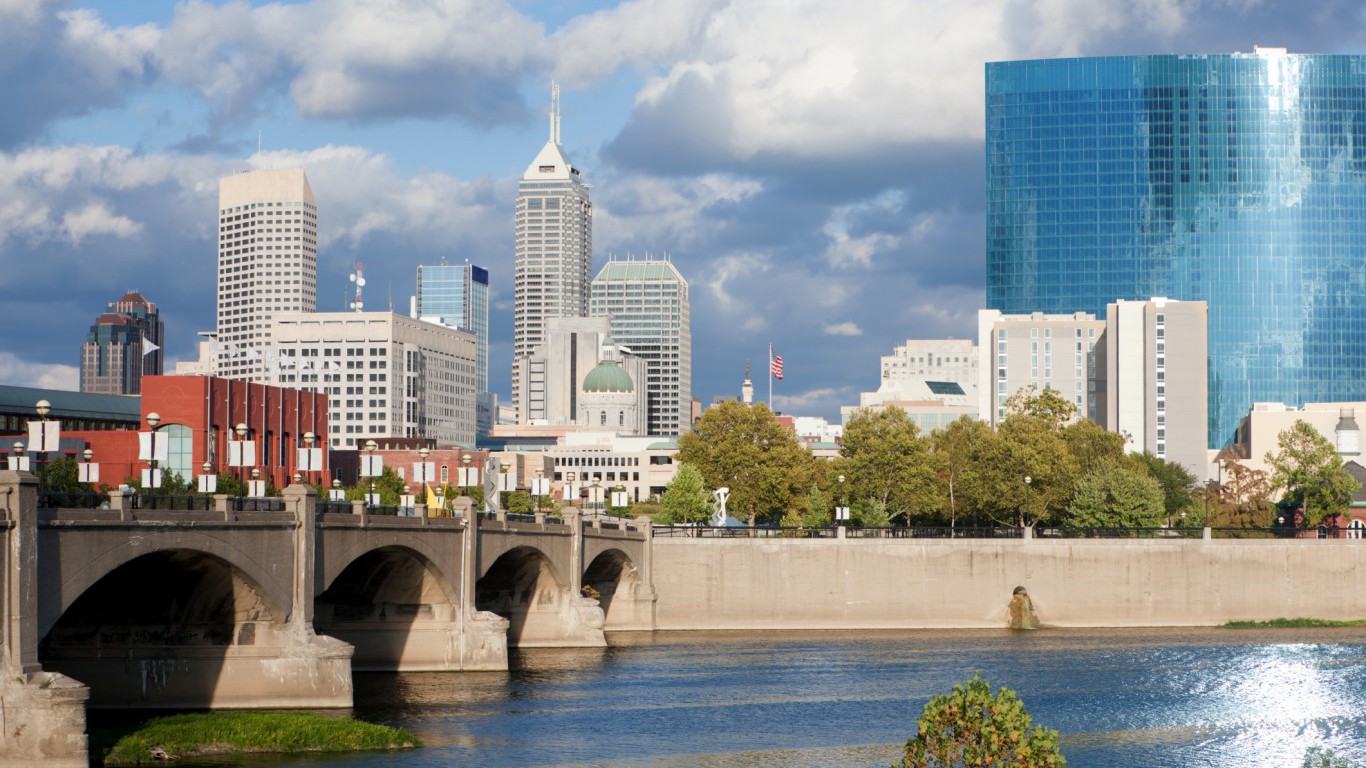
20. Indiana
> Roads in poor condition: 6.8% (25th lowest)
> Deficient bridges: 8.0% (22nd lowest)
> Dams at high hazard risk: 28.7% (13th highest)
> Highway spending as pct. of total: 6.9% (21st highest)
[in-text-ad]

19. Missouri
> Roads in poor condition: 4.1% (11th lowest)
> Deficient bridges: 13.1% (11th highest)
> Dams at high hazard risk: 27.2% (17th highest)
> Highway spending as pct. of total: 4.5% (12th lowest)
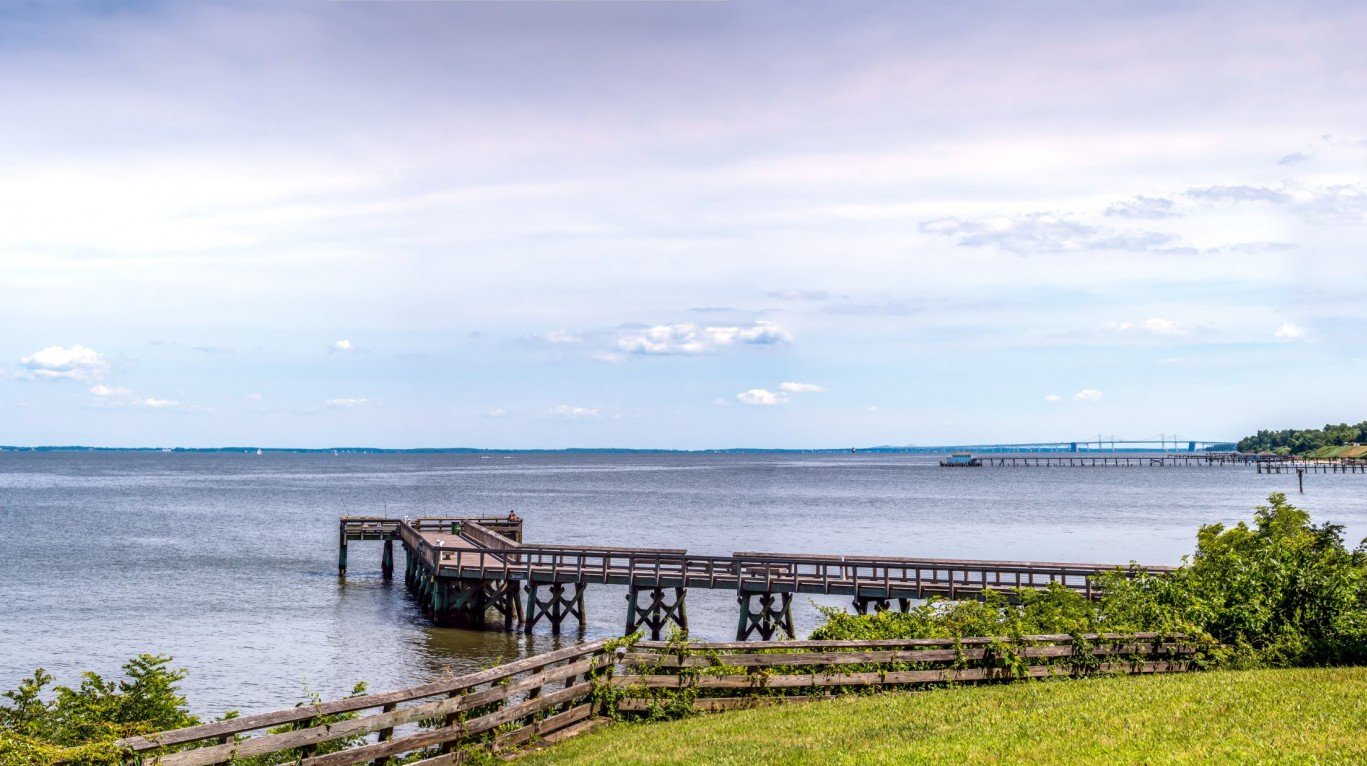
18. Maryland
> Roads in poor condition: 16.8% (9th highest)
> Deficient bridges: 5.8% (15th lowest)
> Dams at high hazard risk: 22.8% (23rd highest)
> Highway spending as pct. of total: 5.7% (22nd lowest)

17. Wisconsin
> Roads in poor condition: 16.7% (10th highest)
> Deficient bridges: 8.7% (24th highest)
> Dams at high hazard risk: 20.3% (24th lowest)
> Highway spending as pct. of total: 6.2% (25th highest)
[in-text-ad-2]

16. Ohio
> Roads in poor condition: 13.0% (15th highest)
> Deficient bridges: 6.9% (20th lowest)
> Dams at high hazard risk: 27.7% (15th highest)
> Highway spending as pct. of total: 5.1% (17th lowest)

15. Arizona
> Roads in poor condition: 3.9% (9th lowest)
> Deficient bridges: 2.6% (4th lowest)
> Dams at high hazard risk: 44.5% (8th highest)
> Highway spending as pct. of total: 5.5% (20th lowest)
[in-text-ad]

14. Washington
> Roads in poor condition: 15.8% (12th highest)
> Deficient bridges: 4.8% (7th lowest)
> Dams at high hazard risk: 31.0% (11th highest)
> Highway spending as pct. of total: 5.6% (21st lowest)

13. Alaska
> Roads in poor condition: 18.2% (8th highest)
> Deficient bridges: 9.7% (19th highest)
> Dams at high hazard risk: 26.2% (18th highest)
> Highway spending as pct. of total: 9.8% (4th highest)

12. New York
> Roads in poor condition: 21.9% (7th highest)
> Deficient bridges: 11.0% (15th highest)
> Dams at high hazard risk: 22.7% (24th highest)
> Highway spending as pct. of total: 2.7% (the lowest)
[in-text-ad-2]
11. North Carolina
> Roads in poor condition: 6.6% (23rd lowest)
> Deficient bridges: 9.9% (18th highest)
> Dams at high hazard risk: 42.0% (10th highest)
> Highway spending as pct. of total: 7.1% (20th highest)

10. Massachusetts
> Roads in poor condition: 31.5% (2nd highest)
> Deficient bridges: 9.3% (20th highest)
> Dams at high hazard risk: 22.9% (22nd highest)
> Highway spending as pct. of total: 4.5% (11th lowest)
[in-text-ad]
9. New Mexico
> Roads in poor condition: 5.6% (17th lowest)
> Deficient bridges: 6.5% (18th lowest)
> Dams at high hazard risk: 52.0% (7th highest)
> Highway spending as pct. of total: 5.2% (19th lowest)

8. New Jersey
> Roads in poor condition: 31.0% (3rd highest)
> Deficient bridges: 9.0% (22nd highest)
> Dams at high hazard risk: 27.3% (16th highest)
> Highway spending as pct. of total: 4.7% (13th lowest)

7. Delaware
> Roads in poor condition: 5.3% (15th lowest)
> Deficient bridges: 4.9% (8th lowest)
> Dams at high hazard risk: 75.9% (2nd highest)
> Highway spending as pct. of total: 5.7% (23rd lowest)
[in-text-ad-2]
6. California
> Roads in poor condition: 29.4% (4th highest)
> Deficient bridges: 5.5% (11th lowest)
> Dams at high hazard risk: 52.6% (6th highest)
> Highway spending as pct. of total: 3.2% (2nd lowest)
5. Pennsylvania
> Roads in poor condition: 14.7% (14th highest)
> Deficient bridges: 19.8% (3rd highest)
> Dams at high hazard risk: 53.0% (5th highest)
> Highway spending as pct. of total: 8.6% (9th highest)
[in-text-ad]

4. Connecticut
> Roads in poor condition: 27.3% (6th highest)
> Deficient bridges: 8.0% (23rd lowest)
> Dams at high hazard risk: 59.9% (4th highest)
> Highway spending as pct. of total: 4.0% (5th lowest)
 24/7 Wall St.
3. West Virginia
> Roads in poor condition: 8.2% (25th highest)
> Deficient bridges: 17.3% (5th highest)
> Dams at high hazard risk: 71.0% (3rd highest)
> Highway spending as pct. of total: 7.9% (14th highest)

2. Rhode Island
> Roads in poor condition: 39.7% (the highest)
> Deficient bridges: 24.9% (the highest)
> Dams at high hazard risk: 42.3% (9th highest)
> Highway spending as pct. of total: 3.7% (3rd lowest)
[in-text-ad-2]
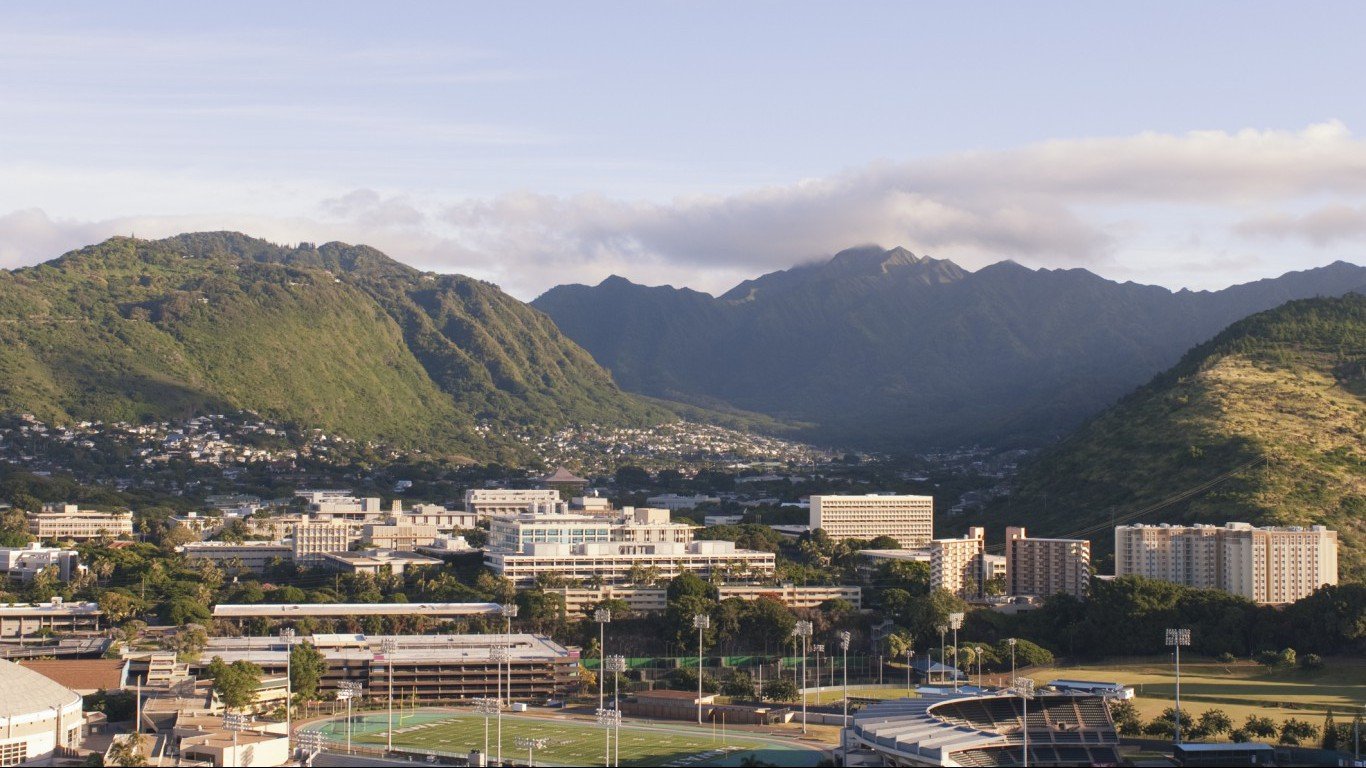
1. Hawaii
> Roads in poor condition: 29.0% (5th highest)
> Deficient bridges: 5.7% (13th lowest)
> Dams at high hazard risk: 93.2% (the highest)
> Highway spending as pct. of total: 4.5% (10th lowest)
Detailed Findings & Methodology
Some states face an uphill battle in maintaining infrastructure, as climate can have a considerable impact on road quality. When asphalt freezes and thaws, it can crack and begin to crumble, losing its integrity. As a result, road surfaces in states that face harsh winters have shorter lifespans. Perhaps not surprisingly, seven of the 10 states with the largest share of roadway in poor condition are in the Northeast, Midwest, and other regions that experience freezing temperatures.
States that invest more in their highways also tend to have better roads. States allocated an average of 5.5% of spending on highways in 2015. Of the 10 states with the smallest share of roadway in bad condition, seven allocate more than the 5.5% average across all states. Conversely, seven of the 10 states with the worst roads allocate a smaller share of spending to highways than the 5.5% average.
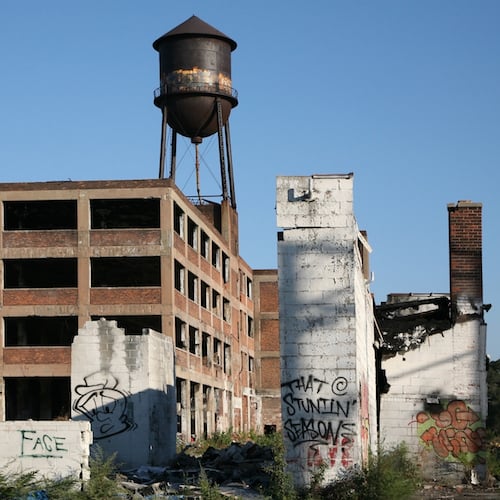
The consequences of crumbling infrastructure can be far more dire than vehicle damage caused by bad roads. An estimated 9.1% of America’s bridges are structurally deficient, meaning they require significant maintenance or all out replacement. Though higher traffic bridges are less likely to be structurally deficient, each day there are an estimated 188 million trips over structurally deficient bridges in the United States.
One of the deadliest bridge collapses in recent memory occurred in Minneapolis, Minnesota in 2007, when an interstate highway bridge collapsed during rush hour. Due to the failure, more than 50 vehicles dropped into the Mississippi River about 60 feet below. Thirteen people died two dozen more were critically injured as a consequence. The bridge had been deemed structurally deficient since 1990.
Dams are also part of the critical infrastructure in need of repair in states nationwide. Dams can range in size from the iconic Hoover Dam in Nevada to dams that form smaller, neighborhood man-made lakes. No matter their size, dams need regular maintenance, and in many cases, a dam failure could be catastrophic. As engineering data improves, it is becomes increasingly clear that many older dams in the United States will not be able to withstand heavy sustained rains or earthquakes. And by 2025, 70% of all dams will be over 50 years old.
To identify the states with the worst infrastructure, 24/7 Wall St. created an index accounting for the share of roads in poor condition, the share of bridges classified as structurally deficient, and the share of dams at high hazard risk. States with the highest average score ranked as the worst, while states with lower average scores ranked as having the best infrastructure. The share of roadways in poor condition and the share of bridges considered structurally deficient came from the Federal Highway Administration’s report Highway Statistics 2015. The share of dams classified as high hazard potential came from the National Inventory of Dams, a database maintained by the U.S. Army Corps of Engineers and the Association of State Dam Officials. Highway spending as a share of total government spending came from the U.S. Census Bureau’s 2015 Annual Survey of State Government Finances.
Take This Retirement Quiz To Get Matched With A Financial Advisor (Sponsored)
Take the quiz below to get matched with a financial advisor today.
Each advisor has been vetted by SmartAsset and is held to a fiduciary standard to act in your best interests.
Here’s how it works:
1. Answer SmartAsset advisor match quiz
2. Review your pre-screened matches at your leisure. Check out the
advisors’ profiles.
3. Speak with advisors at no cost to you. Have an introductory call on the phone or introduction in person and choose whom to work with in the future
Take the retirement quiz right here.