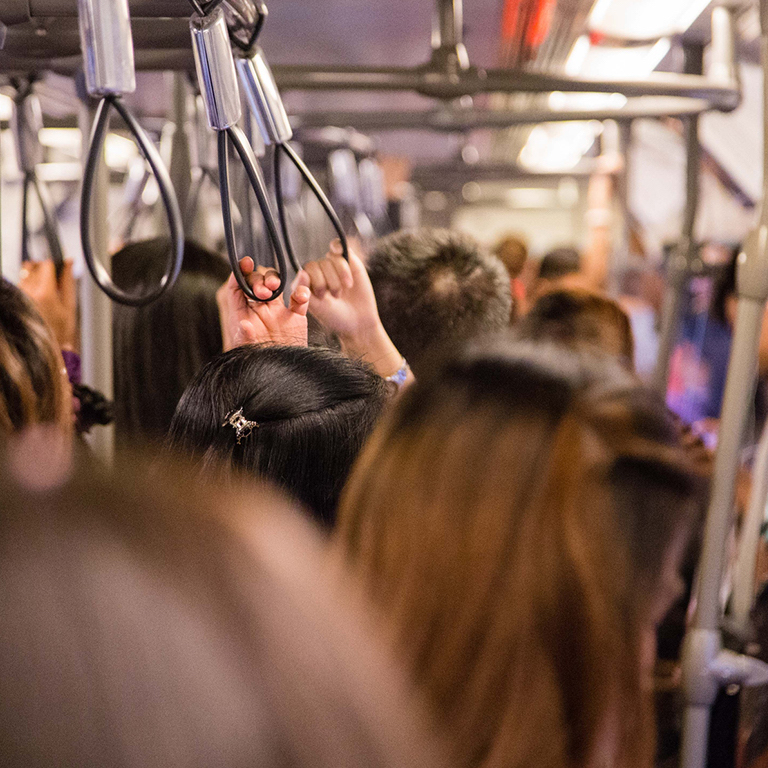

In a report card assessing the nation’s infrastructure issued by the American Society of Civil Engineers, transit in the United States received a grade of D-. Despite increasing demand, much of the nation’s public transportation infrastructure is plagued by under investment and insufficient maintenance.
The average vehicle used in public transportation is 8.3 years old. In a number of transit systems, the average vehicle is more than 30 years old. Over the past 15 years, there have been nearly 10,000 fatalities and more than 1 million injuries on public transit nationwide — more than 6 for every 1 million miles traveled. There have been nearly as many reported collisions, derailments, fires, security issues, and other accidents. Public transit vehicles lost a total of 663,000 hours in 2015 to breakdowns and other unscheduled delays.
Despite the overall dismal state of the nation’s transit systems, some cities offer quality public transportation that provide residents with a practical alternative to driving as well as a number of other economic, environmental, and social benefits. To determine the cities with the best public transportation systems, 24/7 Wall St. created an index of various measures related to transit infrastructure and ridership.
Click here to see the full list of cities with the best public transportation systems.
Click here to see our detailed findings and methodology.

13. Antioch, CA
> Commuters using public transit: 6.9%
> Breakdowns: 3.1 per 100,000 miles
> Average vehicle speed: 13.5 mph
> Average age of fleet: 5.8 years
Antioch is a small city of roughly 110,000 residents approximately 35 miles from Oakland and 45 miles from San Francisco. An estimated 6.9% of Antioch commuters use public transit, a larger share than the 5.1% national average. Starting in Spring 2018, Antioch commuters will be able to travel to San Francisco on a new rail line operated by Bay Area Rapid Transit, one of the highest rated transit authorities in the country. Within Antioch, Tri-Delta Transit operates one of the most efficient bus systems of any city. The Tri-Delta Transit system experiences just 3.1 breakdowns per 100,000 miles, a fraction of the 11.6 breakdowns per 100,000-mile national figure. Vehicles used in Antioch public transportation are also relatively new. The average vehicle used in the Tri-Delta Transit fleet is just 5.8 years old, compared to 8.3 years nationwide.
[in-text-ad]
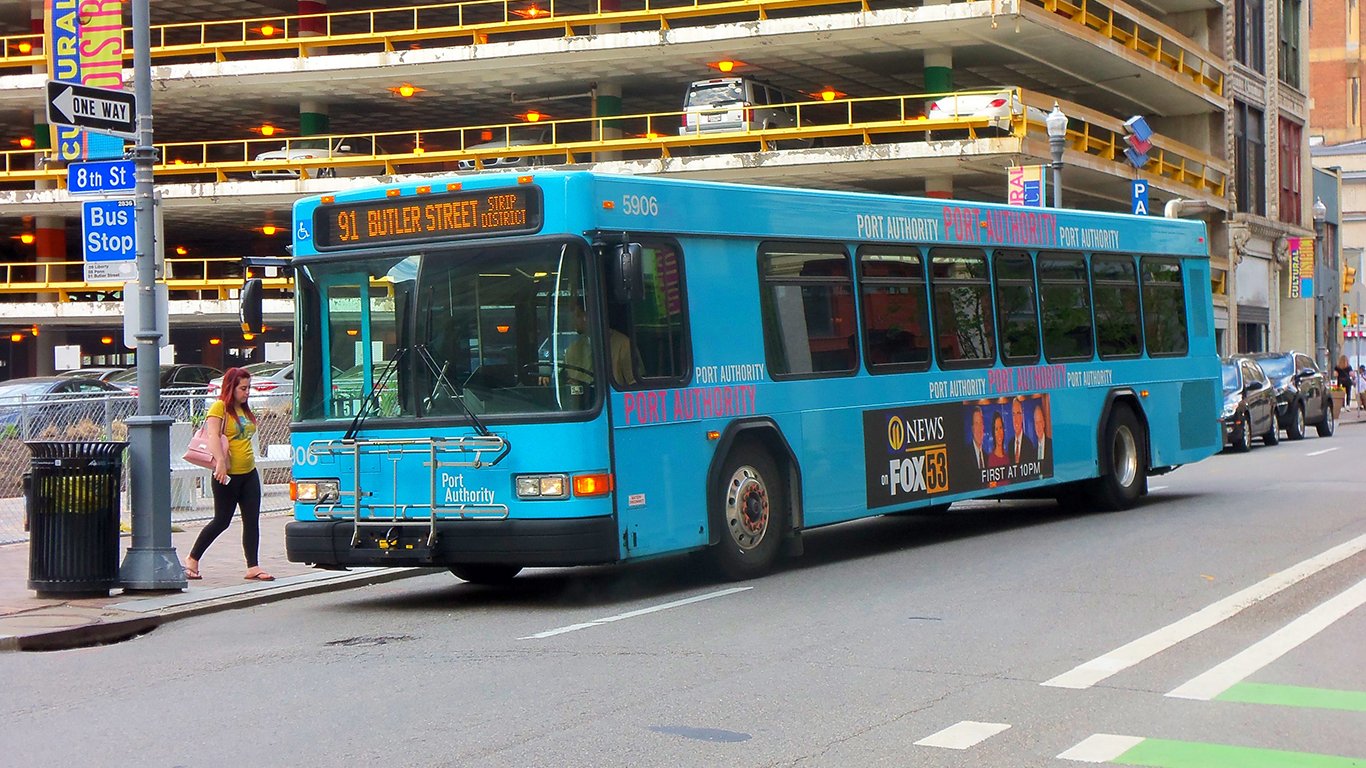
12. Pittsburgh, PA
> Commuters using public transit: 6.9%
> Breakdowns: 11.0 per 100,000 miles
> Average vehicle speed: 14.7 mph
> Average age of fleet: 7.6 years
Public transit in Pittsburgh ranks as second best in Pennsylvania and among the best of any city nationwide. The Port Authority of Allegheny County, the most widely used transit system in the city, primarily operates buses and a light rail transit system. Generally a newer transit system than that of the larger Southeastern Pennsylvania Transportation Authority’s in Philadelphia, Pittsburgh’s fleet is only about 8 years old on average compared to 14 years in Philadelphia. Partially as a result, the vehicles used in Pittsburgh’s public transit system are likely less susceptible to breakdown. Systemwide, there are only about 12 breakdowns per 100,000 miles traveled in Pittsburgh compared to 17 breakdowns on buses, streetcars, trolleys, and rail lines operated by SEPTA per same amount travelled.
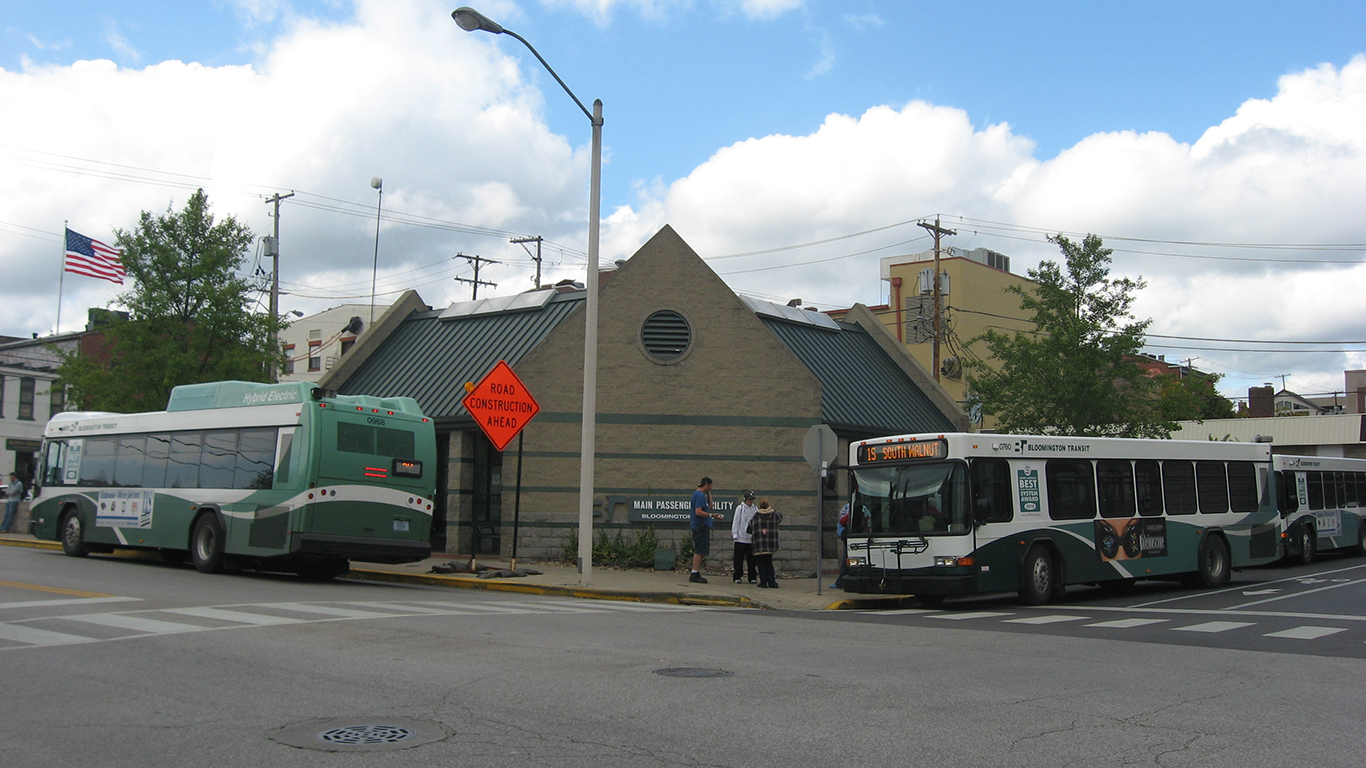
11. Bloomington, IN
> Commuters using public transit: 5.3%
> Breakdowns: 19.8 per 100,000 miles
> Average vehicle speed: 10.3 mph
> Average age of fleet: 8.6 years
College towns often have some of the best public transportation, as universities are generally responsive to student demand and will often invest in their host city’s transit system to provide the student body with access to the surrounding community. In Bloomington, where 36.2% of the population is enrolled in college or graduate school — many at Indiana University — 5.3% of commuters use public transit, slightly more than the national average. With free bus fares for IU students and City of Bloomington employees and just a $1 regular fare, Bloomington has one of the least expensive public transportation systems nationwide. Buses operated by Bloomington Transit also have relatively few delays or accidents. There have been just 44 accidents and 46 injuries on Bloomington public transit since 2002, among the least of any city when adjusted for miles driven.
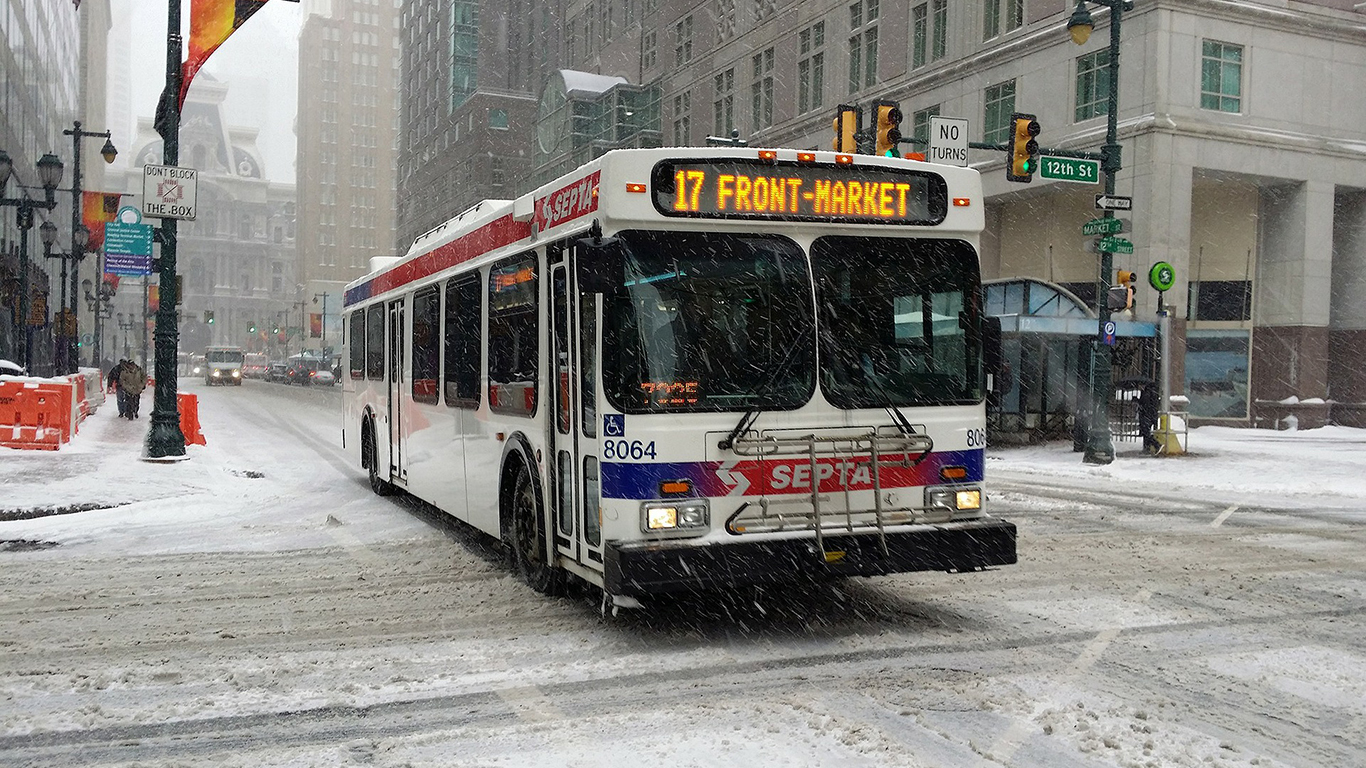
10. Philadelphia, PA-NJ-DE-MD
> Commuters using public transit: 10.5%
> Breakdowns: 14.9 per 100,000 miles
> Average vehicle speed: 16.9 mph
> Average age of fleet: 13.3 years
Despite being the most likely transit system to have a collision, derailment, or other security issue in the country, Philadelphia cracks the top 10 best public transportation systems among U.S. metro areas for its comprehensive service and high usage. An estimated 10.5% of Philadelphia commuters use public transit, more than double the national rate of 5.1%. However, ridership may be negatively impacted by a proposal from a group of Pennsylvania House Republicans, which could cut Philadelphia’s transit service by 40% and raise fares by 20% as soon as January of next year.
[in-text-ad-2]
9. Waldorf, MD
> Commuters using public transit: 7.6%
> Breakdowns: 6.2 per 100,000 miles
> Average vehicle speed: 18.5 mph
> Average age of fleet: 5.0 years
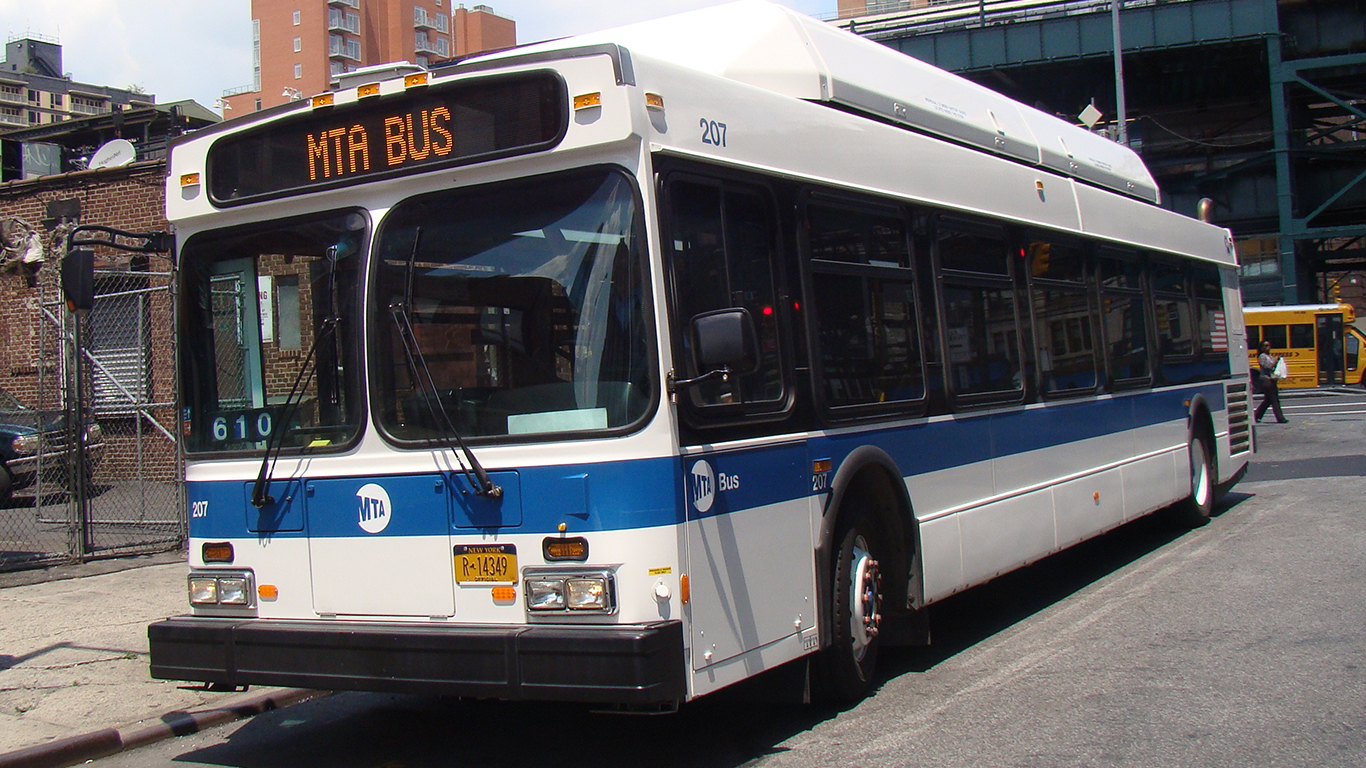
Waldorf is a small census-designated place of roughly 70,000 residents located approximately 30 miles from the Washington, D.C. An estimated 7.6% of commuters in Waldorf public transit, one of the largest shares of any city. Many residents likely commute to Washington, D.C. on a commuter bus operated by the Maryland Transit Administration, one of the highest rated transportation authorities in the United States. Within Waldorf, the Charles County government operates one of the least expensive public bus systems in the country. Regular fare for the bus is just $2 for an all day pass and $1 for a one way trip, with reduced fares available. Customers paid an average of just $0.41 per trip in Waldorf in 2016, nearly the least of any city. Waldorf also has some of the newest transit infrastructure in the country. The average vehicle used in Waldorf public transit is just 5.0 years old, less than the 8.4-year national average.
8. Portland, OR-WA
> Commuters using public transit: 7.4%
> Breakdowns: 20.3 per 100,000 miles
> Average vehicle speed: 13.5 mph
> Average age of fleet: 9.6 years
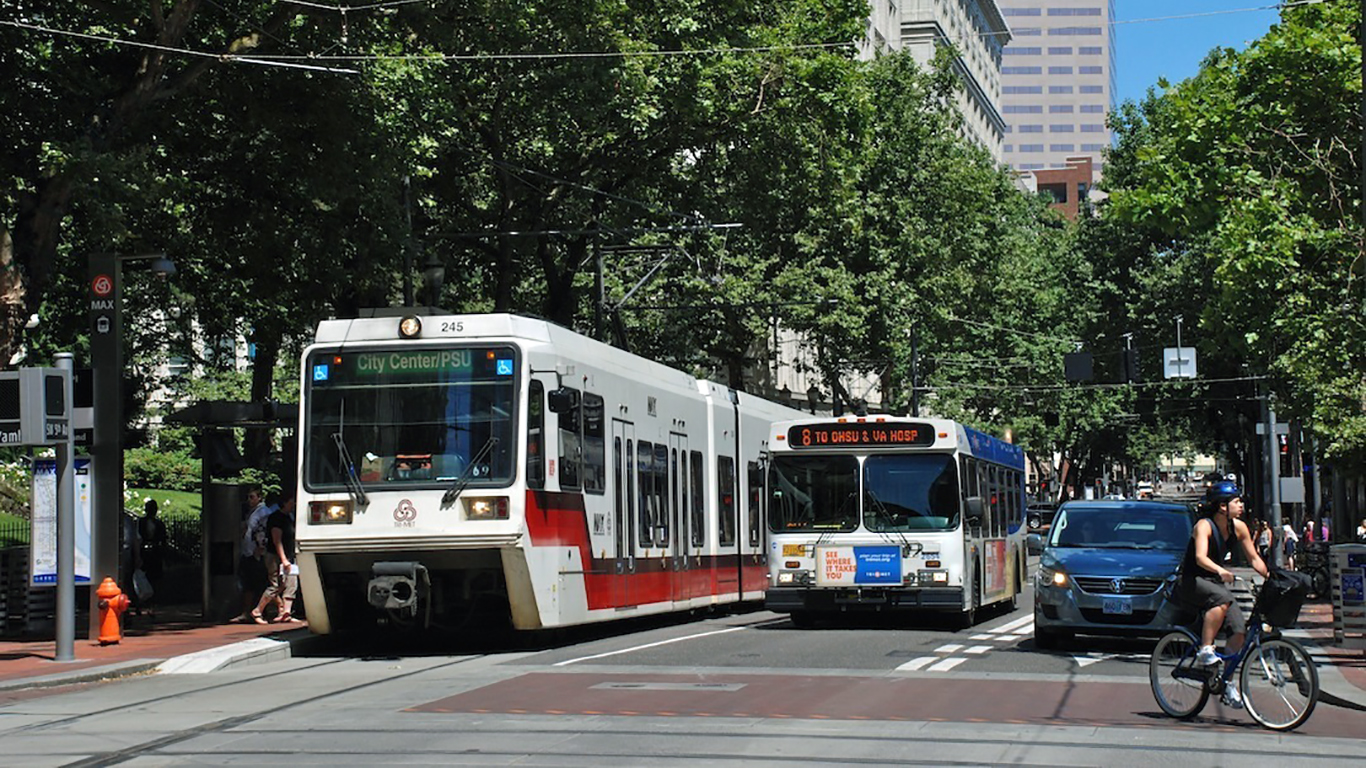
Public transportation in Portland primarily consists of a streetcar operated by the City of Portland, buses, light rail, and a hybrid rail operated by TriMet, and commuter buses and a vanpool system operated by C-Tran. At $2 per ride, $40 per month, or $440 per year, Portland’s streetcar is nearly the most affordable in the country. Portland is also home to one of the only two commuter aerial trams operating in the United States. The system opened in December 2006, and the average tram car is 8.0 years old. Citywide, vehicles used in Portland’s public transit are 9.6 years old on average, one of the younger fleets of any major city.
[in-text-ad]
7. Davis, CA
> Commuters using public transit: 6.2%
> Breakdowns: 8.8 per 100,000 miles
> Average vehicle speed: 10.3 mph
> Average age of fleet: 9.6 years
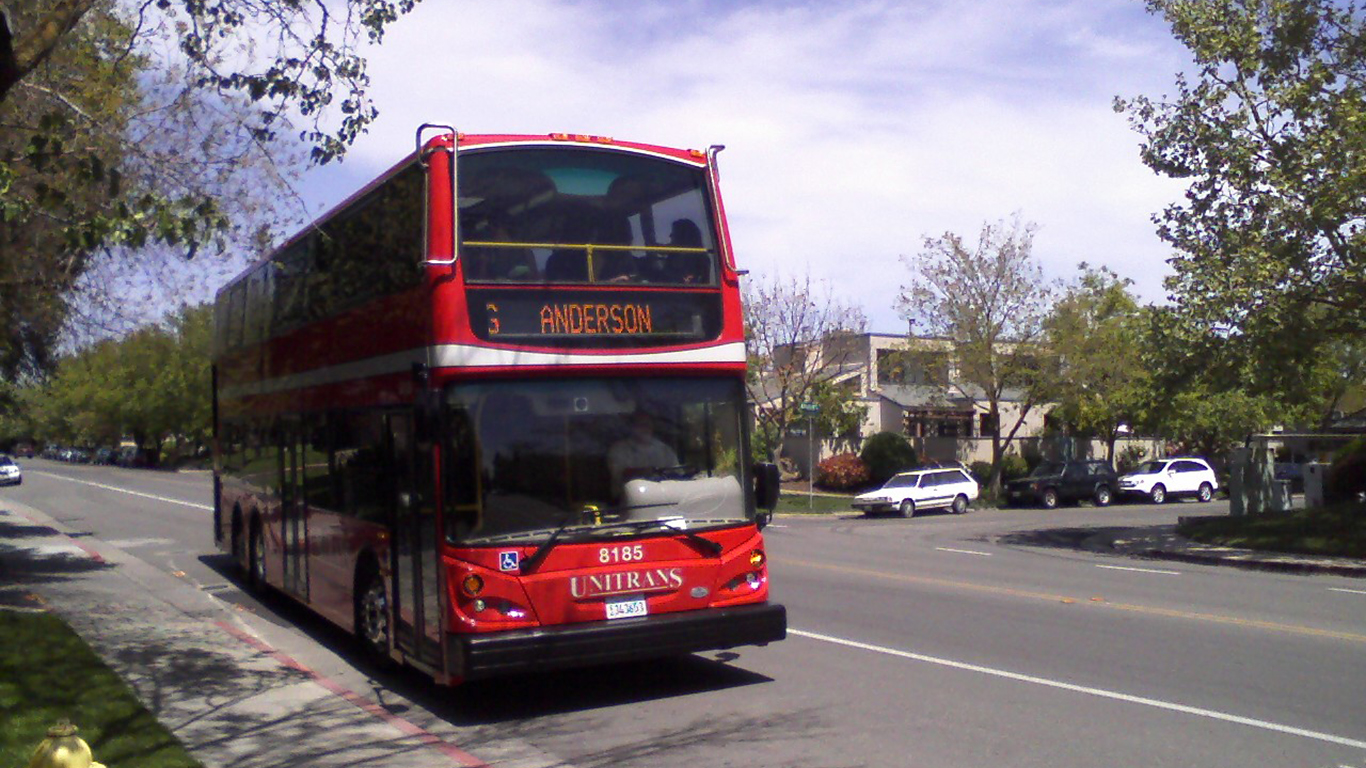
Davis is one of many college towns with a quality public transportation system. An estimated 39.6% of Davis residents are enrolled in college — many at the University of California, Davis — and 6.2% of commuters use public transit, slightly more than the 5.1% national average. UC Davis undergraduates ride for free on Unitrans, a system of double-decker buses once belonging to the city of London and single-deck buses that run on natural gas. An estimated 92.7% of all fuel used in the Davis public transportation system comes from compressed natural gas and 7.4% from biodiesel, making Unitrans one of the most environmentally friendly public transportation systems in the United States. While Unitrans serves an average of 47 passengers per hour — more than the 34-passenger per hour U.S. average — there have been just 1.4 accidents and 1.9 injuries per million miles in the system since 2002, less than one-third the corresponding national figures.
6. Champaign, IL
> Commuters using public transit: 8.7%
> Breakdowns: 3.9 per 100,000 miles
> Average vehicle speed: 11.6 mph
> Average age of fleet: 6.9 years
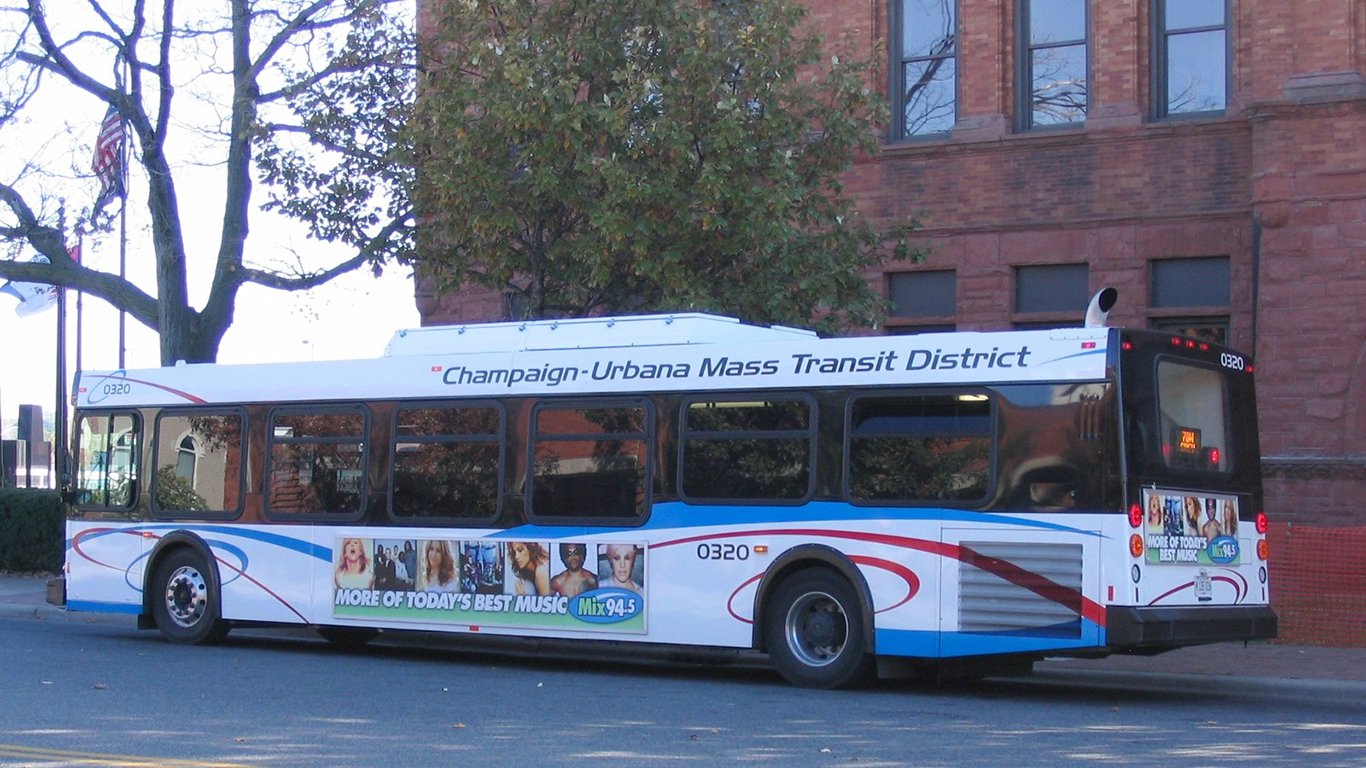
Another college town with an impressive public transportation system is Champaign, home to the University of Illinois. Having an inexpensive fare most likely influences the city’s above-average ridership in comparison to the country on the whole. The city also recently received a grant that will further improve its transit system. With funding from the Federal Transit Authority’s Low or No Emission Grant Program, the Champaign-Urbana Mass Transit District will deploy two 60-foot articulated hydrogen fuel cell buses in the near future. The FTA grant was announced in mid-September, and the buses are expected to start picking up passengers in 2019.
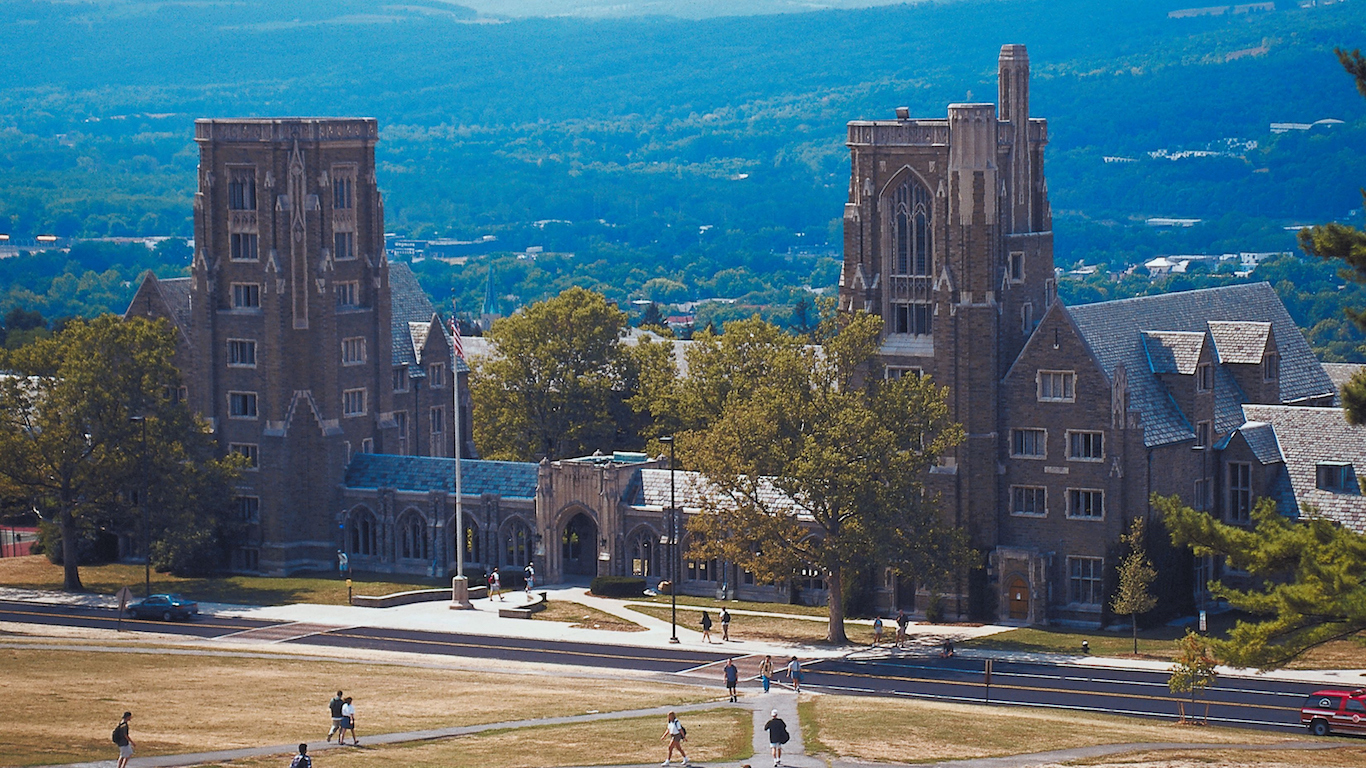
5. Ithaca, NY
> Commuters using public transit: 10.6%
> Breakdowns: 19.3 per 100,000 miles
> Average vehicle speed: 14.4 mph
> Average age of fleet: 6.4 years
The transit system in Ithaca is among the safest in America. The city has only had 28 collisions, derailments, fires, and other security issues due on public transit over the past 15 years — the third least of any city reviewed when adjusted for miles driven. There were only 25 reported injuries over that period, the fourth least per million miles traveled. In addition to the transit system’s impressive safety record, Tompkins Consolidated Area Transit offers relatively inexpensive fare. Cornell students ride buses for free on weekday evenings and throughout the weekend, and regular fare in the city center is just $1.50 for adults and $0.75 for youth.
[in-text-ad-2]
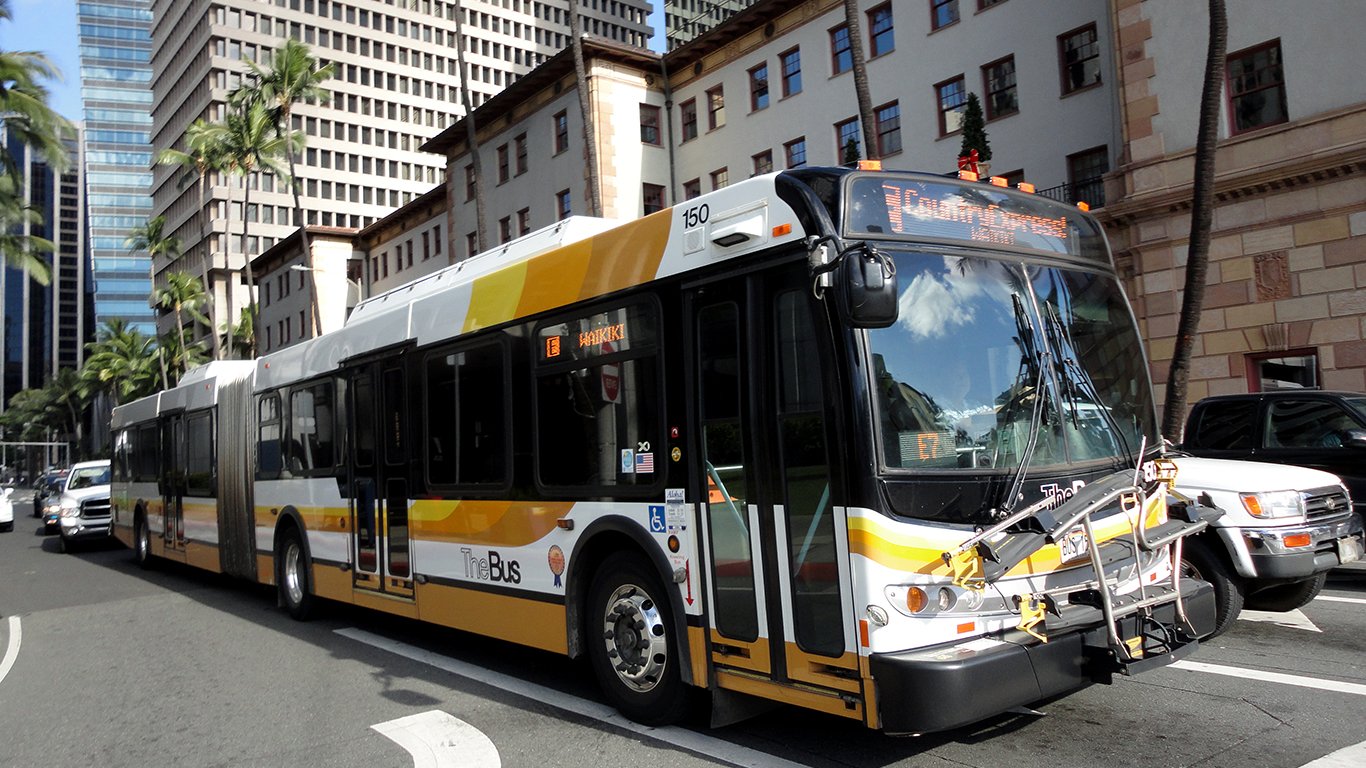
4. Honolulu, HI
> Commuters using public transit: 9.2%
> Breakdowns: 29.3 per 100,000 miles
> Average vehicle speed: 13.7 mph
> Average age of fleet: 9.2 years
Honolulu’s bus transit system, TheBus, is the only mass transit system to be recognized as America’s Best Transit System twice by the American Public Transportation Association. The public transportation system also offers some of the lowest fare in the United States. Regular bus fare is $2.50 for one way, $60 for a monthly pass, and $660 for unlimited rides year-round. The average fare per trip is just $0.78, nearly half the $1.52 average fare per trip nationwide.
To improve traffic congestion, Hawaii voters approved a $4.6 billion rail transit project in 2008 that will run through Honolulu along the southern coast of Oahu. The cost of the project has since risen to $9.5 billion, one of the most expensive rail transit projects per capita in the United States. Rising costs have led to a $3 billion budget shortfall for the project and put construction on the elevated rail line at a standstill.
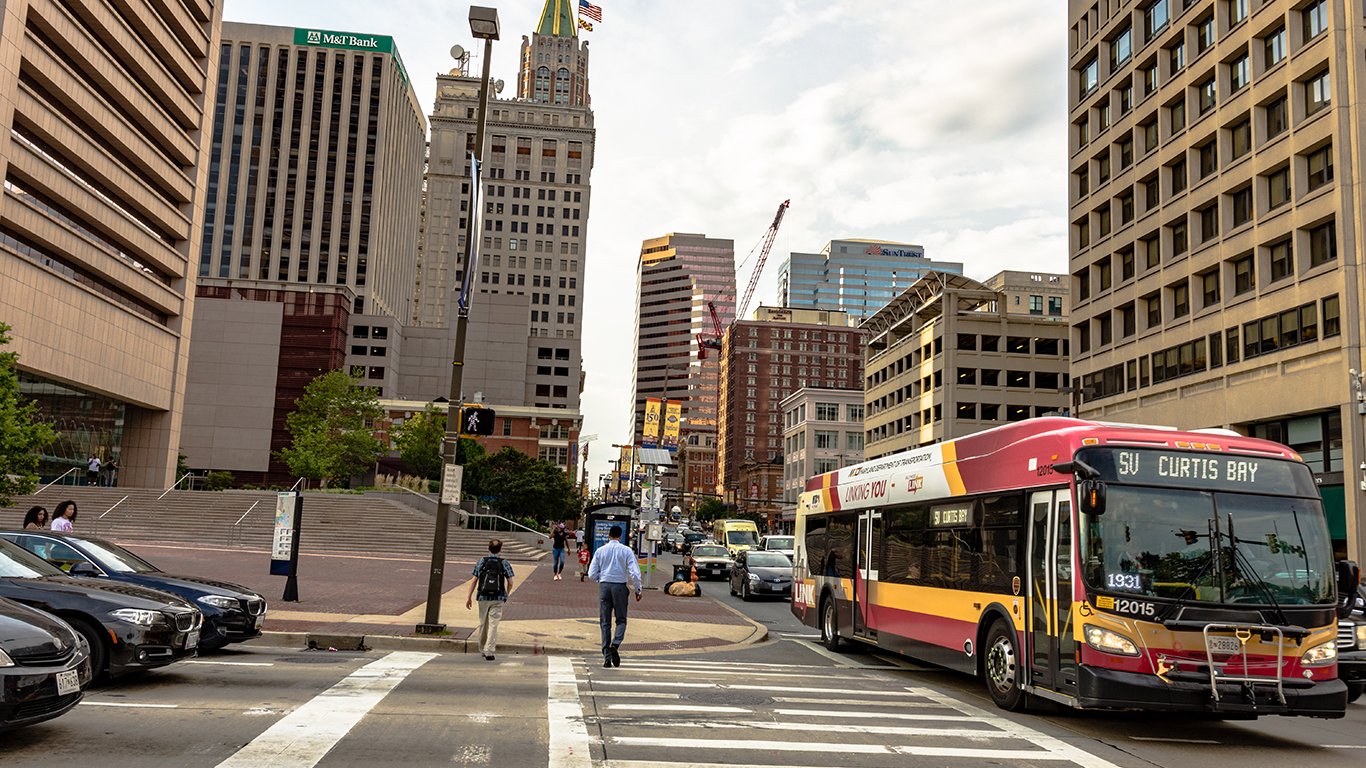
3. Baltimore, MD
> Commuters using public transit: 7.9%
> Breakdowns: 22.1 per 100,000 miles
> Average vehicle speed: 18.2 mph
> Average age of fleet: 9.1 years
Baltimore has many public transportation options with buses being the most common form of public transit. The city has an active public transit fleet of 1,724 vehicles that travel at an average a speed of 18.2 mph — one of the faster systems on the list. Baltimore has one of the most widely used public transportation systems of any city. Passengers in Baltimore ride on public transit for an average of 7.4 miles ride, two miles longer than the 5.5-mile national average. An estimated 7.9% of commuters in Baltimore take public transit, a larger share than the 5.1% U.S. figure and among the most of any city.
[in-text-ad]
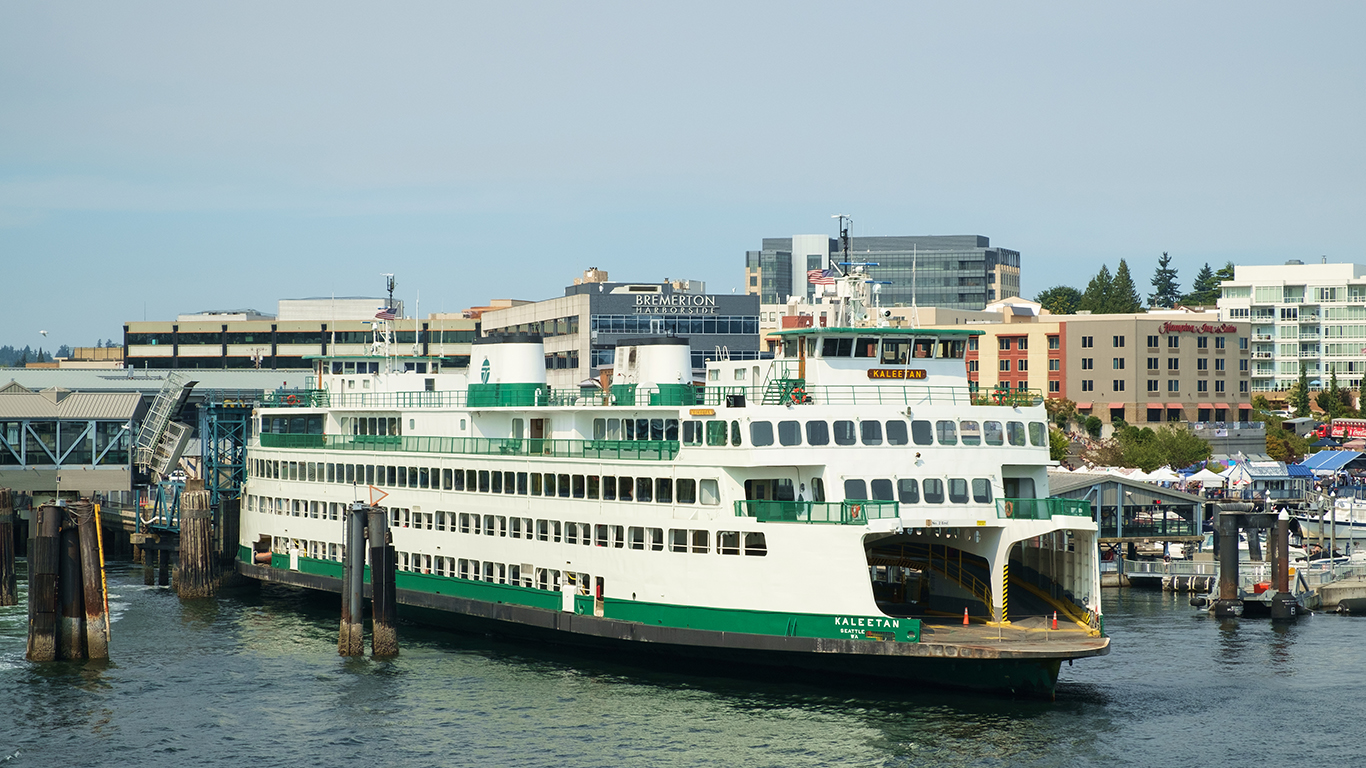
2. Bremerton, WA
> Commuters using public transit: 9.2%
> Breakdowns: 4.1 per 100,000 miles
> Average vehicle speed: 18.9 mph
> Average age of fleet: 8.6 years
The public transit system in Bremerton, Washington is one of the most efficient in the United States. There has been only one reported collision, derailment, or security issue on Bremerton public transit so far in 2017, nearly the least of any U.S. public transportation system when adjusted for miles traveled. In an effort to continue innovating its public transit system, the city recently inaugurated Kitsap Fast Ferries, a ferry service that runs between Seattle and Bremerton several times a day for half an hour each way. Bremerton’s high efficiency public transit does not come cheap, however, as the city has one of the highest average fares in the country.
1. Boston, MA-NH-RI
> Commuters using public transit: 13.7%
> Breakdowns: 6.0 per 100,000 miles
> Average vehicle speed: 17.2 mph
> Average age of fleet: 13.3 years
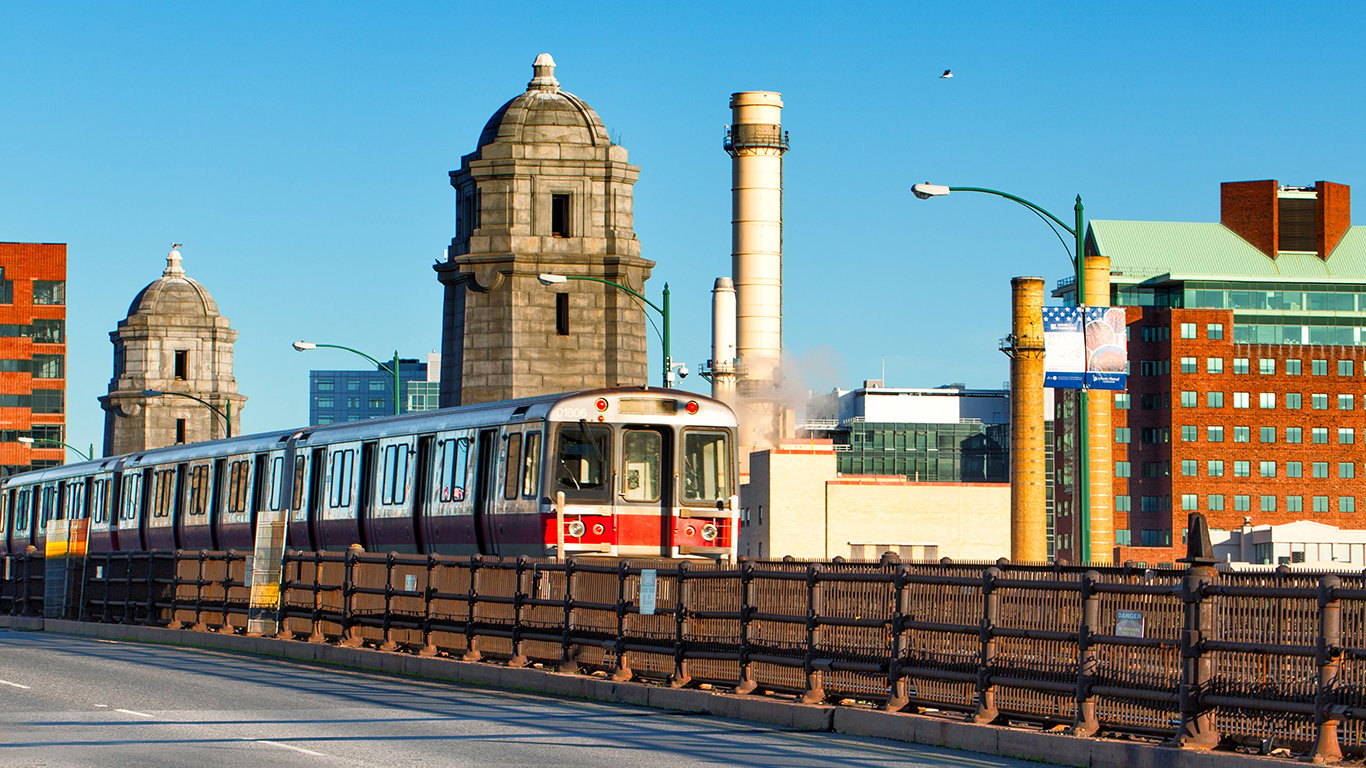
The Massachusetts Bay Transportation Authority is one of only two transit agencies in the U.S. that operates all five major types of terrestrial mass transit vehicles — commuter rail lines, heavy rail lines, trolleys, electric trolleybuses, and buses. Public transportation in the Boston urban area also consists of bus routes operated by the Brockton Area Transit Authority, the Merrimack Valley Regional Transit Authority, and other smaller local transit agencies. Boston also has one of the most heavily used transit systems in the country. The Boston public transportation system averages 58 passengers per hour, the third most of any city nationwide. An estimated 13.7% of commuters in the urban area use public transit, nearly triple the 5.1% national average.
Detailed Findings
Some of the best public transportation systems are often found in college towns. Universities are generally responsive to student demand and will often invest in their host city’s transit system to provide the student body with access to the surrounding city and community.
Unitrans, the public transportation system of Davis, California, was founded in 1968 when the Associated Students of UC Davis purchased two historic London double-decker buses to operate along two routes. The system was opened to the general public with partial funding from the city government in 1972. In Champaign, Illinois; Bloomington, Indiana; Ithaca, New York; and Davis — college towns where students comprise between 30% and 50% of the population — transit authorities encourage ridership by providing free fares to university students.
In the United States, public transportation is divided along income lines. In 9 out of 10 urban areas, the median earnings for commuters who use public transit is less than the median earnings of commuters who drive alone. Nationwide, the typical public transit rider earns $4,000 less than the typical car commuter annually. In cities with quality public transit infrastructure, a diverse range of income levels ride the bus, train, or commuter rail. Many of the city’s highest earners may rely on public transit to reach high-paying jobs in nearby metropolitan areas, or may prefer the exercise, freedom, and financial benefits afforded by public transportation.
In Antioch, California, the typical public transit rider earns $1,500 more than the typical commuter who drives alone. In Bremerton, Washington, the city with the second best public transportation infrastructure, the median earnings of public transit riders is $21,000 higher than earnings of commuters who drive alone.
While the largest, densest cities often have the most comprehensive public transportation systems that serve millions of passengers a year, many are still unable to accommodate the large demand of the rapidly growing populations. Of the nine urban areas where more than 1 in 10 commuters use public transit, only three are among the cities with the best public transportation.
Many of the largest urban areas consist of several smaller transit systems that may be poorly maintained, lowering the metro area’s overall ranking. For example, while the San Francisco-Oakland urban area consists of highly rated transit agencies such as Bay Area Rapid Transit and the San Mateo County Transit District, other authorities such as the Peninsula Corridor Joint Powers Board — which operates the Caltrain — and San Francisco Paratransit deflate the city’s overall ranking. Similarly, while the New Jersey Transit Corporation and MTA New York City Transit are some of the highest rated transportation agencies in the country, authorities such as the Metro-North Commuter Railroad Company and MTA Long Island Rail Road reduce the New York-Newark urban area’s overall ranking.
Methodology
To determine the cities with the best public transportation systems, 24/7 Wall St. created an index of various measures related to transit infrastructure and ridership. Data on total passenger miles traveled, total passenger trips, average trip length, and average fare per trip from the Federal Transit Administration’s National Transit Database are for July 2017 and were included in the index. Data on the average age of the vehicles used in public transit, breakdowns per 100,000 revenue miles — miles traveled during commercial operation, average vehicle speed, average number of passengers per hour, revenue miles lost to mechanical failures and other unscheduled activity, revenue hours lost to unscheduled activity, and the ratio of revenue hours to deadhead hours — hours traveled without passengers aboard — for fiscal 2015 also came from the FTA’s NTD and were included in the index. Data was aggregated by the transit agency level from the transit mode level, and ultimately aggregated to the urbanized area level using annual passenger miles and trips for weighting. Data from the U.S. Census Bureau’s American Community Survey on the share of commuters using public transit, the median earnings of public transit riders as a share of median earnings of commuters who drive alone, the average travel time for public transit riders, and the percentage difference in average travel time between public transit riders and commuters who drive alone are all five-year averages for urbanized areas for the period of 2011 to 2015 and were included in the index. Only urbanized areas in which more than 5.1% of commuters — the U.S. average — use public transportation were considered.
Take This Retirement Quiz To Get Matched With An Advisor Now (Sponsored)
Are you ready for retirement? Planning for retirement can be overwhelming, that’s why it could be a good idea to speak to a fiduciary financial advisor about your goals today.
Start by taking this retirement quiz right here from SmartAsset that will match you with up to 3 financial advisors that serve your area and beyond in 5 minutes. Smart Asset is now matching over 50,000 people a month.
Click here now to get started.
Thank you for reading! Have some feedback for us?
Contact the 24/7 Wall St. editorial team.
 24/7 Wall St.
