25 Most Dangerous Cities in America
November 6, 2017 by Mike SauterThe horrific mass shooting at a church in Sutherland Springs, Texas over the weekend represents just the latest in a series of brutal gun massacres that have occurred across the United States. Between Sutherland Springs, the Pulse Nightclub shooting in Orlando and the tragic events in Las Vegas barely over a month ago, three of the deadliest mass shootings in U.S. history have occurred in the last two years.
Mass shootings like the one over the weekend tend to receive the greatest press coverage, but they only represent a tiny fraction of the violence that occurs in most major cities over the course of a given year. The FBI reported Monday that crime levels rose once again in 2016. This marks the second consecutive year rates have risen, following nearly two decades of steady declines. There were 1.2 million violent crimes reported in 2016, up 4.1% from 2015. Rising crime in just a few major cities largely drove the spike in violence nationwide.
24/7 Wall St. reviewed violent crime rates in major U.S. cities from the FBI’s 2016 Uniform Crime Report. Violent crime includes all offenses involving force or threat of force and is broken into four categories: murder and nonnegligent manslaughter, rape, robbery, and aggravated assault. For every 100,000 U.S. residents, 386 violent crimes were committed in 2016.
One reason behind the violence in these cities — which at a rate of well over 1,000 cases per 100,000 people makes them among the most dangerous in the world — is weak police-community relationships.
In an interview with 24/7 Wall St., John Roman, a senior fellow with the non-partisan research organization NORC at the University of Chicago, said, “[In] a community that has demonstrated in the streets, that doesn’t trust the police the way it used to” — places like Chicago, Baltimore, and San Bernardino — “… people won’t come forward as witnesses, they won’t talk to the police about why the violence is occurring.” In such conditions, Roman explained, crime tends to escalate.
Click here to see the 25 most dangerous cities in America.
Click here to see our methodology and detailed findings.

25. Nashville-Davidson, Tennessee
> Violent crime rate: 1,102 per 100,000
> 2016 murders: 81
> Poverty rate: 18.6%
> Unemployment rate: 3.6%
In Nashville, there were approximately 7,400 reported incidents of rape, robbery, aggravated assault, and murder last year. Adjusting for the population, there were over 1,102 incidents of violent crime per 100,000 city residents.
Both violent and nonviolent crime tend to occur in neighborhoods with very low incomes. Generally, cities with higher crime tend to have greater concentrations of extremely low income households. However, in Nashville, just 7.7% of city households earn less than $10,000 annually, only slightly more than the national share of households with extremely low incomes of 7.2%. High unemployment also tends to correlate with higher incidence of crime, but Nashville’s 2016 annual unemployment rate of 3.6% is one of the lowest in the country.
[in-text-ad]
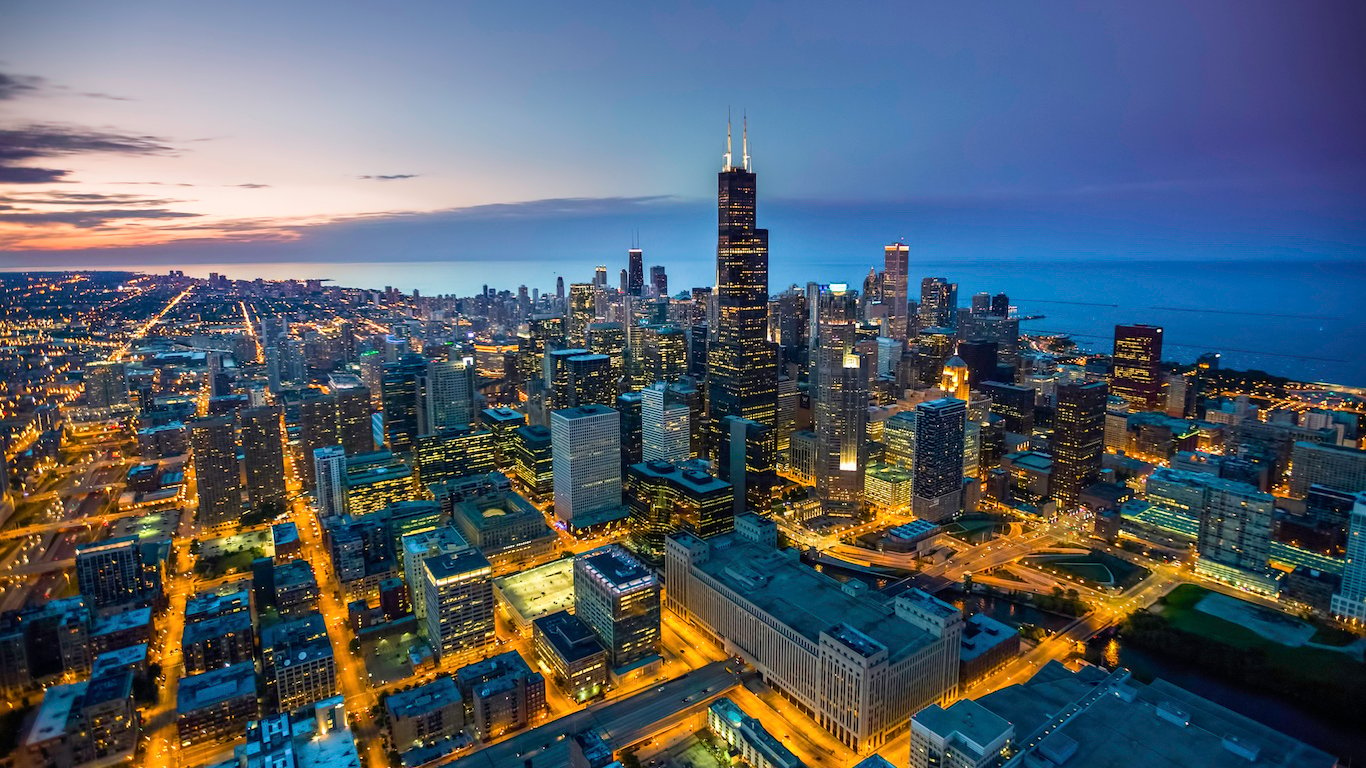
24. Chicago, Illinois
> Violent crime rate: 1,106 per 100,000
> 2016 murders: 765
> Poverty rate: 22.3%
> Unemployment rate: 6.5%
Chicago has recently become a symbol of urban crime in the United States after the murder rate spiked by nearly 50% last year. There were 765 murders in the Windy City in 2016, more than twice than in New York City — a city with three times the population. President Donald Trump suggested that if conditions did not improve in Chicago he “will send in the Feds!” Through mid-September, there have already been over 500 homicides in the city, putting it on track to match or surpass last year’s total.
Murder is only one part of Chicago’s violence problem. There were over 30,000 violent crimes in the city last year, or over 1,100 for every 100,000 people. Over half of these crimes were incidents of aggravated assault.

23. Minneapolis, Minnesota
> Violent crime rate: 1,109 per 100,000
> 2016 murders: 35
> Poverty rate: 21.9%
> Unemployment rate: 3.4%
Violent crime is commonplace in Minneapolis. The city has above average rates of murder and aggravated assault. The city has the 10th highest rates of robbery and rape among major cities. For every 100,000 Minneapolis residents, there were 109 reported rapes and 442 Robberies last year, much more than the respective national rates of 40 and 103 per 100,000 people. The city’s 2016 rape and robbery rates are effectively unchanged from 2015.
Generally, the major U.S. cities with severe violent crime either have declining populations, or populations growing at a slower rate than the rest of the country. Minneapolis is one of only two metro areas with population increases of at least 10% over the last decade.
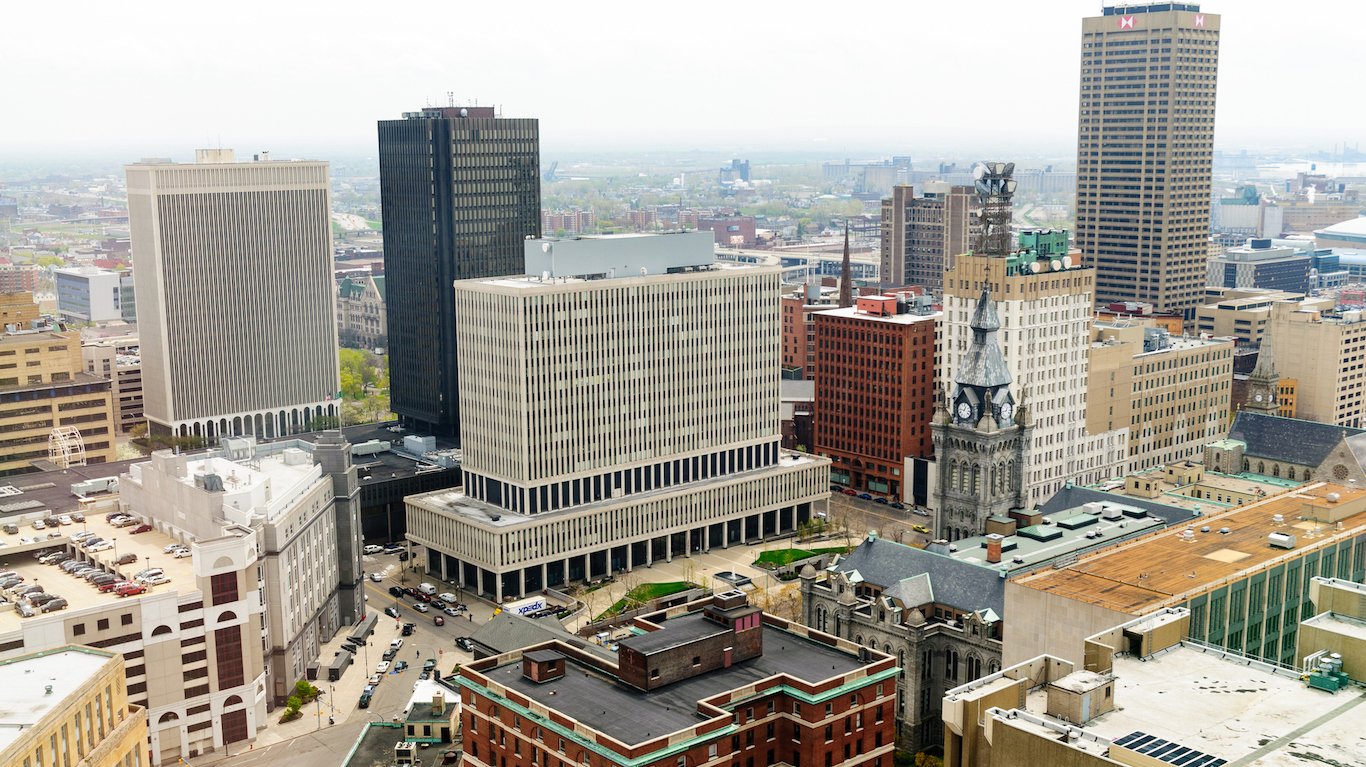
22. Buffalo, New York
> Violent crime rate: 1,110 per 100,000
> 2016 murders: 44
> Poverty rate: 31.4%
> Unemployment rate: 6.3%
Many cities in upstate New York have been struggling with long-term economic decline. This tough economic climate has translated to increased unemployment, lower incomes, and a higher incidence of crime. While violent crime is high in several cities in upstate New York, none compare to Buffalo. In a city of just over a quarter million people, there were about 2,900 murders, rapes, robberies, and aggravated assaults, or just over 1,100 violent crimes for every 100,00 residents. One of the largest contributors to the area’s high crime rate is the prevalence of robberies in Buffalo. There were 408 robberies per 100,000 Buffalo residents reported in 2016, nearly four times the national figure.
[in-text-ad-2]

21. Albuquerque, New Mexico
> Violent crime rate: 1,112 per 100,000
> 2016 murders: 61
> Poverty rate: 19.2%
> Unemployment rate: 5.8%
Crime in Albuquerque increased substantially over the past year. While nationwide the number of violent crimes reported annually rose by 4.1% from 2015 to 2016, the number of crimes in Albuquerque rose 15.5% — one of the sharpest increases of any city. There were 18 more murders, 271 more robberies, and 573 more aggravated assaults compared to 2015. In total, there were 1,112 violent crimes reported per 100,000 Albuquerque residents in 2016, nearly three times the national rate of 386 violent crimes per 100,000 Americans.
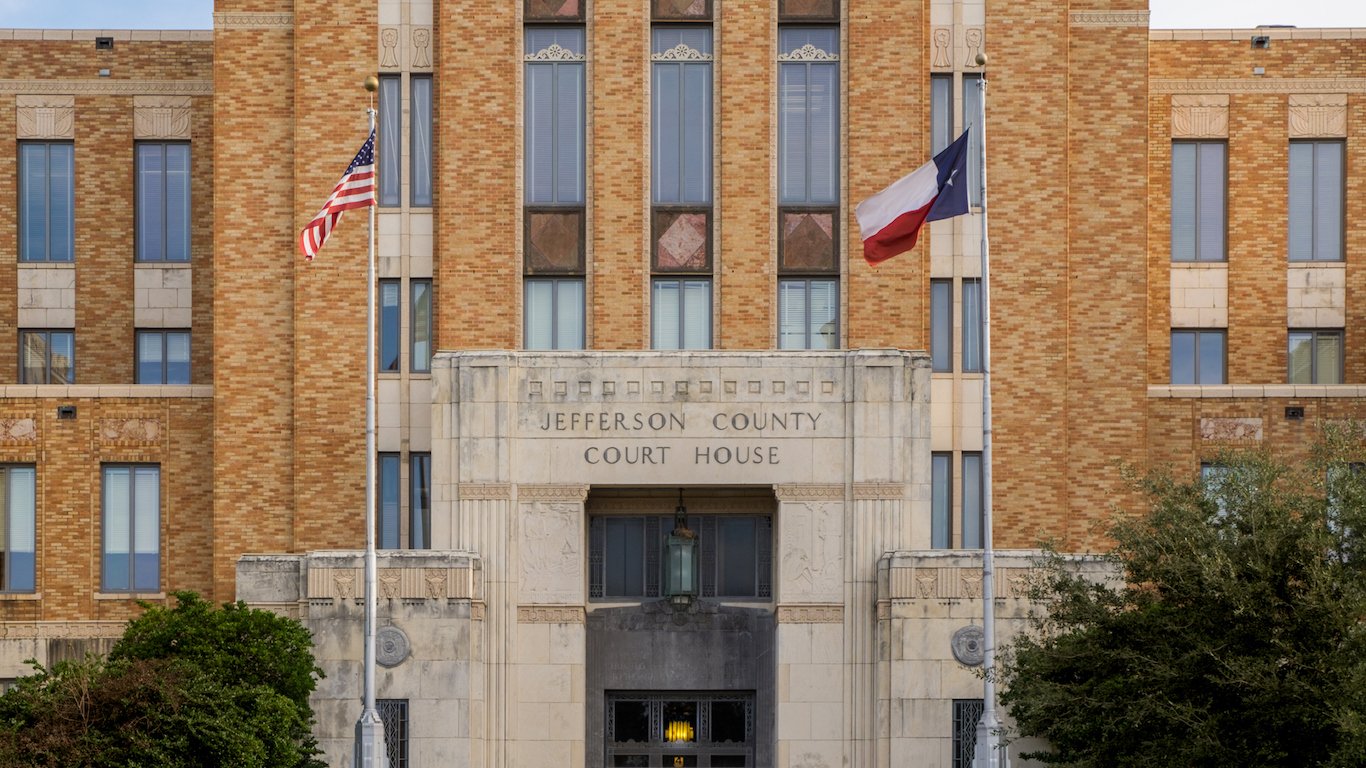
20. Beaumont, Texas
> Violent crime rate: 1,113 per 100,000
> 2016 murders: 14
> Poverty rate: 21.8%
> Unemployment rate: 6.2%
Violent crime in Beaumont rose faster in 2016 than in nearly any other U.S. city. As the number of violent crimes nationwide rose 4.1% from 2015 to 2016, it spiked 21.0% in Beaumont. While there were two fewer murders and six fewer rapes reported in the city in 2016, there were 81 more robberies and 155 more aggravated assaults. In total, there were 1,113 violent crimes reported per 100,000 Beaumont residents, far more than the national rate of 386 violent crimes per 100,000 Americans. As a result, the city’s rank rose from 40th most dangerous in 2015 to 20th most dangerous.
[in-text-ad]

19. Springfield, Illinois
> Violent crime rate: 1,116 per 100,000
> 2016 murders: 6
> Poverty rate: 19.5%
> Unemployment rate: 5.2%
Springfield, Illinois is one of two Springfields in the United States with very high violent crime rates. While the Missouri city sharing this name has a slightly higher violent crime rate, figures for this Springfield are not that much better. There were over 1,100 rapes, robberies, murders, and aggravated assaults for every 100,000 city residents in 2016. Most of these incidents were aggravated assaults, which accounted for about 950 of the area’s 1,301 total violent crimes last year.
While violent crime in Springfield rose by about 4% between 2015 and 2016 — roughly in line with the national increase — property crime in the city declined by 3.1%, faster than the national decline of 1.3%.
 24/7 Wall St.
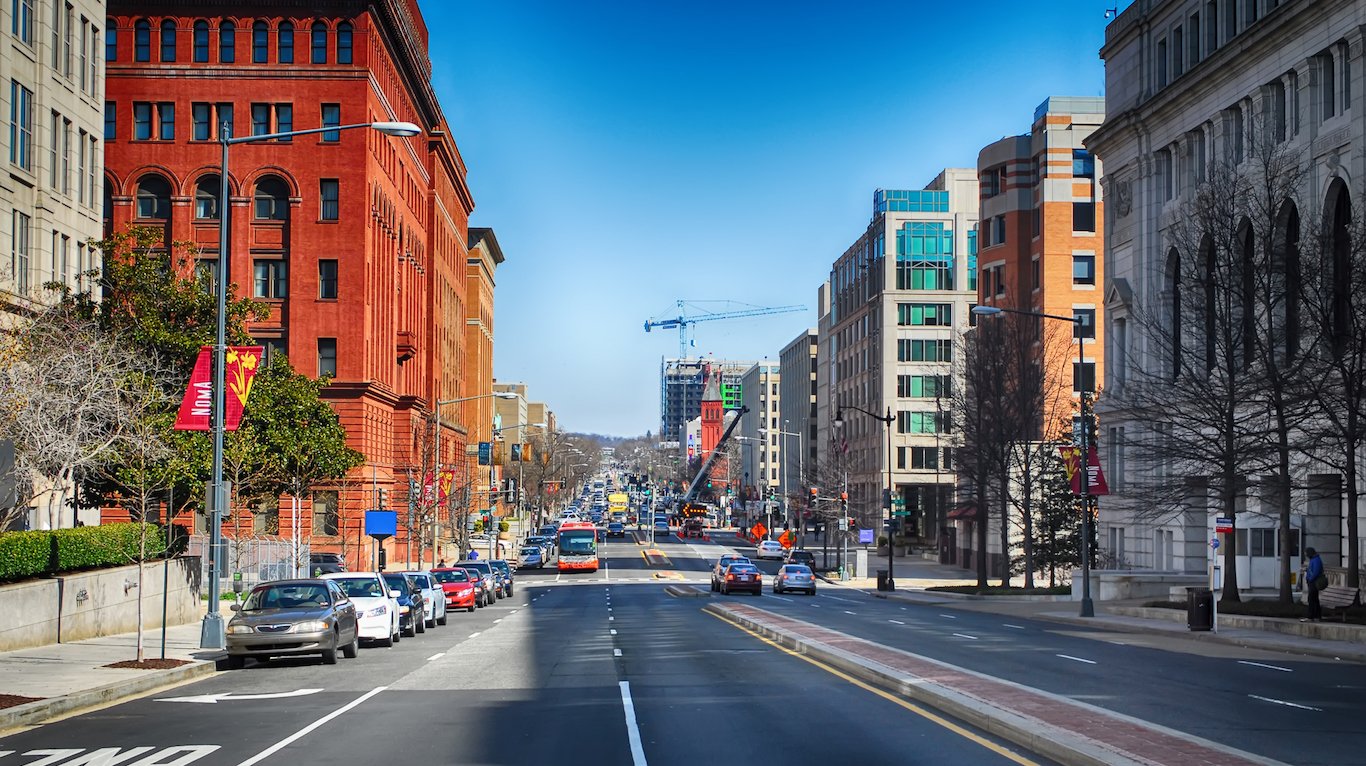
18. Washington, District of Columbia
> Violent crime rate: 1,132 per 100,000
> 2016 murders: 138
> Poverty rate: 18.0%
> Unemployment rate: 6.0%
There were 1,132 violent crimes reported per 100,000 Washington, D.C. residents in 2016, nearly three times the national rate and among the most of any U.S. city. While D.C. is one of the most dangerous cities in the country, violent crime in the nation’s capital fell over the past year. Bucking the national trend, the number of violent crimes in the city fell 4.6% from 2015 to 2016, as the population increased by 1.3%. Property crime, however, rose 4.3% — one of the larger increases of any U.S. city.
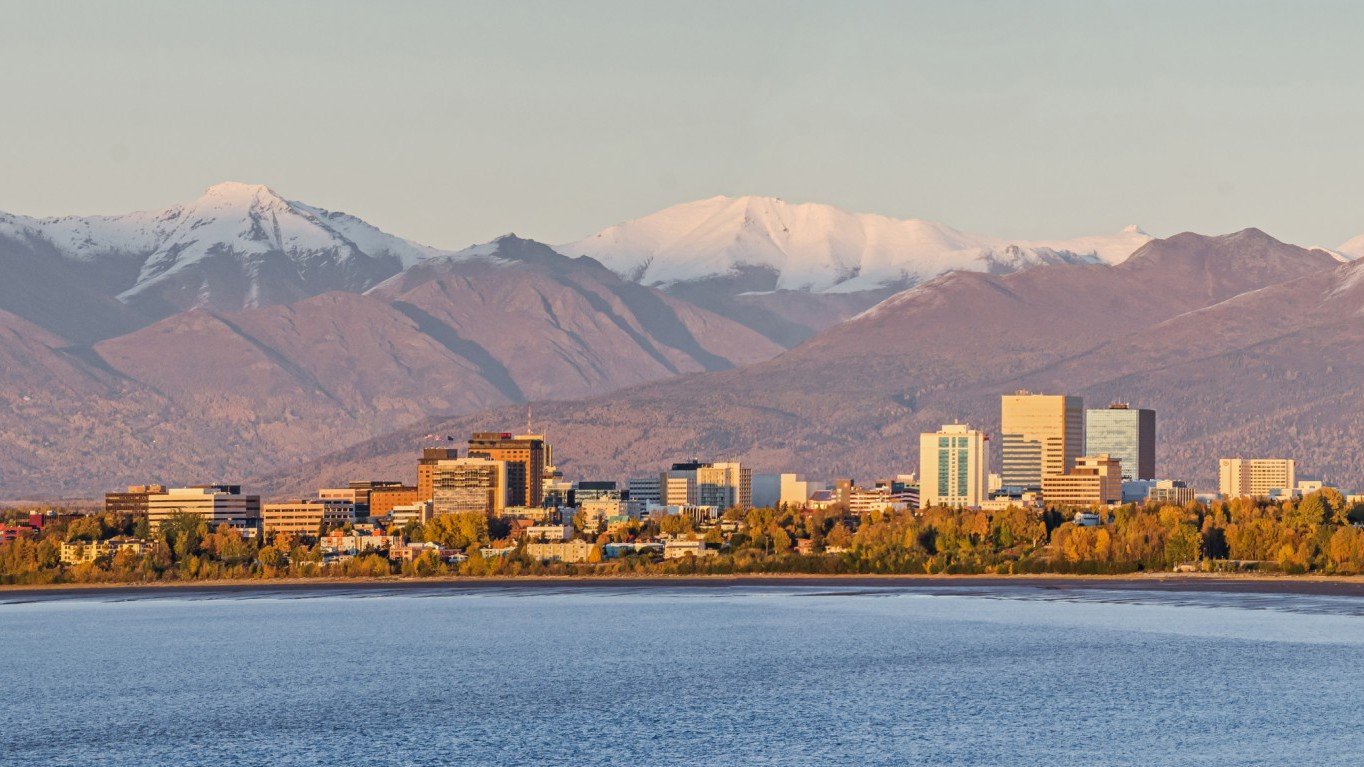
17. Anchorage, Alaska
> Violent crime rate: 1,144 per 100,000
> 2016 murders: 28
> Poverty rate: 8.2%
> Unemployment rate: 5.3%
While crime is often most prevalent in cities with widespread poverty, just 8.2% of Anchorage’s population lives below the poverty line, roughly half the U.S. poverty rate. Anchorage is the only large city where fewer than 3% of all households earn less than $10,000 a year while the violent crime rate is greater than 300 incidents per 100,000 residents.
Anchorage also had the third sharpest increase in property crime of any large city. While property crime nationwide fell 1.3% in 2016, it rose 24.1% in Anchorage. The increase was led by a rise in motor vehicle thefts, and may be due to a rise in drug use and addiction in the area.
[in-text-ad-2]
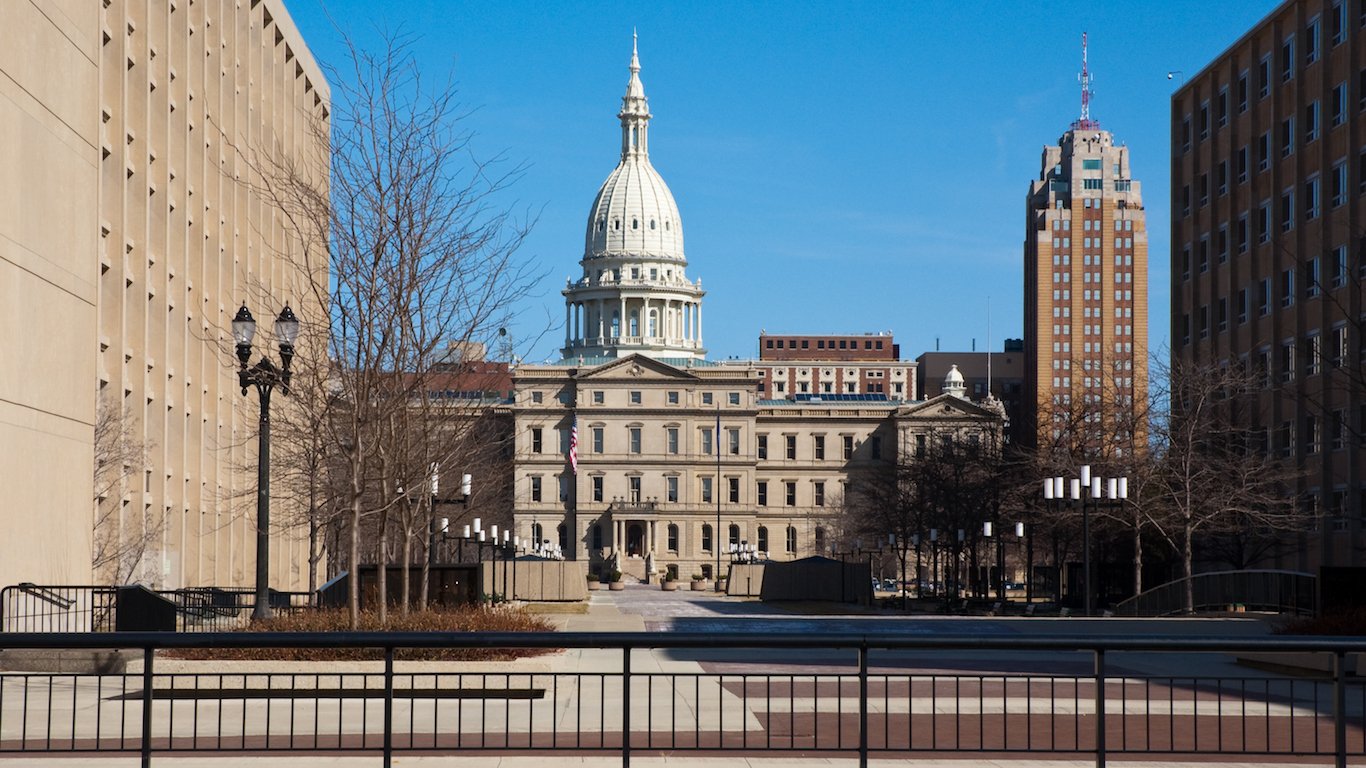
16. Lansing, Michigan
> Violent crime rate: 1,164 per 100,000
> 2016 murders: 9
> Poverty rate: 29.6%
> Unemployment rate: 5.9%
Michigan’s capital is one of two in the state to make this list of the most dangerous cities in the country. As is the case nationwide, the majority of violent crimes in Lansing are aggravated assaults. Of the total 1,341 violent crimes reported in the city of approximately 115,000 people in 2016, 930 were aggravated assault incidents. Lansing also has one of the highest incidences of rape in the country. There were 123 reported rapes in Lansing in 2016 for every 100,000 residents, the seventh highest rate among major U.S. cities and more than three times the national rate.

15. Toledo, Ohio
> Violent crime rate: 1,192 per 100,000
> 2016 murders: 37
> Poverty rate: 27.8%
> Unemployment rate: 5.6%
Crime is often most prevalent in cities with widespread poverty. In Toledo, 27.8% of residents live in poverty, and 14.7% of households earn less than $10,000 a year — each among the largest shares of any major U.S. city. There were 1,193 violent crimes reported per 100,000 residents in Toledo in 2016, more than three times the national rate of 386 incidents per 100,000 Americans.
While violent crime increased in Toledo in 2016 at roughly the same rate as the nation as a whole, property crime fell more than in most cities. The number of property crimes fell 10.5% in the city from 2015 to 2016, far more than the 1.3% national decline. Still, there were 4,020 property crimes per 100,000 Toledo residents in 2016, far more than the national rate of 2,451 property crimes per 100,000 Americans.
[in-text-ad]

14. San Bernardino, California
> Violent crime rate: 1,324 per 100,000
> 2016 murders: 62
> Poverty rate: 33.4%
> Unemployment rate: 7.3%
There were 1,324 violent crimes reported per 100,000 residents in San Bernardino in 2016, far more than the national rate. A total of 62 murders were reported in the city in 2016, the deadliest year in San Bernardino since 1995. Police report that arrests and warrants have been made or issued for just about 44% of San Bernardino homicides in 2016, far less than the national average. One factor contributing to a high prevalence of crime in the area may be the city’s under-resourced police department. San Bernardino was hit hard by the Great Recession and went bankrupt in 2012. The city exited from bankruptcy in June 2017, but the San Bernardino Police Department remains relatively underfunded. As police officers retired or left for more secure jobs in other departments, the size of the force fell from a peak of 343 officers in 2008 to 215 as of 2016.

13. Springfield, Missouri
> Violent crime rate: 1,337 per 100,000
> 2016 murders: 8
> Poverty rate: 25.7%
> Unemployment rate: 4.0%
Springfield, Missouri’s property crime rose substantially between 2015 and 2016. Bucking the national trend, the number of property crimes in Springfield rose 9.6% in 2016, one of the sharpest spikes of any city. In response to rising crime, Springfield has attempted to bolster its police department, strengthening recruiting efforts and softening its no tattoo policy to accept candidates with forearm tattoos. The number of sworn officers in Springfield rose 5.8% from 2015 to 2016, one of the largest increases of any major city.
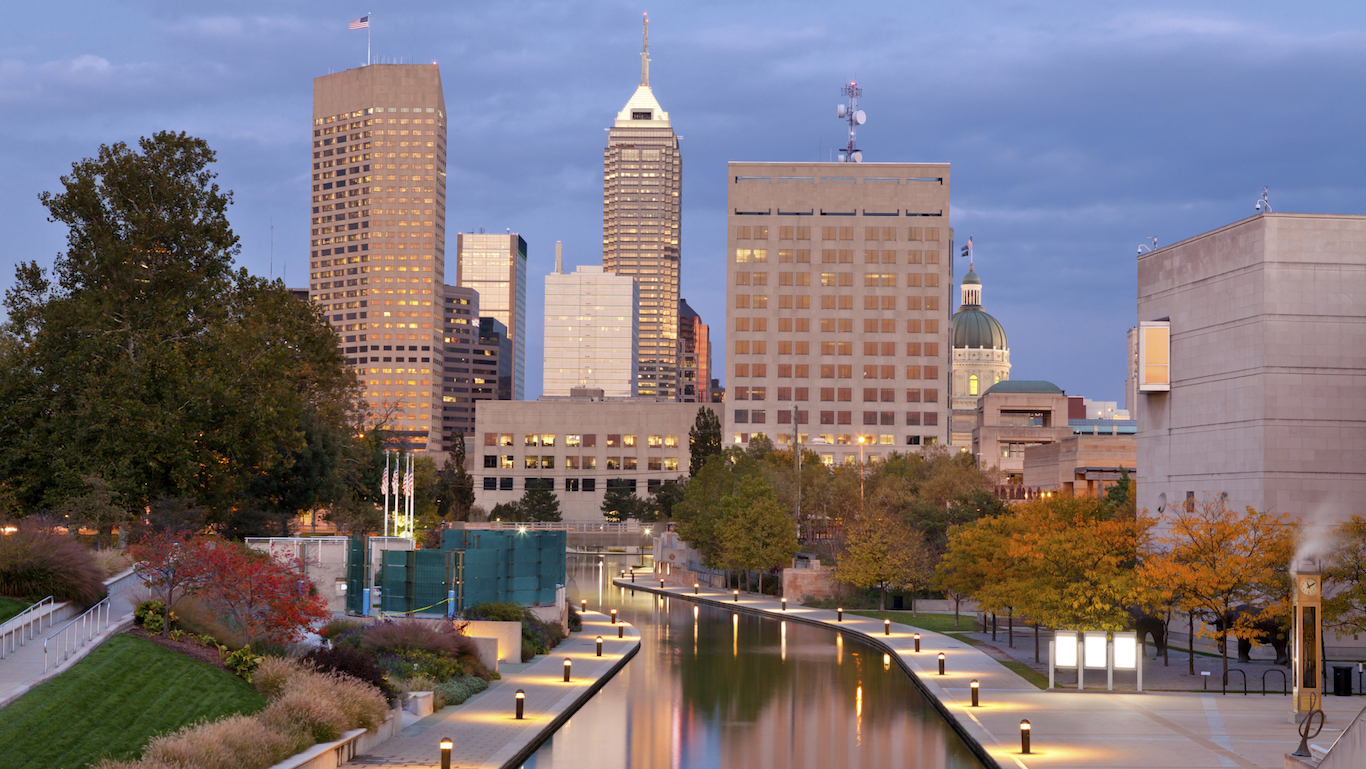
12. Indianapolis, Indiana
> Violent crime rate: 1,374 per 100,000
> 2016 murders: 148
> Poverty rate: 21.3%
> Unemployment rate: 4.5%
Violent crime is much more common among extremely low-income population groups. In Indianapolis, 10.1% of households earn less than $10,000 a year, compared to the national share of 7.2%. There were 1,374 violent crimes reported per 100,000 residents in Indianapolis in 2016, more than three times the national rate. A city’s high violent crime rate can often be traced to a few high-poverty, crime-ridden neighborhoods, where gun violence can increase the incidence of homicide and other violent crime. In Indianapolis, many of the most dangerous neighborhoods are near the city center, such as Martindale-Brightwood and Warren Park.
As is often the case in cities with high violent crime rates, property crime is also a serious problem in Indianapolis. For example, there were roughly 1,180 burglaries per 100,000 residents in the city in 2016, approximately 2.5 times the national burglary rate.
[in-text-ad-2]
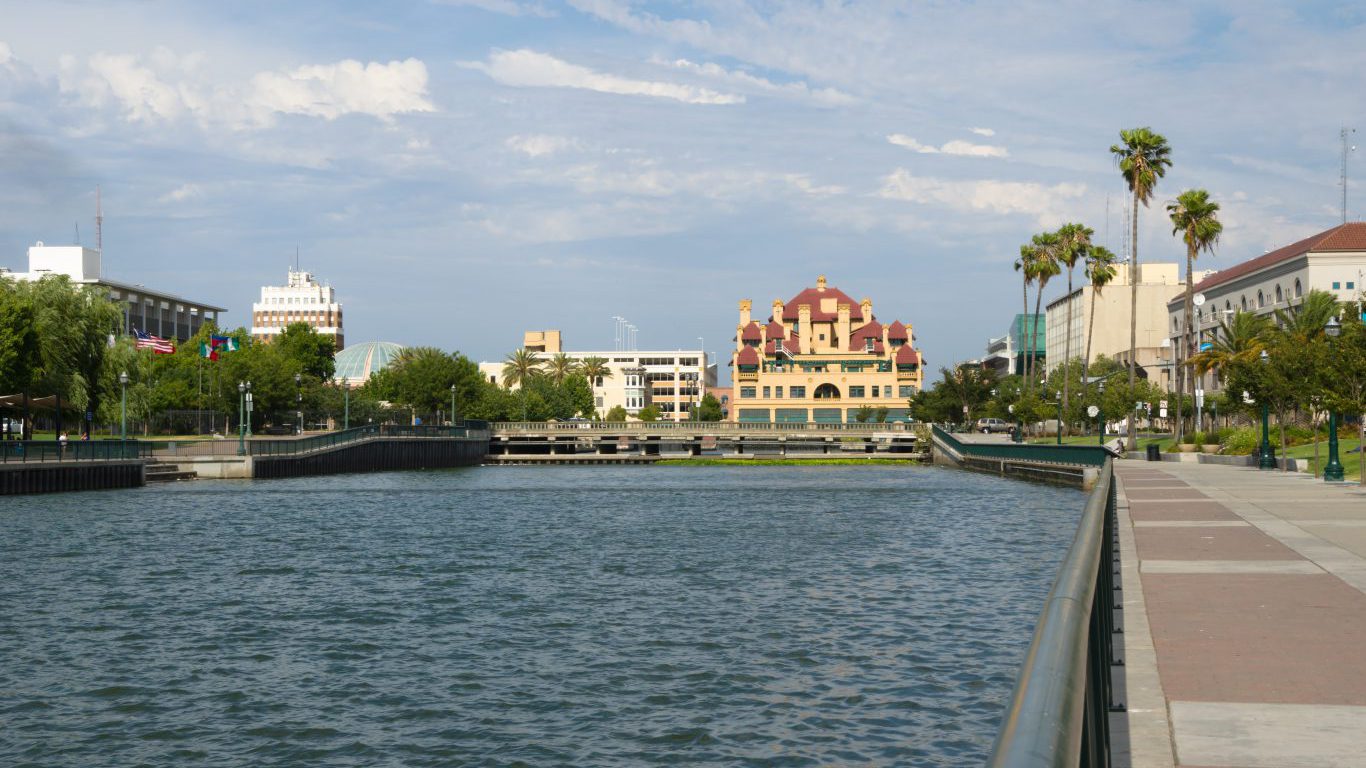
11. Stockton, California
> Violent crime rate: 1,421 per 100,000
> 2016 murders: 49
> Poverty rate: 25.3%
> Unemployment rate: 8.7%
Violent crime includes murder, rape, robbery, burglary, and aggravated assault. Aggravated assault accounts for the majority of violent incidents in most cities, and Stockton is no exception. Of the city’s roughly 4,400 violent crimes reported in 2016, approximately 3,000 were cases of aggravated assault. Adjusting for population, there were 979 cases of aggravated assault per 100,000 Stockton residents in 2016, the seventh highest rate in the country and almost four times the national rate of 249 aggravated assaults per 100,000 people.
While the relationship is complex, cities with high unemployment often have a higher incidence of crime. Stockton’s 2016 annual unemployment rate is 8.7%, far higher than the 4.9% national unemployment rate.
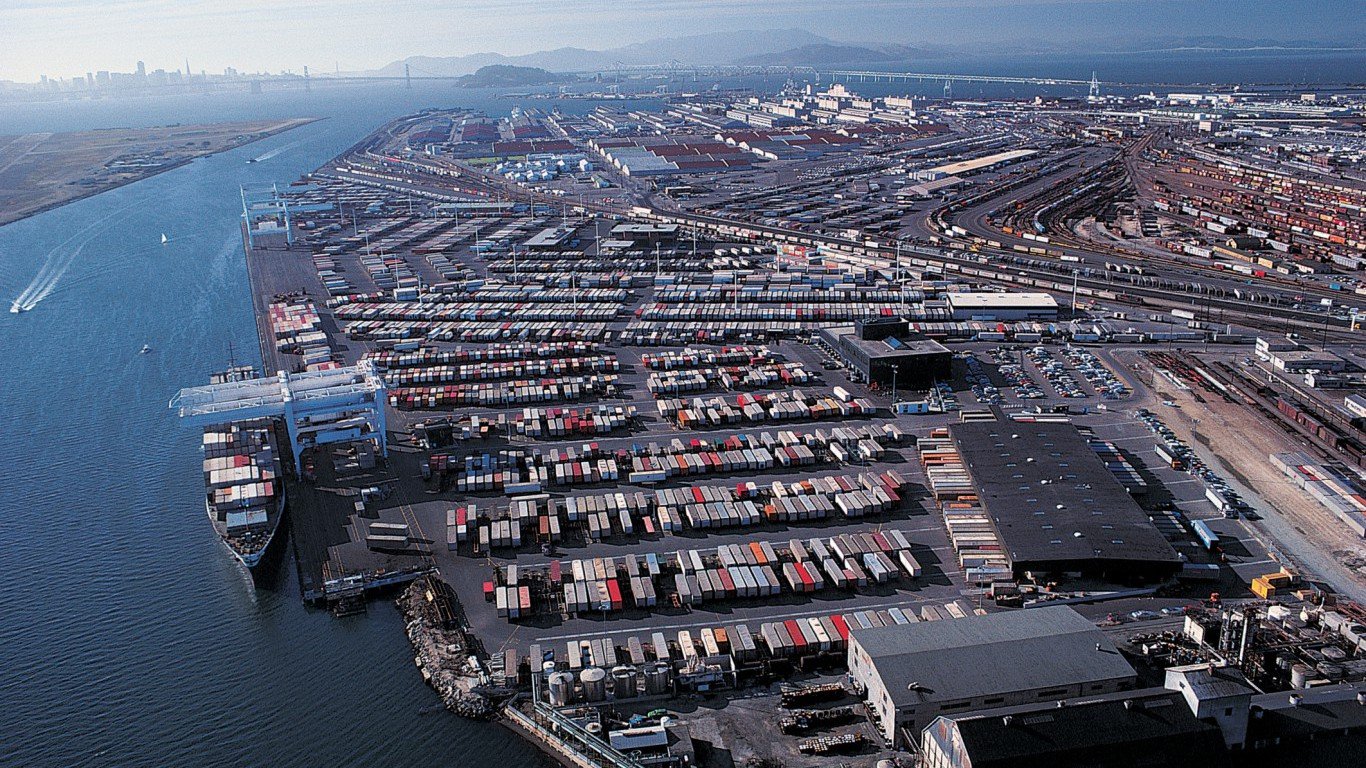
10. Oakland, California
> Violent crime rate: 1,426 per 100,000
> 2016 murders: 85
> Poverty rate: 20.4%
> Unemployment rate: 5.3%
There were 1,426 violent crimes reported per 100,000 Oakland residents in 2016, far more than the national rate of 386 incidents per 100,000 residents. Crime is far more prevalent in Oakland than in neighboring San Francisco, where the violent crime rate is 711 incidents per 100,000 residents. One of the largest contributors to the area’s high crime rate is the high prevalence of robberies in Oakland. There were 724 robberies per 100,000 Oakland residents in 2016, the most of any city other than Cleveland, Ohio and Baltimore, Maryland. Oakland also has the most motor vehicle thefts per capita in the country. There were 1,623 incidents of grand theft auto for every 100,000 residents in the city in 2016, nearly seven times the national rate.
[in-text-ad]

9. Little Rock, Arkansas
> Violent crime rate: 1,531 per 100,000
> 2016 murders: 42
> Poverty rate: 17.8%
> Unemployment rate: 3.5%
There were 1,531 violent crimes reported per 100,000 residents in Little Rock in 2016, the ninth most of any U.S. city and the second most of any city with a population between 100,000 to 200,000 residents. One of the largest contributors to the Little Rock’s high violent crime rate is the high prevalence of aggravated assault in the city. There were 1,100 aggravated assaults per 100,000 residents reported in Little Rock in 2016, the sixth most of any large city and more than four times the national rate. In response to increasing crime in the area, the Little Rock Police Department increased its street patrol presence in August 2017. There were 264 sworn officers per 100,000 Little Rock residents in 2016, among the most of any city.
 24/7 Wall St.
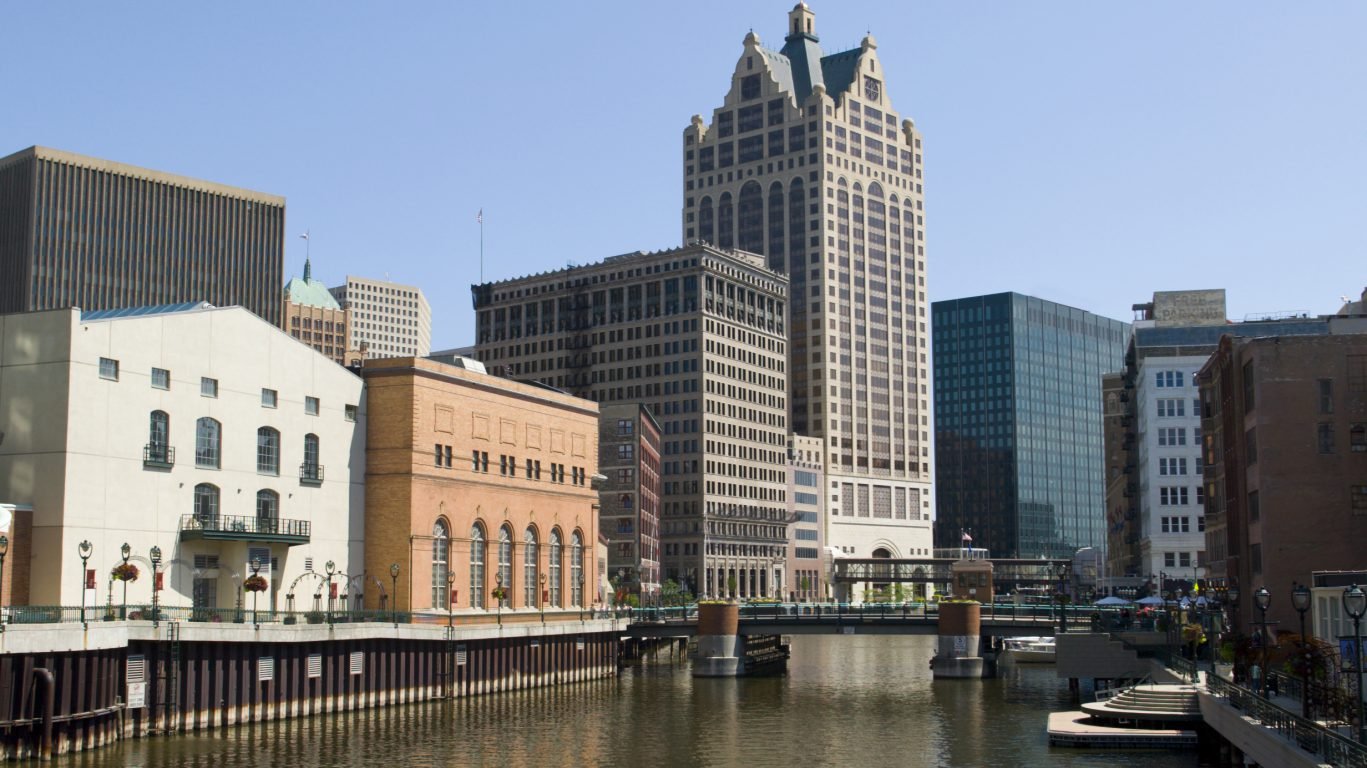
8. Milwaukee, Wisconsin
> Violent crime rate: 1,533 per 100,000
> 2016 murders: 141
> Poverty rate: 28.7%
> Unemployment rate: 5.8%
Milwaukee ranks in the top 15 for every component of violent crime other than rapes per capita. Milwaukee has the 15th worst murder rate, the ninth worst aggravated assault rate, and — with 547 reported incidents per 100,000 people — the fifth worst robbery rate of all U.S. cities. That figure is more than five times the national rate of 103 robberies reported per 100,000 residents.
Cities with high violent crime rates often tend to have high property crime rates as well. There were 1,029 reported incidents of motor vehicle theft per 100,000 residents in Milwaukee in 2016 the 11th highest rate among large U.S. cities and more than four times the national vehicle theft rate.

7. Cleveland, Ohio
> Violent crime rate: 1,631 per 100,000
> 2016 murders: 135
> Poverty rate: 36.2%
> Unemployment rate: 6.9%
Crime is often more prevalent in areas with widespread poverty. In Cleveland, an estimated 36.2% of residents live in poverty, and 20.6% of households earn less than $10,000 a year — the fourth and third largest such shares of any major U.S. city. High unemployment is also associated with a high prevalence of crime. Cleveland’s unemployment rate of 6.9% is far greater than the 4.9% national rate. In 2016, there were 1,631 violent crimes reported per 100,000 residents in Cleveland — the seventh most of any major U.S. city.
One factor that can contribute to crime is a poor relationship between local police and the community. This may have worsened in recent years, as a 2014 U.S. Department of Justice investigation concluded that the Cleveland Police Department had used excessive force against citizens, violated constitutional rights, and had inadequately policed its own officers.
[in-text-ad-2]

6. Kansas City, Missouri
> Violent crime rate: 1,655 per 100,000
> 2016 murders: 129
> Poverty rate: 19.0%
> Unemployment rate: 4.9%
Kansas City is one of several large metro areas largely responsible for the national increase in violent crime. The 18.0% spike in the number of violent crimes from 2015 to 2016 in Kansas City is far more than the 4.1% national increase over that period and among the most of any city. The increase was largely driven by a surge in murders and aggravated assaults. In total, there were 1,655 violent crimes reported per 100,000 Kansas City residents in 2016, more than four times the national rate. There were 129 homicides last year, the most in Kansas City since 2008.
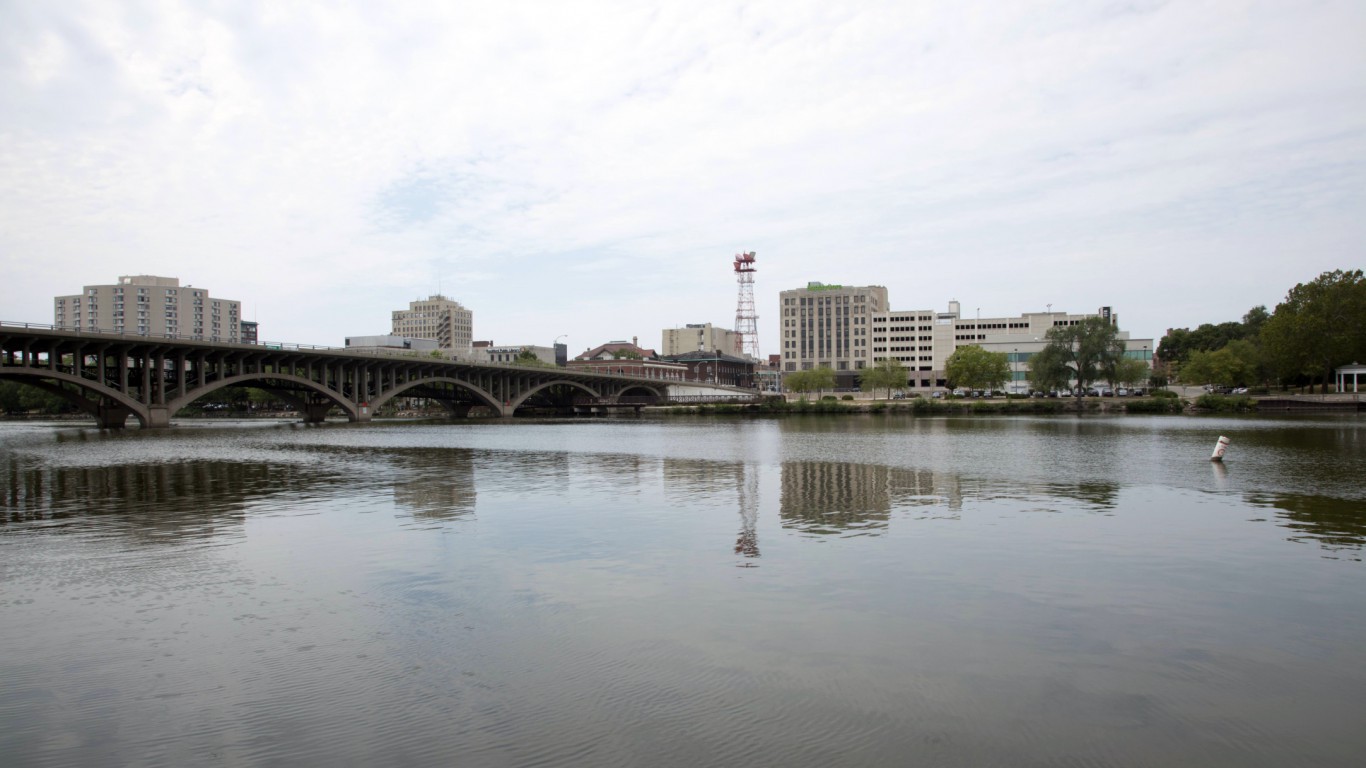
5. Rockford, Illinois
> Violent crime rate: 1,659 per 100,000
> 2016 murders: 26
> Poverty rate: 24.8%
> Unemployment rate: 7.7%
There were 1,659 violent crimes per 100,000 Rockford residents in 2016, the fifth most of any U.S. city and the most of any city with between 100,000 to 200,000 residents. 2016 was also the deadliest year in Rockford in two decades. A total of 26 homicides were reported, the most in the city since 1996. According to Rockford Police Chief Dan O’Shea, restructuring in the police department helped law enforcement solve more crimes in 2016. The number of sworn officers in Rockford rose 2.9% from 2015 to 2016, roughly the same as the nation as a whole. Rockford’s policing efforts may continue to expand in the near future, as city aldermen recently approved a budget that will allocate funds for a gunfire detection system, increased surveillance, and other police technology.
[in-text-ad]

4. Baltimore, Maryland
> Violent crime rate: 1,780 per 100,000
> 2016 murders: 318
> Poverty rate: 23.7%
> Unemployment rate: 6.3%
Baltimore is one of several large cities that accounted for a substantial portion of the nationwide increase in violent crime in 2016. While the number of violent crimes nationwide rose 4.1% from 2015 to 2016, violent crime in Baltimore increased 15.4% — nearly the most of any U.S. city. In total, there were 1,780 violent crimes reported per 100,000 Baltimore residents in 2016, far more than the national rate of 386 incidents per 100,000 Americans. Like many large metro areas, most of the gun violence in Baltimore is concentrated in the city’s poorest areas. According to one Baltimore Sun investigation, approximately 80% of gun-related homicides in Baltimore since 2011 have occurred in just 25% of the city’s neighborhoods.
 24/7 Wall St.
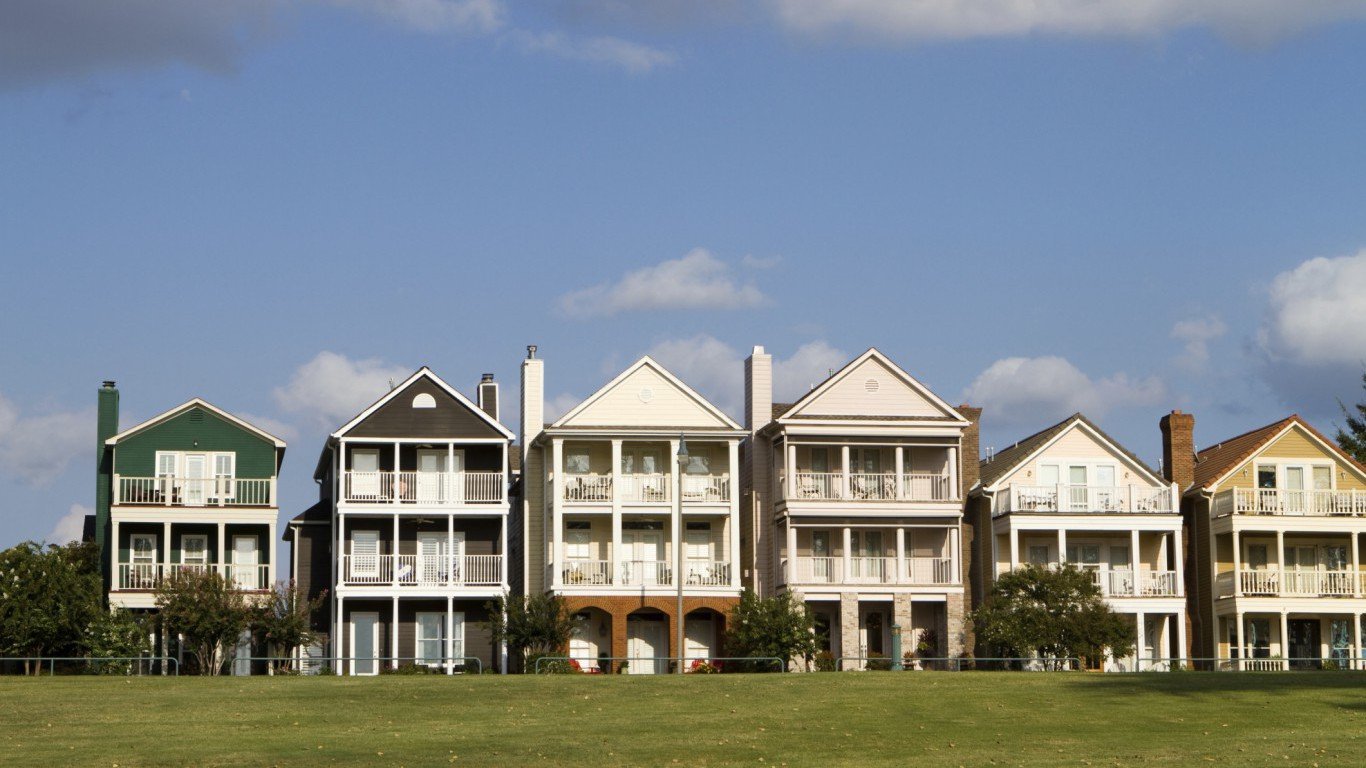
3. Memphis, Tennessee
> Violent crime rate: 1,820 per 100,000
> 2016 murders: 196
> Poverty rate: 27.6%
> Unemployment rate: 6.0%
Memphis is one of many major metropolitan areas with a large poor population and a high crime rate. Some 27.6% of residents live in poverty, a far higher rate than the 15.5% national figure. There were 1,820 violent crimes reported per 100,000 residents in Memphis in 2016, a slight uptick from the year prior and the third highest rate of any large U.S. city.
According to some city officials, Memphis would benefit from a larger police force. A number of officers resigned due to pension reforms during the Great Recession, and the size of the police force shrank by 5.7% from 2008 to 2016. According to Memphis Police Department Deputy Director Mike Ryall, a police force of approximately 2,500 officers would be adequate for curbing crime in the city. As of 2016, Memphis had 1,978 sworn officers.

2. St. Louis, Missouri
> Violent crime rate: 1,913 per 100,000
> 2016 murders: 188
> Poverty rate: 27.1%
> Unemployment rate: 5.4%
There were 1,913 violent crimes per 100,000 residents in St. Louis in 2016, the second most of any city. One factor contributing to the high incidence of crime in St. Louis is gun-related homicide. St. Louis has the highest murder rate nationwide, and it has risen in recent years even as gun violence in other large, high-crime cities leveled off. There were 60 homicides per 100,000 St. Louis residents in 2016, more than 10 times the national homicide rate. One difference between St. Louis and other major metro areas is the city’s relatively permissive gun control legislation. Individuals, for example, are allowed to carry a gun in a car without a permit, an illegal act in Chicago, Detroit, Baltimore, and New York City, according to state laws.
[in-text-ad-2]

1. Detroit, Michigan
> Violent crime rate: 2,047 per 100,000
> 2016 murders: 303
> Poverty rate: 40.3%
> Unemployment rate: 10.9%
Detroit, one of the several major metropolitan areas that are largely responsible for the increase in violent crime nationwide last year, surpassed St. Louis as the most dangerous city in 2016. The number of violent crimes rose 16.3% from 2015 to 2016, far more than the 4.1% national increase and one of the sharpest spikes of any U.S. city. The increase was largely due to a rise in the number of aggravated assaults, which increased by 30.6% year-over-year. In total, there were 2,047 violent crimes per 100,000 Detroit residents in 2016, by far the most of any city in the country and more than five times the national rate of 386 incidents per 100,000 residents.
Detailed Findings
Certain economic conditions are common in cities with the highest violent crime rates. The poverty rate in all but one of the 25 cities on this list exceeds the national rate of 15.5%; the median household incomes of all but three are lower than the national median of $53,889; and the unemployment rate in only six of the 25 most dangerous cities does not exceed the national jobless rate of 4.9% in 2016.
Prevalent crime and widespread poverty can often result in population loss, which in turn can further exacerbate the cycle of falling incomes and lead to increased violence. In 11 of the 25 cities on this list, the population declined from 2015 to 2016. In the other 14 cities, the population stayed flat or had modest growth, with only a handful outpacing the national average growth rate of 0.7%.
As Roman noted, there is a question as to which of these economic factors comes first. Did violence cause residents to flee, or did a declining population reduce the city’s tax base — which can reduce funding for municipal services such as police and drug treatment centers — and ultimately create an environment more vulnerable to crime?
Both perspectives can be supported. In cities such as New York and Pittsburgh, investment in the city increased after violent crime had been reduced. “If you can make a place safe, investment will follow,” Roman said.
To reverse crime spikes and support safe communities, resources are needed to support modern policing methods. Child and family welfare, mental health considerations, substance abuse, education, employment, housing, and more affect the problems that lead to violence in a community. “If you don’t have the resources to coordinate all of [these issues],” Roman explained, “all you’re left with is the cop on the beat.”
And while officers on patrol are often very effective at enforcing law and order, modern policing requires different problems be addressed in different ways. Today’s police departments must address crime at the grassroots level, building relationships with the local community and supporting educational and extracurricular organizations. Many of the cities with high and rising violent crime levels were hit by the recession, and have struggled to find the resources necessary to provide this service.
Methodology
To identify the 25 most dangerous U.S. cities, 24/7 Wall St. reviewed violent crime rates in cities with at least 100,000 people from the FBI’s 2016 Uniform Crime Report released September 25, 2017. The total number and the rates of murder, non-negligent manslaughter, rape, robbery, and aggravated assault, which are included in the violent crime rate, as well as burglaries, larceny, and motor vehicle theft — all classified as property crime — also came from the FBI’s report. We also considered these data for each year from 2012 through 2016. Population, and the number of police officers in each city in 2016, 2015, and in 2008 came from the FBI.
Annual unemployment rates for 2016 came from the Bureau of Labor Statistics (BLS). Median household income, poverty rates, and the percentage of households earning less than $10,000 a year came from the U.S. Census Bureau’s American Community Survey (ACS) and are five-year averages for the period 2011 to 2015.
Sponsored: Want to Retire Early? Here’s a Great First Step
Want retirement to come a few years earlier than you’d planned? Or are you ready to retire now, but want an extra set of eyes on your finances?
Now you can speak with up to 3 financial experts in your area for FREE. By simply clicking here you can begin to match with financial professionals who can help you build your plan to retire early. And the best part? The first conversation with them is free.
Click here to match with up to 3 financial pros who would be excited to help you make financial decisions.