
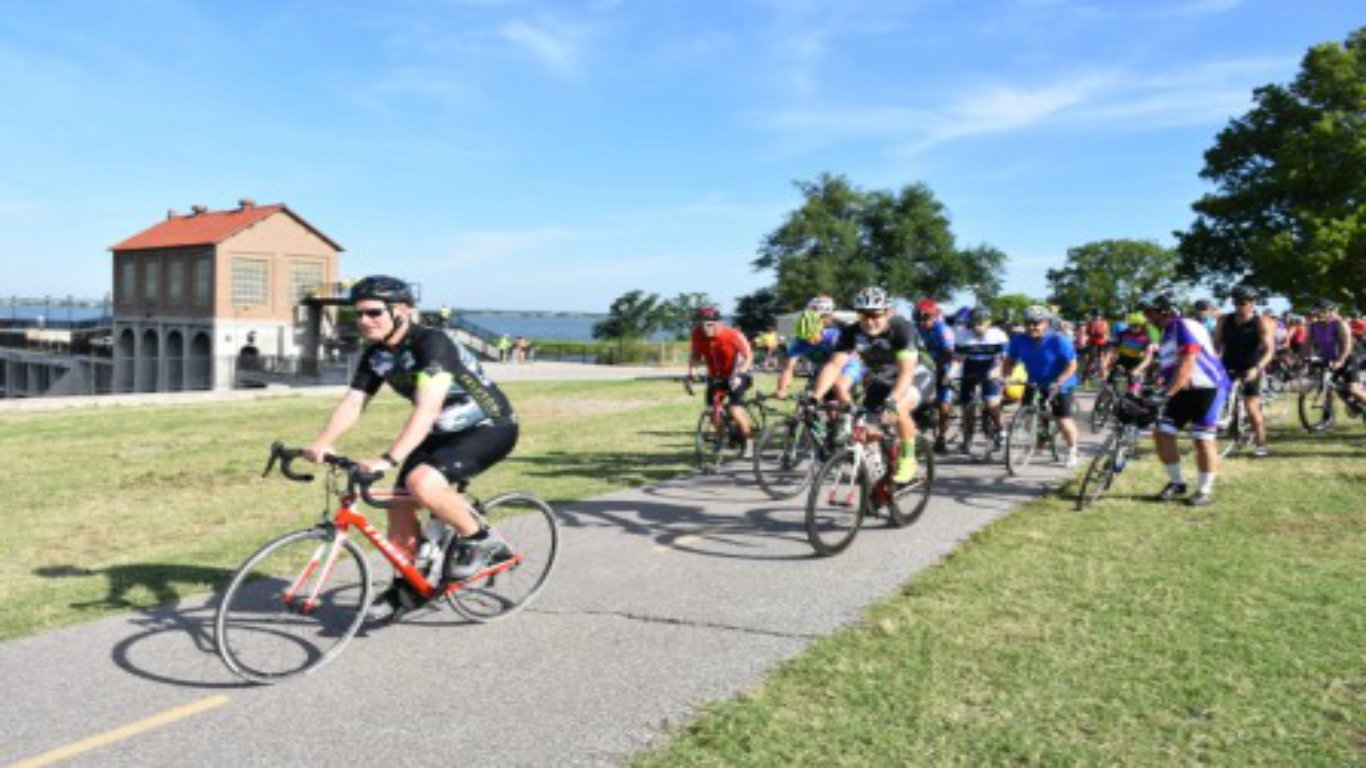
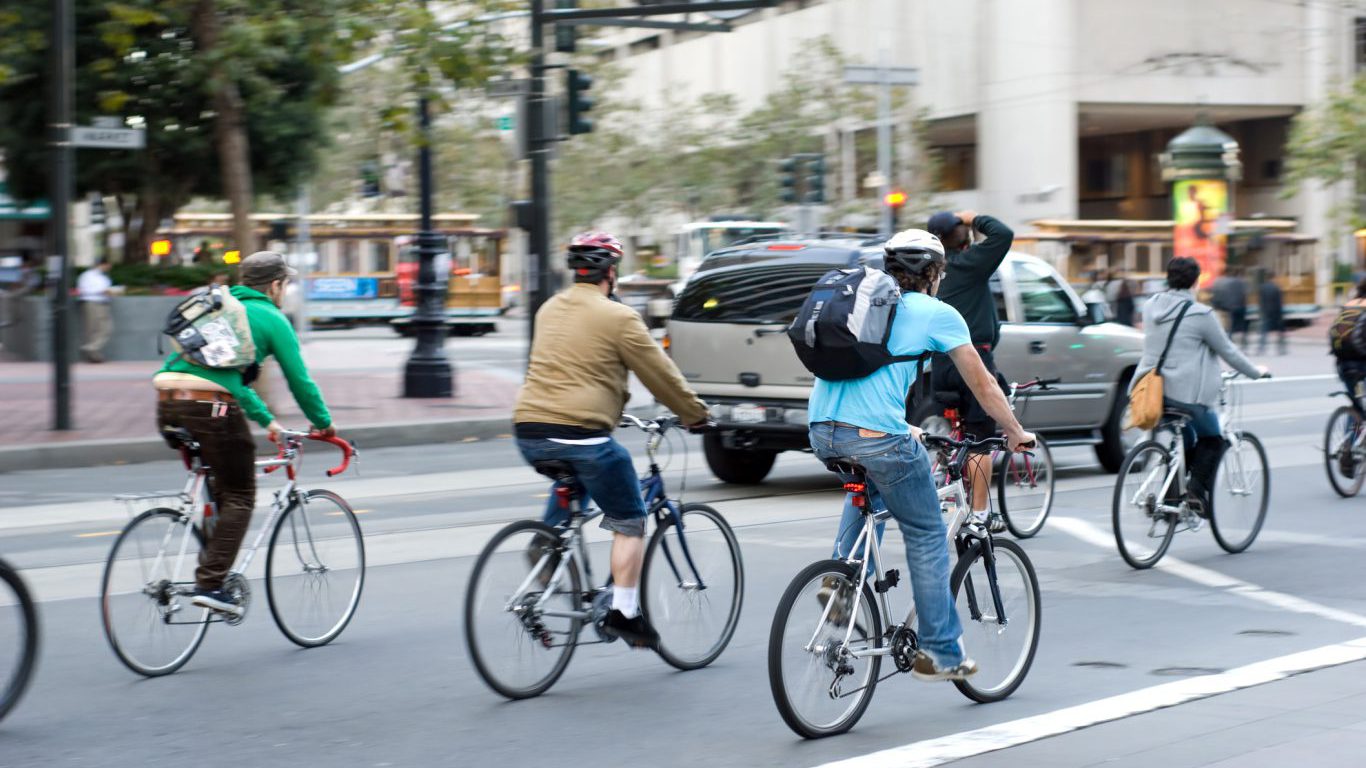
The United States is not known for its bike-friendly infrastructure. Next to cities like Copenhagen, Denmark and Amsterdam, Netherlands, where bikes often outnumber cars and where biking is common across all demographics, U.S. cities appear car-obsessed places, where biking is reserved for athletes and young adults.
Despite the nation’s relatively poor bike system, the number of Americans riding bikes is on the rise, and the vast majority of large cities are remarkably safe for cyclists. Over the decade after 2000, the number of people commuting by bike increased by 60%, from approximately 488,000 to 786,000. Bike infrastructure has expanded over that time and roads have generally become safer for cyclists. In 2015, there were 818 biking deaths, comprising 2.3% of the total traffic deaths that year of 35,092.
About 70% of fatal cyclist crashes occurred in urban areas. Because riding a bike is relatively more dangerous — and common — in large cities in particular, we limited our comparison to the 32 U.S. cities with populations of 500,000 or greater. Zero cyclists were killed in traffic accidents in three of the cities on this list.
While injury statistics are not available at the city level, 35,000 cyclists were injured in traffic accidents nationwide. Injuries are likely more common in cities where fatalities are more common.
The popularity of commuting to work by bike does not appear to be associated with the likelihood of a fatal accident. For instance, approximately 2.5% of working-age residents commute by bike in Boston, where no biking fatalities occurred in 2015. The same percentage of workers commute by bike in Tucson, which had the second most biking fatalities of U.S. cities.
The vast majority of bicyclists killed in traffic accidents are men, especially male cyclists 55 to 59 years old, according to the Department of Transportation.
Click here to see the most dangerous (and safest) cities for bikes.
To identify the most dangerous (and safest) cities for bikes, 24/7 Wall St. reviewed the number of bicyclists and riders of other pedal-driven vehicles who died in traffic crashes in 2015. The fatality rate is defined as the number of crashes per every 1 million people and was provided for the 32 U.S. cities with populations of 500,000 people or more from the National Highway Traffic Safety Administration. The percentage of residents commuting to work by bike came from the U.S. Census Bureau’s 2016 American Community Survey.
Source: okc.gov
32. Oklahoma City, OK
> Bicyclist fatality rate: 0.0 per 1 million people
> Bicyclist fatalities: 0
> Population: 631,346
> Total traffic fatalities: 86 (136.2 per 1 million people)
> Working-age population commuting by bike: 0.3%
[in-text-ad]
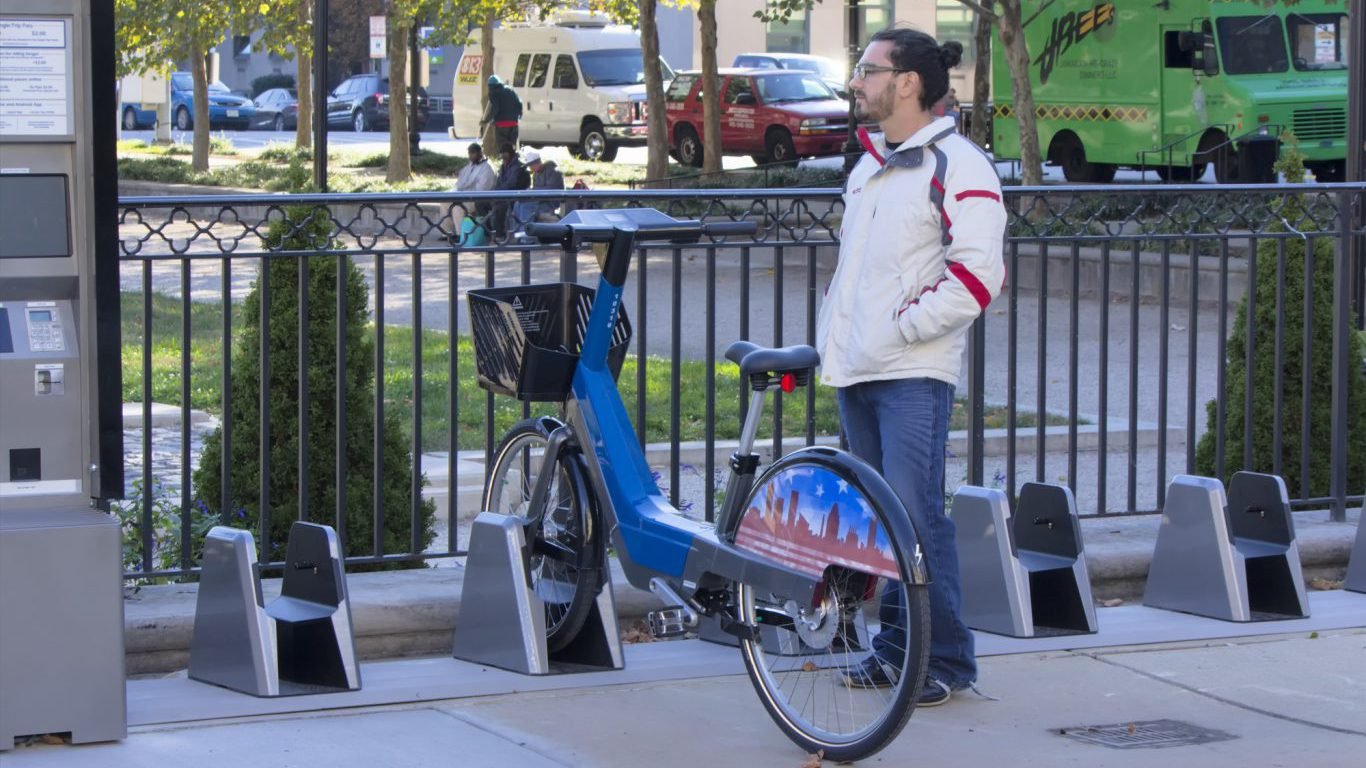
Source: danlogan / iStock
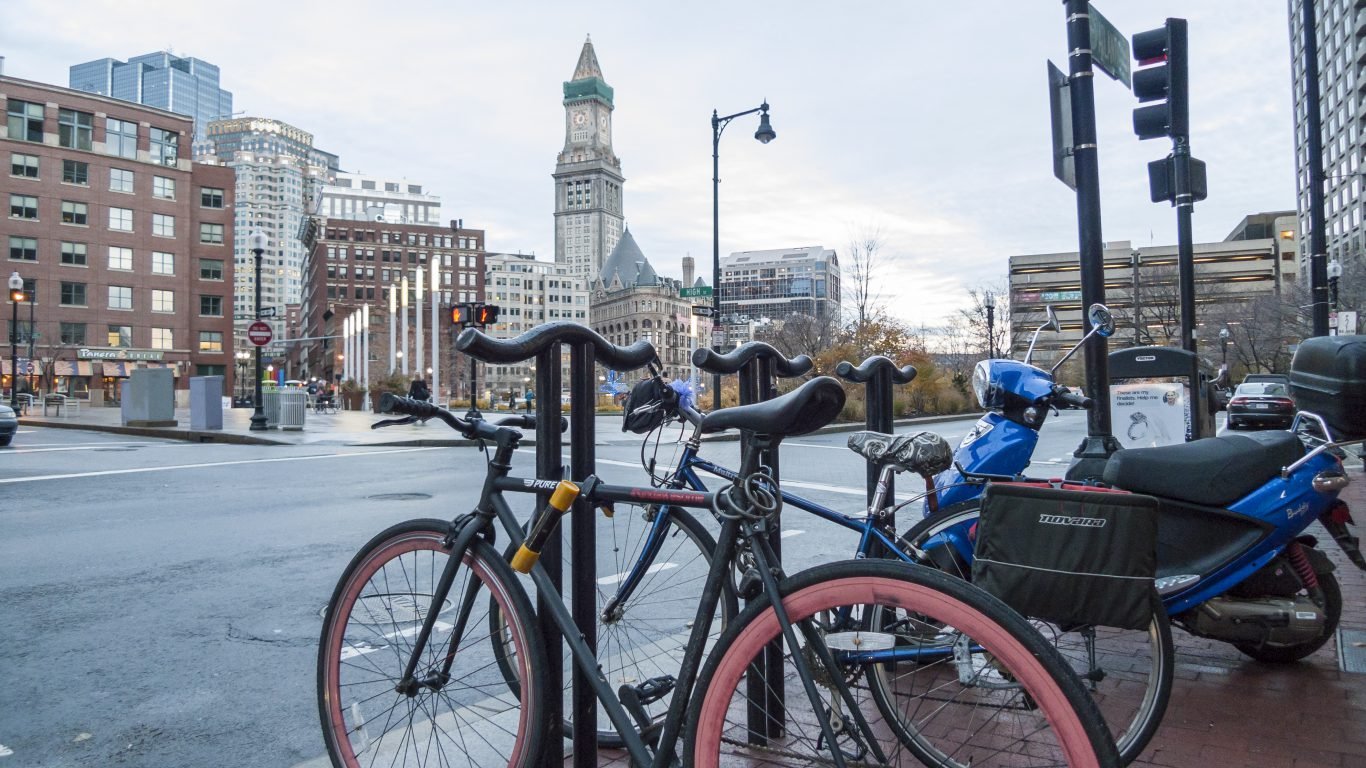
31. Boston, MA
> Bicyclist fatality rate: 0.0 per 1 million people
> Bicyclist fatalities: 0
> Population: 667,137
> Total traffic fatalities: 14 (21.0 per 1 million people)
> Working-age population commuting by bike: 2.4%
 24/7 Wall St.
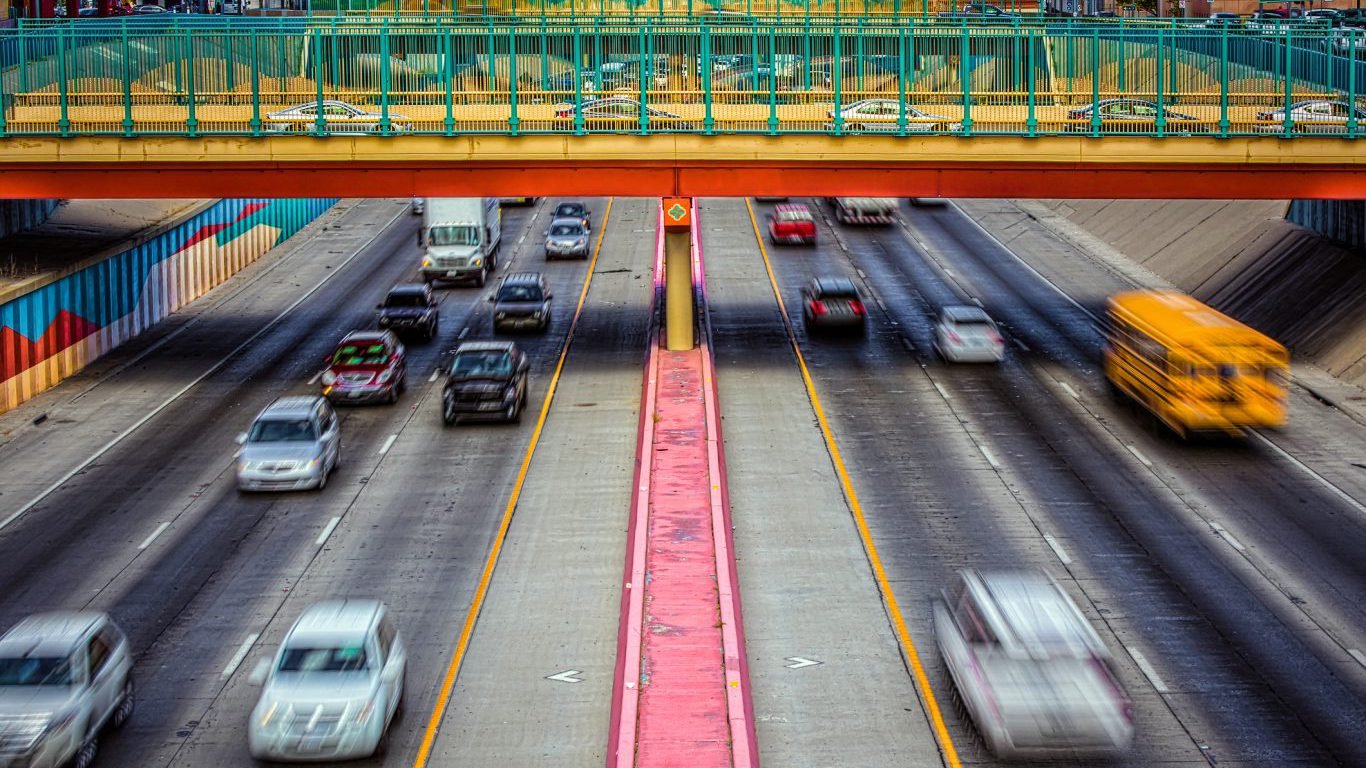
Source: Bill Chizek / iStock
30. El Paso, TX
> Bicyclist fatality rate: 0.0 per 1 million people
> Bicyclist fatalities: 0
> Population: 681,124
> Total traffic fatalities: 50 (73.4 per 1 million people)
> Working-age population commuting by bike: 0.4%

Source: RoschetzkyIstockPhoto / iStock
29. Dallas, TX
> Bicyclist fatality rate: 0.8 per 1 million people
> Bicyclist fatalities: 1
> Population: 1,300,092
> Total traffic fatalities: 174 (133.8 per 1 million people)
> Working-age population commuting by bike: 0.2%
[in-text-ad-2]
Source: smontgom65 / iStock
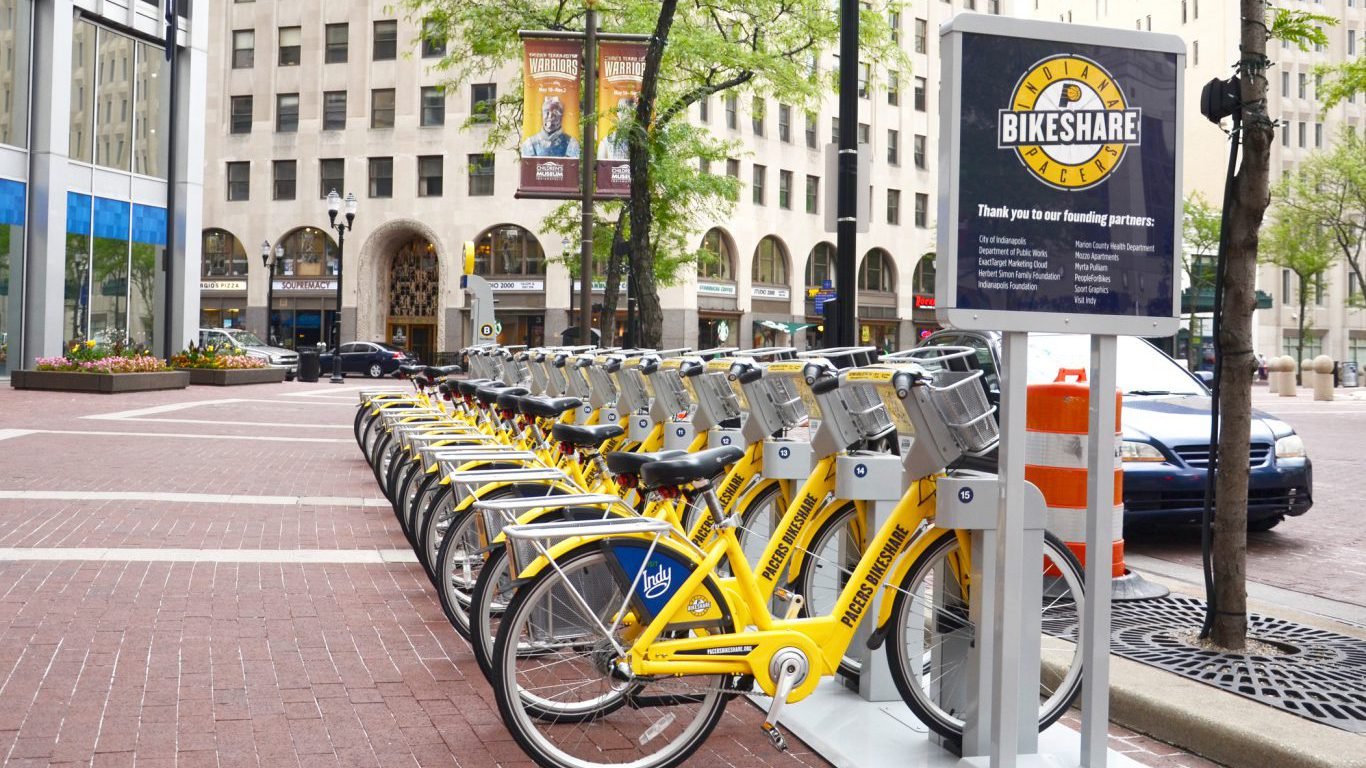
28. Indianapolis, IN
> Bicyclist fatality rate: 1.2 per 1 million people
> Bicyclist fatalities: 1
> Population: 853,173
> Total traffic fatalities: 95 (111.3 per 1 million people)
> Working-age population commuting by bike: 0.5%
Source: typhoonski / iStock
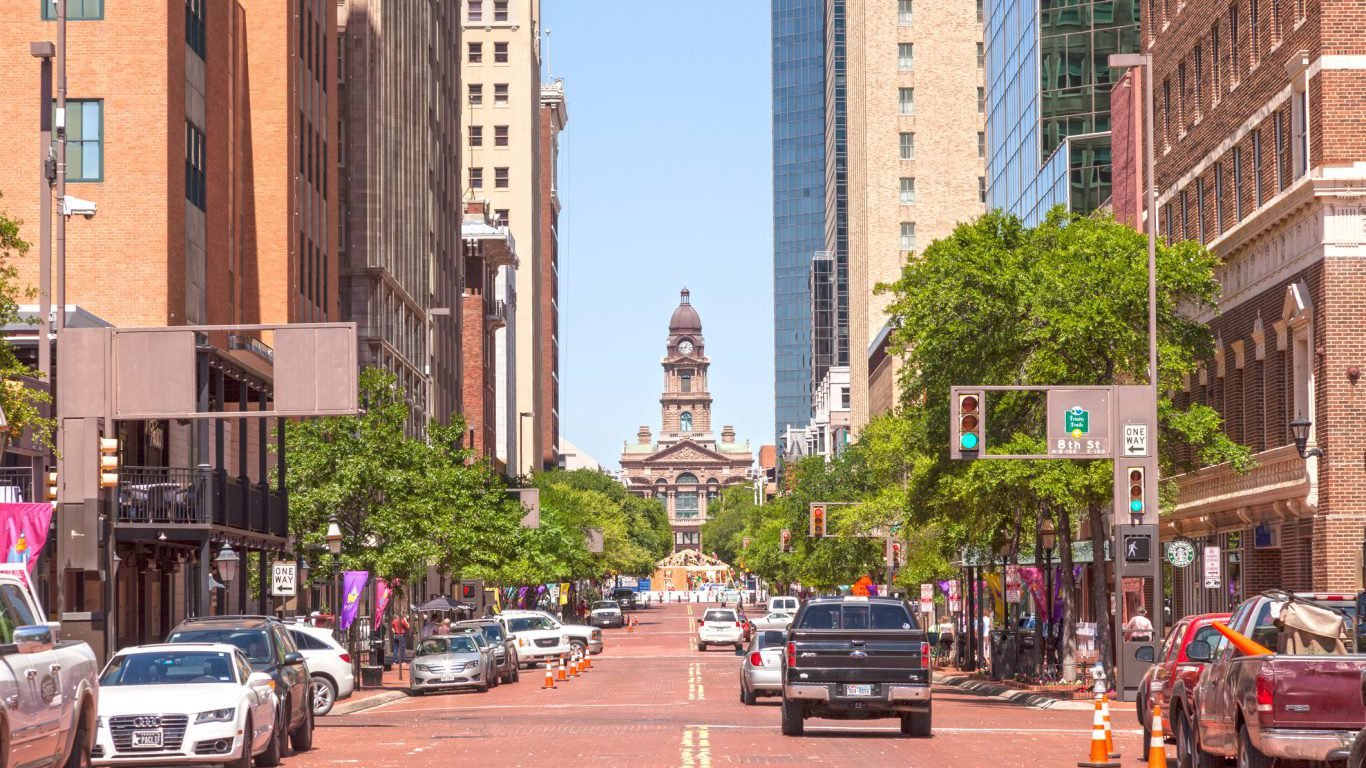
27. Fort Worth, TX
> Bicyclist fatality rate: 1.2 per 1 million people
> Bicyclist fatalities: 1
> Population: 833,319
> Total traffic fatalities: 83 (99.6 per 1 million people)
> Working-age population commuting by bike: 0.1%
[in-text-ad]
Source: LindaWashburnRoberts / iStock
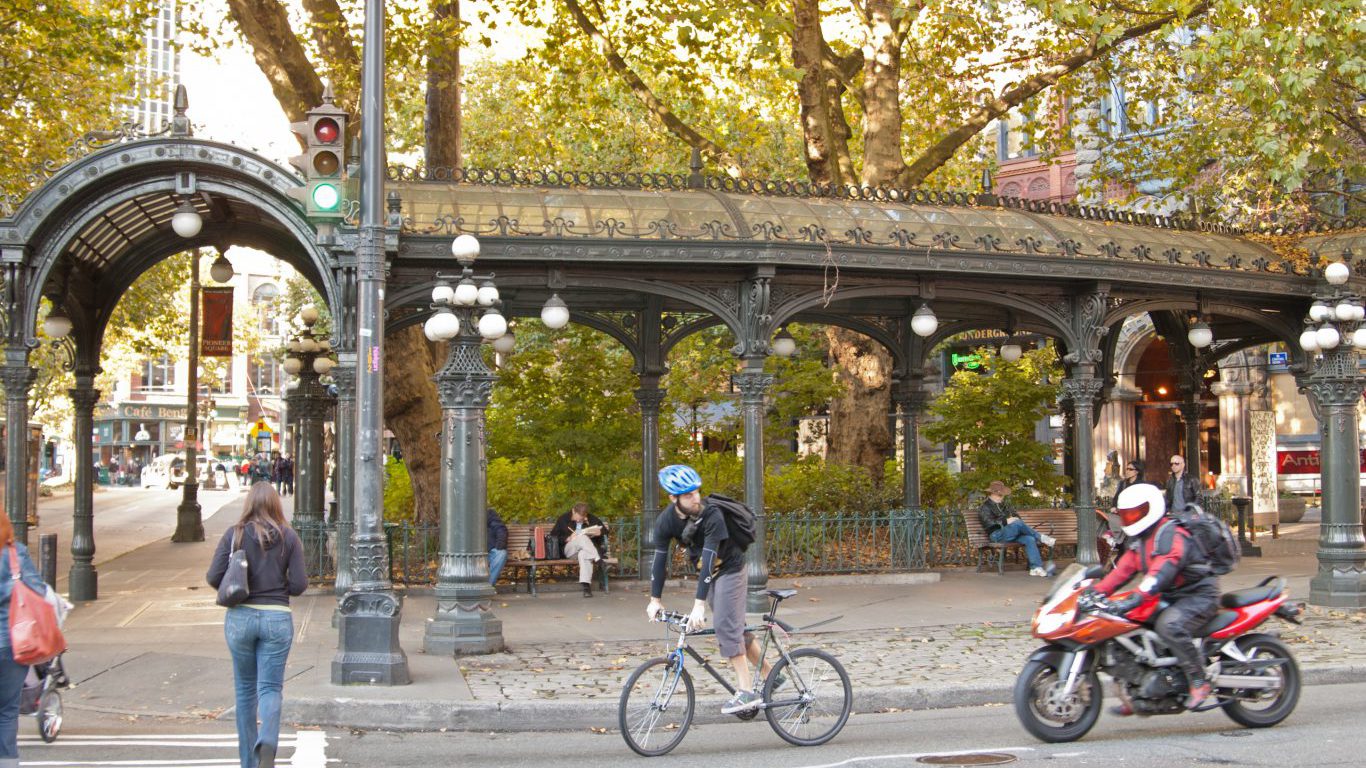
26. Seattle, WA
> Bicyclist fatality rate: 1.5 per 1 million people
> Bicyclist fatalities: 1
> Population: 684,451
> Total traffic fatalities: 26 (38.0 per 1 million people)
> Working-age population commuting by bike: 3.5%
Source: TracieMichelle / iStock
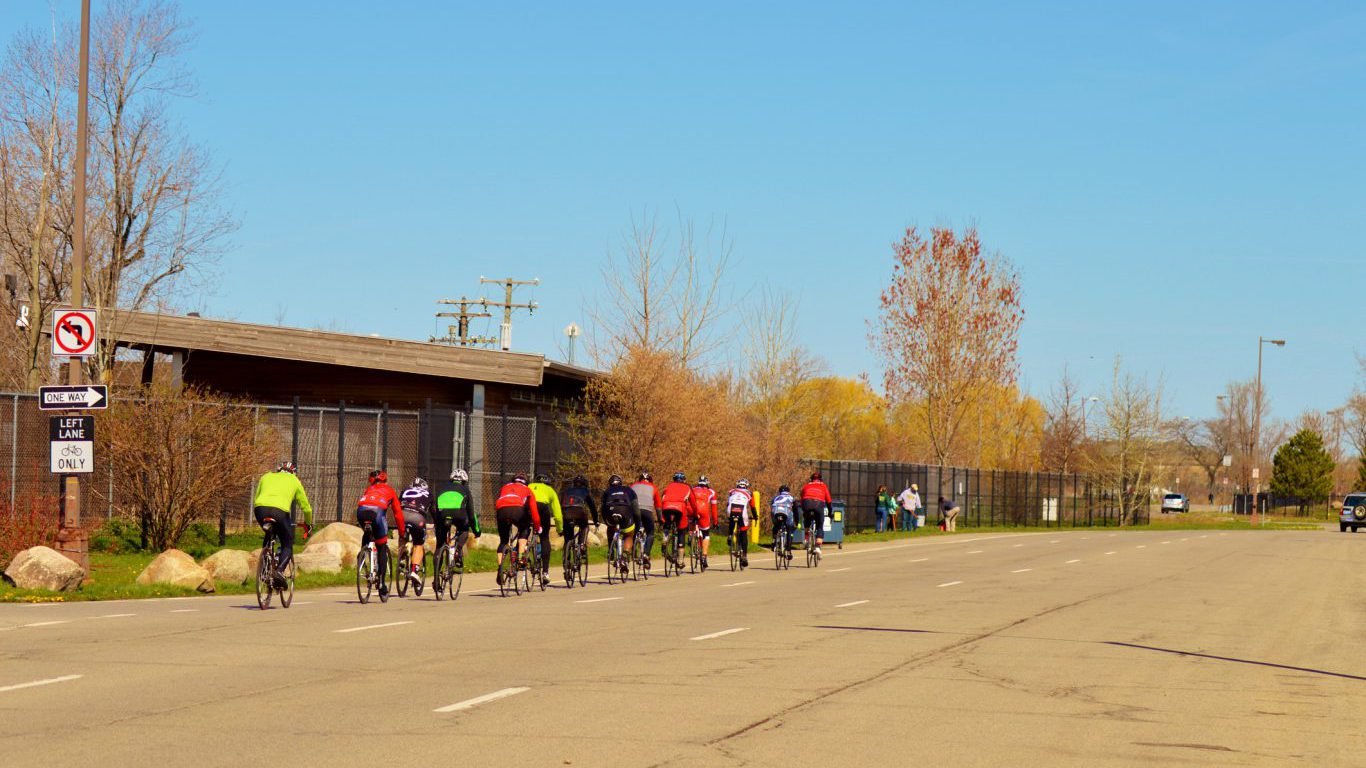
25. Detroit, MI
> Bicyclist fatality rate: 1.5 per 1 million people
> Bicyclist fatalities: 1
> Population: 677,116
> Total traffic fatalities: 130 (192.0 per 1 million people)
> Working-age population commuting by bike: 1.0%
Source: Coast-to-Coast / iStock
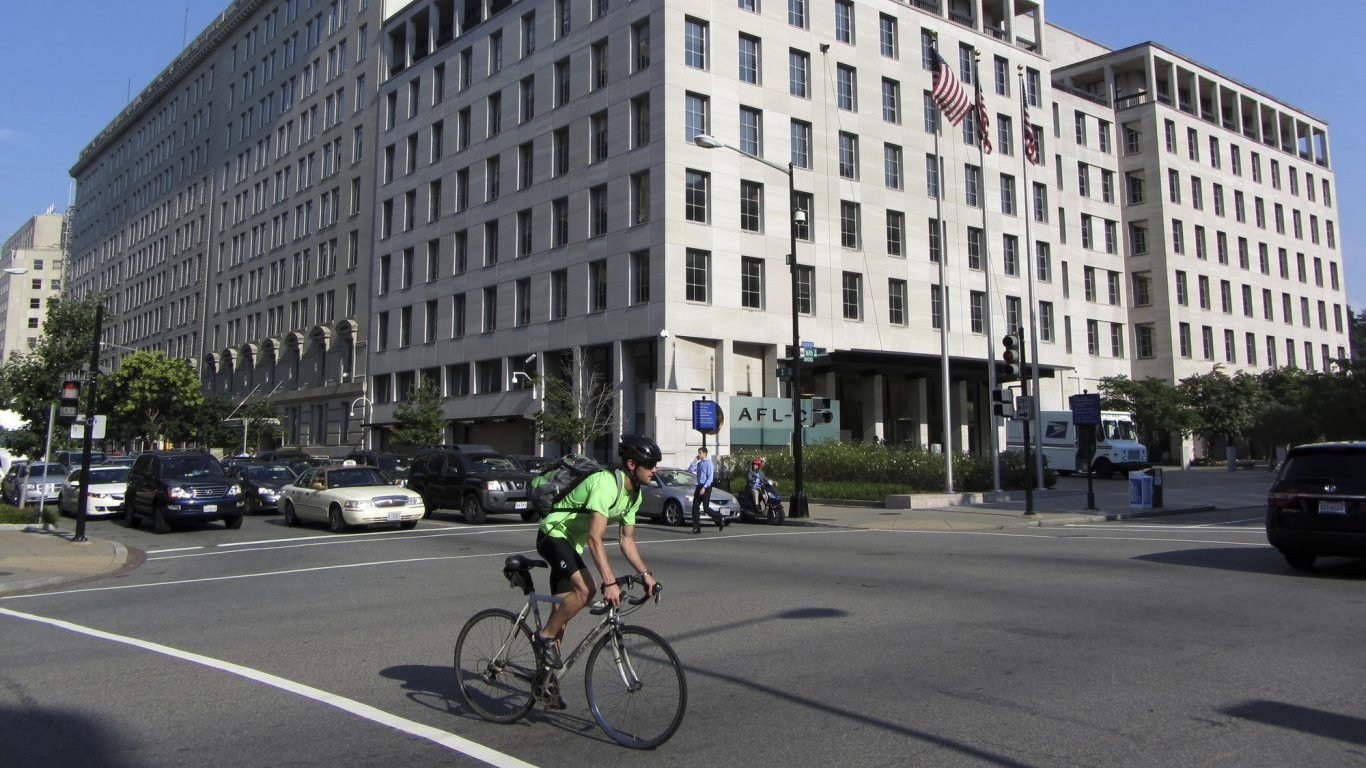
24. Washington, DC
> Bicyclist fatality rate: 1.5 per 1 million people
> Bicyclist fatalities: 1
> Population: 672,228
> Total traffic fatalities: 23 (34.2 per 1 million people)
> Working-age population commuting by bike: 4.6%
[in-text-ad-2]

Source: oneinchpunch / iStock
23. New York, NY
> Bicyclist fatality rate: 1.5 per 1 million people
> Bicyclist fatalities: 13
> Population: 8,550,405
> Total traffic fatalities: 241 (28.2 per 1 million people)
> Working-age population commuting by bike: 1.2%
Source: CharlieFloyd / iStock
22. Baltimore, MD
> Bicyclist fatality rate: 1.6 per 1 million people
> Bicyclist fatalities: 1
> Population: 621,849
> Total traffic fatalities: 35 (56.3 per 1 million people)
> Working-age population commuting by bike: 1.0%
[in-text-ad]
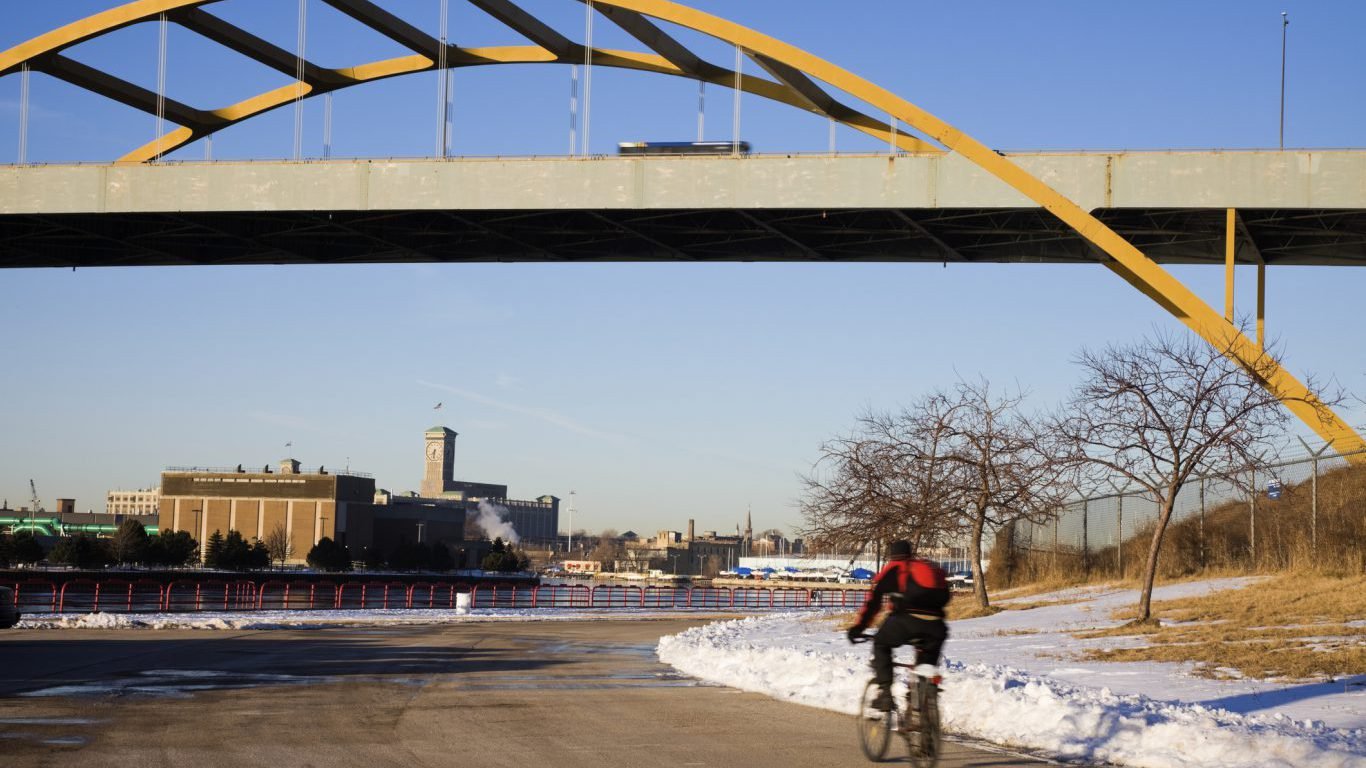
Source: benkrut / iStock
21. Milwaukee, WI
> Bicyclist fatality rate: 1.7 per 1 million people
> Bicyclist fatalities: 1
> Population: 600,155
> Total traffic fatalities: 67 (111.6 per 1 million people)
> Working-age population commuting by bike: 0.9%

Source: ArthurHidden / iStock
20. Fresno, CA
> Bicyclist fatality rate: 1.9 per 1 million people
> Bicyclist fatalities: 1
> Population: 520,052
> Total traffic fatalities: 15 (28.8 per 1 million people)
> Working-age population commuting by bike: 0.7%
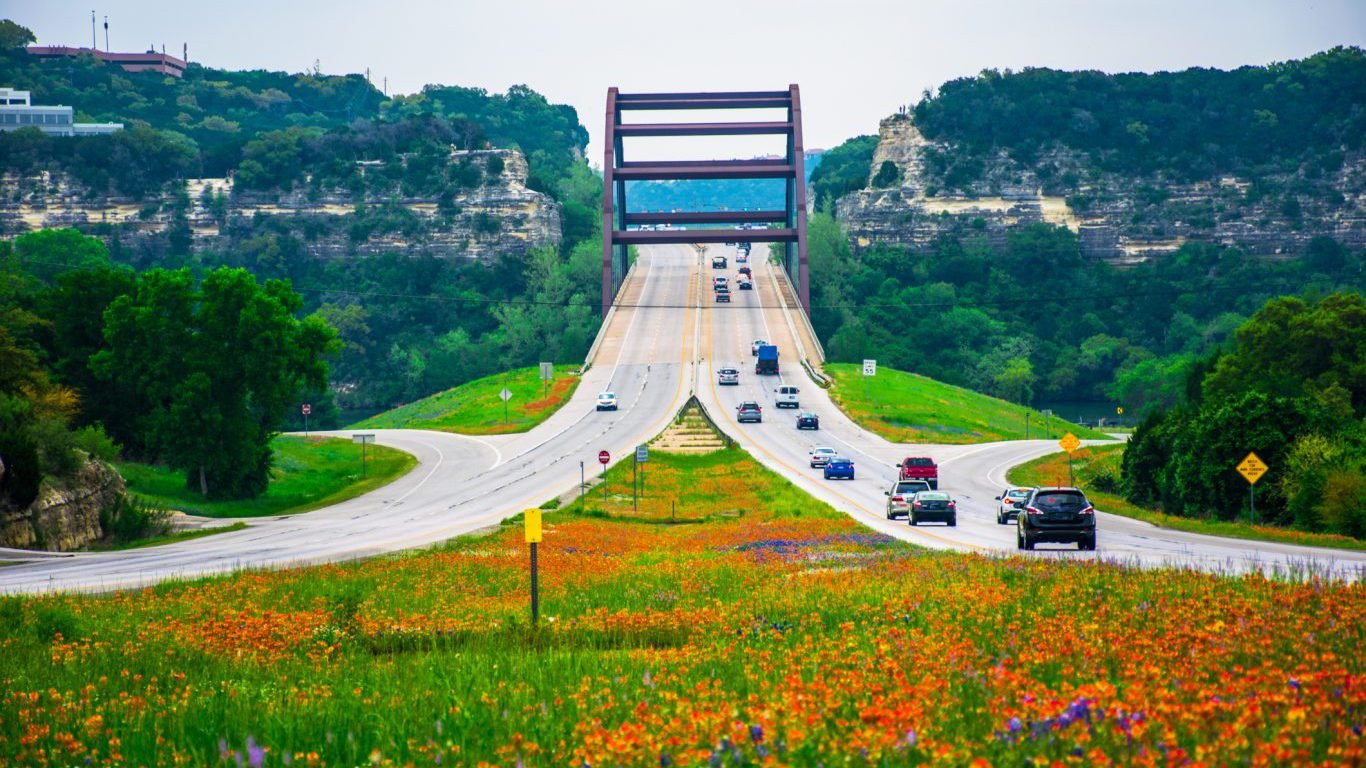
Source: RoschetzkyIstockPhoto / iStock
19. Austin, TX
> Bicyclist fatality rate: 2.1 per 1 million people
> Bicyclist fatalities: 2
> Population: 931,830
> Total traffic fatalities: 105 (112.7 per 1 million people)
> Working-age population commuting by bike: 1.5%
[in-text-ad-2]

Source: GeorgeRudy / iStock
18. San Diego, CA
> Bicyclist fatality rate: 2.1 per 1 million people
> Bicyclist fatalities: 3
> Population: 1,394,928
> Total traffic fatalities: 95 (68.1 per 1 million people)
> Working-age population commuting by bike: 1.0%
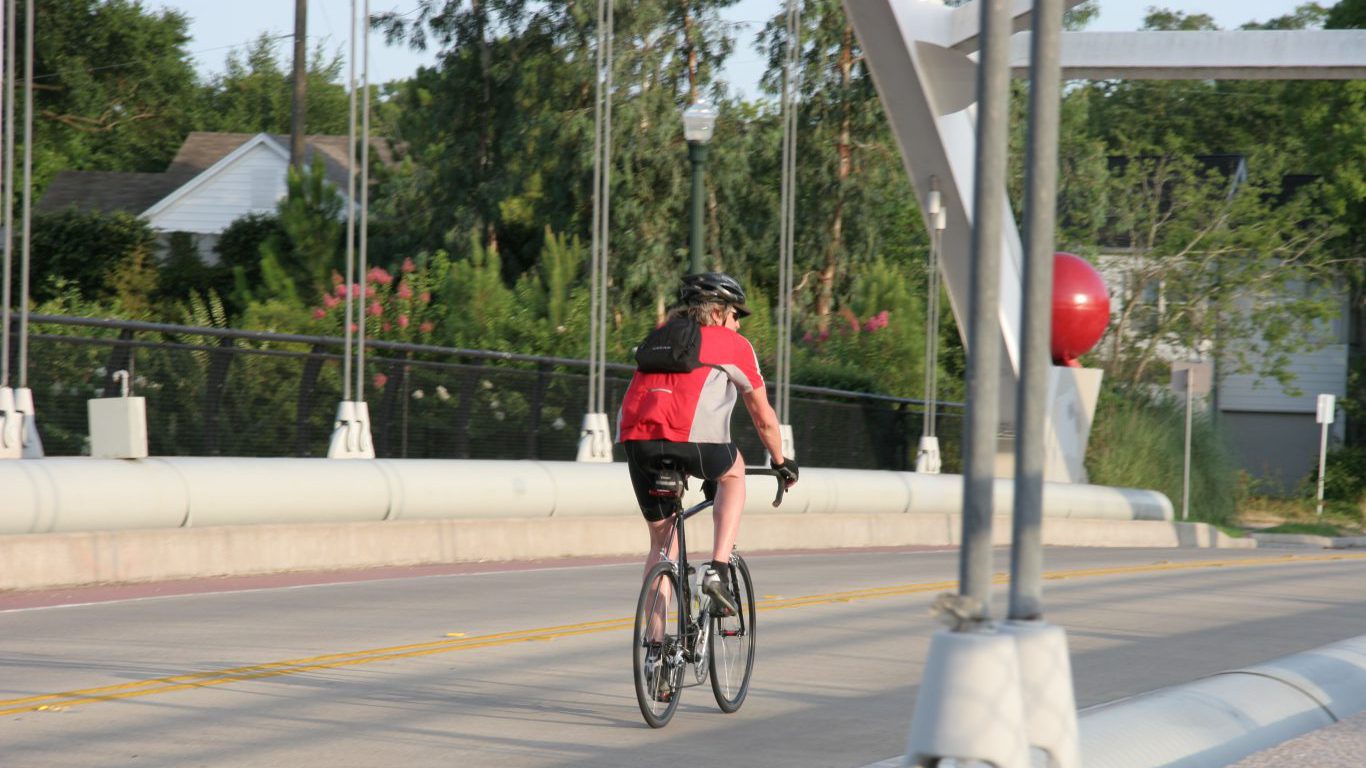
Source: cheng8 / iStock
17. Houston, TX
> Bicyclist fatality rate: 2.2 per 1 million people
> Bicyclist fatalities: 5
> Population: 2,296,224
> Total traffic fatalities: 211 (91.9 per 1 million people)
> Working-age population commuting by bike: 0.5%
[in-text-ad]

Source: digidreamgrafix / iStock
16. Charlotte, NC
> Bicyclist fatality rate: 2.4 per 1 million people
> Bicyclist fatalities: 2
> Population: 827,097
> Total traffic fatalities: 69 (83.4 per 1 million people)
> Working-age population commuting by bike: 0.0%

Source: starmaro / iStock
15. Chicago, IL
> Bicyclist fatality rate: 2.6 per 1 million people
> Bicyclist fatalities: 7
> Population: 2,720,546
> Total traffic fatalities: 121 (44.5 per 1 million people)
> Working-age population commuting by bike: 1.7%

Source: DragonImages / iStock
14. San Antonio, TX
> Bicyclist fatality rate: 2.7 per 1 million people
> Bicyclist fatalities: 4
> Population: 1,469,845
> Total traffic fatalities: 155 (105.5 per 1 million people)
> Working-age population commuting by bike: 0.1%
[in-text-ad-2]

Source: TheAccidentalChoice / iStock
13. Denver, CO
> Bicyclist fatality rate: 2.9 per 1 million people
> Bicyclist fatalities: 2
> Population: 682,545
> Total traffic fatalities: 51 (74.7 per 1 million people)
> Working-age population commuting by bike: 2.2%

Source: kevinruss / iStock
12. Portland, OR
> Bicyclist fatality rate: 3.2 per 1 million people
> Bicyclist fatalities: 2
> Population: 632,309
> Total traffic fatalities: 36 (56.9 per 1 million people)
> Working-age population commuting by bike: 3.8%
[in-text-ad]
Source: SeanPavonePhoto / iStock
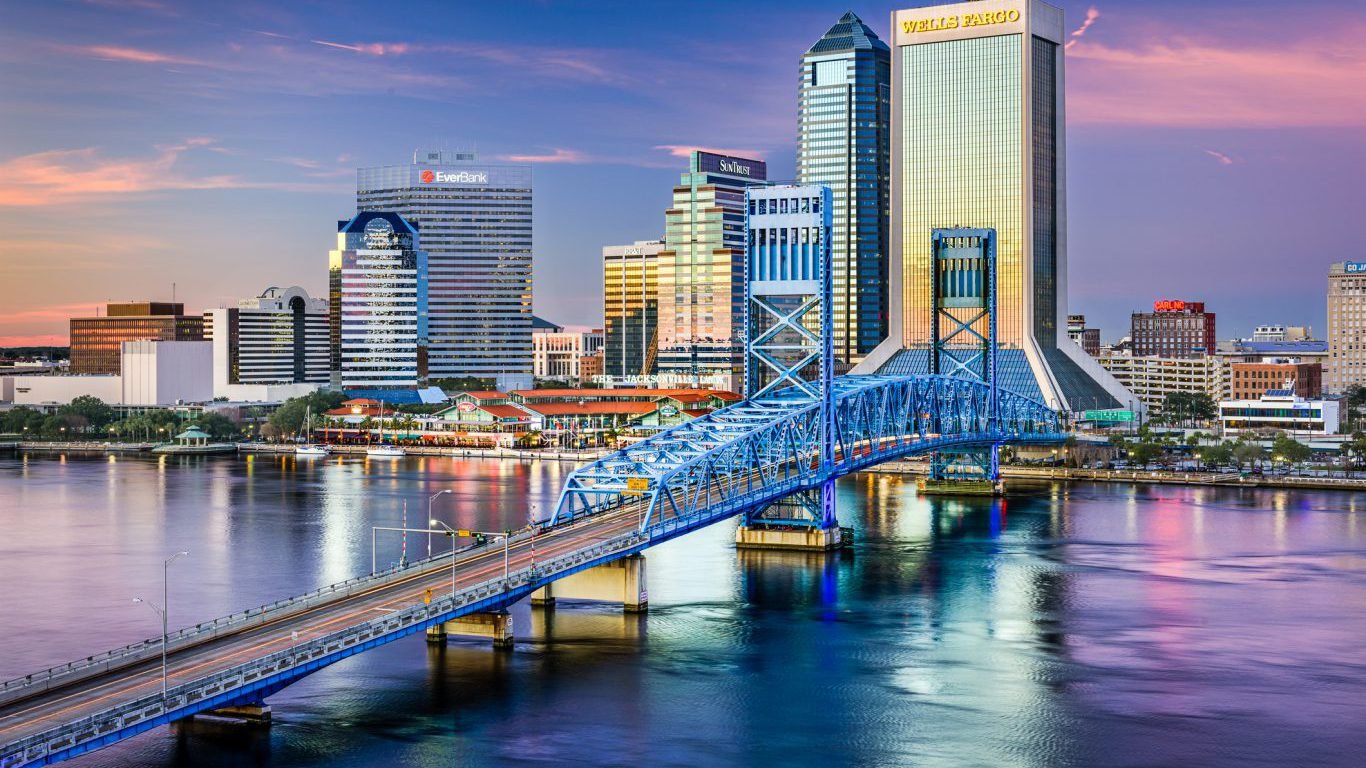
11. Jacksonville, FL
> Bicyclist fatality rate: 3.5 per 1 million people
> Bicyclist fatalities: 3
> Population: 868,031
> Total traffic fatalities: 125 (144.0 per 1 million people)
> Working-age population commuting by bike: 0.7%
 24/7 Wall St.
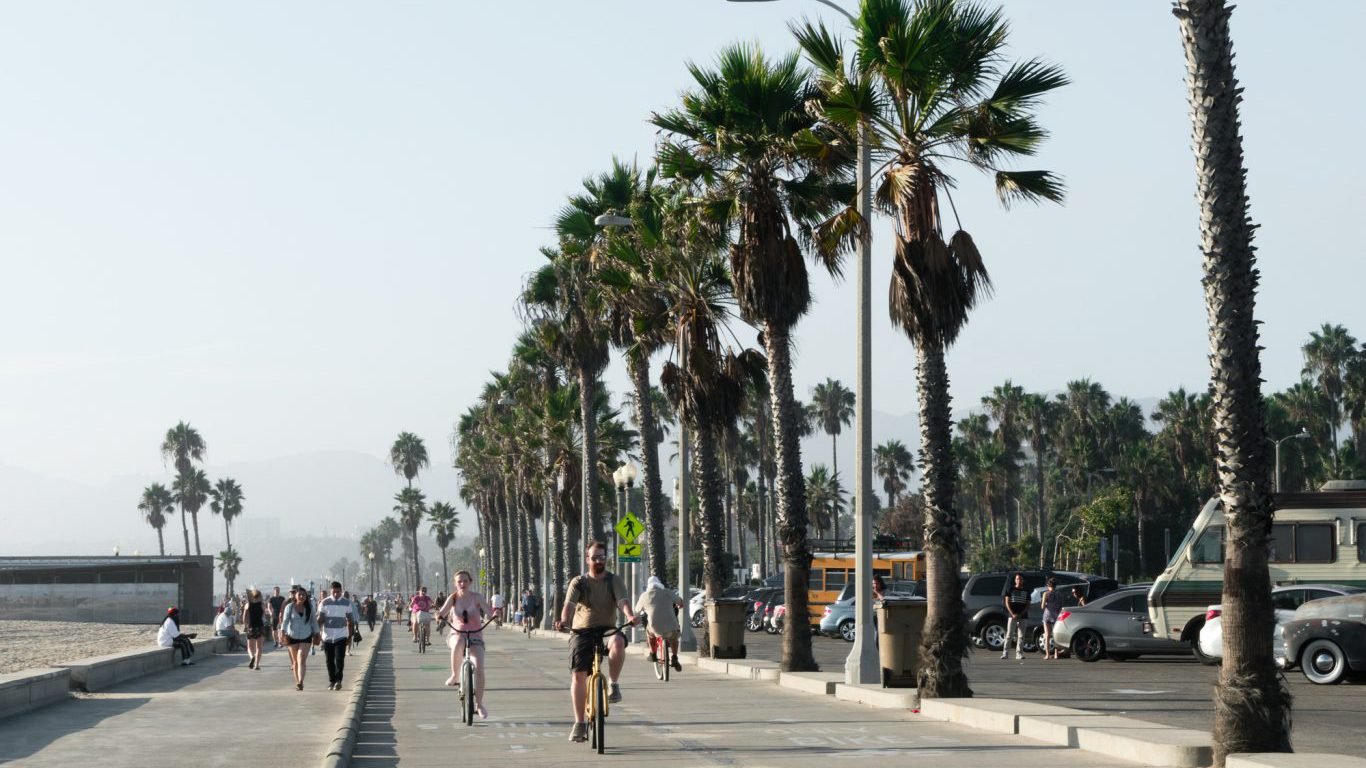
Source: ULU_BIRD / iStock
10. Los Angeles, CA
> Bicyclist fatality rate: 4.0 per 1 million people
> Bicyclist fatalities: 16
> Population: 3,971,883
> Total traffic fatalities: 224 (56.4 per 1 million people)
> Working-age population commuting by bike: 1.1%
Source: olcayduzgun / iStock
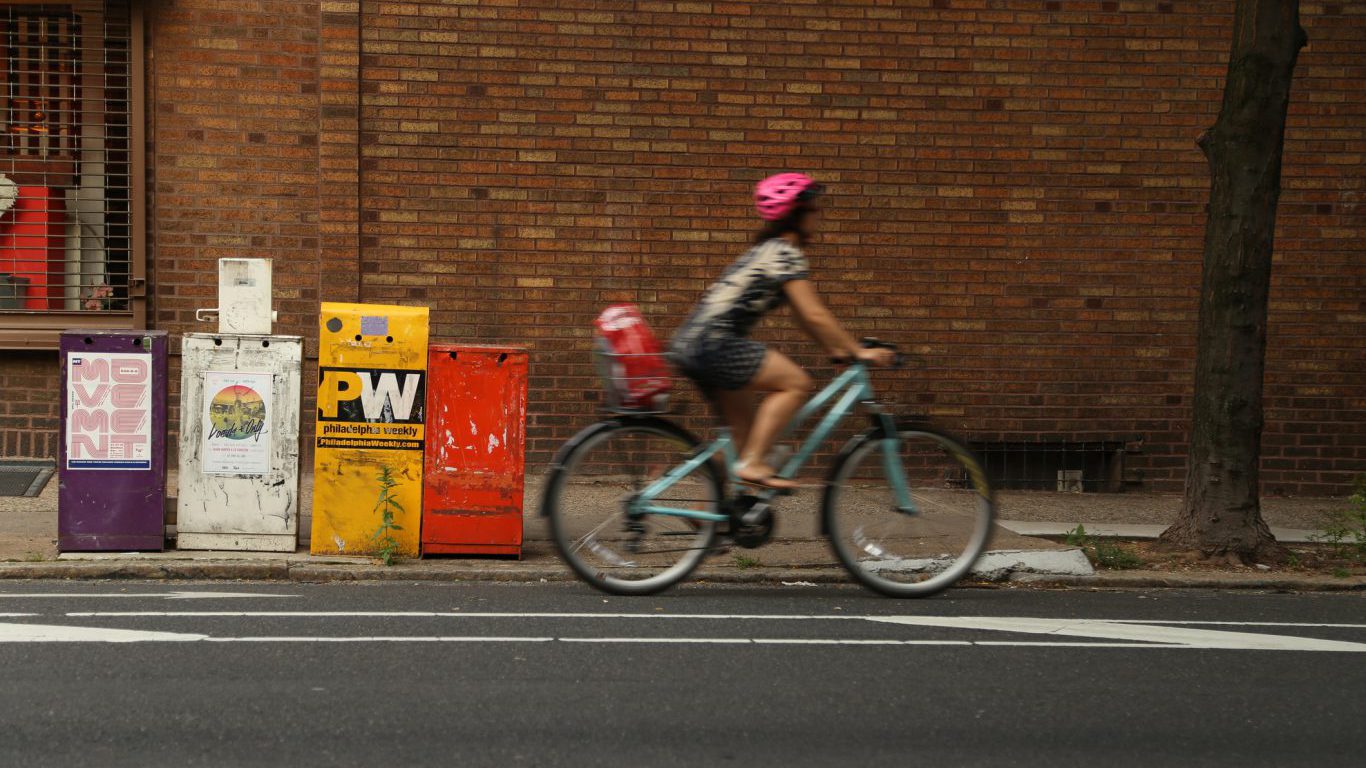
9. Philadelphia, PA
> Bicyclist fatality rate: 4.5 per 1 million people
> Bicyclist fatalities: 7
> Population: 1,567,442
> Total traffic fatalities: 93 (59.3 per 1 million people)
> Working-age population commuting by bike: 2.2%
[in-text-ad-2]
Source: csfotoimages / iStock
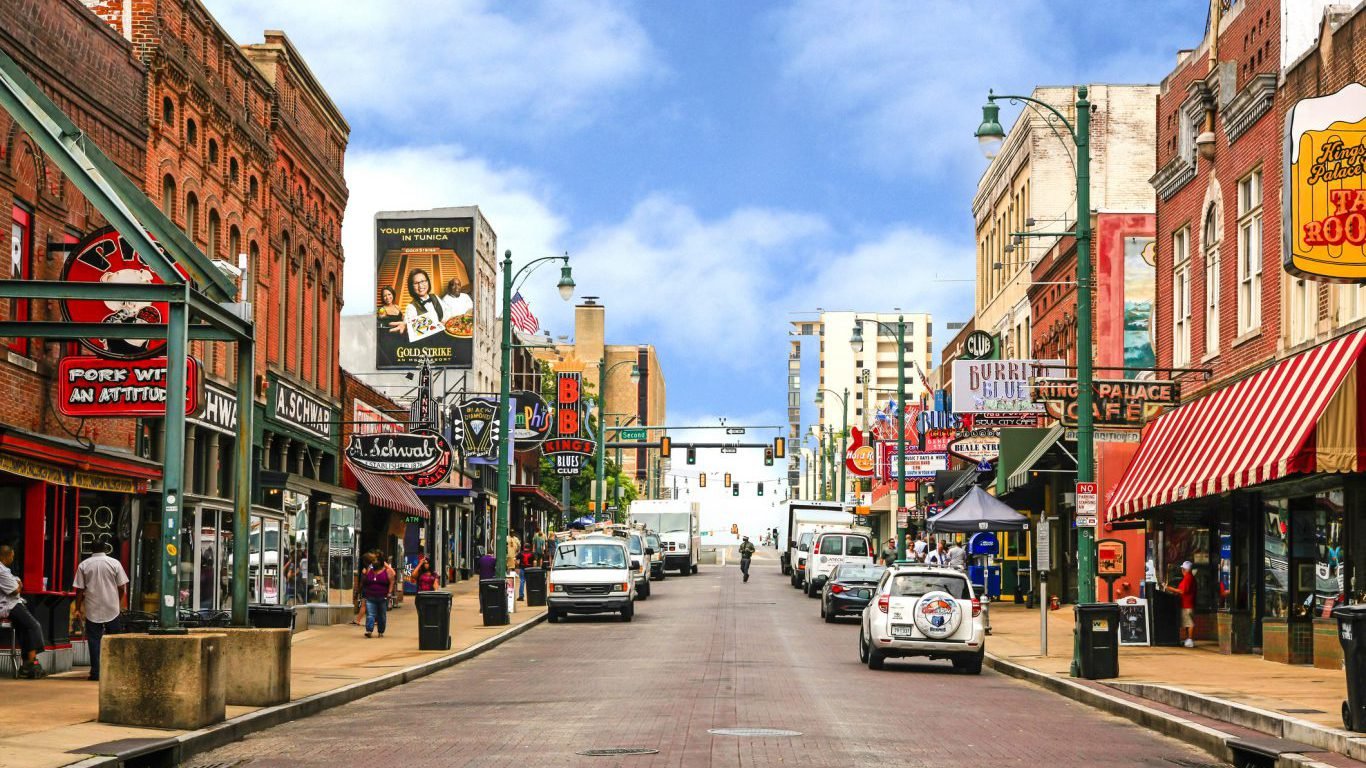
8. Memphis, TN
> Bicyclist fatality rate: 4.6 per 1 million people
> Bicyclist fatalities: 3
> Population: 655,770
> Total traffic fatalities: 102 (155.5 per 1 million people)
> Working-age population commuting by bike: 0.1%
Source: canbalci / iStock
7. San Francisco, CA
> Bicyclist fatality rate: 4.6 per 1 million people
> Bicyclist fatalities: 4
> Population: 864,816
> Total traffic fatalities: 38 (43.9 per 1 million people)
> Working-age population commuting by bike: 3.9%
[in-text-ad]
Source: smontgom65 / iStock
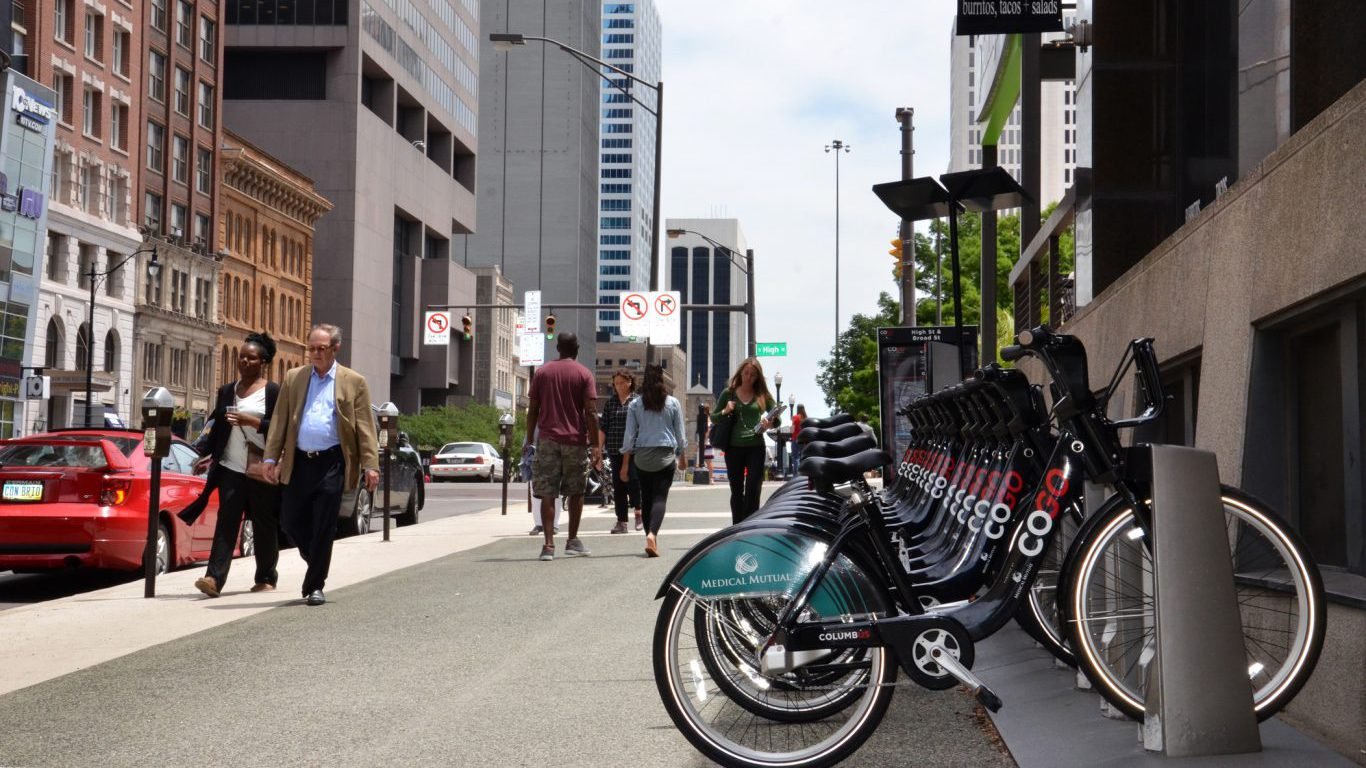
6. Columbus, OH
> Bicyclist fatality rate: 4.7 per 1 million people
> Bicyclist fatalities: 4
> Population: 850,106
> Total traffic fatalities: 57 (67.1 per 1 million people)
> Working-age population commuting by bike: 0.1%
 24/7 Wall St.
Source: Derek_Neumann / iStock
5. San Jose, CA
> Bicyclist fatality rate: 4.9 per 1 million people
> Bicyclist fatalities: 5
> Population: 1,026,908
> Total traffic fatalities: 64 (62.3 per 1 million people)
> Working-age population commuting by bike: 0.8%

Source: BA12 / iStock
4. Phoenix, AZ
> Bicyclist fatality rate: 5.1 per 1 million people
> Bicyclist fatalities: 8
> Population: 1,563,025
> Total traffic fatalities: 193 (123.5 per 1 million people)
> Working-age population commuting by bike: 0.6%
[in-text-ad-2]
Source: SeanXu / iStock
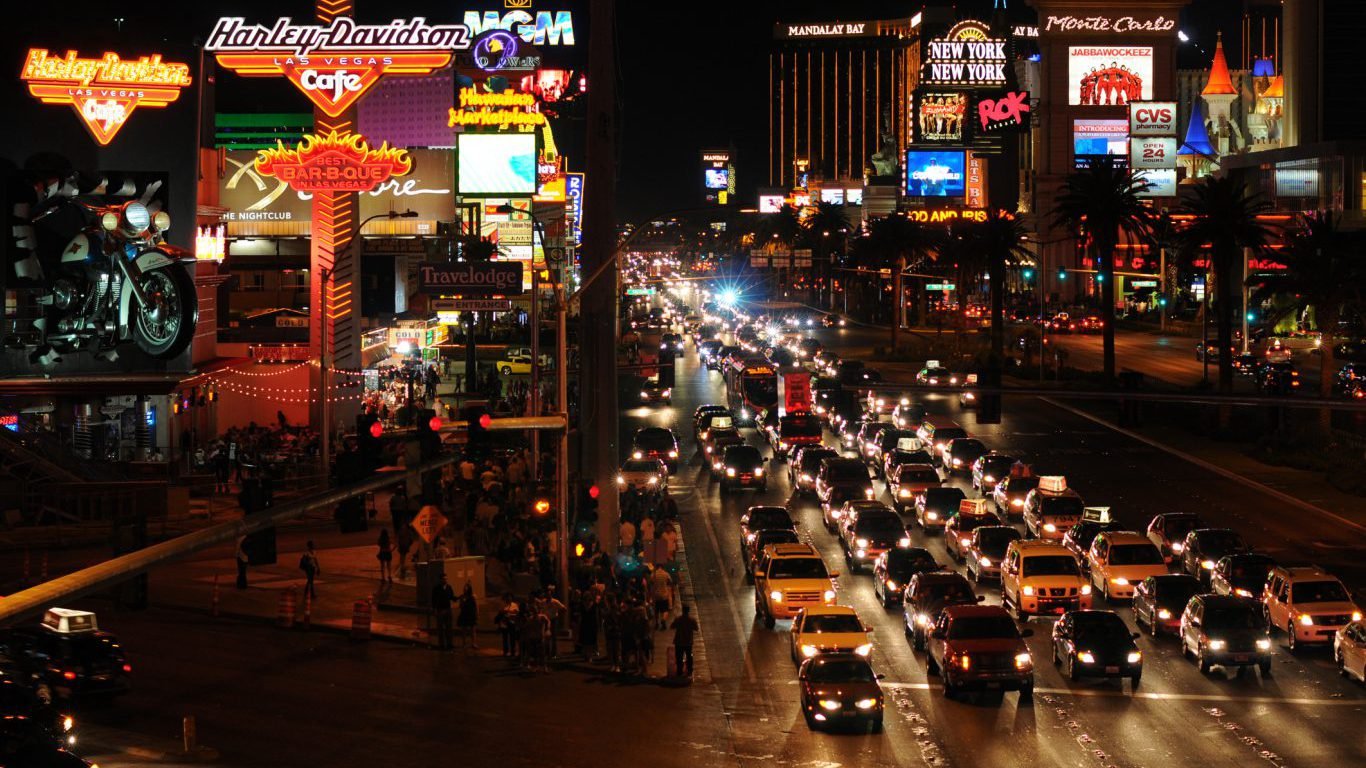
3. Las Vegas, NV
> Bicyclist fatality rate: 6.4 per 1 million people
> Bicyclist fatalities: 4
> Population: 623,747
> Total traffic fatalities: 58 (93.0 per 1 million people)
> Working-age population commuting by bike: 0.3%

Source: florencemcginn / iStock
2. Tucson, AZ
> Bicyclist fatality rate: 7.5 per 1 million people
> Bicyclist fatalities: 4
> Population: 531,641
> Total traffic fatalities: 64 (120.4 per 1 million people)
> Working-age population commuting by bike: 2.5%
[in-text-ad]

Source: gpointstudio / iStock
1. Albuquerque, NM
> Bicyclist fatality rate: 8.9 per 1 million people
> Bicyclist fatalities: 5
> Population: 559,121
> Total traffic fatalities: 56 (100.2 per 1 million people)
> Working-age population commuting by bike: 1.6%
Sponsored: Find a Qualified Financial Advisor
Finding a qualified financial advisor doesn’t have to be hard. SmartAsset’s free tool matches you with up to 3 fiduciary financial advisors in your area in 5 minutes. Each advisor has been vetted by SmartAsset and is held to a fiduciary standard to act in your best interests. If you’re ready to be matched with local advisors that can help you achieve your financial goals, get started now.
Thank you for reading! Have some feedback for us?
Contact the 24/7 Wall St. editorial team.
Editors' Picks

