
In the United States, the federal government is the ultimate legislative authority — wielding the power to regulate commerce, declare war, as well as establish and maintain a currency. Beyond that, however, the U.S. Constitution grants states considerable leverage in the management of their own internal affairs.
Social and economic outcomes in a given state are often the product of a range of historic circumstances, including — but not limited to — the presence of major companies or universities, natural resources, and prevailing political ideology. While some of these conditions are outside the government’s control, states have the power to plan and react to economic and social conditions through carefully crafted fiscal policies and budgetary priorities.
There is no one-size-fits-all formula for effective state governance, and in this way, no two states are exactly alike. Still, some states are managed far more proficiently than others.
For the eighth year in a row, 24/7 Wall St. reviewed economic indicators, budget allocations, and balance sheets, in addition to a range of social measures to rank how well each state is run. These are the best and worst run states in the country.
Click here to see the best and worst run states.
Click here to see our detailed findings and methodology.

Source: fotoguy22 / iStock
1. Minnesota
> 2016 Unemployment: 3.9% (13th lowest)
> Pension funded ratio: 79.8% (18th highest)
> Credit rating and outlook: Aa1/Stable
> Poverty: 9.9% (6th lowest)
Ranking as the 10th best run state as recently as 2012, Minnesota has climbed steadily in the rankings in recent years and is now the best run state in the country. A relatively wealthy state, Minnesota’s $65,599 median household income is about $8,000 more than the median income nationwide. With a strong tax base, the state brings in about $4,400 a year per resident in taxes, more than all but four other states. In Minnesota, higher tax revenue means the government can save more. The state has saved the equivalent of 10.3% of its annual spending in a rainy day fund — more than most states and greater than the 8.2% average across states.
Minnesota has a nearly perfect credit rating from Moody’s with a stable outlook.
[in-text-ad]

Source: Thinkstock
2. Utah
> 2016 Unemployment: 3.4% (8th lowest)
> Pension funded ratio: 85.7% (12th highest)
> Credit rating and outlook: Aaa/Stable
> Poverty: 10.2% (7th lowest)
Utah’s population has increased by about one-third since 2000. As Utah’s population expanded, the state has been able to achieve smart, sustainable growth. Water consumption fell by approximately 25%, largely due to increases in housing density that resulted in smaller lot sizes. Air pollution has fallen by roughly 50%, partially as the result of an extensive clean air campaign. Also, the number of vehicle miles traveled per person has remained largely unchanged due to increases in density and public transit infrastructure.
Due in part to a growing GDP, the state’s economy has easily accommodated the population influx. Utah’s economy expanded by 3.7% in 2016, nearly the fastest GDP growth among states and more than double U.S. economic growth the same year. As of 2016, just 3.4% of Utah’s workforce were unemployed, and only 10.2% of residents lived in poverty, far less than the 4.9% national unemployment and 14.0% poverty rates.
 24/7 Wall St.
Source: Thinkstock
3. Iowa
> 2016 Unemployment: 3.7% (10th lowest)
> Pension funded ratio: 85.1% (13th highest)
> Credit rating and outlook: Aaa/Stable
> Poverty: 11.8% (18th lowest)
Iowa has one of the healthiest job markets in the country. Just 3.7% of the Iowa workforce were unemployed in 2016, the 10th lowest unemployment rate of any state. For the small share of residents looking for a job, Iowa has one of the most generous unemployment insurance systems of any state. Some 40% of unemployed residents in the state receive unemployment benefits, far more than the 27% national rate. Also, the average weekly UI benefit is $398, or 45% of Iowa’s average weekly wage — the fifth highest replacement rate of any state.
Iowa is also one of the most fiscally responsible states in the country. While across all states, average state government debt amounts to 52.2% of total state tax revenue, Iowa’s debt load amounts to just 26.1% — one of the smallest shares in the country. Additionally, Iowa’s rainy day funds could cover about 10% of the state’s 2018 fiscal year budget, slightly better than the average across all states.

Source: Thinkstock
4. Oregon
> 2016 Unemployment: 4.9% (20th highest)
> Pension funded ratio: 91.9% (6th highest)
> Credit rating and outlook: Aa1/Stable
> Poverty: 13.3% (24th highest)
Oregon lawmakers have long exemplified fiscal responsibility. The state’s pension system is 91.9% funded, the sixth largest share in the country. Oregon’s rainy day reserves could fund 10.6% of the state’s expenditure for the 2018 fiscal year, one of the larger shares nationwide. Additionally, the state’s debt amounts to just 37.2% of total tax revenue, far less than the 52.2% average debt across all states. Oregon dedicates just 1.5% of its expenditure to interest payments on its small debt load, freeing the state to allocate more money to other public services. For example, Oregon spends 37.6% of its budget on public welfare, the fourth largest share of any state.
Oregon also leads much of the nation in gender equality in political leadership. As of 2015, some 31% of Oregon legislators were female, far more than the 24% national average. Female lawmakers in the state have helped pass legislation expanding access to birth control in recent years.
[in-text-ad-2]

Source: Thinkstock
5. Washington
> 2016 Unemployment: 5.4% (9th highest)
> Pension funded ratio: 87.1% (10th highest)
> Credit rating and outlook: Aa1/Stable
> Poverty: 11.3% (14th lowest)
Ensuring state residents have adequate access to health care appears to be a priority for Washington. The state allocates 6.1% of its budget to health care spending, more than all but two other states and nearly double the U.S. average, and Washington is one of the 32 states to expand its Medicaid program. Partially as a result, only 6.0% of Washingtonians are without health insurance, well below the U.S. uninsured rate of 8.6%. Social safety nets do not stop at health care in Washington. The average weekly payout for unemployment insurance beneficiaries is $425, well above the $354 average across all states.
In addition to providing health care and generous UI benefits, Washington has one of the best funded state pension systems in the country. Some 87.1% of the pension system is funded, far more than the 71.6% average across all states.

Source: Thinkstock
6. Nebraska
> 2016 Unemployment: 3.2% (5th lowest)
> Pension funded ratio: 91.3% (8th highest)
> Credit rating and outlook: N/A/Stable
> Poverty: 11.4% (15th lowest)
Nebraska, now the sixth best run state in the country, has ranked among the top five in each of the previous six years. Nebraska is in a far better position financially than most states. The state has set aside a rainy day fund equal to 16.1% of its 2018 budget, partially to reduce the likelihood of future tax hikes. Nebraska’s rainy day fund as a share of its annual expenditures is nearly double the comparable average across all states and higher than that of all but six other states. Additionally, Nebraska’s debt accounts for only 15.9% of its total revenue, the second lowest debt-to-revenue ratio of any state.
Not only is Nebraska in a better fiscal position than most states, but its job market is one of the healthiest in the country. Only 3.2% of the state’s labor force were out of a job in 2016, well below the 4.9% 2016 U.S. unemployment rate.
[in-text-ad]

Source: Thinkstock
7. North Dakota
> 2016 Unemployment: 3.2% (5th lowest)
> Pension funded ratio: 70.4% (22nd lowest)
> Credit rating and outlook: Aa1/Negative
> Poverty: 10.7% (10th lowest)
Breaking a five-year streak of ranking as the best run state in the country, North Dakota dropped this year to seventh overall. For much of the past decade, an oil boom led to economic growth and an explosion of jobs in the state. However, falling oil prices have contributed to large numbers of residents leaving the state and a substantial GDP decline, and these declines were finally enough to push the state out of the No. 1 position.
Still, North Dakota outranks most states in a number of key measures of government efficacy. Just 3.2% of the North Dakota workforce was unemployed in 2016, far less than the 4.9% national annual unemployment rate and the fifth smallest rate of any state. Moody’s rates North Dakota’s bonds a near-perfect Aa1 rating, citing the state’s “history of sound budget management” and “strong reserves.” However, Moody’s gave the state’s credit rating a negative outlook, suggesting a prolonged economic downturn could lead to a downgrade. If that happens, North Dakota might fall even further down the list in next year’s ranking.

Source: Thinkstock
8. Idaho
> 2016 Unemployment: 3.8% (11th lowest)
> Pension funded ratio: 91.8% (7th highest)
> Credit rating and outlook: Aa1/Stable
> Poverty: 14.4% (19th highest)
Underfunded state pension systems are a major problem in the United States and could potentially affect millions of Americans who will be depending on state retirement benefits. Idaho is in far better shape than most states, however, as nearly 92% of its pension obligations are funded. In comparison, only about 72% of state pension systems are funded on average nationwide.
While crime rates are subject to a range of factors outside of a state’s control, a low violent crime rate can be indicative of effective policing. There were only 230 violent crimes in Idaho for every 100,000 residents in 2016, one of the lowest violent crime rates among states and well below the violent crime rate nationwide of 386 per 100,000 Americans.

Source: Thinkstock
9. Colorado
> 2016 Unemployment: 3.3% (7th lowest)
> Pension funded ratio: 60.4% (8th lowest)
> Credit rating and outlook: Aa1/Stable
> Poverty: 11.0% (12th lowest)
In the 12 months ending in July 2016, Colorado’s population grew by 1.1% due to net migration, nearly four times the national growth rate and among the most of any state. The rising population has led to increased housing demand and construction activity. Over the past year, the value of a typical home in Colorado rose 10.7%, from $283,800 to $314,200, the largest percentage increase of any state. Largely due to the increased residential construction, Denver is currently home to the third most cranes of any major city. Cranes are also being used in the construction of a number of mixed-use commercial developments.
New residents are likely attracted by the large number of advanced, high-paying jobs the state has to offer. Some 14.0% of workers in Colorado are employed in professional, scientific, and management positions, the third largest share of any state.
[in-text-ad-2]

Source: Thinkstock
10. Hawaii
> 2016 Unemployment: 3.0% (3rd lowest)
> Pension funded ratio: 62.4% (11th lowest)
> Credit rating and outlook: Aa1/Stable
> Poverty: 9.3% (2nd lowest)
The typical household in Hawaii earns $74,511 a year, nearly $17,000 more than the typical American household. With a strong tax base, the Hawaiian government brings in the equivalent of $4,540 a year in tax revenue per resident — more than all but two other states.
The high median income is partially attributable to the relative availability of jobs in the state. Only 3.0% of Hawaii’s labor force were out of work in 2016, nearly the lowest unemployment rate in the country. For those Hawaiians who are unemployed, the state has one of the most generous safety nets in the country. The average weekly payout for unemployment insurance recipients is $490, and 39% of unemployed state residents receive insurance benefits — each among the highest such figures of any state.

Source: Thinkstock
11. Texas
> 2016 Unemployment: 4.6% (23rd lowest)
> Pension funded ratio: 75.6% (22nd highest)
> Credit rating and outlook: Aaa/Stable
> Poverty: 15.6% (12th highest)
Home to over a third of all U.S. crude oil reserves, Texas is a resource-rich state that leads the nation in oil production. Though oil prices have yet to recover from their precipitous fall in 2014, resource extraction remains a significant revenue source for the state government. In a better fiscal position than most states, Texas has the equivalent of more than a fifth of its annual budget saved in a rainy day fund, nearly triple the average among all states. Partially as a result, Texas is one of only 14 states with a perfect credit rating from Moody’s and a stable outlook.
While a well-run government is not reason enough for Americans to choose to live in a given state, people are flocking to Texas. Due largely to inbound migration, the Lone Star State’s population expanded by over 430,000 between July 2015 and July 2016, more than any other state.
[in-text-ad]

Source: Thinkstock
12. Massachusetts
> 2016 Unemployment: 3.7% (10th lowest)
> Pension funded ratio: 62.0% (10th lowest)
> Credit rating and outlook: Aa1/Stable
> Poverty: 10.4% (9th lowest)
Massachusetts is the best run state in New England, and the 12th best run state nationwide. Many states ranking on the better half of this list benefit from higher than typical tax revenue, and Massachusetts is no exception. The state collects the equivalent of $3,960 per resident annually in taxes, more than all but seven other states and well above the average across all states of $2,821.
Despite the relatively high tax revenues, the state borrows heavily. Massachusetts’ debt amounted to $11,056 per person as of 2015, the most debt per capita of any state.
 24/7 Wall St.
Source: Thinkstock
13. South Dakota
> 2016 Unemployment: 2.8% (2nd lowest)
> Pension funded ratio: 104.1% (the highest)
> Credit rating and outlook: Aaa/Stable
> Poverty: 13.3% (24th highest)
Tax codes and laws can have a considerable impact on a state’s economy and job market, and in South Dakota, only 2.8% of the labor force were out work in 2016, nearly the lowest unemployment rate of any state and less than half the 4.9% U.S. annual unemployment rate. Low unemployment can help generate more tax revenue for state coffers and one of a minority of states with a perfect credit rating and stable outlook from Moody’s, South Dakota is in a sound fiscal position.
South Dakota also has one of the most stable housing markets of any state. As of 2015, just one of every 1,172 homes in the state were in some part of the foreclosure process, this is the second lowest foreclosure rate of any state and far below the national foreclosure rate of one in every 142 homes.

Source: Thinkstock
14. California
> 2016 Unemployment: 5.4% (9th highest)
> Pension funded ratio: 74.0% (25th lowest)
> Credit rating and outlook: Aa3/Stable
> Poverty: 14.3% (20th highest)
The most populous state in the country, California might intuitively seem like the most difficult state to manage. Despite its size, California ranks better than most. Like most of the best run states, California has a solid tax base to draw from. The typical household in the state earns $67,739, about $10,000 more than the median income nationwide. Each year, the state brings in about $3,850 per resident in tax revenue, more than all but eight other states and about $1,000 more than is typical nationwide.
California allocates a relatively large share of its budget to helping its neediest residents. Some 40.4% of state spending goes towards public welfare programs, the largest public welfare allocation in any state.
[in-text-ad-2]

Source: Thinkstock
15. Delaware
> 2016 Unemployment: 4.4% (21st lowest)
> Pension funded ratio: 89.3% (9th highest)
> Credit rating and outlook: Aaa/Stable
> Poverty: 11.7% (16th lowest)
Most of the best run states are in the West. Delaware, though, is the second highest ranking state on the eastern seaboard. One of only 14 states with a perfect credit rating and stable outlook from Moody’s, Delaware is a fiscally responsible state. The state’s rainy day coffers are worth about 11.1% of its annual budget, a larger share than the 8.2% average across all states.
As is the case in many of the best run states, Delaware residents are relatively wealthy. The typical household in the state earns $61,757 a year compared to the $57,617 the typical American household earns nationwide. High incomes are driven in part by strong employment in sectors that tend to pay well. Some 8.9% of workers in the state are employed in the generally high-salaried finance and insurance sector, the largest share of any state.

Source: Thinkstock
16. Michigan
> 2016 Unemployment: 4.9% (20th highest)
> Pension funded ratio: 63.7% (14th lowest)
> Credit rating and outlook: Aa1/Stable
> Poverty: 15.0% (15th highest)
The best run states often have diverse economies and a relatively well-educated labor force. In Michigan, only about 28.3% of adults have a bachelor’s degree or higher, a smaller share than the 31.3% of American adults. Manufacturing jobs are less likely than others to require a college education, and Michigan’s manufacturing sector employs some 18.4% of the state’s labor force. Nationwide, manufacturing accounts for only 10.1% of total employment.
Overdependence on a single industry can undermine economic resilience during downturns. Despite Michigan’s reliance on manufacturing, its 2016 unemployment rate of 4.9% was in line with the annual U.S. unemployment rate. The state’s housing market has also improved substantially in recent years after being hit particularly hard during the housing crisis. The median home value in the state rose by 27% between 2012 and 2016, one of the largest increases in the country.
[in-text-ad]

Source: Thinkstock
17. New Hampshire
> 2016 Unemployment: 2.8% (2nd lowest)
> Pension funded ratio: 65.5% (17th lowest)
> Credit rating and outlook: Aa1/Stable
> Poverty: 7.3% (the lowest)
New Hampshire is one of only five states with no sales tax. Partially as a result, the state government has relatively limited financial resources. The state collects the equivalent of only $1,864 in tax revenue per resident a year, the second least of any state. New Hampshire is also saddled with considerable debt, owing $6,151 per resident, far more than the average state debt per capita of $3,559. With little tax revenue and heavy borrowing, New Hampshire is struggling to meet its financial obligations by several measures. For example, only 65.5% of state pensions are funded, below the 71.6% average funding across all states. Additionally, New Hampshire only has about 6.5% of its annual expenditure saved in a rainy day fund, compared to the 8.2% average rainy day savings across all states.
A relative absence of serious financial hardship can be indicative of effective policies aimed at reducing poverty. New Hampshire has the lowest poverty rate in the country, at only 7.3%. The state allocates 36.2% of its annual expenditures to public welfare, more than the average of 33.1% across all states.
 24/7 Wall St.
Source: Thinkstock
18. Montana
> 2016 Unemployment: 4.1% (17th lowest)
> Pension funded ratio: 74.5% (25th highest)
> Credit rating and outlook: Aa1/Stable
> Poverty: 13.3% (24th highest)
Montana brings in some $2,727 in tax revenue per capita annually, roughly in line with the average across all states. Despite similar tax revenue, Montana may be underprepared to fund operations in the event of disrupted or diminished revenue streams. Montana has only 6.9% of its annual budget saved in a rainy day fund, a smaller share than the 8.2% average across all states.
The small rainy day fund partially reflects the priorities of the government, as other spending categories may be taking precedence. For example, Montana allocates about double the average spending across states — relative to their budgets — to highways, natural resources, and government administration.The state’s pension system is also better funded than most. Montana has funding to back nearly three-quarters of its pension obligations, more than the average pension funding of 71.6% across all states.

Source: Sean Pavone / Shutterstock.com
19. Vermont
> 2016 Unemployment: 3.3% (7th lowest)
> Pension funded ratio: 67.8% (20th lowest)
> Credit rating and outlook: Aaa/Stable
> Poverty: 11.9% (19th lowest)
Vermont ranked as the best run state in New England last year and the 14th best run in the country. This year, it ranks third in New England and 19th overall. Vermont’s drop in ranking this year may be due to its recent population decline, even as other states in the region have added residents.
A fiscally responsible state, Vermont has earned the top credit rating from Moody’s with a stable outlook. While obtaining health insurance is often ultimately the responsibility of the individual, Vermont has taken steps to ensure its citizens have access to medical care. The state is one of 32 to have expanded Medicaid, and Vermont allocates 5.3% of its budget to health care spending, considerably more than the 3.4% average across all states. While the availability of jobs can be affected by forces outside the government’s control, the government can enact policies that attract companies and create jobs. A low unemployment rate can be indicative of sound policies. In Vermont, only 3.3% of the labor force was out of work in 2016, well below the comparable U.S. unemployment rate of 4.9%.
[in-text-ad-2]

Source: Thinkstock
20. Wisconsin
> 2016 Unemployment: 4.1% (17th lowest)
> Pension funded ratio: 98.3% (2nd highest)
> Credit rating and outlook: Aa1/Positive
> Poverty: 11.8% (18th lowest)
An underfunded pension system is a considerable problem in many states that could potentially affect millions of Americans. But Wisconsin is not one of them. Over 98% of Wisconsin’s pension system is funded, far more than the 72% average across all states. However, Wisconsin’s well-funded pension system is partially attributable to diminished collective bargaining rights for teachers in the state following the passage of Act 10 in 2011.
Better ranked states often benefit from higher than typical tax revenue. Wisconsin brings in the equivalent of $2,945 a year per resident, roughly in line with average per capita tax revenue across all states.

Source: Thinkstock
21. Wyoming
> 2016 Unemployment: 5.3% (13th highest)
> Pension funded ratio: 73.1% (24th lowest)
> Credit rating and outlook: N/A
> Poverty: 11.3% (14th lowest)
A resource-rich state, Wyoming’s economy is heavily dependent on energy production. Roughly 1 in every 10 workers in the state are employed in the agriculture and mining sector, the largest share of any state. While a heavy dependence on natural resources can make an economy overly vulnerable to commodity price fluctuations, taxes on resource extraction can be a boon for government balance sheets. Wyoming brings in the equivalent of about $4,000 a year per resident in tax revenue, more than all but five other states.
A large portion of Wyoming’s tax revenue has been used to pad state coffers. A safeguard against increasing tax rates, Wyoming’s rainy day fund is one of only two nationwide worth more than the state’s entire annual budget.
[in-text-ad]

Source: Thinkstock
22. Florida
> 2016 Unemployment: 4.9% (20th highest)
> Pension funded ratio: 86.5% (11th highest)
> Credit rating and outlook: Aa1/Stable
> Poverty: 14.7% (16th highest)
One of only a handful of states with no individual income tax, Florida’s tax revenue amounts to only $1,806 per person in annually, the least of any state. Despite its relatively limited financial resources, Florida’s standing on this list has improved considerably in recent years. Ranking among the 10 worst run states as recently as 2010, Florida now ranks in the top half of all states.
While low taxes may make it more challenging to meet budget obligations, Florida’s tax climate also likely makes it a more attractive place to live for many Americans. The Sunshine State gained nearly 326,000 new residents in the 12 months between July 2015 and July 2016 due to migration alone, the largest such population increase among states.

Source: Thinkstock
23. North Carolina
> 2016 Unemployment: 5.1% (16th highest)
> Pension funded ratio: 95.5% (4th highest)
> Credit rating and outlook: Aaa/Stable
> Poverty: 15.4% (13th highest)
Overpromising and under delivering is a consistent theme across many state pension systems, but not in North Carolina. Nearly 96% of the state’s pension obligations have financial backing compared to only 71.6% of state pensions nationwide. Currently, North Carolina is one of few states with a perfect credit rating and stable outlook from Moody’s.
North Carolina is one of several states not to take advantage of federal funds to expand its Medicaid program. Partially as a result, about 1 in every 10 state residents are uninsured, a larger share than in most states.

Source: Thinkstock
24. Tennessee
> 2016 Unemployment: 4.8% (25th highest)
> Pension funded ratio: 95.4% (5th highest)
> Credit rating and outlook: Aaa/Stable
> Poverty: 15.8% (11th highest)
With a perfect rating and stable outlook from Moody’s, Tennessee is a fiscally responsible state. It has the lowest debt per capita of any state and a nearly fully funded state pension system at a time when on average only 71.6% of state pensions are funded. The state also benefited from a near nation-leading economic growth in 2016 of 2.9%.
Still, Tennessee is ill-prepared to meet its budgetary obligations in the event of falling tax revenue. The state only has the equivalent of 5.5% of its annual budget in a rainy day fund, well below the 8.2% average across all states. Tennessee is also not especially safe. There were 633 violent crimes in the state for every 100,000 people in 2016, the fourth highest violent crime rate in the country after only Alaska, Nevada, and New Mexico.
[in-text-ad-2]

Source: Thinkstock
25. Georgia
> 2016 Unemployment: 5.4% (9th highest)
> Pension funded ratio: 80.9% (17th highest)
> Credit rating and outlook: Aaa/Stable
> Poverty: 16.0% (10th highest)
Georgia is one of the minority of states that did not take advantage of federal money and expand their Medicaid program. Medicaid is intended to help the poorest Americans obtain health care coverage, and Georgia has a larger population struggling financially than most states. Some 16.0% of people in Georgia live below the poverty line compared to 14.0% of Americans nationwide. Due in large part to its decision not to expand Medicaid, some 12.9% of state residents are uninsured, nearly the largest share of any state after only Alaska, Oklahoma, and Texas.
While many in Georgia struggle financially, the state itself is fiscally sound. Georgia is one of only 14 states the highest rating from Moody’s and a stable outlook.

Source: Thinkstock
26. Maryland
> 2016 Unemployment: 4.3% (19th lowest)
> Pension funded ratio: 68.2% (21st lowest)
> Credit rating and outlook: Aaa/Stable
> Poverty: 9.7% (3rd lowest)
Maryland residents are wealthiest in the country, with a median household income of $78,945 a year, about $21,300 more than what the typical American household earns a year. With a strong tax base, the per capita tax revenue in Maryland tops $3,300 a year — considerably more than the average tax revenue per capita across all states of $2,821. The high per capita tax revenue likely makes it easier for state officials to meet budgetary obligations, and Maryland is one of only 14 states to have a perfect credit rating and a stable outlook from Moody’s.
However, even with such a healthy revenue stream, the state has not set aside much in the way of emergency resources. The state’s current rainy day fund is equivalent to just 5.6% of its annual expenditure. Nationwide, states have an average of 8.2% of annual expenditures set aside to close budget gaps.
[in-text-ad]

Source: Thinkstock
27. Nevada
> 2016 Unemployment: 5.7% (8th highest)
> Pension funded ratio: 75.1% (23rd highest)
> Credit rating and outlook: Aa2/Stable
> Poverty: 13.8% (23rd highest)
Nevada is one of only a handful of states with no personal income tax. Partially as a result, the state has to operate with lower tax revenue than is typical. Nevada brings in about $2,562 per resident annually, a few hundred dollars less than the average revenue per capita across all states. Limited financial resources may make it more difficult for Nevada to meet its budgetary obligations. Currently, the state has a slightly smaller share of its annual expenditures saved in a rainy day fund.
While crime rates are subject to a range of factors, effective policing can help reduce crime. Nevada allocates a slightly smaller share of its budget on police protection and correctional facilities than is typical. Greater budgetary emphasis on crime prevention may go a long way to reduce the state’s near-nation leading violent crime rate of 678 incidents per 100,000 people.

Source: Thinkstock
28. Virginia
> 2016 Unemployment: 4.0% (15th lowest)
> Pension funded ratio: 74.6% (24th highest)
> Credit rating and outlook: Aaa/Stable
> Poverty: 11.0% (12th lowest)
Virginia’s annual tax revenue of only about $2,441 per resident is nearly $400 less than the average per capita revenue across all states. Additionally, Virginia has only 1.5% of its annual budget saved in a rainy day fund, one of the smallest such shares of any state. Despite relatively limited emergency funds and limited tax revenues, Virginia is one of only 14 states with a perfect credit rating and a stable outlook from Moody’s.
As is the case in most states on the bottom half of this list, economic growth has been sluggish in Virginia. The state’s economy expanded by only 0.5% in 2016, one-third of economic growth nationwide the same year.

Source: Thinkstock
29. Indiana
> 2016 Unemployment: 4.4% (21st lowest)
> Pension funded ratio: 64.6% (15th lowest)
> Credit rating and outlook: Aaa/Stable
> Poverty: 14.1% (21st highest)
Like its neighbors Michigan and Ohio, Indiana is overly dependent on its once strong manufacturing sector. American manufacturing has been in decline for decades, and currently, some 18.8% of workers in Indiana are employed in manufacturing jobs, the largest share of any state. Over reliance on a single industry can make an economy more susceptible to economic downturns. Despite its dependence on manufacturing, Indiana’s economy appears to be stronger than most. Only 4.4% of the state’s labor force was out of a job in 2016, below the 4.9% U.S. annual unemployment rate.
[in-text-ad-2]

Source: Thinkstock
30. Maine
> 2016 Unemployment: 3.9% (13th lowest)
> Pension funded ratio: 82.5% (14th highest)
> Credit rating and outlook: Aa2/Stable
> Poverty: 12.5% (21st lowest)
In keeping with the national trend, Maine’s unemployment rate is falling. In October 2016, 3.9% of the state’s workers were out of a job compared to only 3.5% as of October 2017. However, declining joblessness may not be solely the product of improving economic conditions as the size of the state’s labor force shrank by 1.2% over the last half decade.
Like many states ranking low on this list, Maine is ill-prepared to meet budgetary obligations in the event of a dip in tax revenue. The state has the equivalent of only 5.8% of its annual budget saved in a rainy day fund, less than the majority of states.

Source: Thinkstock
31. Ohio
> 2016 Unemployment: 4.9% (20th highest)
> Pension funded ratio: 76.4% (21st highest)
> Credit rating and outlook: Aa1/Stable
> Poverty: 14.6% (18th highest)
As evidenced by the high unemployment in the state and a shrinking labor force, Ohio’s economy is struggling. As of October, 5.1% of the state’s workforce was out of a job, slightly worse than the state’s October 2016 unemployment rate of 5.0% and a break from the national trend of an improving job market.
Like many other states in the Midwest with flagging economies, Ohio is overly dependent on its once strong manufacturing sector. The industry, which has long been in decline in the United States, employs some 15.5% of Ohio’s workforce. In comparison, the manufacturing sector employs only 10.1% of workers nationwide.
[in-text-ad]

Source: Thinkstock
32. New York
> 2016 Unemployment: 4.8% (25th highest)
> Pension funded ratio: 98.1% (3rd highest)
> Credit rating and outlook: Aa1/Stable
> Poverty: 14.7% (16th highest)
Lower-ranked states often have relatively little to work with in the way of tax revenue, but not New York. The state brings in the equivalent of $3,961 per resident a year, more than all but six other states. With strong revenue, New York is one of only a handful of states with a near fully-funded pension system.
Despite the high tax revenues, New York borrows more than most states. New York’s debt is equal to nearly $7,000 per resident, the seventh highest debt per capita among states. New York also struggles more than most states with a weak job market. The state’s October 2017 unemployment rate of 4.8% is effectively unchanged from its October 2016 rate of 4.9%, even as the unemployment nationwide has decline to 4.1% from 4.8% over the same period.

Source: Thinkstock
33. Arizona
> 2016 Unemployment: 5.3% (13th highest)
> Pension funded ratio: 63.2% (12th lowest)
> Credit rating and outlook: Aa2/Stable
> Poverty: 16.4% (8th highest)
Arizona’s job market is hurting, and the state is doing relatively little to help those trying to find work. Some 5.3% of workers in the state were unemployed in 2016 compared to only 4.9% of the U.S. workforce. Of those in Arizona who are out of work, only 16.0% receive unemployment insurance compared to the UI recipiency rate nationwide of 27.0%. Most of those receiving UI benefits are likely still struggling financially. The average UI payout in Arizona covers less than one-quarter of the average working wage, the least generous proportional insurance payout of any state.
Source: Thinkstock
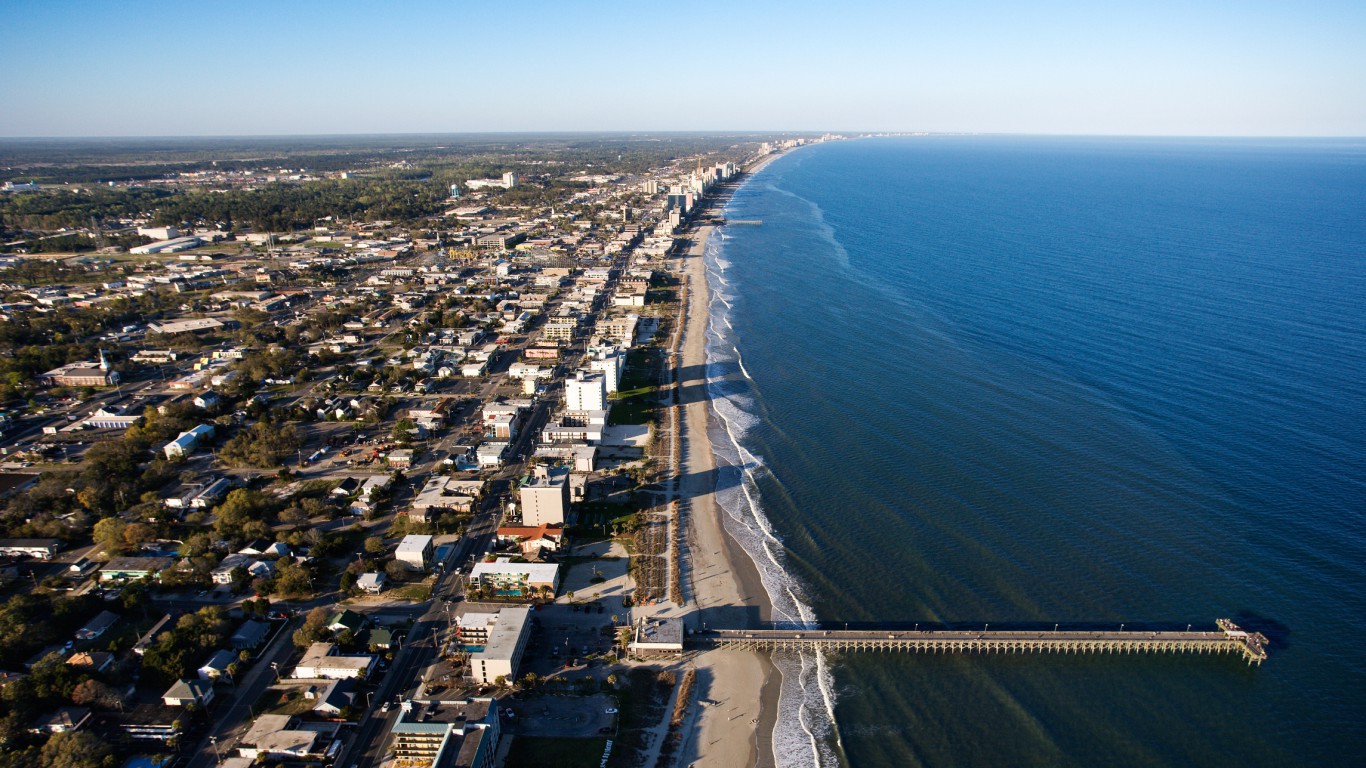
34. South Carolina
> 2016 Unemployment: 4.8% (25th highest)
> Pension funded ratio: 57.8% (7th lowest)
> Credit rating and outlook: Aaa/Stable
> Poverty: 15.3% (14th highest)
Some 15.3% of South Carolinians live below the poverty line compared to 14.0% of Americans. Medicaid is intended to help those facing serious financial hardship afford medical care, and despite standing to gain more than many states, South Carolina did not accept federal money to expand its Medicaid program. Partially as a result, 1 in 10 state residents do not have health insurance coverage, a larger share than in most states.
Overall, the state’s neediest residents do not appear to be high up among the state’s lawmakers’ priorities. South Carolina allocates 29.1% of its annual spending towards welfare programs compared to the average allocation across all states of 33.1%.
[in-text-ad-2]

Source: Thinkstock
35. Kansas
> 2016 Unemployment: 4.2% (18th lowest)
> Pension funded ratio: 64.9% (16th lowest)
> Credit rating and outlook: Aa2/Negative
> Poverty: 12.1% (20th lowest)
Since Gov. Sam Brownback slashed income taxes in Kansas in 2012 and 2013, the state has struggled to balance its budget. State employee pensions have bared the brunt of much of the tax cuts. Only 64.9% the state’s pension system is funded, compared to the 71.6% average funding across all state pension systems. Not only have the tax cuts made it difficult for Kansas to meet its budgetary obligations, but they have also failed to generate the growth Brownback expected. Economic output contracted by 0.9% in Kansas in 2016, even as GDP nationwide expanded by 1.5% over the same period.
Despite the state’s fiscal troubles in recent years, Kansas’ job market is relatively strong. Only 4.2% of the state’s labor force was out of work in 2016 compared to 4.9% of U.S. workers.

Source: Thinkstock
36. Arkansas
> 2016 Unemployment: 4.0% (15th lowest)
> Pension funded ratio: 82.4% (15th highest)
> Credit rating and outlook: Aa1/Stable
> Poverty: 17.2% (6th highest)
Most states maintain a rainy day fund as a safeguard for meeting budgetary obligations in the event of falling tax revenue, but not Arkansas. The state is one of only two without any savings.
The state also struggles more than most with serious crimes. There were 551 violent crimes in Arkansas for every 100,000 residents in 2016, more than in the vast majority of states and well above the U.S. violent crime rate of 386 per 100,000. While the prevalence of crime can be the result of a range of factors, it can also be indicative of ineffective policing and correctional facilities.
[in-text-ad]

Source: Thinkstock
37. Alaska
> 2016 Unemployment: 6.6% (2nd highest)
> Pension funded ratio: 67.5% (19th lowest)
> Credit rating and outlook: Aa3/Negative
> Poverty: 9.9% (6th lowest)
Crime rates are subject to a wide range of factors — many of which are outside of the government’s control. Still, rampant crime can be indicative of ineffective policing and rehabilitation programs. Despite allocating larger than typical shares of its budget to law enforcement and correctional facilities, Alaska is the most dangerous state in the country. There were 804 violent crimes for every 100,000 state residents in 2016, more than double the 386 per 100,000 U.S. violent crime rate.
An oil-rich state, Alaska has historically relied on tax revenue from resource extraction. Following the steep drop in oil prices in 2014, the state has struggled to balance its budget. Since the price plunge, lawmakers in Alaska have debated a range of options to meet budgetary obligations including drawing from the state’s Permanent Fund, cutting spending, and enacting an income tax. Currently, the state’s credit rating from Moody’s is less than perfect with a negative outlook.
 24/7 Wall St.
Source: Thinkstock
38. Connecticut
> 2016 Unemployment: 5.1% (16th highest)
> Pension funded ratio: 49.4% (4th lowest)
> Credit rating and outlook: Aa3/Negative
> Poverty: 9.8% (4th lowest)
Connecticut has fallen considerably on this list. Ranking 20th best as recently as 2010, Connecticut is now on the brink of making the 10 worst run states. Like many of the worst run states, Connecticut is losing residents. In the 12 months between July 2015 and July 2016, nearly 13,000 more people left Connecticut than moved in. Fewer residents means fewer taxpayers, and Connecticut is already borrowing heavily. The New England state’s debt is equal to nearly $10,000 per resident, more than nearly all states with the exception of Massachusetts, its neighbor to the north.
The state’s budget problems do not stop with debt. Connecticut is one of only four states with just half of its pensions funded.

Source: Thinkstock
39. Missouri
> 2016 Unemployment: 4.5% (22nd lowest)
> Pension funded ratio: 81.4% (16th highest)
> Credit rating and outlook: Aaa/Stable
> Poverty: 14.0% (22nd highest)
Government policies can have a considerable effect on the economy and can often either encourage or stifle growth. Missouri lawmakers may need to revisit the state’s economic policy as the state’s GDP expanded by only 0.3% in 2016, one-fifth of the nationwide economic growth of 1.5%. Despite the limited growth, joblessness is less of a problem in Missouri than it is in most states. The state’s unemployment rate fell from 4.6% in October 2016 to only 3.5% in October 2017.
Missouri does not appear to prioritize access to health care for its neediest residents. The state is one of a minority of states to not accept federal funds to expand Medicaid. Partially as a result, some 8.9% of state residents are uninsured, a larger share than in most states.
[in-text-ad-2]
Source: Thinkstock
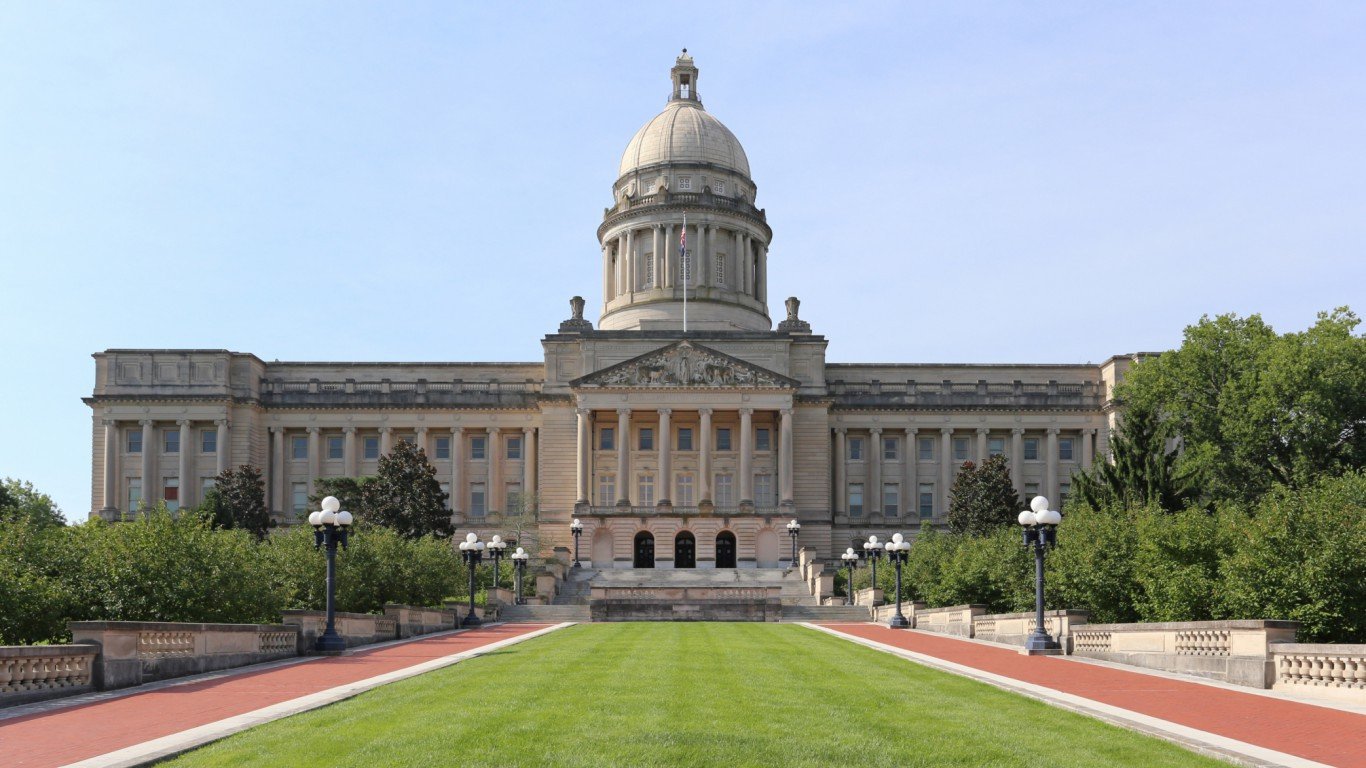
40. Kentucky
> 2016 Unemployment: 5.0% (18th highest)
> Pension funded ratio: 37.8% (2nd lowest)
> Credit rating and outlook: Aa3/Stable
> Poverty: 18.5% (4th highest)
While the availability of jobs is subject to a range of factors, including some outside of a government’s control, a low unemployment rate can be indicative of sound economic policy. Kentucky’s October 2017 unemployment rate of 5.0% is well above the comparable 4.1% U.S. monthly unemployment rate. The state’s unemployment is higher than average even as the labor force has shrunk. In the last half decade, the number of workers in Kentucky fell by 3.1%, nearly the largest decline of any state.
Like many of the worst run states, Kentucky is failing to meet its pension obligations. Only 37.8% of the state’s pension system is funded, the second worst pension funded ratio among states.
Source: Thinkstock
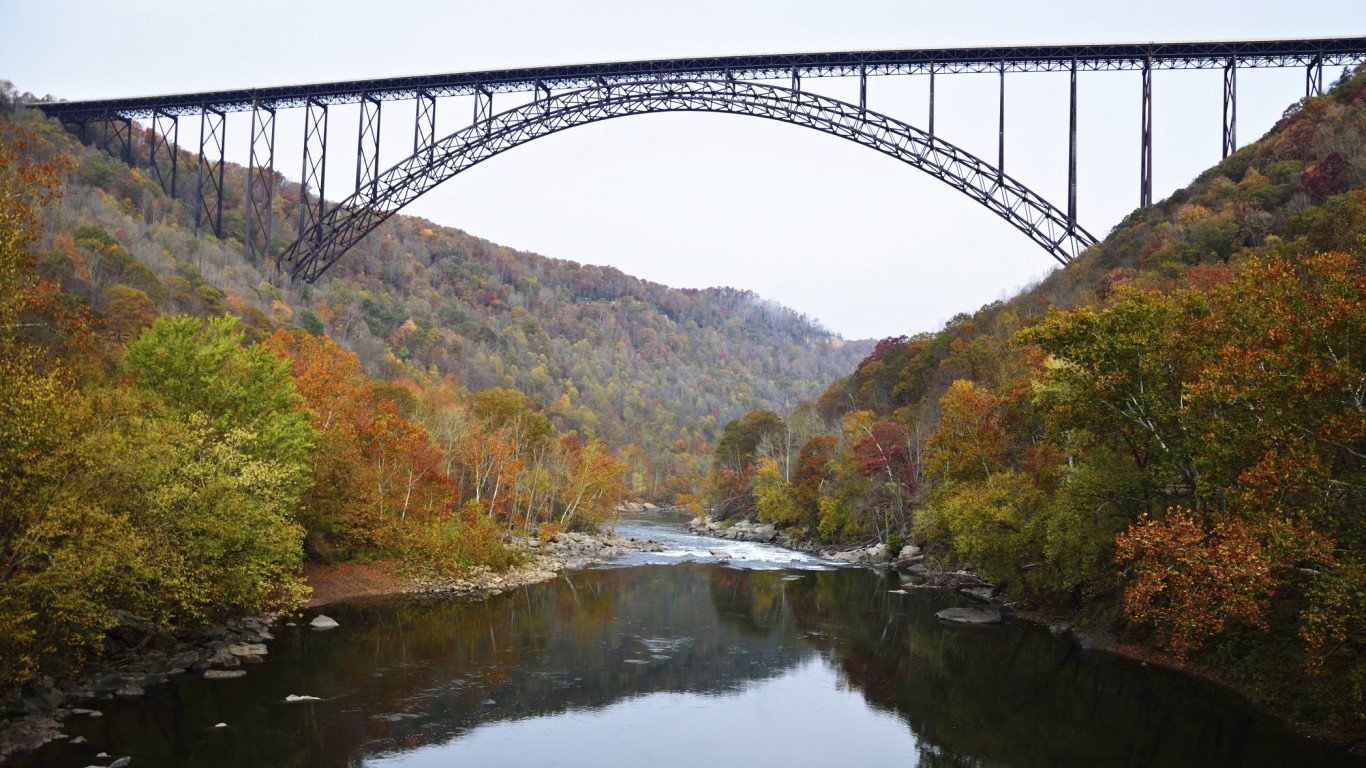
41. West Virginia
> 2016 Unemployment: 6.0% (4th highest)
> Pension funded ratio: 76.9% (20th highest)
> Credit rating and outlook: Aa2/Stable
> Poverty: 17.9% (5th highest)
West Virginia lost nearly 10,000 residents in the 12 months between July 2015 and July 2016, the steepest total population decline of any state other than Illinois. With a smaller tax base, the state’s budget will likely soon be feeling the squeeze. Just as the state struggles financially, many of its residents struggle as well. Some 17.9% of people in West Virginia live in poverty compared to 14.0% of Americans nationwide.
West Virginia is the second largest coal-producing state in the country after Wyoming. Like many other resource-rich states, West Virginia’s economy is overly dependent on resource extraction and is vulnerable to industry downturns. Some 3.7% of West Virginia’s labor force is employed in the resource extraction sector, more than double the industry’s share of total employment nationwide.
[in-text-ad]

Source: Thinkstock
42. Oklahoma
> 2016 Unemployment: 4.9% (20th highest)
> Pension funded ratio: 79.2% (19th highest)
> Credit rating and outlook: Aa2/Negative
> Poverty: 16.3% (9th highest)
Like many resource-rich states, Oklahoma’s revenue from resource extraction took a hit following the global plunge in oil prices in 2014. Falling oil prices compounded the state’s revenue problem that began when Gov. Mary Fallin slashed taxes in an attempt to make the state more business friendly. The state’s school and health care systems have bared the brunt of the diminished tax revenues.
Oklahoma is also one of a minority of states to not take advantage of federal funds to expand Medicaid. Medicaid is intended to help those struggling financially access health care, and many Oklahoma residents are poor. Some 16.3% of state residents live on poverty level income compared to only 14.0% of Americans. Medicaid expansion would likely go a long way to reduce the state’s near nation-leading 13.8% uninsured rate.

Source: Thinkstock
43. Illinois
> 2016 Unemployment: 5.9% (6th highest)
> Pension funded ratio: 40.2% (3rd lowest)
> Credit rating and outlook: Baa3/Negative
> Poverty: 13.0% (24th lowest)
No state has a lower credit rating than Illinois, and for good reason. Decades of budgetary mismanagement left the state unable to pay for many services and pension obligations. After years of stalemate, the state has just passed a $36 billion budget, its first since 2015. Still, the state has some $64.2 billion in outstanding debt and $250 billion in pension obligations as state workers retire, only 40% of which are funded. Due to the state’s ongoing budget woes, Moody’s is threatening to further downgrade Illinois rating. Such a move would make Illinois the first and only state with a junk credit rating.

Source: Thinkstock
44. Rhode Island
> 2016 Unemployment: 5.3% (13th highest)
> Pension funded ratio: 57.1% (6th lowest)
> Credit rating and outlook: Aa2/Stable
> Poverty: 12.8% (22nd lowest)
Like most states in New England, Rhode Island has relatively high per capita tax revenue, but it still borrows heavily. The state collects the equivalent of $3,026 in taxes per resident annually, slightly more than typical. Still, the state is $9.0 billion in debt — or about $8,500 per resident — more than nearly all states’ debt per capita with the exception of its neighbors Connecticut and Massachusetts.
Currently, Rhode Island is facing the prospect of a $29.3 million budget shortfall in in 2017, almost entirely due to high social services spending. Many states have large rainy day funds to cover such budget shortfalls without raising taxes, but not Rhode Island. The state only has 5.2% of its annual spending saved in a rainy day fund, a smaller share than in the vast majority of states.
[in-text-ad-2]

Source: Thinkstock
45. New Jersey
> 2016 Unemployment: 5.0% (18th highest)
> Pension funded ratio: 37.5% (the lowest)
> Credit rating and outlook: A3/Negative
> Poverty: 10.4% (9th lowest)
Up until January, New Jersey will still led by one of the least popular politicians in the country. Earlier this year, Gov. Chris Christie had a 15% approval rating, the lowest of any governor in state history. Since Christie took office in 2010, New Jersey fell steadily in the ranks on this list from 21st best to 6th worst. The state’s credit rating has also been downgraded several times during Christie’s administration and currently has a negative outlook from Moody’s.
As is the case in many of the worst run states, people are leaving New Jersey. Between July 2015 and July 2016, 16,704 more people moved out of the Garden State then came in, one of the largest population declines attributable to migration in the country. The dwindling tax base will do little to help the state’s budgetary woes. Currently, only 37.5% of the state’s pension obligations are funded, the largest funding gap of any state.

Source: Thinkstock
46. Pennsylvania
> 2016 Unemployment: 5.4% (9th highest)
> Pension funded ratio: 55.8% (5th lowest)
> Credit rating and outlook: Aa3/Stable
> Poverty: 12.9% (23rd lowest)
Pennsylvania is one of only three states with no money saved to close budget gaps in the event of declining tax revenue. And this will likely be a problem in the coming years as the state’s tax base is eroding. Nearly 11,000 more people left Pennsylvania in 2016 than moved in.
A dwindling population does little to spur economic growth. Pennsylvania’s GDP expanded by only 0.6% in 2016, even as the U.S. economy grew by 1.5%. The Keystone State’s need for improved economic conditions is more dire than most states’ as evidenced by the relative the share of workers out of a job. Pennsylvania’s 5.4% unemployment rate is higher than the 4.9% U.S. rate and among the 10 worst of all states.
[in-text-ad]

Source: Thinkstock
47. Alabama
> 2016 Unemployment: 6.0% (4th highest)
> Pension funded ratio: 67.0% (18th lowest)
> Credit rating and outlook: Aa1/Stable
> Poverty: 17.1% (7th highest)
Like many of the states ranking on the bottom half of this list, Alabama has a relatively limited budget to work with. The state collects an average of only about $2,000 per person per year in tax revenue, $800 less than is typical among states. Still, the state has a good credit rating.
A relatively poor state, Alabama’s 17.1% poverty rate is higher than the rate in the vast majority of states. Alabama is one of a minority of states that did not take advantage of federal funds to expand Medicaid. Partially as a result, 9.1% of the state’s population is uninsured, more than the 8.6% U.S. uninsured rate. Many Alabama residents without health insurance are likely among the 17.1% living below the poverty line. The state also struggles with a weak job market. Alabama’s 2016 unemployment rate of 5.8% is much higher than the national annual rate of 4.9%, and is one of the highest of any state.

Source: Thinkstock
48. Mississippi
> 2016 Unemployment: 5.8% (7th highest)
> Pension funded ratio: 61.8% (9th lowest)
> Credit rating and outlook: Aa2/Negative
> Poverty: 20.8% (the highest)
More than 1 in 5 Mississippi residents live in poverty, the largest share of any state. Despite apparent need, the state chose not to accept federal funds to expand its Medicaid program, a move that would have helped thousands of state residents access health care. Without the Medicaid expansion, 11.8% of state residents are uninsured — more than in all but five other states.
Per capita tax revenue in Mississippi is lower than in most states, and its tax base is eroding. Some 7,500 more people moved out of Mississippi than moved in between July 2015 and July 2016, even as the total U.S. population expanded by over 2.2 million people over the same period. A shrinking population also means a shrinking workforce. Over the last half decade, Mississippi’s labor force declined by 4.6%, the steepest drop among states. Even with fewer workers, many in the state’s labor force are struggling to find a job. Some 5.8% of the state’s workforce was unemployed in 2016, well above the comparable 4.9% U.S. unemployment rate.

Source: Thinkstock
49. New Mexico
> 2016 Unemployment: 6.7% (the highest)
> Pension funded ratio: 70.6% (23rd lowest)
> Credit rating and outlook: Aa1/Negative
> Poverty: 19.8% (3rd highest)
New Mexico is one of many struggling states with a dwindling tax base. Some 7,100 more people moved out of New Mexico than moved in between July 2015 and July 2016. In addition to a shrinking population, New Mexico’s labor force is also decreasing. The state’s labor force size fell by 0.3% in the last half decade. While a smaller workforce can often mean a lower unemployment rate, some 6.7% of workers in the state were out of a job in 2016, the highest annual unemployment rate among states.
Economic growth would likely go a long way to reducing unemployment, yet New Mexico’s economy is stagnant. The state’s GDP grew by only 0.2% in 2016, even as the U.S. economy expanded by 1.5%.
[in-text-ad-2]

Source: Thinkstock
50. Louisiana
> 2016 Unemployment: 6.1% (3rd highest)
> Pension funded ratio: 63.3% (13th lowest)
> Credit rating and outlook: Aa3/Negative
> Poverty: 20.2% (2nd highest)
Many of the worst managed states have relatively little revenue to work with. Louisiana is no exception. The state collects the equivalent of only $2,071 per person in tax revenue a year compared to the $2,821 per capita amount states collect on average. With low revenue, Louisiana struggles to save for unexpected budget shortfalls and fund its pension system. Louisiana’s rainy day fund is only worth about 3.0% of it annual budget and only 63.3% of the state’s pension system is funded, each among the smaller such shares among states.
Joblessness is also a major problem in Louisiana, and the state offers little assistance to its out-of-work residents. Some 6.1% of Louisiana’s labor force was unemployed in 2016, the third highest unemployment rate in the country after only Alaska and New Mexico. Additionally, the average unemployment insurance payout covers less than a quarter of the typical weekly wage. Nationwide, unemployment insurance payouts cover over a third of the average weekly wage.
Detailed Findings
Fiscal responsibility and meeting budgetary obligations are hallmark traits of the states that rank highest on this list. Many states have promised public employees more than they can afford to pay and now have woefully underfunded pension systems. Across all states, an average of only 71.6% of public pensions have financial backing. Of the 10 highest ranking states on this list, seven have pension systems with greater than average funding.
In addition to long-term obligations such as pensions, states have annual budgets that must be funded. While states can often count on spending a certain amount of money per year, they cannot always rely on a set amount of tax revenue. Tax revenue can fluctuate for a variety of reasons, including volatile commodity prices, negative GDP growth, population declines, or higher unemployment. As a result, many states have rainy day funds, designed to bridge budget gaps in the event of a shortfall. States with larger than average rainy day funds were rewarded in this ranking.
A state’s ability to meet its financial obligations can hinge on its ability to attract employers and jobs. While the availability of jobs can be affected by forces outside of the government’s control, the government can enact policies that can in time attract companies and create jobs. In the best managed states, unemployment is relatively low. The annual unemployment rate in nine of the 10 best managed states is in line with or lower than the U.S. unemployment rate of 4.9% in 2016. Meanwhile, nine of 10 lowest ranking states have a higher than average unemployment rate.
Often times, a job market’s health is affected by the presence of natural resources. For example, North Dakota has topped off the list of the best managed states in each of the last five years before 2017 due in no small part to the economic boom in the state precipitated by fracking in the state’s Bakken Shale region.
The presence of natural resources, however, can be a double-edged sword. States with vast oil or coal reserves can become overly dependent on resource extraction. This increases their risk of declining revenue in the event of falling commodity prices or decreasing demand. This phenomenon occurred in several oil-rich states, including North Dakota, which fell to seventh place in this year’s ranking in the wake of falling petroleum prices, leading to job losses and near-nation leading GDP decline.
While some states have been hurt by or benefitted from circumstances that are almost entirely out of lawmakers’ control — like the presence of natural resources — other states have been directly hindered by their own policymakers.
Governors in Kansas and Oklahoma, for example, have slashed taxes in an effort to stimulate economic growth. However, the anticipated growth never came and now, with lower tax revenue, these states are face major budget shortfalls.
Illinois, which is suffering from decades of fiscal mismanagement, is an extreme example. Agreeing to more than it could ever pay in public pension negotiations, Illinois now faces one of the largest budget deficits of any state and could become the first and only state to earn a junk credit rating from Moody’s. State lawmakers just passed their first budget in two years and have increased property tax rates to help close the gap. However, higher taxes may ultimately hurt the state’s balance sheet as tens of thousands moved out of the state between July 2015 and July 2016, the largest population decline in the country.
Methodology
To determine how well each state is run, 24/7 Wall St. constructed an index of numerous measures from a variety of sources. From the U.S. Census Bureau, we looked at net migration to a state from July 2015 to July 2016 as a percentage of the 2016 population. We reviewed each state’s finances for the 2015 fiscal year, including revenue, per capita tax collection, expenditure, and debt levels, all from the Census. Also from the Census, we reviewed the per capita value of a state’s exports.
Additionally, we considered pension funding ratios for each state from the Pew Charitable Trusts, as well as each state’s rainy day fund balance as a percentage of total general fund expenditures estimated for fiscal 2018 from The National Association of State Budget Officers (NASBO). NASBO defines rainy day funds as “budget stabilization funds set aside to respond to unforeseen circumstances.” Credit rating agency Moody’s Investors Service provided government general obligation ratings, and they are the most recent as of this writing.
From the U.S. Census Bureau’s 2016 American Community Survey (ACS) we also considered a range of socioeconomic factors to assess social outcomes and residents’ well-being. We looked at poverty, high school educational attainment, the percentage of adults without health insurance, median household income, and 1- and 5-year changes in median home value. Violent crime rates came from the Federal Bureau of Investigation’s (FBI) 2016 Uniform Crime Report. Annual foreclosure rates, measured as the number of housing units at some stage in the foreclosure process, were provided by housing market data tracker Attom Data Solutions and are for 2016.
To evaluate each state’s job market, we reviewed annual 2016 unemployment rates as well as jobless rates as of October 2017 from the Bureau of Labor Statistics (BLS). Additionally, we reviewed the change in a state’s labor force from 2011 to 2016. For each state’s unemployment insurance (UI) benefits system we also considered average weekly benefit amounts and as a percentage of the average weekly wage (the replacement rate), the percentage of UI claimants exhausting their benefits before finding a job (the exhaustion rate), the average duration in weeks of insurance benefits, and the percentage of unemployed individuals receiving UI benefits (the recipiency rate) from the Department of Labor’s Employment and Training Administration (DOLETA) as of the twelve months ending Q1 2017.
Lastly, to assess the strength of each state’s economy, we reviewed real GDP growth rates and per capita real GDP for 2016 from the Bureau of Economic Analysis (BEA). Also from the BEA, we considered 2015 regional price parity, a proxy for an area’s cost of living.
Essential Tips for Investing: Sponsored
A financial advisor can help you understand the advantages and disadvantages of investment properties. Finding a qualified financial advisor doesn’t have to be hard. SmartAsset’s free tool matches you with up to three financial advisors who serve your area, and you can interview your advisor matches at no cost to decide which one is right for you. If you’re ready to find an advisor who can help you achieve your financial goals, get started now.
Investing in real estate can diversify your portfolio. But expanding your horizons may add additional costs. If you’re an investor looking to minimize expenses, consider checking out online brokerages. They often offer low investment fees, helping you maximize your profit.
Thank you for reading! Have some feedback for us?
Contact the 24/7 Wall St. editorial team.
Editors' Picks

