Special Report
The Poorest County in Every State

Published:
Last Updated:
The typical U.S. household earned $55,322 in 2016, an increase of $1,433 from the year prior. While income in the United States is increasing overall, so is income inequality. The typical household in the wealthiest county earned $2,219 more in 2016 than in 2015, and the typical household in the poorest county earned $356 less.
Incomes vary across counties within a state, and even the wealthier states have relatively poor counties. Factors such as educational attainment, unemployment, and industrial composition affect income differences between counties. Often, the poorest counties tend to have a population with lower educational attainment, higher unemployment, or job opportunities in mostly lower-paying industries.
To determine the poorest county in every state, 24/7 Wall St. reviewed data on median household income for every U.S. county with at least 10,000 residents with data from the U.S. Census Bureau’s American Community Survey.
Click here to see the full list of the poorest county in each state.
Click here to see our detailed findings and methodology.

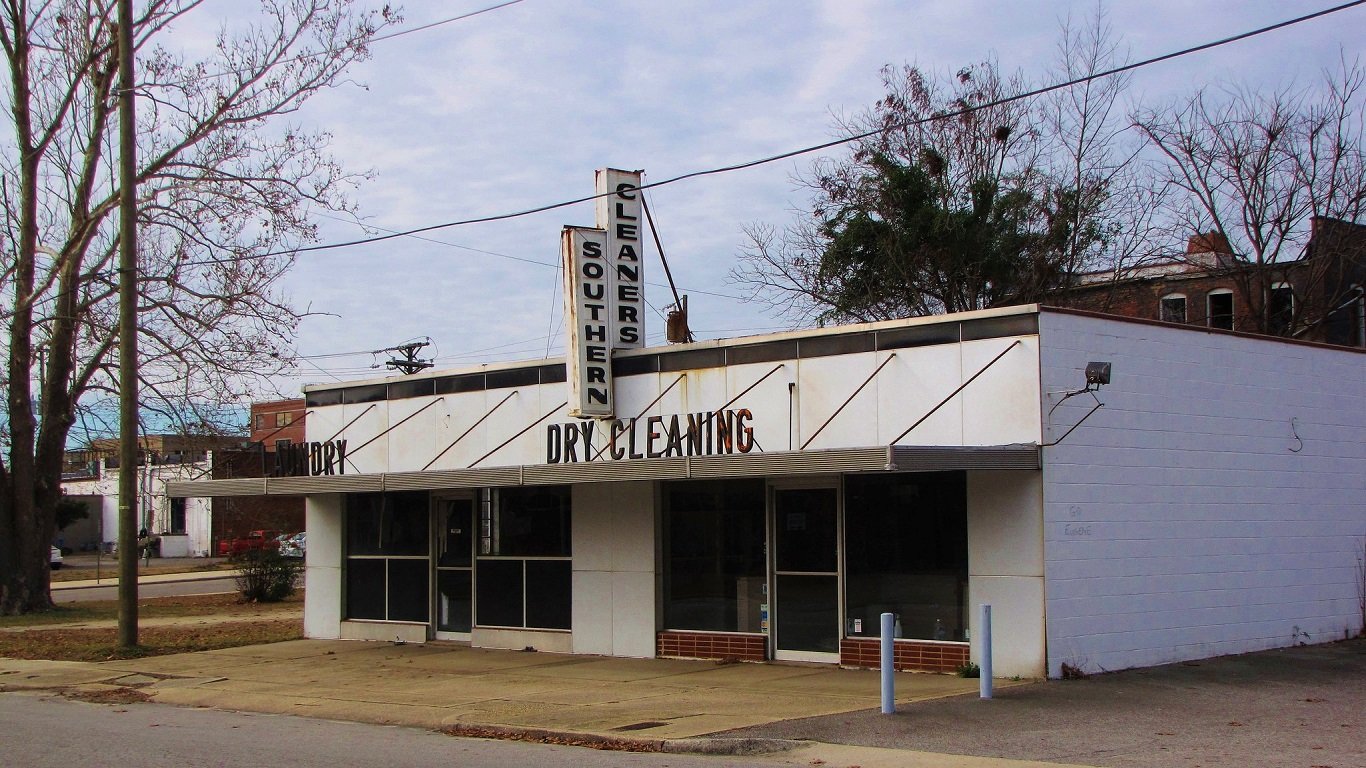
1. Sumter County, Alabama
> County median household income: $20,428
> State median household income: $44,758
> Poverty rate: 36.7%
> Nov. unemployment: 5.4%
Sumter is the poorest county in one of the poorest states. The typical household in Sumter County earns just $20,428 a year, less than half the median household income for Alabama as a whole of $44,758 and the second lowest of any U.S. county with a population of at least 10,000 people.
Some 36.7% of county residents live in poverty, also the largest share of any county with at least 10,000 residents in the state. A weak job market may partially explain low incomes in the area. While Alabama’s unemployment rate of 3.6% is lower than in most states and lower than the nationwide jobless rate of 4.1%, Sumter County’s unemployment rate is much higher at 5.4%.
[in-text-ad]
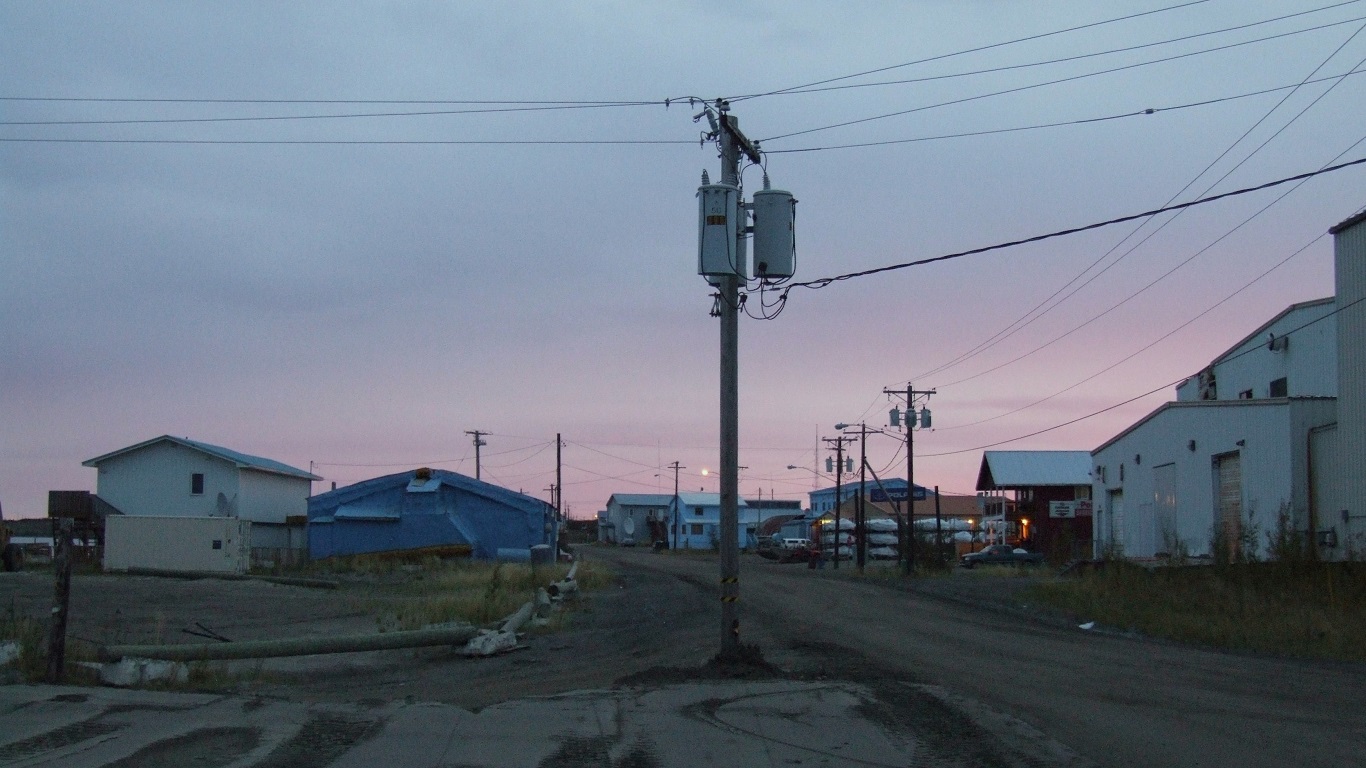
2. Bethel Census Area, Alaska
> County median household income: $53,296
> State median household income: $74,444
> Poverty rate: 26.6%
> Nov. unemployment: 13.0%
The poorest county in one of the wealthiest states, the Bethel Census Area median household income is $53,296 a year — far less than the statewide median income of $74,444 yet nearly on par with the national median of $55,322. While the Port of Bethel is the only port on the Kuskokwim River and the area serves as a major transportation hub for the 50 villages in the Yukon-Kuskokwim Delta region, the area suffers from poverty and high unemployment. Some 26.6% of census area residents live in poverty, and 13.0% of the workforce is unemployed, each some of the highest such figures in the country. Bethel’s economy is largely based on services, government, and salmon fishing, and a relatively small share of residents have a college education. Just 11.4% of Bethel adults have a bachelor’s degree, the smallest share in Alaska and nearly a third of the national figure.
3. Apache County, Arizona
> County median household income: $32,460
> State median household income: $51,340
> Poverty rate: 36.2%
> Nov. unemployment: 9.2%
Roughly two-thirds of Apache County residents are Navajo, and more than half of the county’s land belongs to the Navajo Nation. Apache County is also home to the Fort Apache Indian Reservation and the Pueblo of Zuni. Indian reservations historically have been beset by numerous economic problems. The typical household in Apache County earns just $32,460 a year, the least of any county in Arizona and far less than the median household incomes statewide of $51,340 and nationwide of $55,322.
An estimated 36.2% of county residents live in poverty, the largest share of any county in Arizona. Some 9.2% of the county’s workforce are unemployed, more than double the statewide unemployment rate of 4.3% and nationwide rate of 4.1%.
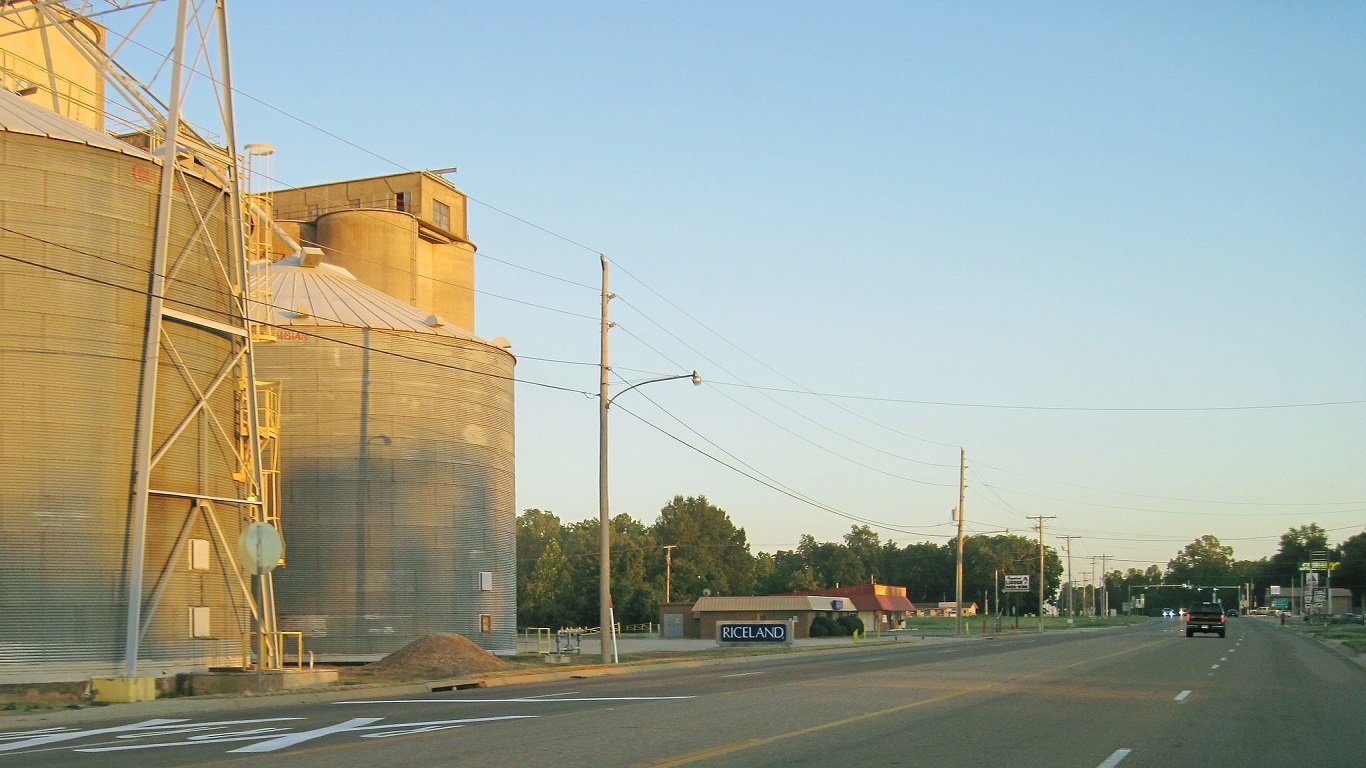
4. Desha County, Arkansas
> County median household income: $26,519
> State median household income: $42,336
> Poverty rate: 32.0%
> Nov. unemployment: 4.1%
While Desha County once flourished in the cotton-based economy of the antebellum South, the area suffered population and economic decline throughout the second half of the 20th century. Some 12,234 residents currently reside in Desha County, less than half the peak of 27,160 residents in 1940. The typical household earns just $26,519 a year, the least of any county in Arkansas and less than half the national median household income of $55,322. Some 32.0% of Desha County residents live below the poverty line, far more than the 18.8% state and 15.1% national poverty rates.
[in-text-ad-2]

5. Trinity County, California
> County median household income: $35,270
> State median household income: $63,783
> Poverty rate: 20.1%
> Nov. unemployment: 5.2%
Trinity is a small county located near the coast in northern California. One of original counties formed in 1850 at the beginning of California’s statehood, Trinity County is still home to some of the oldest buildings in the state. WIth just four people per square mile, it is one of the least densely populated counties in California and lacks much of the economic activity prevalent in the more dense and prosperous parts of the state.
The typical county household earns just $35,270 a year, the least of any California county and far less than the median household income for California of $63,783. Despite the low incomes, there are dozens of counties in California where a larger share of residents struggle financially than in Trinity County. In counties such as Tulare, Fresno, and Merced in the San Joaquin Valley, the average poverty and unemployment rates are 26.5% and 8.1%, respectively. In Trinity, the poverty rate is 20.1% and the jobless rate is 5.2%.

6. Alamosa County, Colorado
> County median household income: $32,385
> State median household income: $62,520
> Poverty rate: 31.4%
> Nov. unemployment: 3.3%
The typical household in Colorado earns $62,520 a year, the 12th highest median household income of any state. In some parts of Colorado, however, incomes are far lower. There are a dozen counties, mostly in the southern half of the state, where the annual median household income is below $45,000. In the poorest, Alamosa County, the typical household earns just $32,385 a year, nearly half the statewide figure and far less than the national median household income of $55,322. Some 31.4% of Alamosa County residents live in poverty, also the largest share in the state.
[in-text-ad]
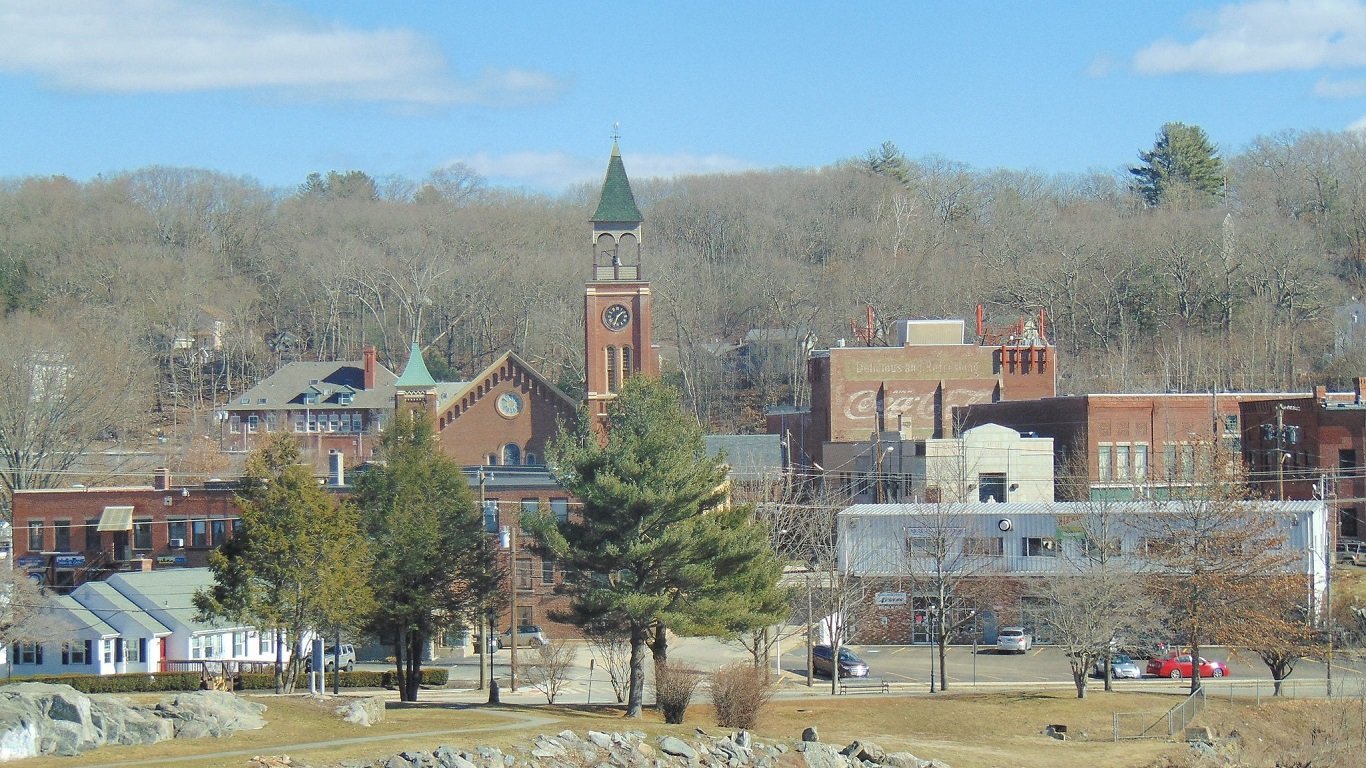
7. Windham County, Connecticut
> County median household income: $60,689
> State median household income: $71,755
> Poverty rate: 11.2%
> Nov. unemployment: 4.5%
The typical household in Connecticut earns $71,755 a year, the fifth highest median income of any state. While Windham is the poorest county in the state, the county’s annual median household income of $60,689 is higher than the national median of $55,322.
Windham County is one of the more rural counties in Connecticut and lacks much of the economic activity of wealthier parts of the state. The area, also called the Quiet Corner, is known for its small towns and small scale dairy farms. The area also suffered from the decline of the manufacturing industry that has left many locals without a job. Some 4.5% of the Windham County workforce are unemployed, a larger share than the 4.3% statewide jobless rate.

8. Sussex County, Delaware
> County median household income: $54,218
> State median household income: $61,017
> Poverty rate: 12.9%
> Nov. unemployment: 4.5%
Delaware consists of just three counties: Sussex, Kent, and New Castle. Sussex County is the poorest in the state, followed closely by Kent County. The typical Sussex County household earns $54,218 a year, far less than the median household income in New Castle County of $66,283 yet roughly in line with the national median of $55,322. One factor contributing to the income disparity among the wealthiest and poorest county in Delaware may be the difference in educational attainment. While just 23.9% of adults in Sussex County have a bachelor’s degree some 35.4% of New Castle County adults do, the largest share in Delaware.

9. Madison County, Florida
> County median household income: $29,806
> State median household income: $48,900
> Poverty rate: 28.5%
> Nov. unemployment: 4.2%
The typical household in Madison County, Florida earns only $29,806 a year, about $19,000 less than the median income across the state as a whole. Both on an individual level and across broad populations, educational attainment is one of the best predictors of income, as those with a college education are more likely to secure higher paying jobs. In Madison County, only 12.3% of adults have at least a bachelor’s degree, less than half the 27.9% of adults across the state and the 30.3% of American adults.
[in-text-ad-2]
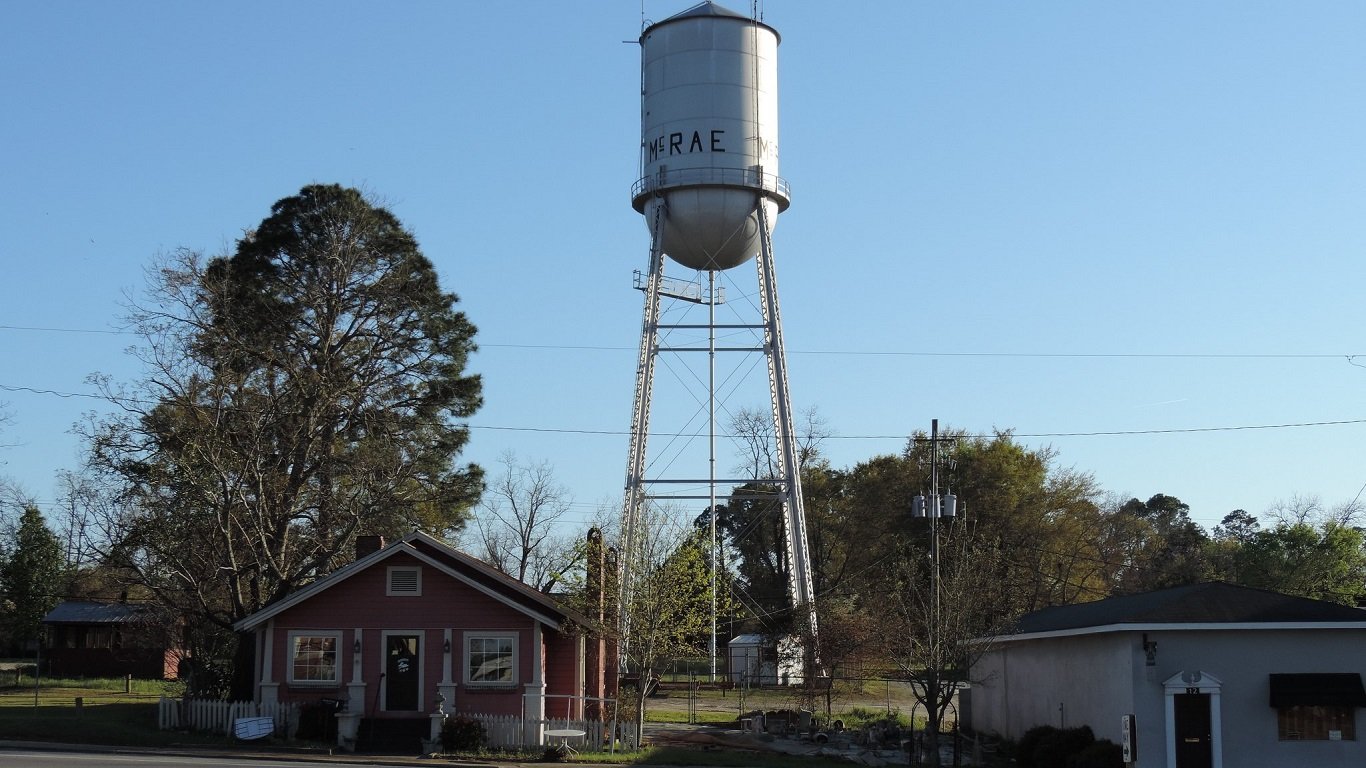
10. Telfair County, Georgia
> County median household income: $27,657
> State median household income: $51,037
> Poverty rate: 28.7%
> Nov. unemployment: 7.0%
While Telfair County was a major agricultural hub in the 19th century, today it is the poorest county in Georgia. The county experienced substantial population decline throughout the 20th century, and the number of residents in the area has only recently surpassed the 1920 peak of 15,291 residents. The population increase was in part due to the opening of two prisons — Telfair State Prison in 1992 and McRae Correctional Institution in 2000 — which today are two of the four largest employers in the county. While prisons have provided some residents with gainful employment, some 7.0% of the Telfair County workforce is unemployed, the highest unemployment rate in the state and among the highest in the country. The typical county household earns just $27,657 a year, less than half the median household income of $55,322 nationwide and the lowest of any county in Georgia. Low incomes may also be due in part to the county’s large prison population.

11. Hawaii County, Hawaii
> County median household income: $53,936
> State median household income: $71,977
> Poverty rate: 18.7%
> Nov. unemployment: 2.4%
Hawai’i County comprises the Island of Hawai’i, the largest and southeasternmost of the Hawaiian Islands by land area. The typical household in the state of Hawaii earns $71,977 a year, the fourth highest median household income of any state. In Hawai’i County, however, the median household income is just $53,936, the lowest of any county in the state by more than $14,000 and less than the national median of $55,322. One factor contributing to the income disparity between Hawaii County and the rest of the state may be differences in the job market across Hawaii. While Hawaii County’s 2.4% unemployment rate is far less than the 4.1% national rate, it is the highest of any county in the state and higher than the 2.0% unemployment rate for Hawaii as a whole.
[in-text-ad]
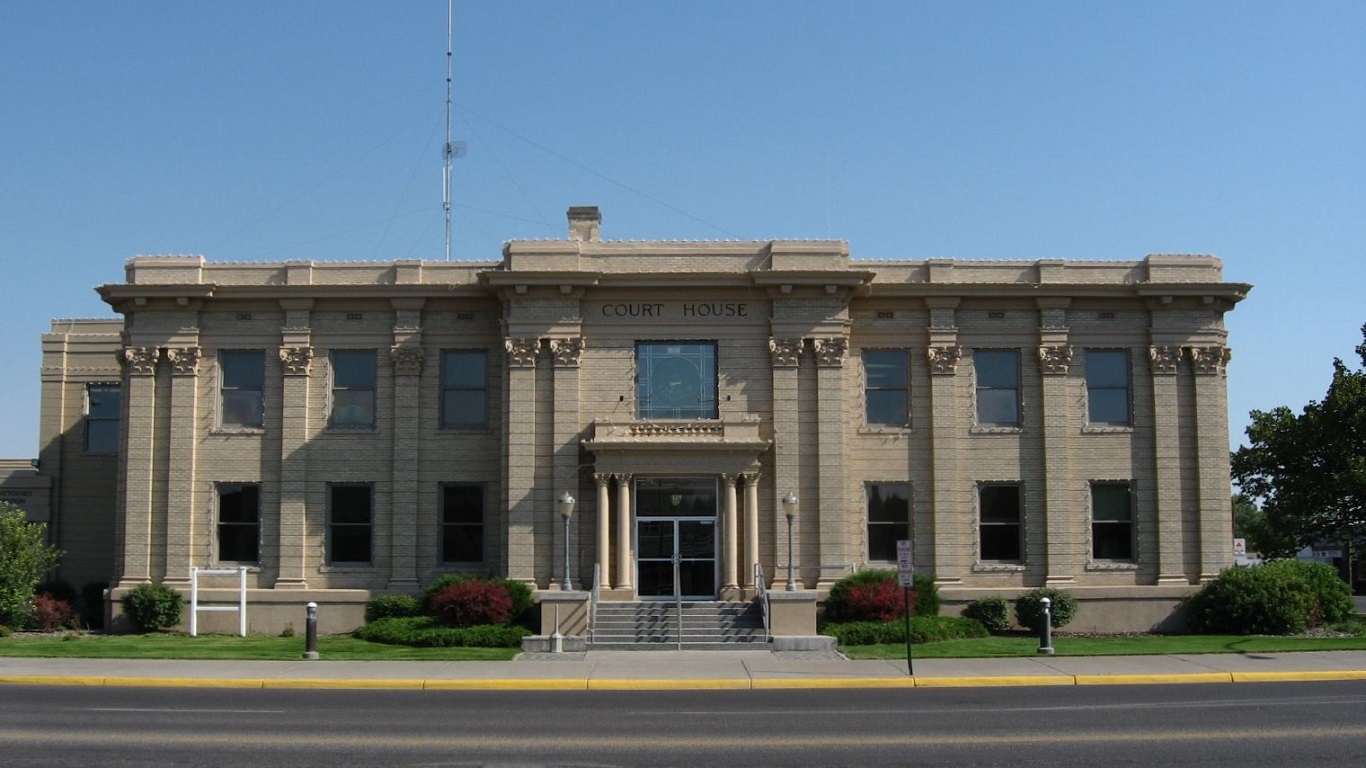
12. Madison County, Idaho
> County median household income: $33,856
> State median household income: $49,174
> Poverty rate: 32.6%
> Nov. unemployment: 1.9%
The typical household in Madison County earns $33,856 a year, less than the median household income for Idaho as a whole of $49,174 and the least of any county in the state. While poorer areas often have low educational attainment, some 36.8% of Madison County adults have a bachelor’s degree — far more than the comparable attainment rate statewide of 26.2% and the fifth largest share of any Idaho county. Similarly, just 1.9% of the county’s workforce is unemployed, the lowest unemployment rate in Idaho and less than half the 4.1% U.S. jobless rate. One reason for the low income, high education levels, and low unemployment is likely the large share of students in the area, who often study full time or work low-paying, part-time jobs. Madison County is home to Brigham Young University-Idaho, a private university operated by The Church of Jesus Christ of Latter-day Saints.
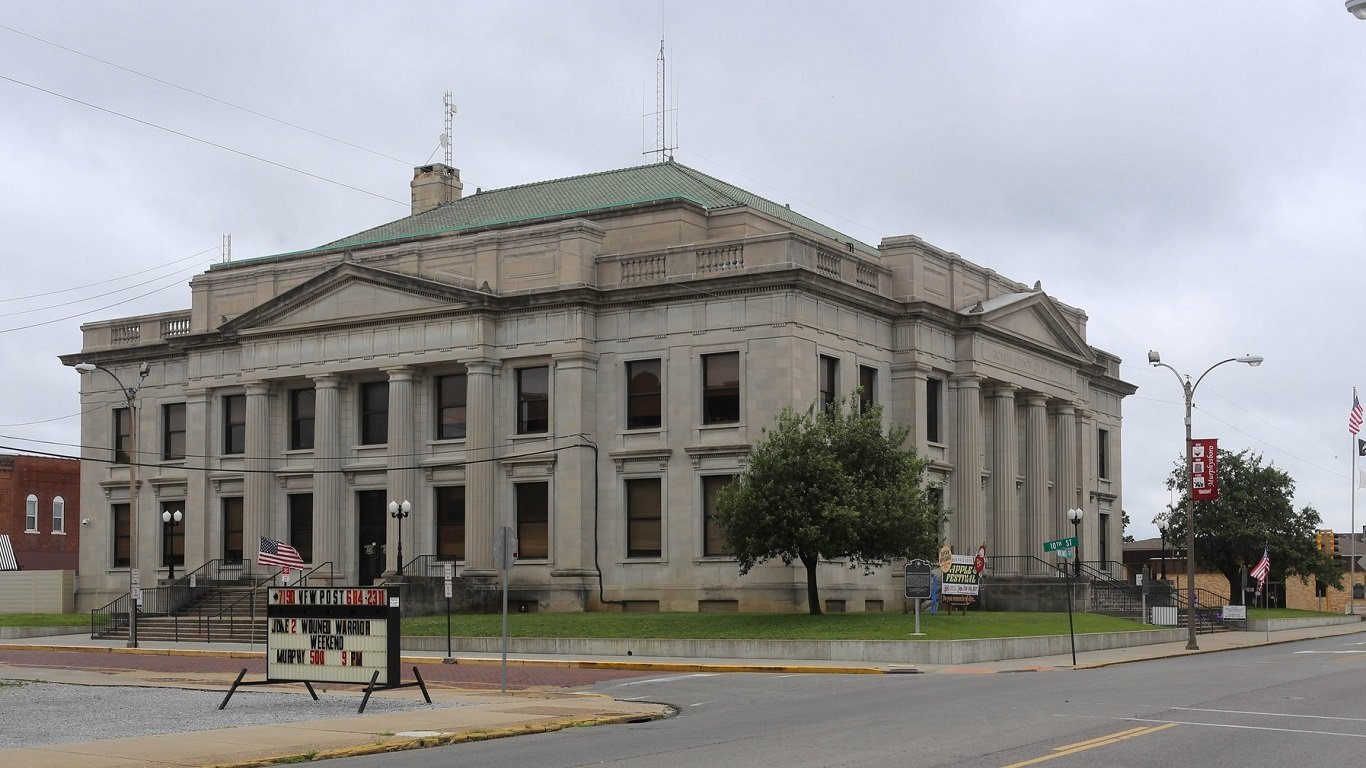
13. Jackson County, Illinois
> County median household income: $33,845
> State median household income: $59,196
> Poverty rate: 28.3%
> Nov. unemployment: 4.3%
The typical household in Jackson County earns just $33,845 a year, far less than the median household income for Illinois as a whole of $59,196 and the median income nationwide of $55,322. Some 28.3% of Jackson County residents live in poverty, also the largest share of any county with at least 10,000 residents in the state and nearly twice the national poverty rate of 15.1%.
While residents of poorer areas are less likely to be educated, an estimated 92.3% of adults in Jackson County have a high school diploma, and 35.9% have a bachelor’s degree — each higher than the corresponding nationwide rates of 87.0% and 30.3%. The large shares of high school- and college-educated adults is likely due to the presence of Southern Illinois University.
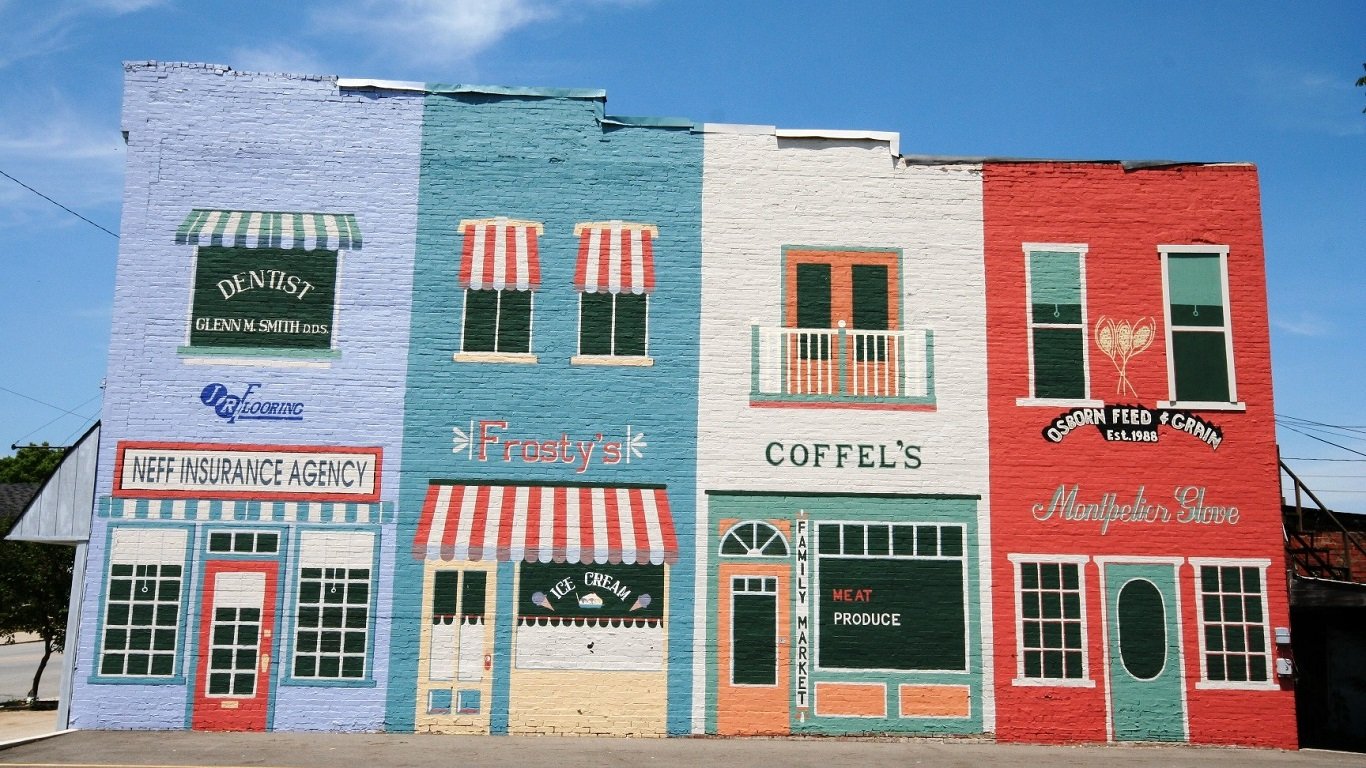
14. Blackford County, Indiana
> County median household income: $38,791
> State median household income: $50,433
> Poverty rate: 12.0%
> Nov. unemployment: 3.8%
While Blackford County was a major natural gas hub and economic powerhouse in the late 19th century, today it is the poorest county in Indiana. The county’s population declined substantially following the natural gas boom period of the late 19th century, and today it is home to 12,364 residents — far less than its peak of 17,213 in 1900. The typical household in Blackford County earns just $38,791 a year, far less than the statewide median household income of $50,433 and less than the national median of $55,322. Despite the slowdown in economic activity, a relatively small share of residents experience serious financial hardship. Just 12.0% of Blackford County residents live in poverty, one of the smaller shares in Indiana and less than the nationwide poverty rate of 15.1%.
[in-text-ad-2]
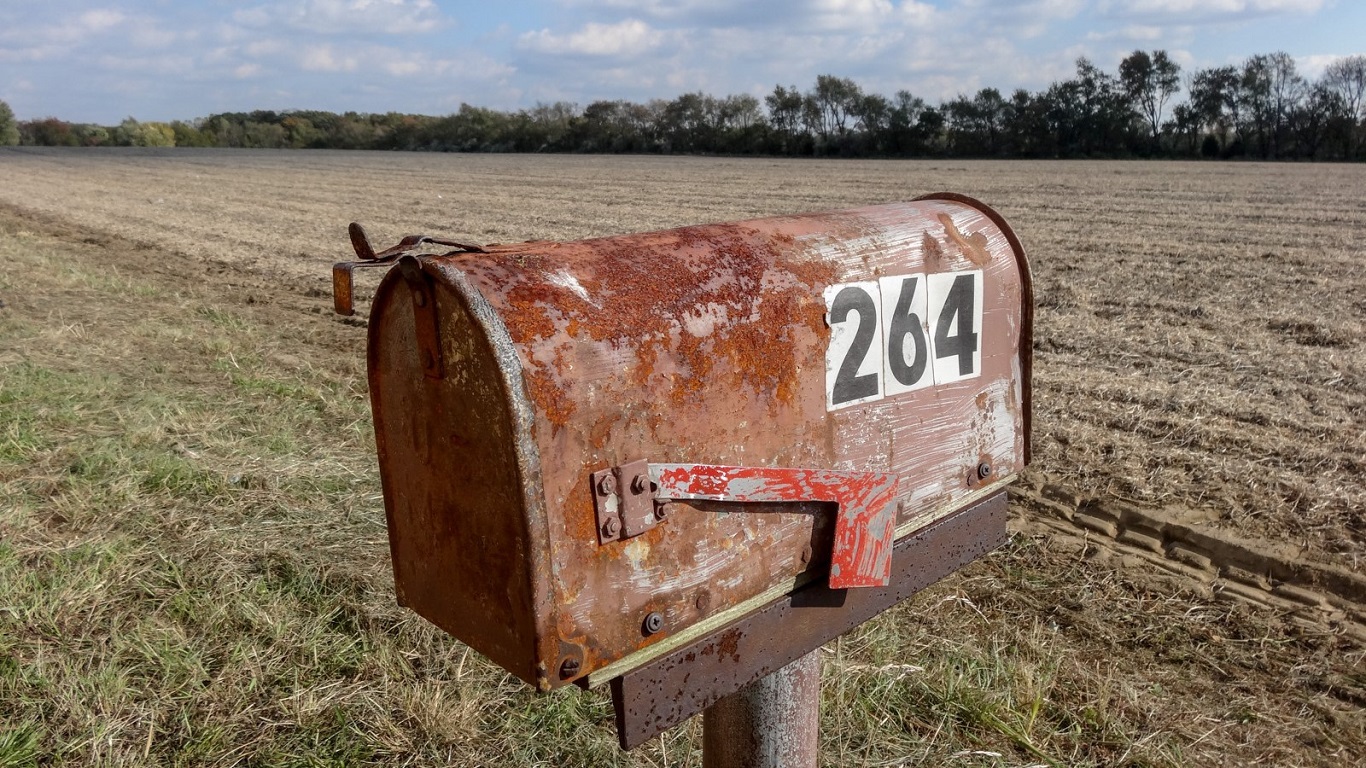
15. Appanoose County, Iowa
> County median household income: $40,817
> State median household income: $54,570
> Poverty rate: 16.1%
> Nov. unemployment: 3.2%
Once a leading producer of coal, Appanoose County experienced substantial economic and population decline throughout the 20th century and has yet to fully recover from the loss of its primary industry. Today, Appanoose County is home to 12,602 residents, less than half of the county’s peak population of 30,535 in 1920. Some 3.2% of the county’s workforce are unemployed. While this is less than the 4.1% national jobless rate, it is far more than the 2.5% unemployment rate for Iowa as a whole and one of the highest of any county in the state. The typical Appanoose County household earns just $40,817 a year, less than the state and national median household incomes of $54,570 and $55,322, respectively.
16. Crawford County, Kansas
> County median household income: $37,607
> State median household income: $53,571
> Poverty rate: 21.8%
> Nov. unemployment: 3.8%
Crawford County, located in the southeastern corner of Kansas near the state’s border with Missouri, is the poorest county in the state with a median household income of about $37,600 a year. The county is home to the city of Pittsburg and to smaller communities like Girard and Frontenac. While the poorest areas often have the lowest college attainment rates, some 28.4% of Crawford County adults have a bachelor’s degree — one of the highest shares of any Kansas county.
[in-text-ad]

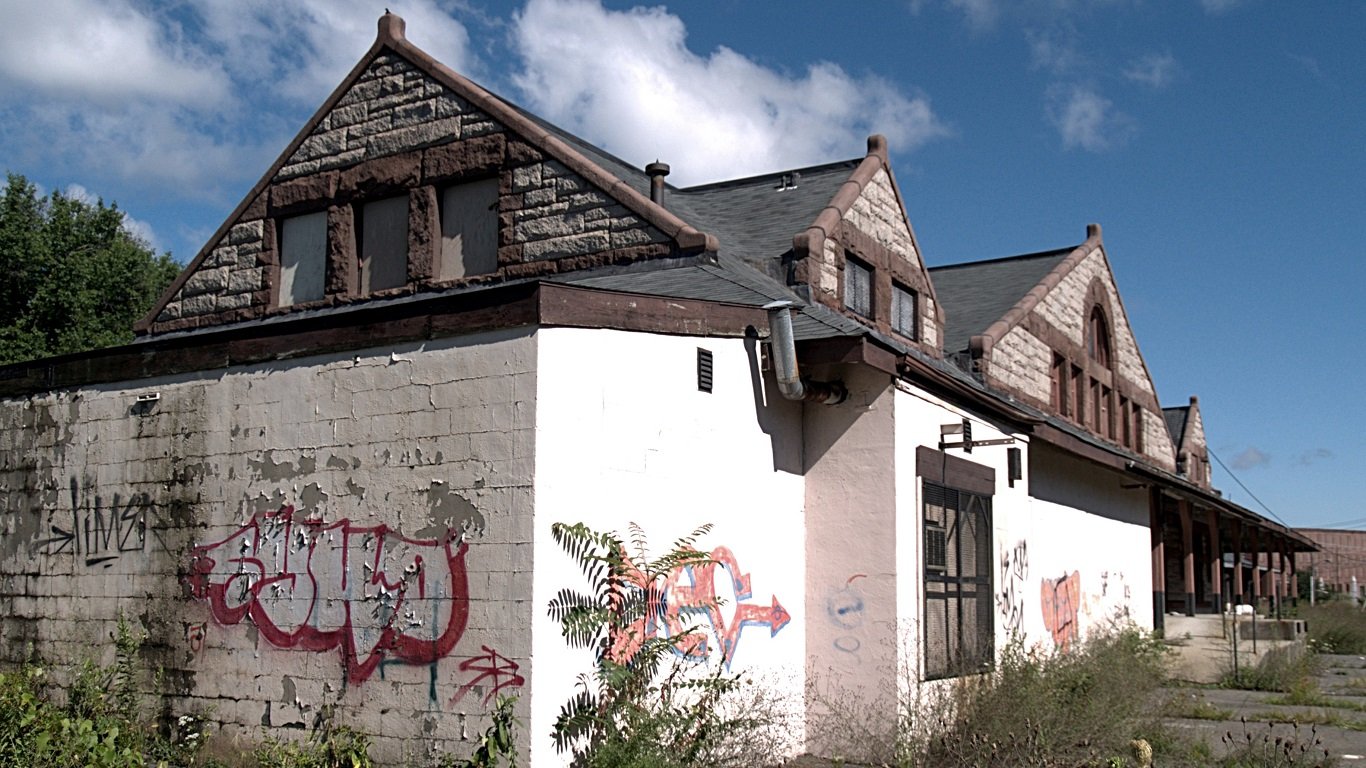
17. McCreary County, Kentucky
> County median household income: $18,972
> State median household income: $44,811
> Poverty rate: 42.5%
> Nov. unemployment: 5.6%
Kentucky is one of the five poorest states in the country, and McCreary County, forming part of the state’s southern border with Tennessee, is the poorest in the state. The county’s median annual household income is $18,972, well below both the comparable state and national median incomes. An astounding 42.5% of the county’s 17,850 residents live in poverty, which is not only the highest poverty rate in the state, but also nearly the highest of any county in the country.
18. Madison Parish, Louisiana
> County median household income: $25,404
> State median household income: $45,652
> Poverty rate: 39.6%
> Nov. unemployment: 7.0%
The poorest parish in one of the poorest states, the typical household in Madison Parish earns just $25,404 a year — far less than the $45,652 state and $55,332 national median incomes, and the 11th least of any U.S. county with at least 10,000 residents. Some 39.6% of Madison Parish residents live in poverty, also the largest share in Louisiana and the seventh highest poverty rate nationwide. The region’s low incomes are likely tied to high unemployment in the area. The most recent monthly unemployment rate in Madison was 7.0%, far higher than 3.2% state and 4.1% national rates.
19. Piscataquis County, Maine
> County median household income: $36,938
> State median household income: $50,826
> Poverty rate: 20.6%
> Nov. unemployment: 4.3%
Regional inequalities are stark in Maine, with wealthy towns and cities on the southern coast in places like Kennebunkport and Elizabethtown, while rural poverty characterizes large parts of the state going inland. Piscataquis County, one of the largest in the Northeast — it is approximately the size of Connecticut — is the poorest in the state. Approximately 1 in 5 residents report incomes below the poverty level. Additionally, the typical household in the county earns only $36,938 a year, about $14,000 less than the typical household across the state.
[in-text-ad-2]

20. Somerset County, Maryland
> County median household income: $35,886
> State median household income: $76,067
> Poverty rate: 25.1%
> Nov. unemployment: 6.8%
Maryland is home to some of the country’s wealthiest counties, such as Montgomery and Howard County in the D.C. metro area. It is also home to one of the poorest counties — Somerset County, located on the southeastern side of the Chesapeake Bay. The typical Somerset household earns less than half the income of the typical Maryland household. Over 1 in 4 Somerset residents live in poverty, the largest share in the state.
Education is one of the major determinants of income. Just 79.2% of Somerset County adults have a high school diploma, the smallest share in Maryland and far less than the 87.0% national share. Similarly, just 14.0% of county adults have a bachelor’s degree, less than half the 30.3% national share and the least of any county in Maryland.
21. Hampden County, Massachusetts
> County median household income: $51,005
> State median household income: $70,954
> Poverty rate: 17.6%
> Nov. unemployment: 4.4%
The typical Massachusetts household earns $70,954 a year, far more than the $55,322 the typical U.S. household earns. However, not all parts of the state are as well off financially. Hampden County, where the typical household earns only $51,005 a year, is one of only two counties in the state with a lower median income than the U.S. as a whole.
Home to the city of Springfield and located along the Connecticut border, Hampden County is the least expensive place to live in Massachusetts. The typical home in the county is worth $196,500. Meanwhile, the typical home in the vast majority of counties in the state is worth more than a quarter million dollars.
[in-text-ad]
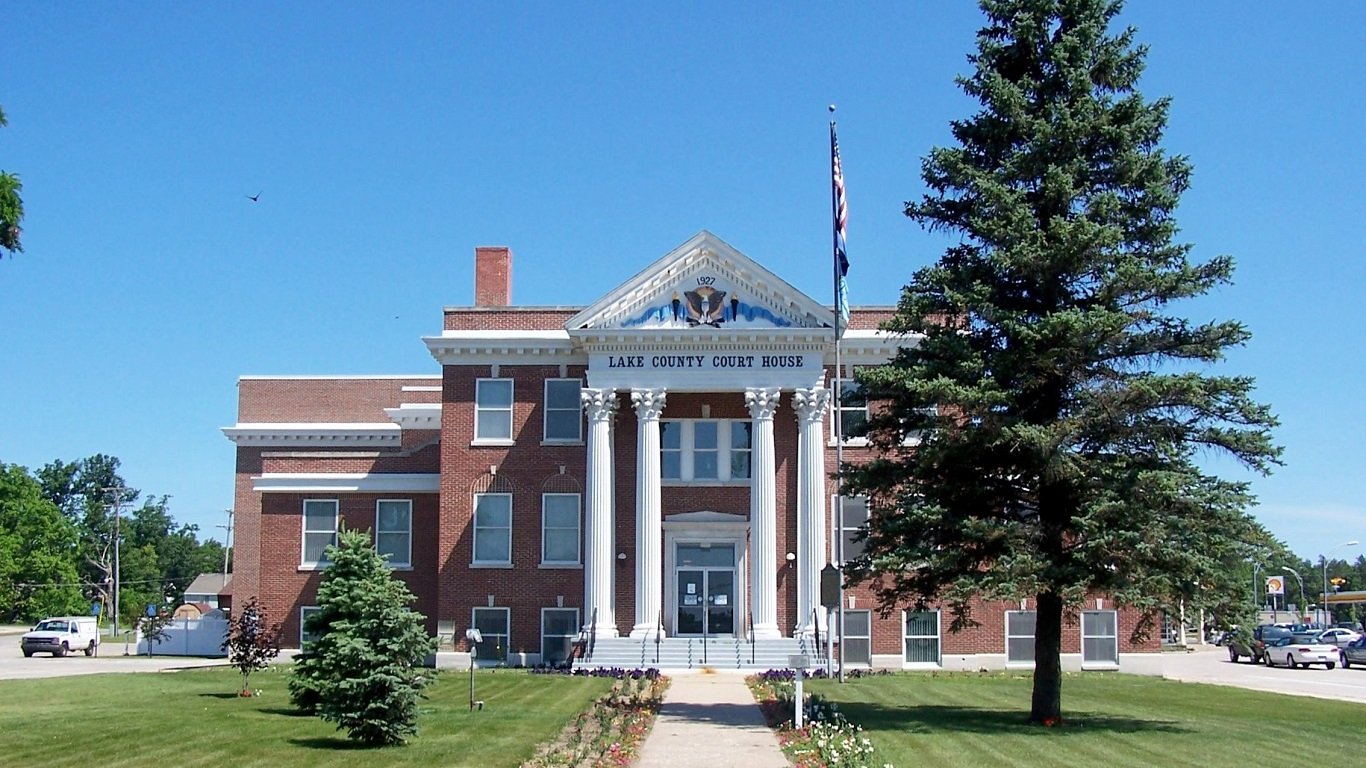
22. Lake County, Michigan
> County median household income: $30,824
> State median household income: $50,803
> Poverty rate: 27.2%
> Nov. unemployment: 6.9%
The typical Lake County household earns just $30,824 a year, less than the $50,803 median household income for Michigan as a whole and far less than the $55,322 national median. Lake County is a small, rural county near the coast of Lake Michigan. While the county’s population can increase to between 30,000 and 40,000 during the summer, when part-time residents and tourists visit the area, Lake County’s permanent population is 11,415. Such seasonal fluctuations in consumer demand may not be able to stimulate the area’s economy year round. Currently, some 6.9% of the Lake County workforce is unemployed, far more than the 4.0% state and 4.1% national unemployment rate. An estimated 27.2% of Lake County lives in poverty, the second largest share in Michigan.
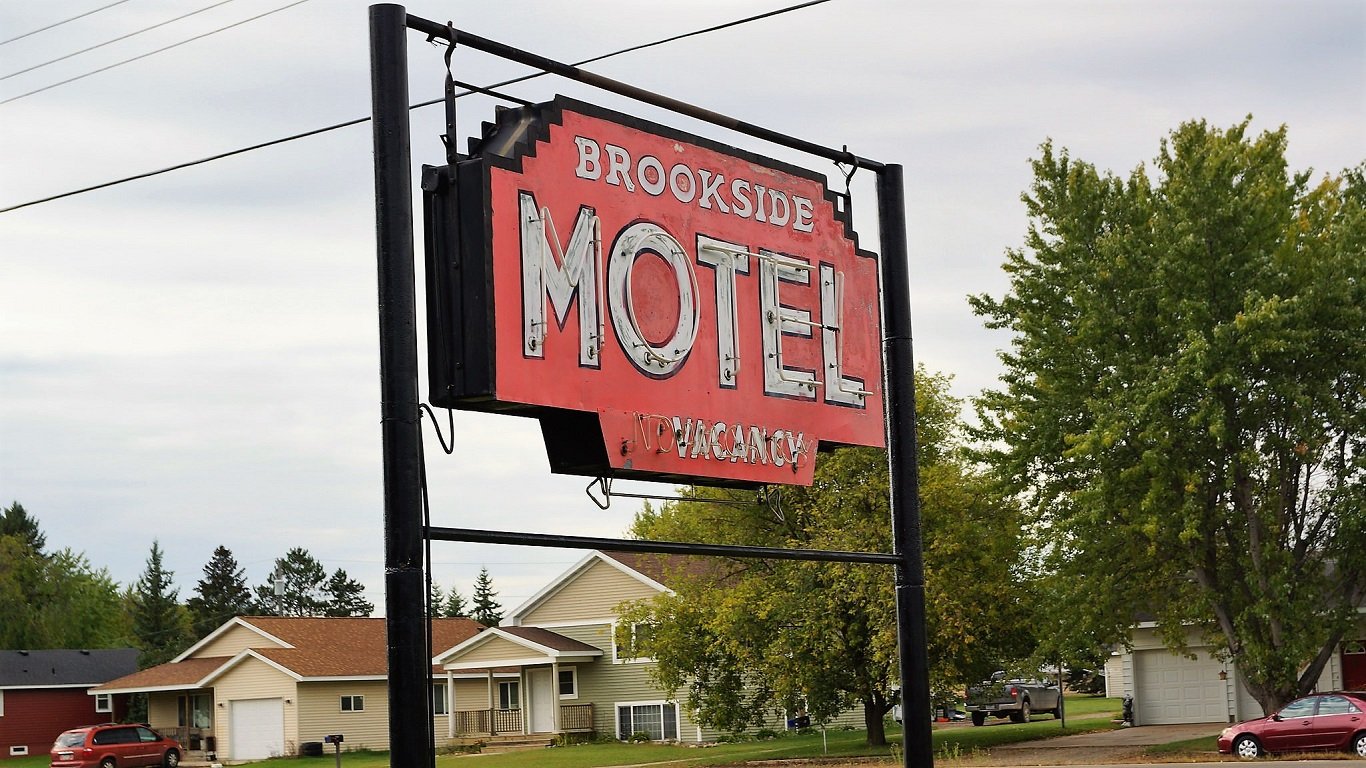
23. Wadena County, Minnesota
> County median household income: $42,689
> State median household income: $63,217
> Poverty rate: 15.5%
> Nov. unemployment: 4.6%
The typical household in Wadena County earns $42,689 a year, about $20,000 below the median household income across Minnesota. The county’s lower incomes are likely partially the product of a sluggish economy. As of November 2017, 4.6% of Wadena County’s labor force were out of a job compared to a 2.6% statewide unemployment rate.
Across broad populations, incomes levels track very closely with educational attainment. Generally speaking, the better educated a population is, the higher are its earnings. In Wadena County, only 13.0% of adults have earned a bachelor’s degree, less than half the comparable share across the state of 34.2%.
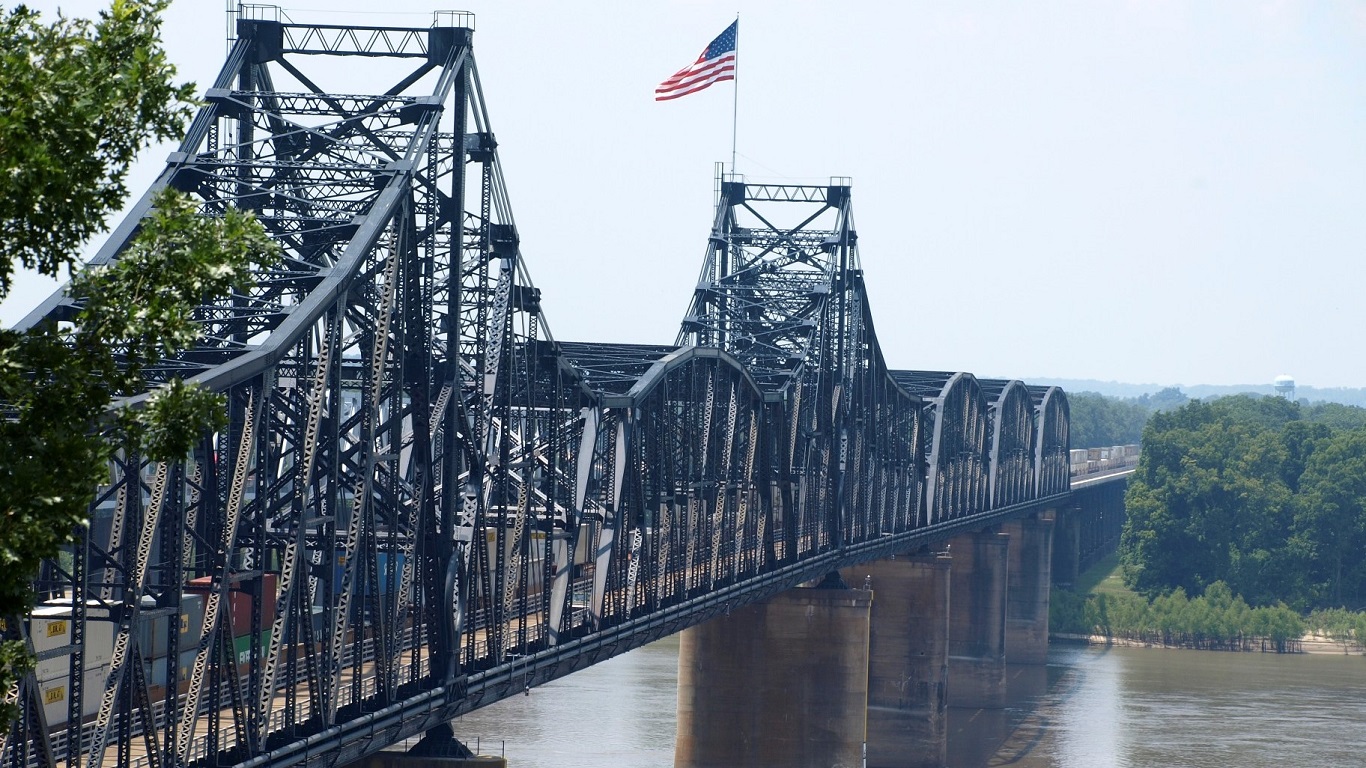
24. Holmes County, Mississippi
> County median household income: $20,800
> State median household income: $40,528
> Poverty rate: 45.0%
> Nov. unemployment: 8.1%
Once a leading producer of cotton, Holmes County experienced substantial economic and population decline throughout the second half of the 20th century and has yet to fully recover from the loss of its primary industry. Today, Holmes County is home to 18,547 residents, less than half of the county’s peak population of 39,710 in 1920. The typical Holmes County household earns just $20,800 a year, nearly half of the median household income for Mississippi as a whole of $40,528 and the third least of any U.S. county with at least 10,000 residents. Some 45.0% of Holmes County residents live in poverty — the third largest share of any county and nearly three times the 15% national poverty rate.
[in-text-ad-2]

25. Mississippi County, Missouri
> County median household income: $29,214
> State median household income: $49,593
> Poverty rate: 30.5%
> Nov. unemployment: 3.8%
Sharing a name with the river that defines its eastern border, Mississippi is the only county in Missouri where the typical household earns less than $30,000 a year. Low incomes in the area are underscored by the share of residents facing serious financial hardship. Some 30.5% of Mississippi County residents live in poverty, nearly double the poverty rate across the state of 15.3%.
Property values in a region often reflect what area residents can afford, and Mississippi County is no exception. The county’s median home value of $71,600 is about half the value of the typical Missouri home.
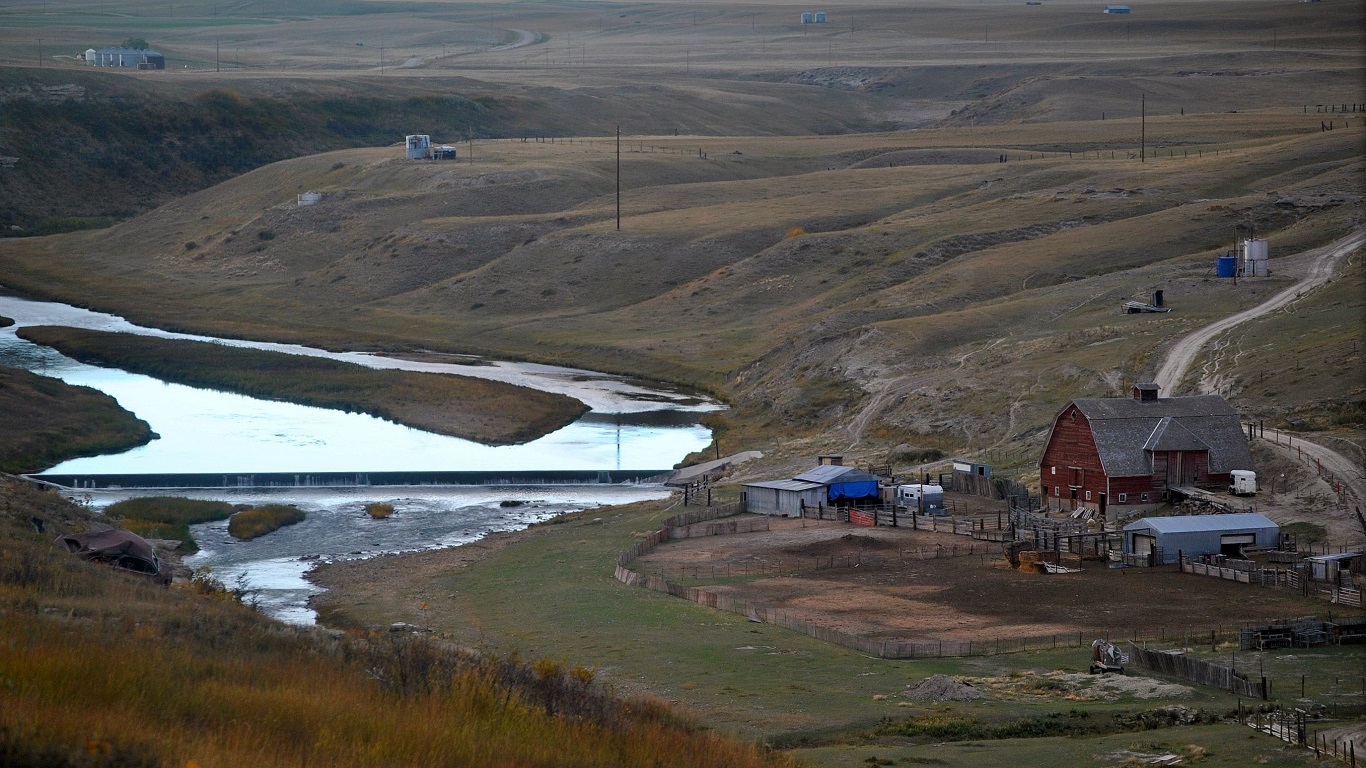
26. Glacier County, Montana
> County median household income: $29,181
> State median household income: $48,380
> Poverty rate: 33.3%
> Nov. unemployment: 7.9%
Glacier County is a rural county in Montana that contains the Blackfeet Native American Reservation and parts of Glacier National Park. While the area is a major tourist attraction and the region known as Glacier Country attracted $1 billion in tourist spending in 2016, much of the county struggles economically. The unemployment rate for Glacier County is 7.9%, and 33.3% of residents live in poverty, each some of the largest shares of any U.S. county.
The typical household in Glacier County earns just $29,181 a year, far less than the $48,380 state and $55,322 national median incomes. Much of the poverty and low incomes in Glacier County are concentrated in the town of Browning, the tribal headquarters of the Blackfeet Indian Reservation.
[in-text-ad]
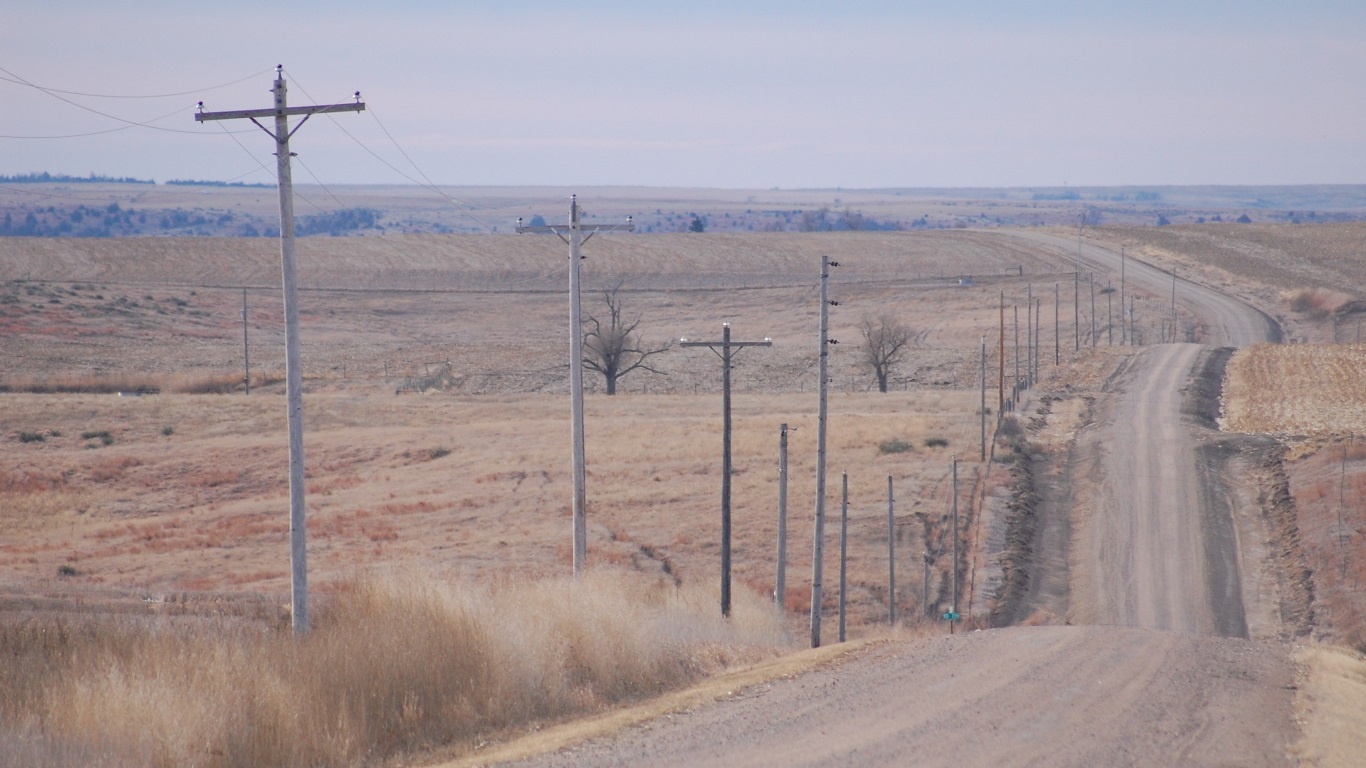
27. Red Willow County, Nebraska
> County median household income: $42,457
> State median household income: $54,384
> Poverty rate: 11.8%
> Nov. unemployment: 2.0%
The typical household in Red Willow County earns $42,457 a year, about $12,000 less than the typical Nebraskan household. Despite the lower incomes, Red Willow’s economy appears to be in better shape than the state’s as a whole — at least when it comes to jobs. Only 2.0% of the county’s workforce is out of a job, a smaller share than the 2.4% statewide and 4.1% nationwide unemployment rates.
Red Willow is a relatively small and sparsely populated county along the state border with Kansas. There are only about 15 people per square mile in Red Willow County — compared to 24 people and 87 people per square mile across the state and country, respectively.

28. Nye County, Nevada
> County median household income: $42,266
> State median household income: $53,094
> Poverty rate: 17.2%
> Nov. unemployment: 6.4%
The typical household in Nye County earns $42,266 a year, the least of any county in Nevada and far less than both the state and national median household incomes of $53,094 and $55,322, respectively. Some 17.2% of the Nye County population lives in poverty, also the largest share in the state.
A college degree can increase the likelihood of an individual securing a high-paying job. Additionally, a large share of college-educated adults can attract advanced business and industry to a region. Just 12.1% of adults in Nye County have a bachelor’s degree, far less than the 23.2% state college attainment rate and the 30.3% U.S. figure.

29. Coos County, New Hampshire
> County median household income: $45,154
> State median household income: $68,485
> Poverty rate: 13.3%
> Nov. unemployment: 3.2%
The typical household in Coos County, New Hampshire earns $45,154 a year, about $23,000 less than the median household income across the state. Educational attainment is one of the strongest predictors of income, and not only is Coos the poorest county in the state, but it also has the least educated population. Only 17.8% of adults in the county have a bachelor’s degree, far fewer than the 35.5% of adults in New Hampshire.
Despite the low incomes, serious financial hardship is relatively uncommon in Coos County. While the county’s poverty rate of 13.3% is the highest in state, it is lower than the nationwide poverty rate of 15.1%.
[in-text-ad-2]
30. Cumberland County, New Jersey
> County median household income: $49,537
> State median household income: $73,702
> Poverty rate: 18.5%
> Nov. unemployment: 7.1%
New Jersey has some of the worst income inequality of any state. While the typical household in suburban counties outside of Newark such as Somerset, Morris, and Hunterdon earns more than $100,000 a year, several counties earn far less. In Cumberland County, the poorest in the state, the typical household earns just $49,537 a year, far less than the median household income for New Jersey as a whole of $73,702.
One factor keeping incomes low in Cumberland County may be the area’s low educational attainment rate. A college degree can increase the likelihood of an individual securing a high-paying job, and a large share of college-educated adults can attract advanced business and industry to a region. In Cumberland County, just 14.3% of adults have a bachelor’s degree, the smallest share of any county in New Jersey and less than half the comparable state college attainment rate of 37.5%.
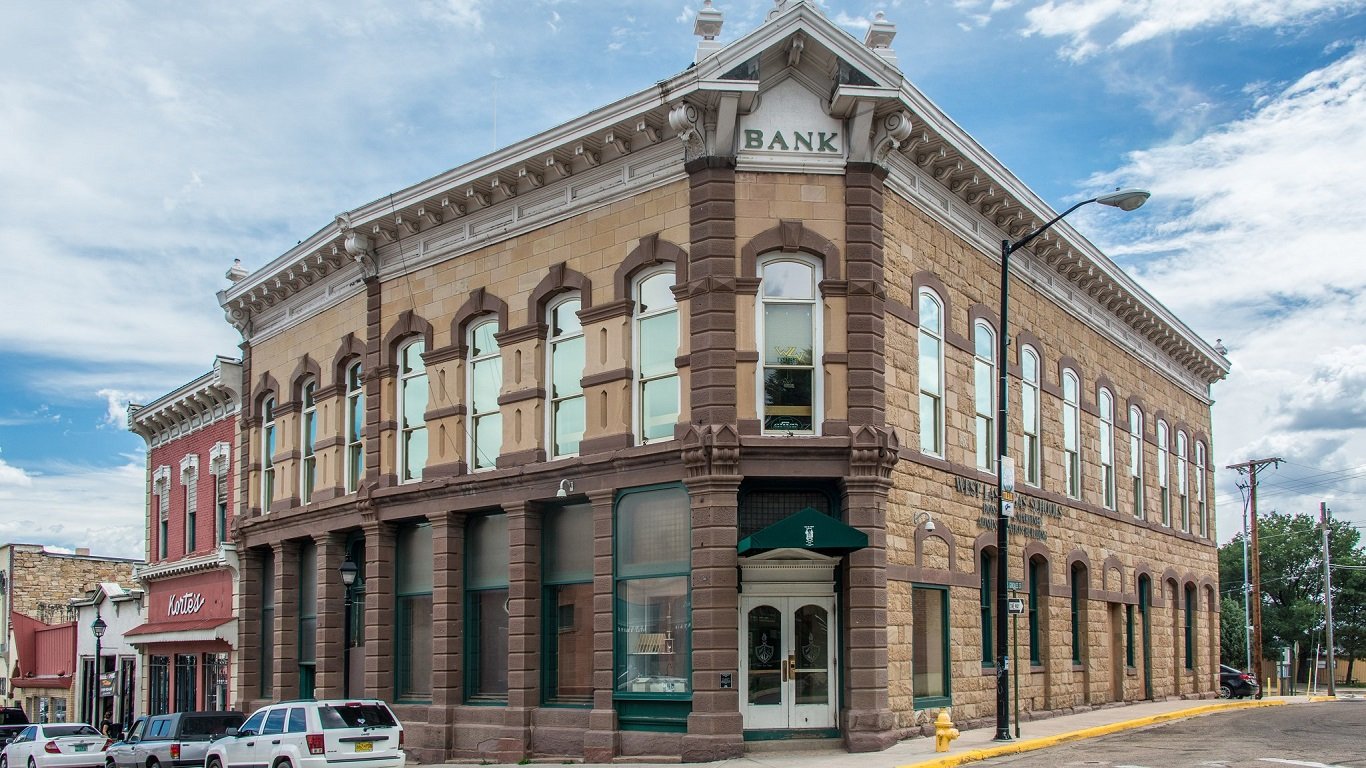
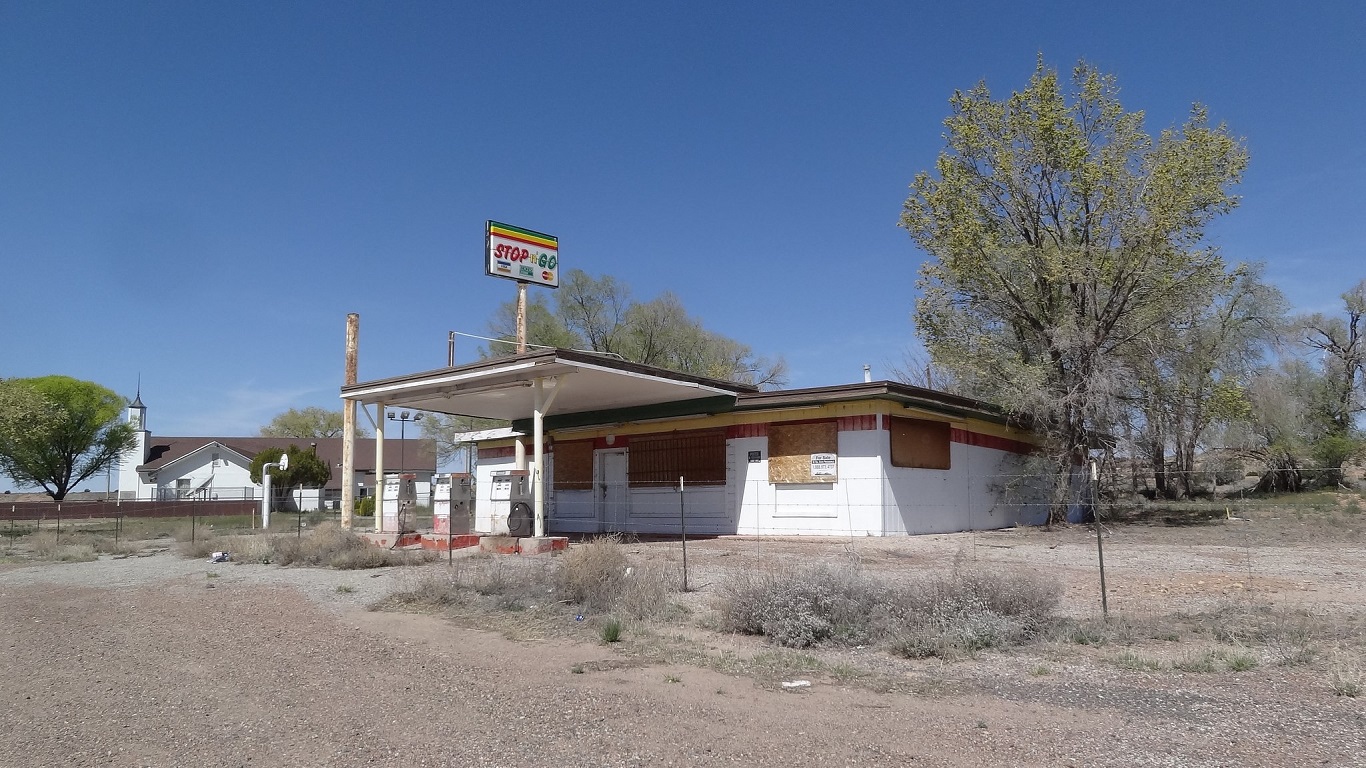
31. San Miguel County, New Mexico
> County median household income: $27,000
> State median household income: $45,674
> Poverty rate: 30.1%
> Nov. unemployment: 7.0%
With a median household income of $45,674 a year — $10,000 less than the national median — New Mexico is one of the poorest states in the country. San Miguel, the poorest county in the state, is also one of the poorest counties in the country. The typical county household earns only $27,000 a year, among the lowest median incomes of any U.S. county.
The county’s low incomes are partially attributable to a floundering economy. As of November 2017, 7.0% of San Miguel’s workforce was out of a job — well above the unemployment rates of 5.7% across New Mexico and 4.1% nationwide.
[in-text-ad]
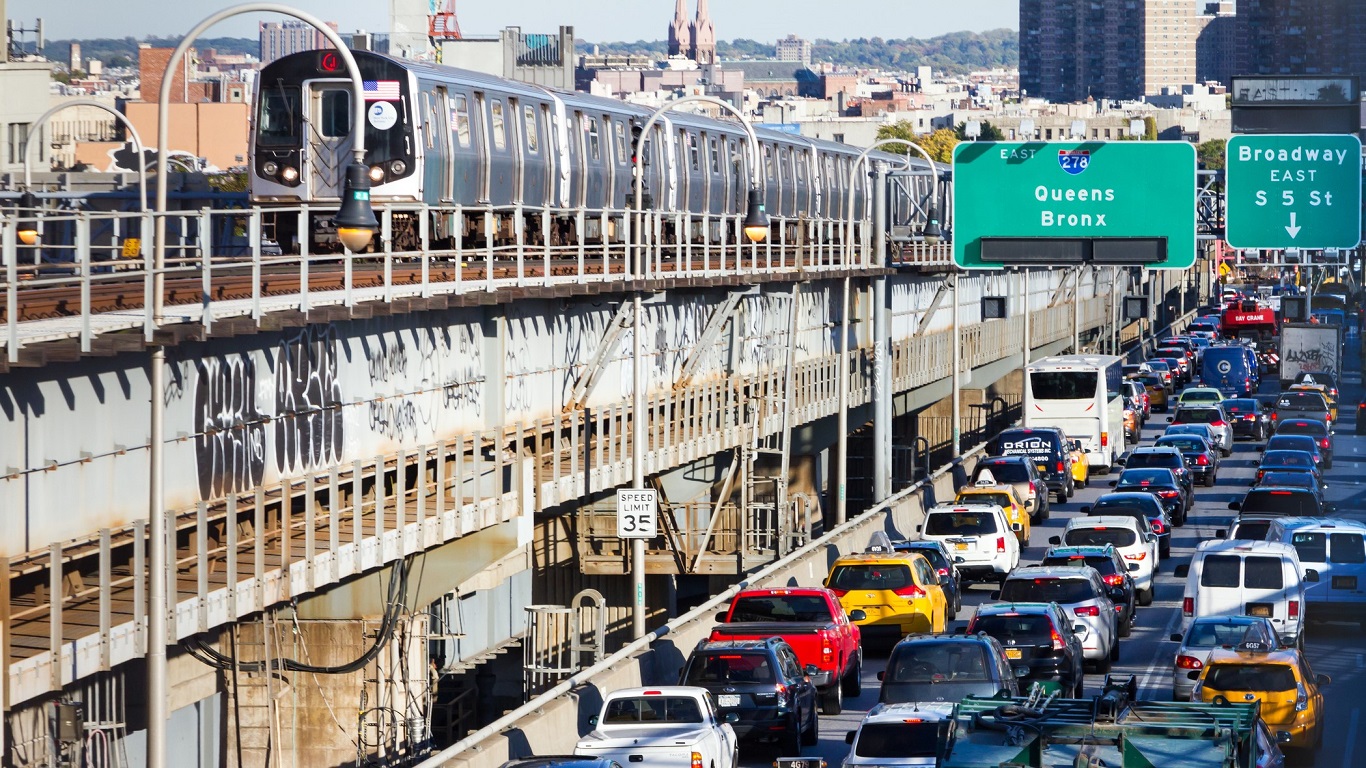
32. Bronx County, New York
> County median household income: $35,302
> State median household income: $60,741
> Poverty rate: 30.5%
> Nov. unemployment: 5.6%
The Bronx is home to some 1.4 million people, or 17% of the population of New York City. The quality of life in the Bronx declined drastically in the 1970s, when New York City was on the verge of bankruptcy and there was a wave of destructive arson in the borough. The population of the Bronx fell by more than 300,000 residents in the 1970s, and has yet to fully recover. While various revitalization projects have stimulated economic activity in the borough since the late 1980s, the Bronx is still the poorest county in New York state. The typical Bronx household earns just $35,302 a year, less than half the $75,513 median household income in the adjacent borough of Manhattan and less than the $55,322 U.S. median. Some 30.5% of residents in the Bronx live in poverty, also the largest share in the state.
33. Scotland County, North Carolina
> County median household income: $30,013
> State median household income: $48,256
> Poverty rate: 31.5%
> Nov. unemployment: 7.9%
The typical household in Scotland County earns only $30,013 a year, the lowest median income of any county in North Carolina. The county’s low incomes are underscored by a 31.5% poverty rate, the highest of any county in the state.
Like many other counties on this list, Scotland County’s economy is struggling. Some 7.9% of workers in the county are out of a job, the second highest unemployment rate in the state and nearly double the 4.1% U.S. unemployment rate.

34. Rolette County, North Dakota
> County median household income: $37,313
> State median household income: $59,114
> Poverty rate: 31.6%
> Nov. unemployment: 7.7%
Rolette County is a small county of approximately 14,600 residents located on the U.S.-Canada border. The county largely consists of members of the Turtle Mountain Band of Chippewa Indians, who live on the Turtle Mountain Indian Reservation in middle of the county. With a median household income of just $37,313 a year, Rolette is the poorest county in North Dakota.
While North Dakota has one of the lowest unemployment rates of any state, some 7.7% of the Rolette County workforce is unemployed — the largest share in the state and among the highest unemployment rates of any county nationwide. Additionally, 31.6% of county residents live in poverty, the largest share in North Dakota and more than double the 15.1% national poverty rate.
[in-text-ad-2]

35. Athens County, Ohio
> County median household income: $34,221
> State median household income: $50,674
> Poverty rate: 31.2%
> Nov. unemployment: 4.6%
With the lowest median income in Ohio, Athens is also the only county in the state with a poverty rate above 30%. Currently, 4.6% of the county’s labor force is out of a job, a higher unemployment rate than the 4.2% state and 4.1% U.S. rates. While the county has greater room for improvement, unemployment may get worse before it gets better. State officials announced a decision earlier this year to close Athens County prison by the end of March. Many in the county, including union leaders representing prison guards, are critical of the move, claiming the closure will result in job losses the county is not prepared to handle.
36. Choctaw County, Oklahoma
> County median household income: $30,870
> State median household income: $48,038
> Poverty rate: 28.5%
> Nov. unemployment: 5.5%
While Choctaw County was a major agricultural producer and commercial center in the early 20th century, today it is the poorest county in Oklahoma. The county experienced economic and population decline from 1920 to 1970, and today it is home to 15,501 residents — less than half its peak of 32,144 in 1920. The typical household earns just $30,870 a year, far less than the state and national median household incomes of $48,038 and $55,322, respectively. Some 28.5% of the Choctaw County population lives in poverty, and 5.5% of the workforce is unemployed, each some of the largest shares in Oklahoma.
[in-text-ad]
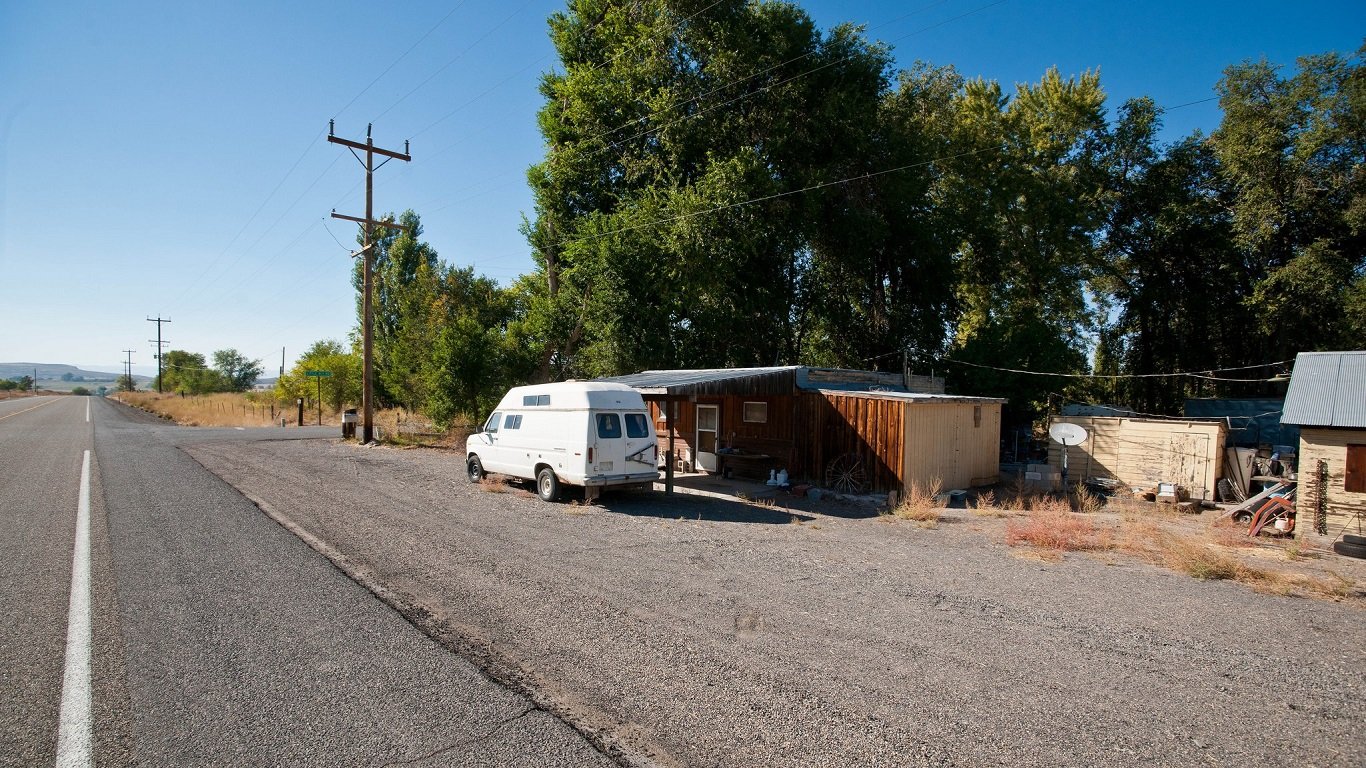
37. Malheur County, Oregon
> County median household income: $34,720
> State median household income: $53,270
> Poverty rate: 24.8%
> Nov. unemployment: 3.9%
Malheur County, located in the southeast corner of Oregon and sharing a border with both Idaho and Nevada, is the poorest county in the state. The typical household earns only $34,720 a year, nearly $19,000 less than the median income across Oregon.
The county is one of the least densely populated in the state and the country. There are an average of only three people per square mile, a fraction of the population densities statewide and nationwide of 40 people per square mile and 87 people per square mile, respectively. Some 94% of Malheur County is rangeland, two-thirds of which is federally managed.
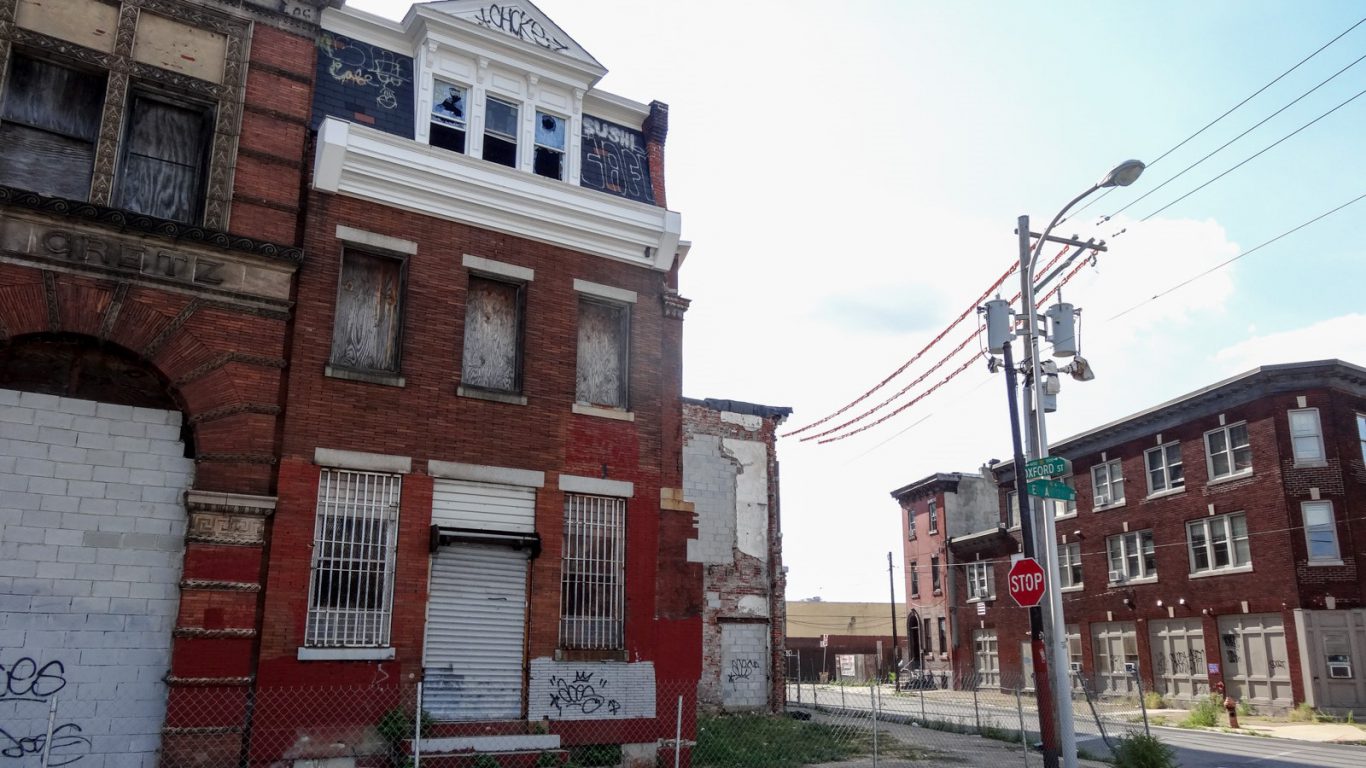
38. Philadelphia County, Pennsylvania
> County median household income: $39,770
> State median household income: $54,895
> Poverty rate: 25.9%
> Nov. unemployment: 5.7%
Philadelphia County is coterminous with the city of Philadelphia, the largest city in Pennsylvania and one of the largest in the United States. Philadelphia has struggled with many of the problems that have plagued large cities since the mid-20th century, such as the decline of manufacturing and flight of the middle class to the suburbs. While the city’s population has increased in recent years and is now home to 1.6 million people, it has yet to return to its 1950 peak of 2.1 million.
The typical household in Philadelphia earns just $39,770 a year, far less than both the state and national median household incomes of $54,895 and $55,322, respectively. While the poorest counties often have the lowest college attainment rates, some 26.3% of Philadelphia adults have a bachelor’s degree — more than a majority of counties in the state.

39. Providence County, Rhode Island
> County median household income: $50,637
> State median household income: $58,387
> Poverty rate: 17.2%
> Nov. unemployment: 4.6%
Home to the city by the same name, Providence County is the most populous county in Rhode Island. It is also the poorest. The typical household in Providence County earns $50,637 a year, about $8,000 less than the typical Rhode Island household and about $22,500 less than the median income in neighboring Bristol County.
Providence County is also home to a relatively large share of residents facing serious financial hardship. Some 17.2% of the county’s population live in poverty, a higher poverty rate than the state rate of 13.8%.
[in-text-ad-2]
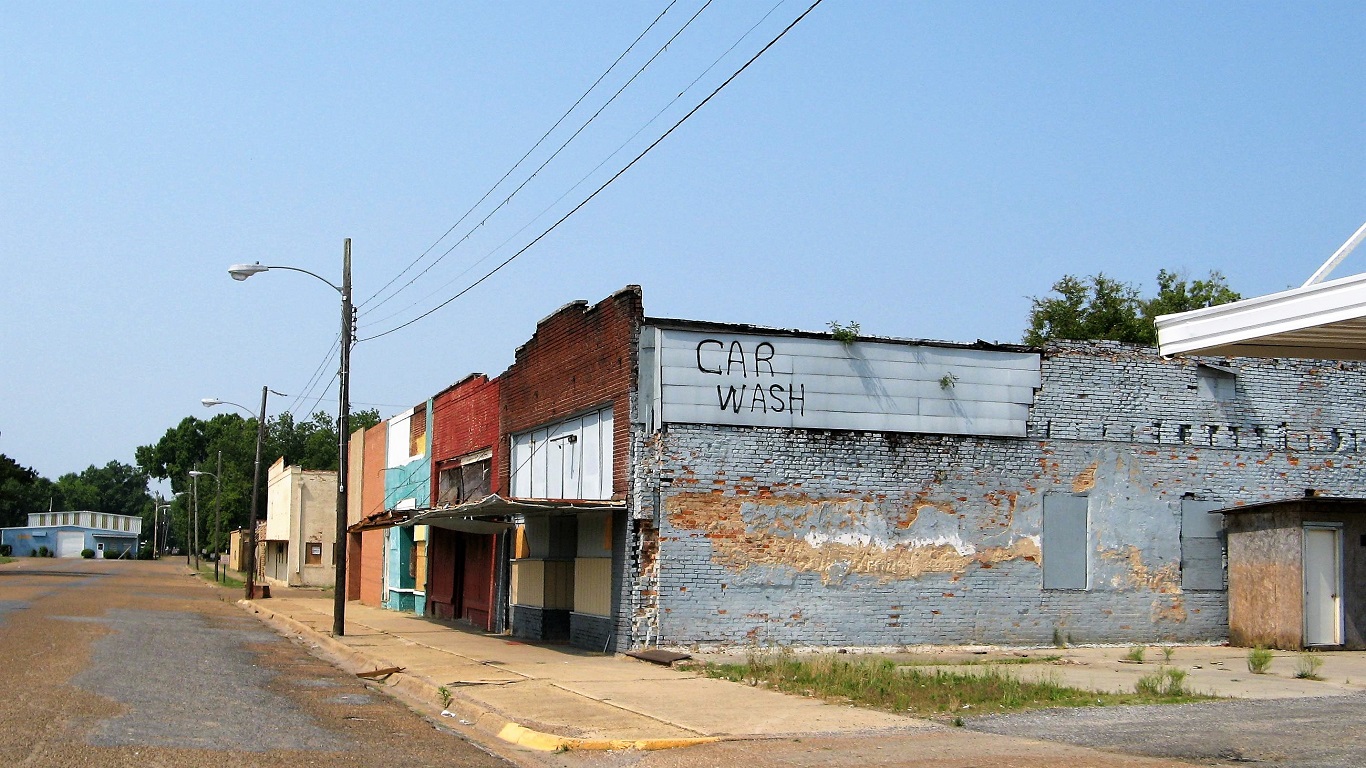
40. Williamsburg County, South Carolina
> County median household income: $28,494
> State median household income: $46,898
> Poverty rate: 29.3%
> Nov. unemployment: 5.6%
While Williamsburg County was once a major agricultural center and economic powerhouse, today it is the poorest county in South Carolina. The county suffered from economic and population decline in the second half of the 20th century, as jobs in agriculture and manufacturing dwindled throughout the South. The county’s population sits at 32,816 today, far less than its peak of 43,807 in 1950. The typical Williamsburg County household earns just $28,494 a year, far less than the state and national median household incomes of $46,898 and $55,322, respectively. An estimated 29.3% of Williamsburg County residents live in poverty, the second largest share in the state and nearly twice the national poverty rate of 15.1%.
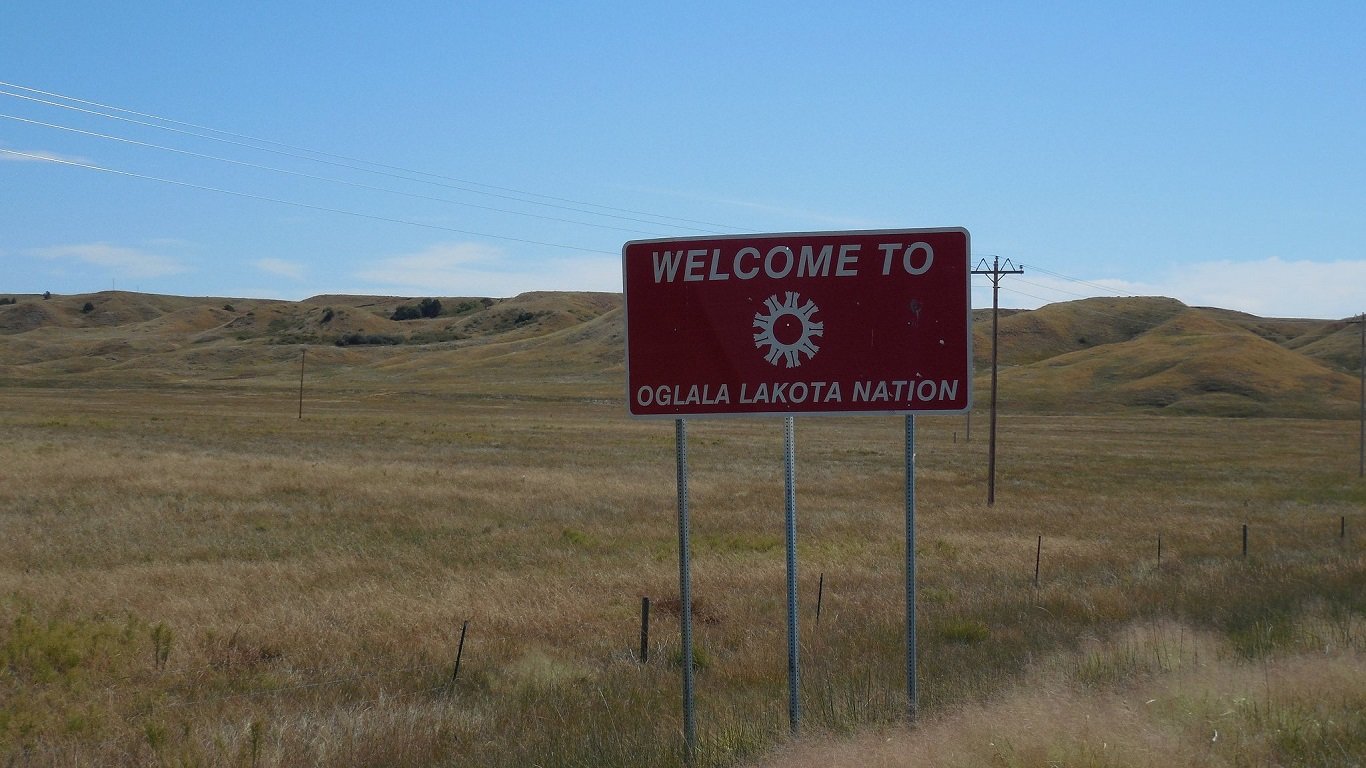
41. Oglala Lakota County, South Dakota
> County median household income: $26,330
> State median household income: $52,078
> Poverty rate: 53.9%
> Nov. unemployment: 12.6%
Formerly called Shannon County, Oglala Lakota County, South Dakota is contained entirely within the borders of the Pine Ridge Indian Reservation — the site of the Wounded Knee Massacre in 1890. For a myriad of historical and persisting reasons, Indian reservations often report far worse than typical socioeconomic conditions, and Oglala Lakota is no exception. The typical household in the county earns only $26,300 a year, or nearly half the median household income across South Dakota. Underscoring low incomes in the region, some 53.9% of county residents live below the poverty line, the highest poverty rate of any county in the state and the country as a whole.
[in-text-ad]

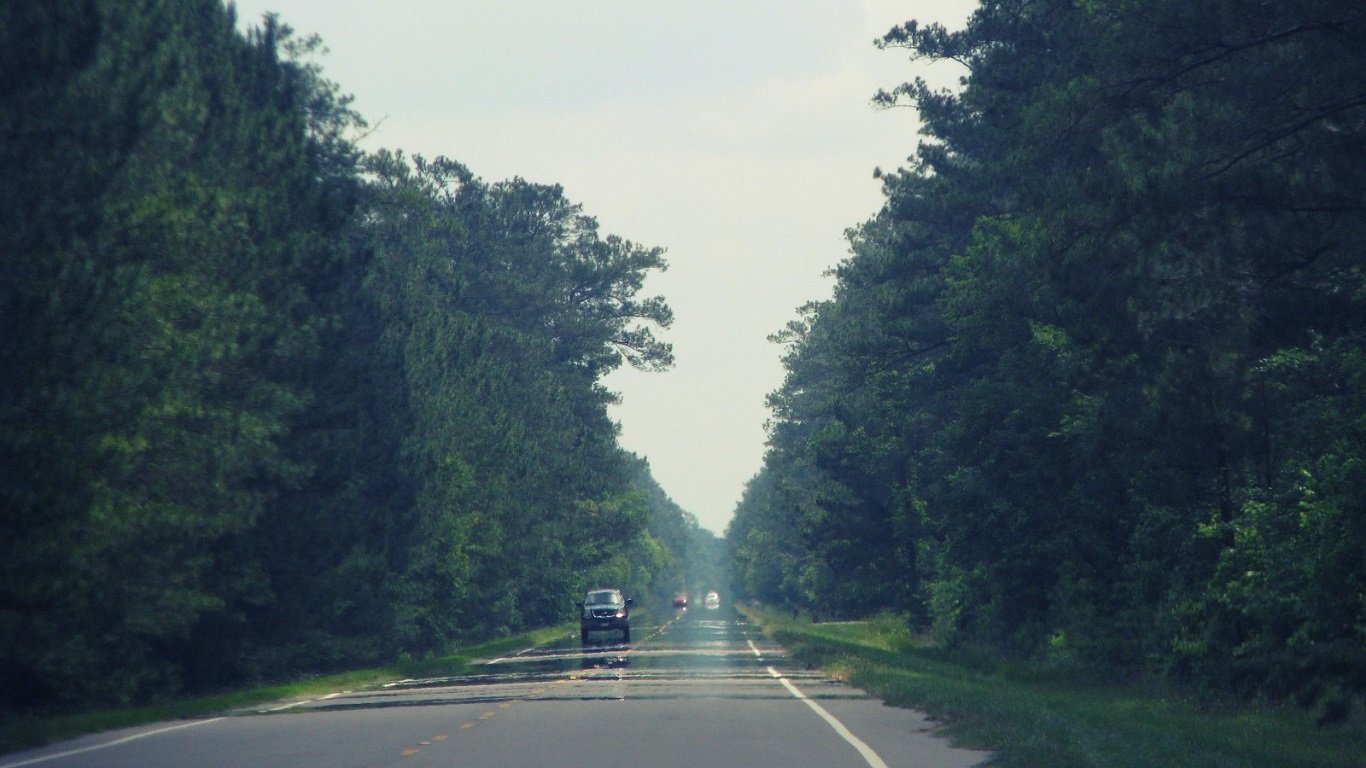
42. Grundy County, Tennessee
> County median household income: $28,467
> State median household income: $46,574
> Poverty rate: 28.0%
> Nov. unemployment: 4.6%
Grundy County, located about 40 miles northwest of Chattanooga, is the poorest county in Tennessee. Grundy is also the only county in the state with a population of at least 10,000 in which the typical household earns less than $30,000 a year.
Adults with a bachelor’s degree have far greater earning potential than those with only a high school education, and a relatively small 11.0% of Grundy County adults have graduated from a four-year college. In comparison, 25.4% of adults in Tennessee and 30.3% of adults nationwide have at least a bachelor’s degree.

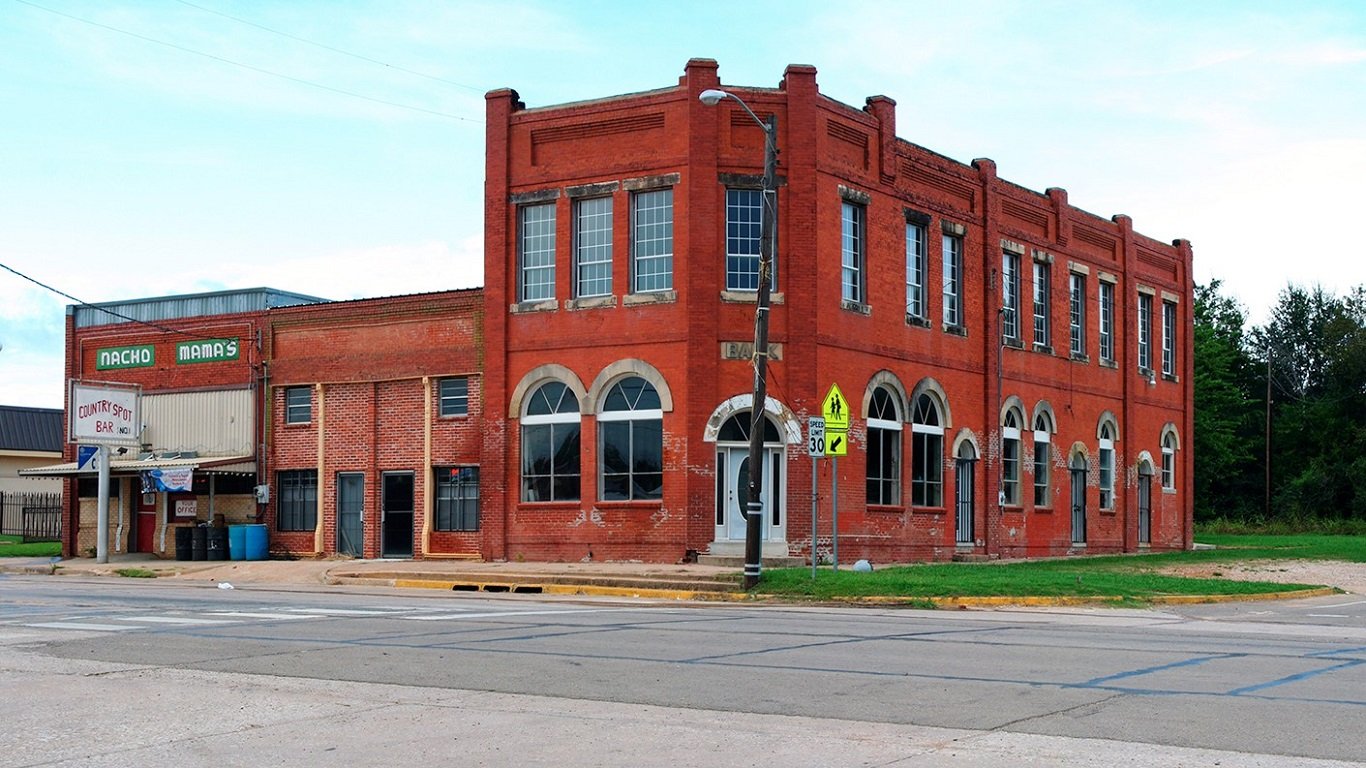
43. Zavala County, Texas
> County median household income: $26,639
> State median household income: $54,727
> Poverty rate: 35.8%
> Nov. unemployment: 9.1%
Situated between the U.S. Mexican border and San Antonio, the southern Texas County of Zavala is the poorest in the state and one of the poorest in the country. The typical household in the county earns only $26,639 a year, less than half the median household income across the state of $54,727. Additionally, some 35.8% of county residents live below the poverty line, more than double the 16.7% statewide poverty rate.
As is the case with many counties on this list, Zavala’s economy appears to be struggling. As of November 2017, some 9.1% of the county labor force was out of work, well more than double the 3.7% unemployment rate across Texas.

44. San Juan County, Utah
> County median household income: $41,108
> State median household income: $62,518
> Poverty rate: 27.6%
> Nov. unemployment: 5.6%
A relatively wealthy state, Utah’s median household income of $62,518 is about $7,000 higher than the national median income. However, not all parts of the state are as prosperous. In San Juan County, located in the southeastern corner of the state, the typical household earns only $41,108 a year, about $21,000 less than the median income across the state. The county’s 27.6% poverty rate is also the highest in the state.
As is the case in many counties on this list, joblessness is a considerable hurdle to economic prosperity in San Juan County. Some 5.6% of the workers in the county are out of a job, more than double Utah’s 2.7% unemployment rate.
[in-text-ad-2]

45. Orleans County, Vermont
> County median household income: $43,959
> State median household income: $56,104
> Poverty rate: 14.6%
> Nov. unemployment: 4.0%
Orleans County, situated in northern Vermont along the Canadian border, is the poorest county in the state. The typical household in Orleans earns $43,959 a year, about $12,000 less than the income the typical Vermont household earns.
With a 4.0% unemployment rate, joblessness is a bigger problem in Orleans than it is in any other county in Vermont with at least 10,000 residents. Still, the county fares better than the nation as a whole, as 4.1% of the U.S. workforce is out of a job.
46. Buchanan County, Virginia
> County median household income: $30,335
> State median household income: $66,149
> Poverty rate: 23.9%
> Nov. unemployment: 7.0%
Buchanan County, located in western Virginia, is the poorest county in the Old Dominion State. Buchanan is one of only a handful of counties in Virginia in which fewer than 1 in 10 adults have at least bachelor’s degree. In comparison, about 37% of adults across the state have a bachelor’s degree or higher. Populations with larger shares of college educated adults tend to have higher incomes and vice versa. The typical Buchanan County household earns only $30,335 a year, less than half the $66,149 the typical household in the state earns annually.
[in-text-ad]

47. Pacific County, Washington
> County median household income: $38,387
> State median household income: $62,848
> Poverty rate: 18.7%
> Nov. unemployment: 6.5%
Named for the ocean at its western border, Pacific County is situated in the southwestern corner of Washington state. One of only two counties in Washington with a median household income below $40,000 a year, it is also the poorest county in the state.
The county’s low incomes may be partially attributable to bad economic times. As of November 2017, some 6.5% of the county’s labor force was out of a job — well above the unemployment rates statewide of 4.5% and nationwide of 4.1%. Recent developments in Washington D.C. could have a meaningful impact on the county’s economy in coming years. The county’s coastline is one of several the Trump administration plans to open for oil drilling and exploration — which could negatively impact fisherman and crabbers living in Pacific County.

48. McDowell County, West Virginia
> County median household income: $25,206
> State median household income: $42,644
> Poverty rate: 37.6%
> Nov. unemployment: 8.4%
The poorest county in one of the poorest states, McDowell County, West Virginia is one of the most economically depressed regions in the United States. Declining with the coal industry, the county’s population, which peaked at nearly 100,000 in 1950, today sits at just 20,273 people. While some former coal towns have recovered from the loss of their primary industries, those with low educational attainment are less likely to adapt to other industries such as information and services. Only 5.2% of the adult population in McDowell County has a bachelor’s degree or higher, compared to 19.6% of adults in West Virginia and 30.3% of adults in the United States.
The typical household in McDowell earns only $25,206 a year, less than half the median income among all U.S. households. Also, a staggering 37.6% of McDowell residents live below the poverty line, more than double the 15.1% U.S. poverty rate.

49. Rusk County, Wisconsin
> County median household income: $39,904
> State median household income: $54,610
> Poverty rate: 15.9%
> Nov. unemployment: 3.4%
Rusk is the only county in Wisconsin with over 10,000 residents where the typical household earns less than $40,000 a year. Incomes are low in the county despite relatively strong labor market. Only 3.4% of the county’s labor force is unemployed — while slightly higher than the state’s unemployment rate of 2.7%, it is far better than the U.S. unemployment rate of 4.1%.
The county’s relatively low educational attainment rates imply employment in relatively low skilled jobs in the area, which largely explains the county’s low incomes. Higher paying jobs typically require a college education, and only 14.8% of adults in Rusk County have a bachelor’s degree or higher, well below the comparable 28.4% of adults across the state.
[in-text-ad-2]

50. Albany County, Wyoming
> County median household income: $43,043
> State median household income: $59,143
> Poverty rate: 25.5%
> Nov. unemployment: 2.8%
Named after the capital of New York state, Albany County, Wyoming borders Colorado. Laramie, its most populous city, is the county seat. The typical household in the county earns only $43,043 a year, about $16,000 less than the median income across the state. It is also the only county in the state where more than 1 in 4 residents live in poverty.
While most counties on this list have relatively small shares of college educated adults, Albany is a notable exception. Some 47.9% of adults in the county have a bachelor’s degree or higher, well above the 26.0% share of adults across Wyoming with similar education. The county’s higher educational attainment is likely due in part to the presence of the University of Wyoming, the largest higher education institution in the state.
Detailed Findings & Methodology
Many counties on this list were once prosperous areas that have yet to recover from the loss of major industries. Counties in Rust Belt states such as Pennsylvania, West Virginia, Ohio, Indiana, and Michigan are still struggling from the loss of the coal and steel industries in the mid-20th century. Increased automation, the flight of the middle class to the outer suburbs, and other factors contributed to job loss and population decline throughout the Midwest, Great Lakes region, and much of Appalachia. While some counties managed to adapt to the changing economy, many were left with high unemployment, poverty, and populations half the size of their mid-century peak.
Similarly, many agriculture-dependent counties in the South, particularly in the Mississippi Delta, have yet to recover from the mechanization of farm labor and outbound migration of African Americans to the West and Northeast during the Great Migration of the second half of the 20th century.
One of the main determinants of income is education. A college degree can increase the likelihood of an individual securing a high-paying job. Also, higher educational attainment rate can attract advanced business and industry to a region. In 46 of the 50 states, the poorest county has a smaller share of adults with a bachelor’s degree than the state as a whole.
A county’s job market can also have a major effect on area incomes. In an area with higher unemployment, not only does the area’s median income fall due to the relatively large share of residents without a steady stream of income, but also the large number of unemployed workers can reduce overall economic activity and lead to lower earnings among the employed. In 45 of the 50 states, the poorest county has a higher unemployment rate than the state.
To determine the poorest county in every state, 24/7 Wall St. reviewed data on median household income for the 2,436 U.S. counties with at least 10,000 residents with data from the U.S. Census Bureau’s American Community Survey. Data on poverty, educational attainment, homeownership, median home value, and college enrollment also came from the ACS. All ACS data are five-year averages for 2012-2016. Data on population density came from the Census. Data on unemployment came from the Bureau of Labor Statistics and are seasonally adjusted for November 2017. All data is for the most recent period available.
Ever wanted an extra set of eyes on an investment you’re considering? Now you can speak with up to 3 financial experts in your area for FREE. By simply
clicking here you can begin to match with financial professionals who can help guide you through the financial decisions you’re making. And the best part? The first conversation with them is free.
Click here to match with up to 3 financial pros who would be excited to help you make financial decisions.
Thank you for reading! Have some feedback for us?
Contact the 24/7 Wall St. editorial team.


 24/7 Wall St.
 24/7 Wall St.
 24/7 Wall St.
 24/7 Wall St.
 24/7 Wall St.