Source: Jacob Ammentorp Lund / iStock
But so has the obesity rate. With more than a third of American adults considered obese and more than half overweight, the rising interest in getting exercise may not be surprising.
Approximately 22% of adults fail to get any exercise whatsoever outside of work. In some places, that percentage is much lower. In these cities, residents take advantage of greater access to gyms, recreation centers, and parks.
To identify the cities getting the most exercise, 24/7 Wall St. created an index of two measures — the share of adults in a metro area who are physically active during their leisure time and the share of the population who has access to areas for physical activities outside of their homes.
The most physically active metropolitan areas are clustered in certain regions. Of the 50 cities getting the most exercise, 12 are in California, four are in Colorado, and another four are in Washington state. While Western states are well-represented in cities where the population is getting healthy amounts of exercise, residents of Southern states by contrast are typically less active.
Click here to see the cities getting the most exercise.
Any amount of exercise has health benefits, and not getting any exercise at all can have serious consequences. Obesity rates in areas with active adults are notably lower than in areas with less active adults. The obesity rate is higher than the national rate of approximately 28% in only five of the 50 cities on this list.
Residents in cities that get the most exercise also tend to feel healthier. Of the 50 cities getting the most exercise, 36 have a lower share of adults reporting being in poor or fair health than the nationwide share of 15%. The opposite tends to be true in cities getting less exercise.
To determine the cities getting the most exercise, 24/7 Wall St. created an index to rank the 381 metro areas by both the share of adults who are physically active as well as the accessibility to areas of exercise. Both measures come from the most recent 2017 dataset collected by County Health Rankings & Roadmaps, a collaboration between the Robert Wood Johnson Foundation and the University of Wisconsin Population Health Institute. Obesity rates — the share of residents who report a body mass index of 30 or greater — as well as the percentage of adults who report fair or poor health also come from County Health Rankings.
The 2008 federal physical activity guidelines (the latest available) recommend 2 hours 30 minutes per week of moderate intensity aerobic physical activity, or 1 hour 15 minutes of vigorous aerobic physical activity, or a combination of these exercise forms. In addition to aerobic exercise, the federal government recommends muscle-strengthening activities that are moderate to high intensity at least two days per week.
Source: Thinkstock
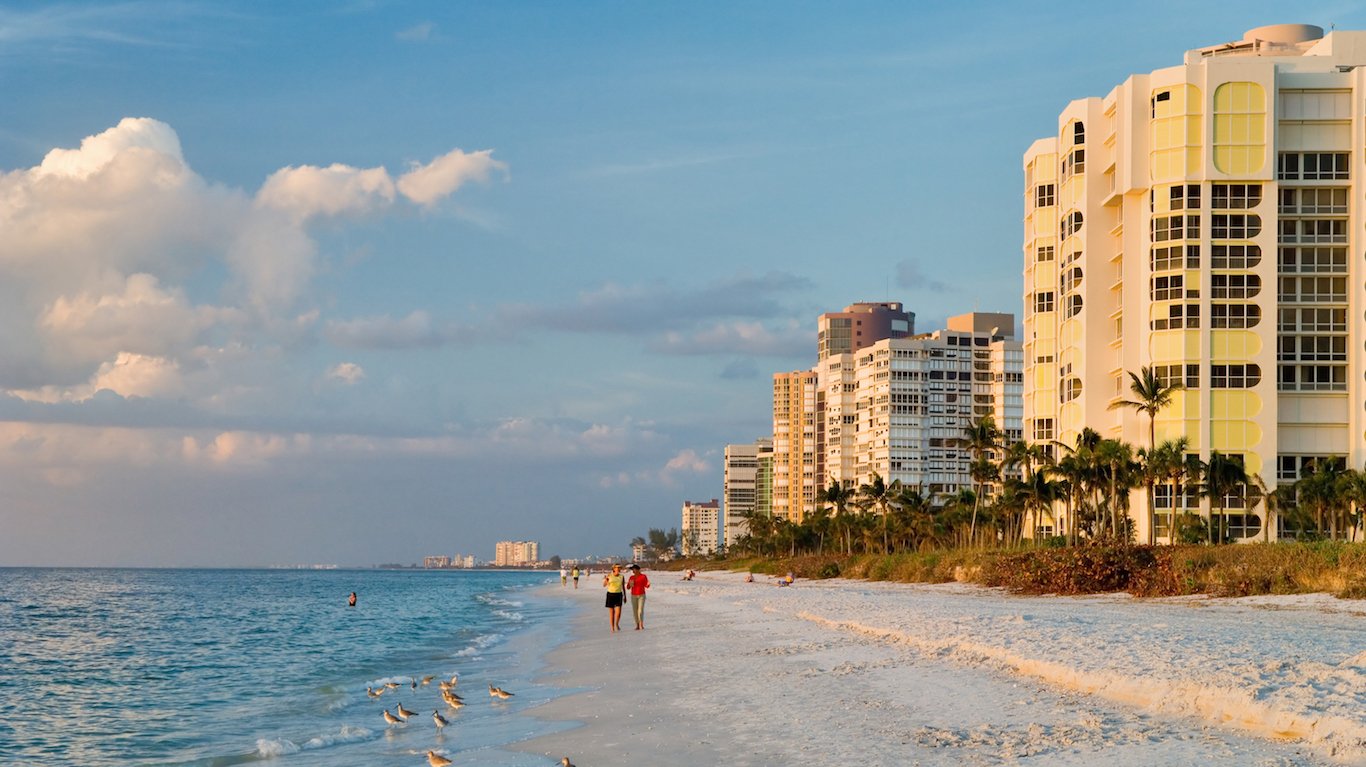
50. Naples-Immokalee-Marco Island, Florida
> Population: 365,136
> Physically active adults: 81.5% (top 25%)
> Population with access to exercise locations: 91.3% (top 25%)
> Obesity rate: 19.5% (bottom 10%)
> Adults in fair or poor health: 15.1%
[in-text-ad]
Source: vewfinder / Shutterstock.com
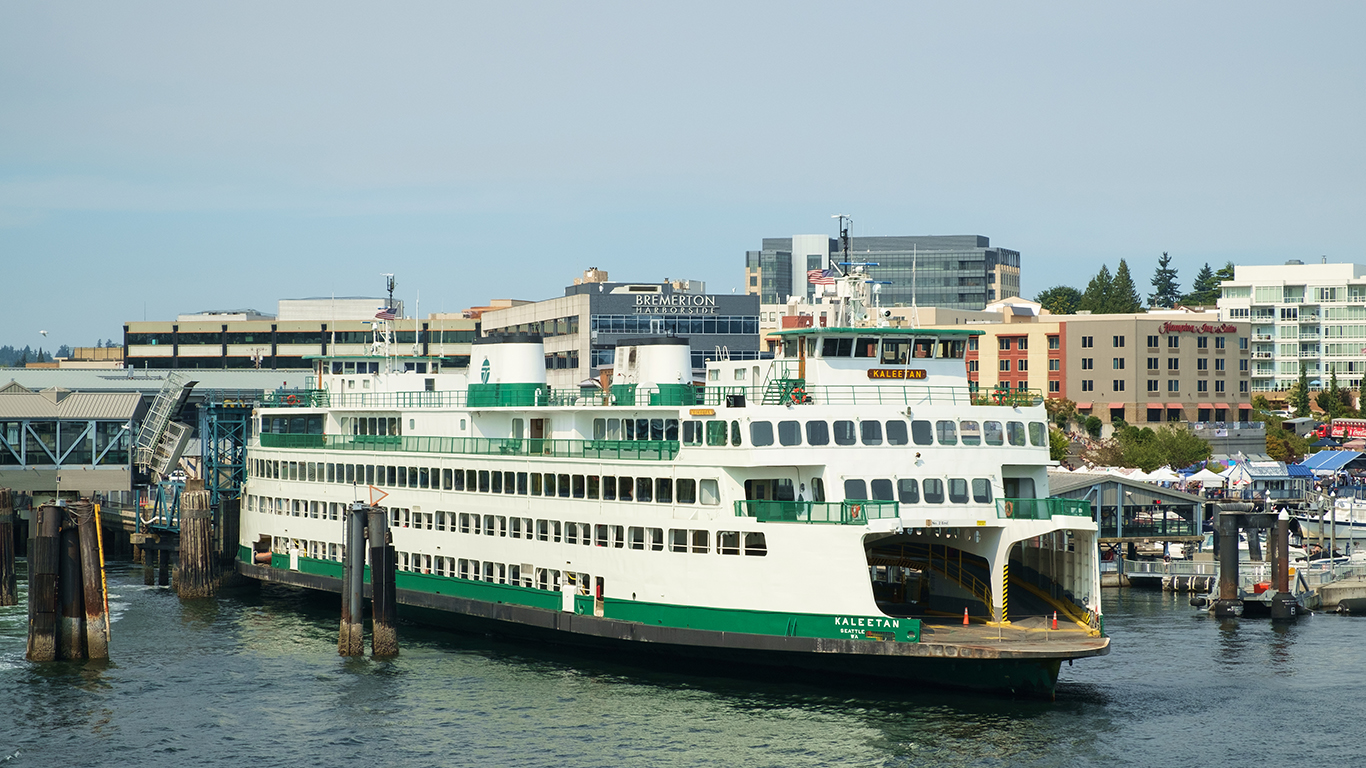
49. Bremerton-Silverdale, Washington
> Population: 264,811
> Physically active adults: 82.1% (top 25%)
> Population with access to exercise locations: 90.3% (top 25%)
> Obesity rate: 29.6%
> Adults in fair or poor health: 11.9% (bottom 10%)
Source: csfotoimages / iStock
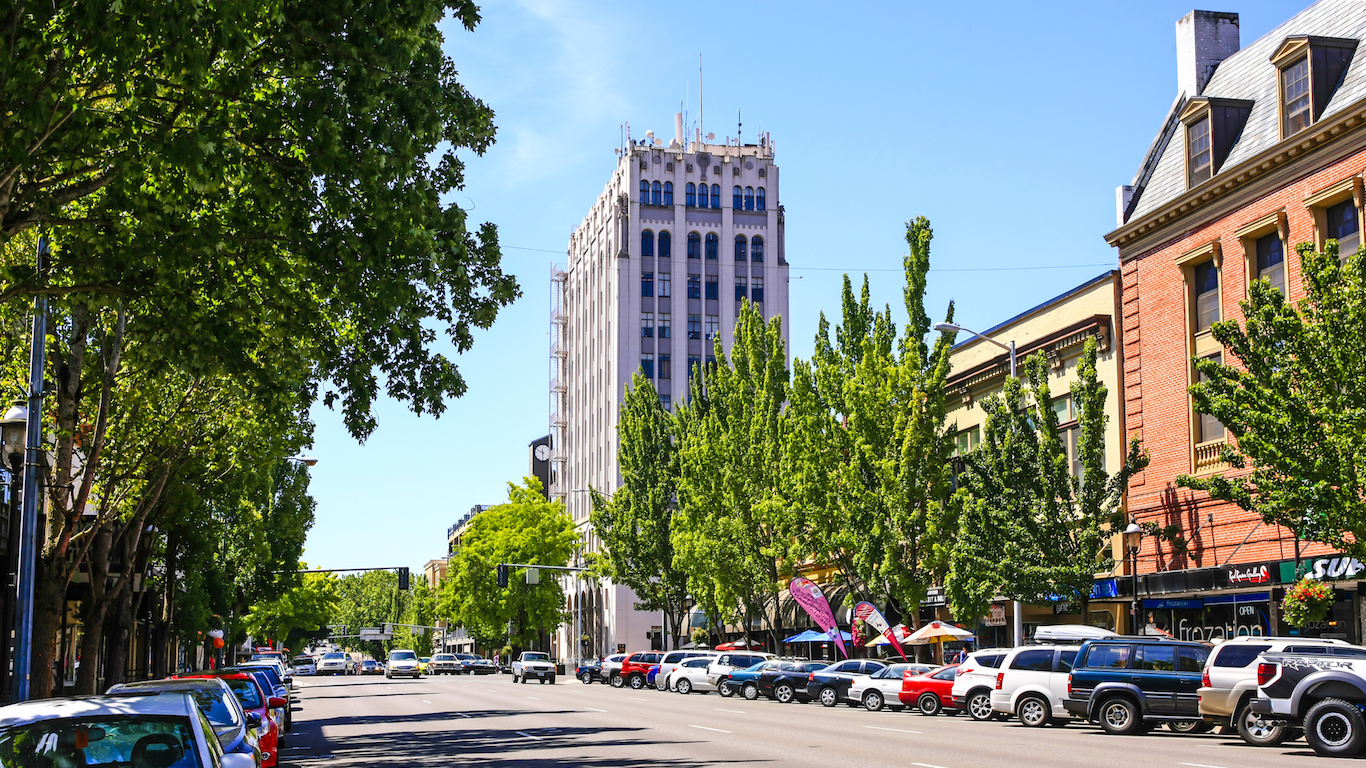
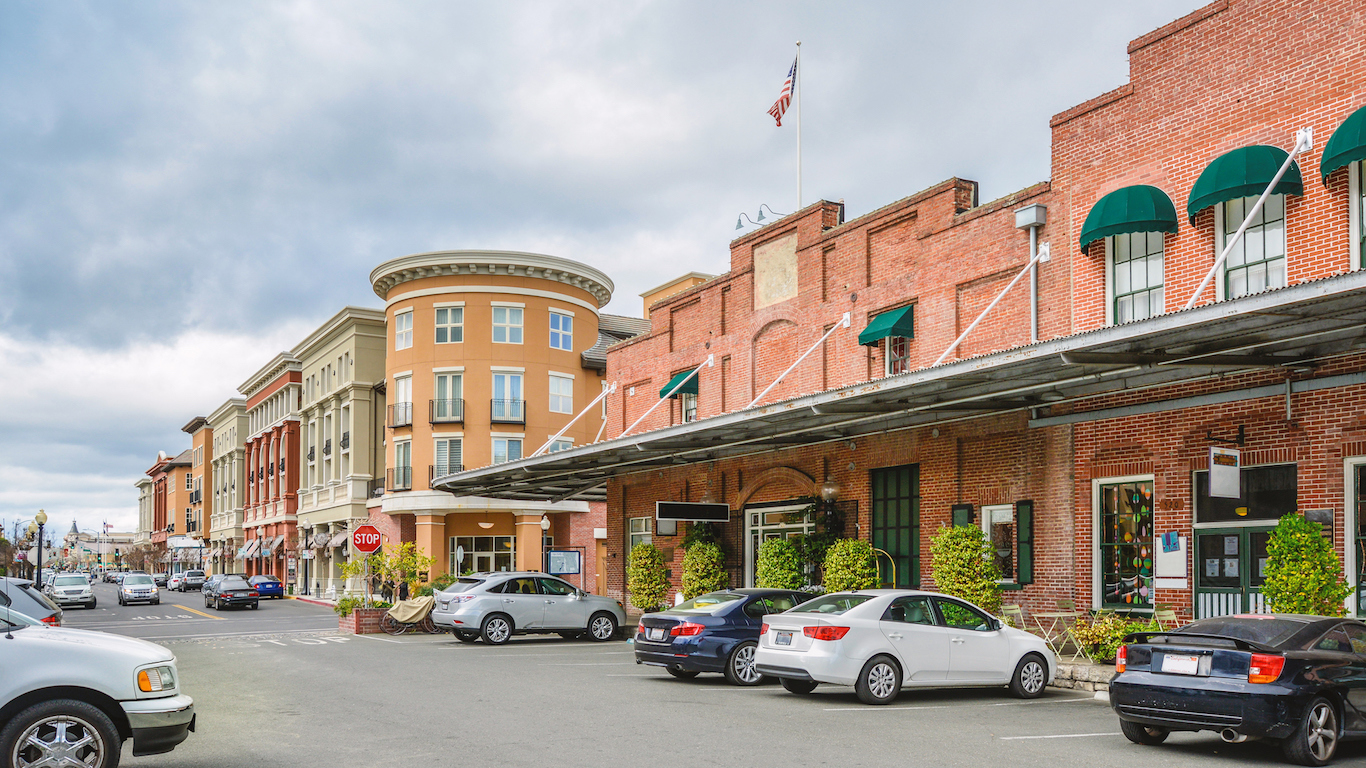
48. Salem, Oregon
> Population: 418,139
> Physically active adults: 84.3% (top 10%)
> Population with access to exercise locations: 84.9%
> Obesity rate: 34.2% (top 10%)
> Adults in fair or poor health: 15.2%
Source: Rauluminate / iStock
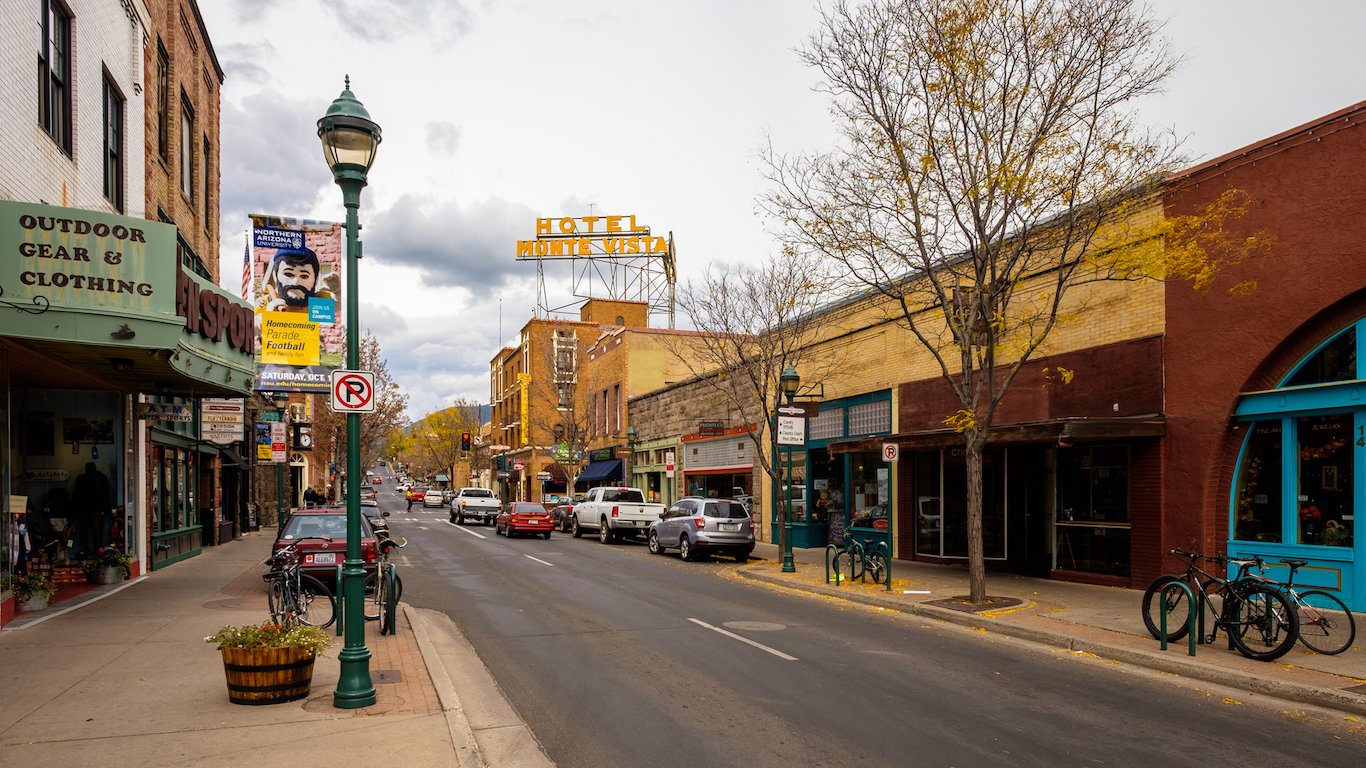
47. Flagstaff, Arizona
> Population: 140,908
> Physically active adults: 85.8% (top 10%)
> Population with access to exercise locations: 81.7%
> Obesity rate: 23.2% (bottom 10%)
> Adults in fair or poor health: 18.1%
[in-text-ad-2]

Source: Thinkstock
46. Boston-Cambridge-Newton, Massachusetts
> Population: 4,794,447
> Physically active adults: 80.3% (top 25%)
> Population with access to exercise locations: 94.9% (top 10%)
> Obesity rate: 23.5% (bottom 10%)
> Adults in fair or poor health: 12.4% (bottom 25%)
Source: Thinkstock
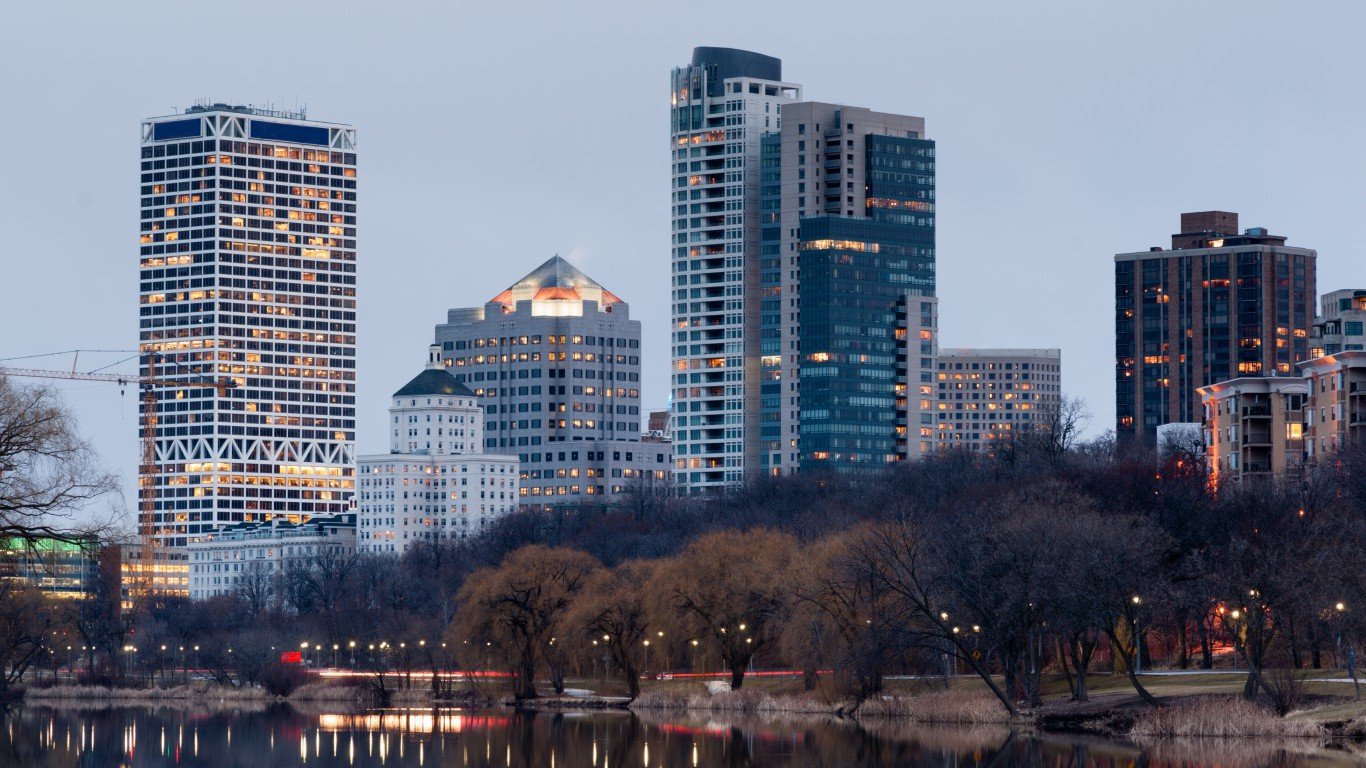
45. Milwaukee-Waukesha-West Allis, Wisconsin
> Population: 1,572,482
> Physically active adults: 80.1% (top 25%)
> Population with access to exercise locations: 95.8% (top 10%)
> Obesity rate: 30.9%
> Adults in fair or poor health: 14.7%
[in-text-ad]

Source: Thinkstock
44. Chicago-Naperville-Elgin, Illinois
> Population: 9,512,968
> Physically active adults: 79.7%
> Population with access to exercise locations: 96.7% (top 10%)
> Obesity rate: 26.5% (bottom 25%)
> Adults in fair or poor health: 16.1%
 24/7 Wall St.
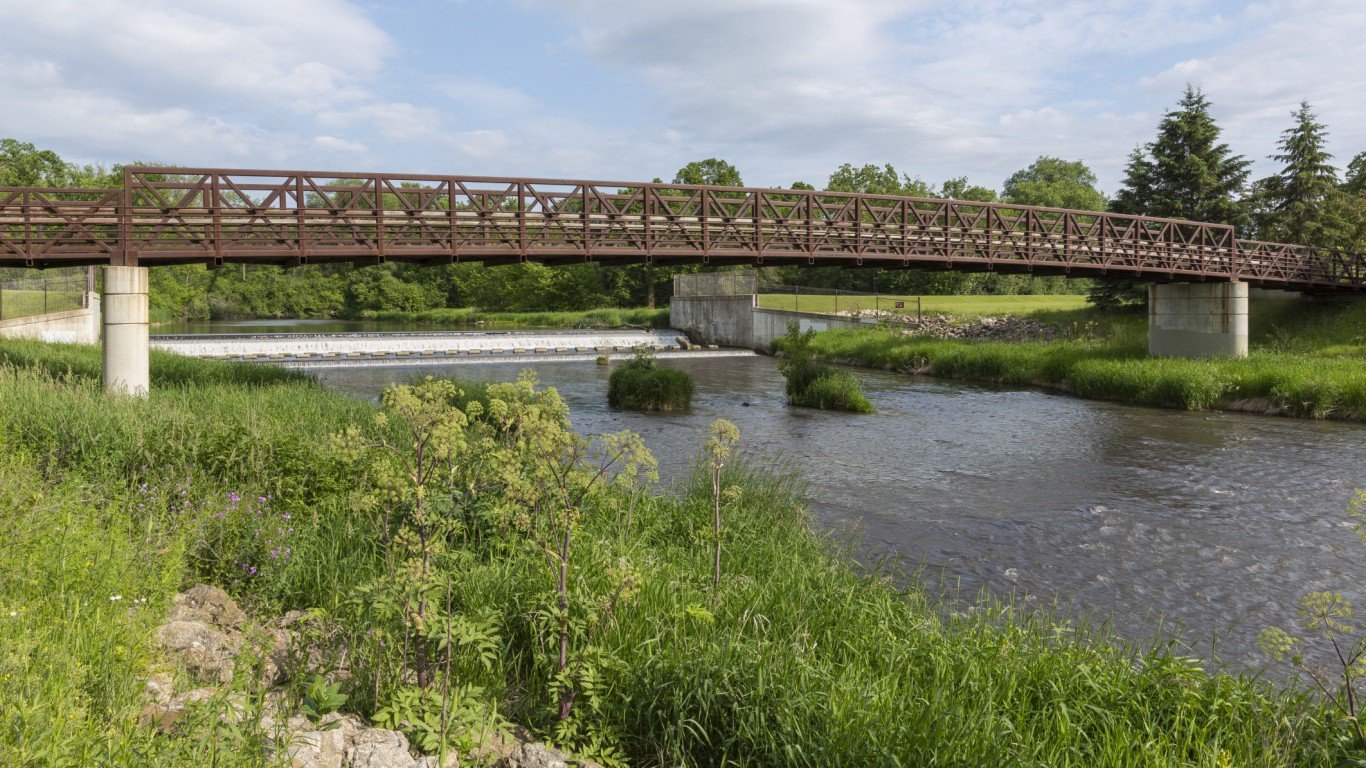
Source: Thinkstock
43. Rochester, Minnesota
> Population: 215,884
> Physically active adults: 81.7% (top 25%)
> Population with access to exercise locations: 92.1% (top 25%)
> Obesity rate: 26.1% (bottom 25%)
> Adults in fair or poor health: 10.4% (bottom 10%)

Source: Thinkstock
42. Madison, Wisconsin
> Population: 648,929
> Physically active adults: 83.4% (top 10%)
> Population with access to exercise locations: 88.6% (top 25%)
> Obesity rate: 25.4% (bottom 25%)
> Adults in fair or poor health: 11.5% (bottom 10%)
[in-text-ad-2]
Source: Razvan Orendovici / Flickr
41. State College, Pennsylvania
> Population: 161,464
> Physically active adults: 83.6% (top 10%)
> Population with access to exercise locations: 88.1% (top 25%)
> Obesity rate: 26.6%
> Adults in fair or poor health: 13.4% (bottom 25%)
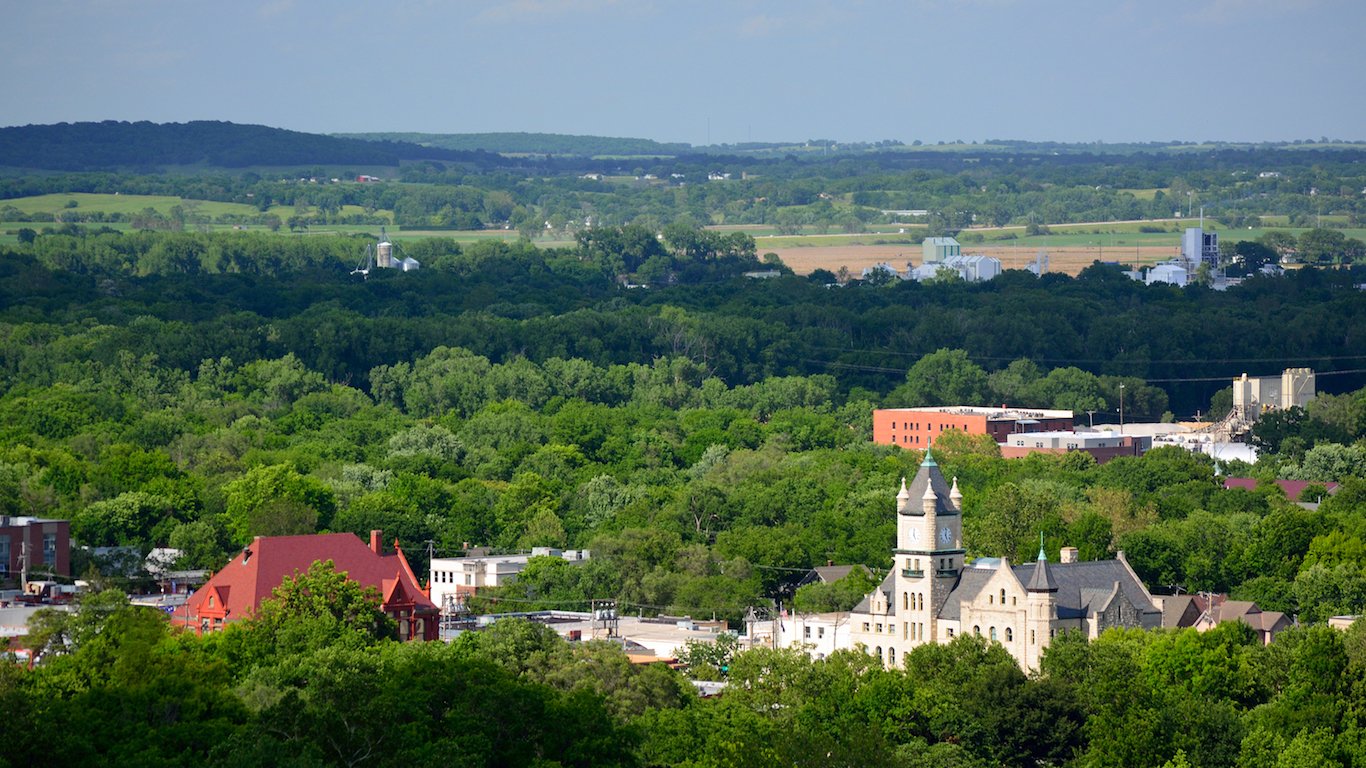
Source: Jeff Zehnder / Shutterstock.com
40. Lawrence, Kansas
> Population: 119,440
> Physically active adults: 82.3% (top 25%)
> Population with access to exercise locations: 91.3% (top 25%)
> Obesity rate: 24.2% (bottom 25%)
> Adults in fair or poor health: 11.8% (bottom 10%)
[in-text-ad]
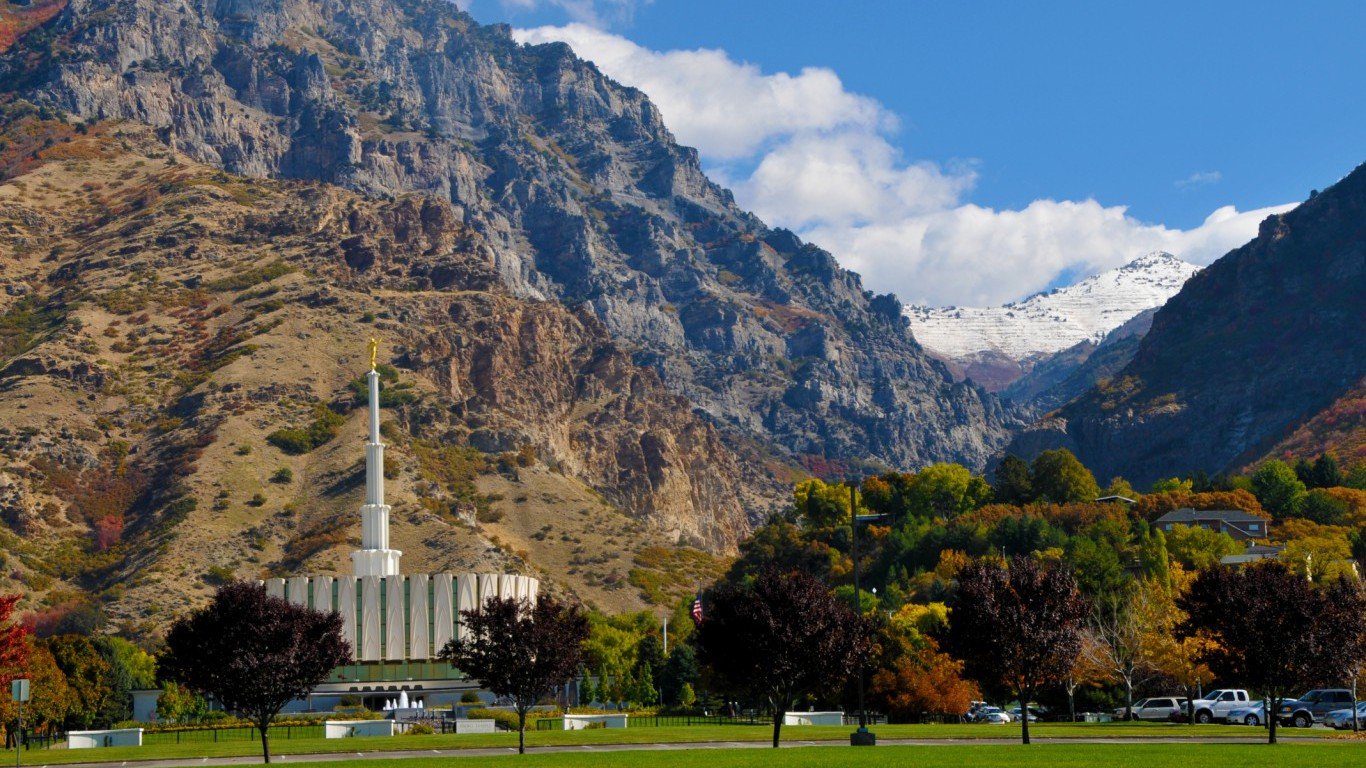
Source: Thinkstock
39. Provo-Orem, Utah
> Population: 602,543
> Physically active adults: 85.6% (top 10%)
> Population with access to exercise locations: 83.9%
> Obesity rate: 24.5% (bottom 25%)
> Adults in fair or poor health: 11.3% (bottom 10%)
 24/7 Wall St.
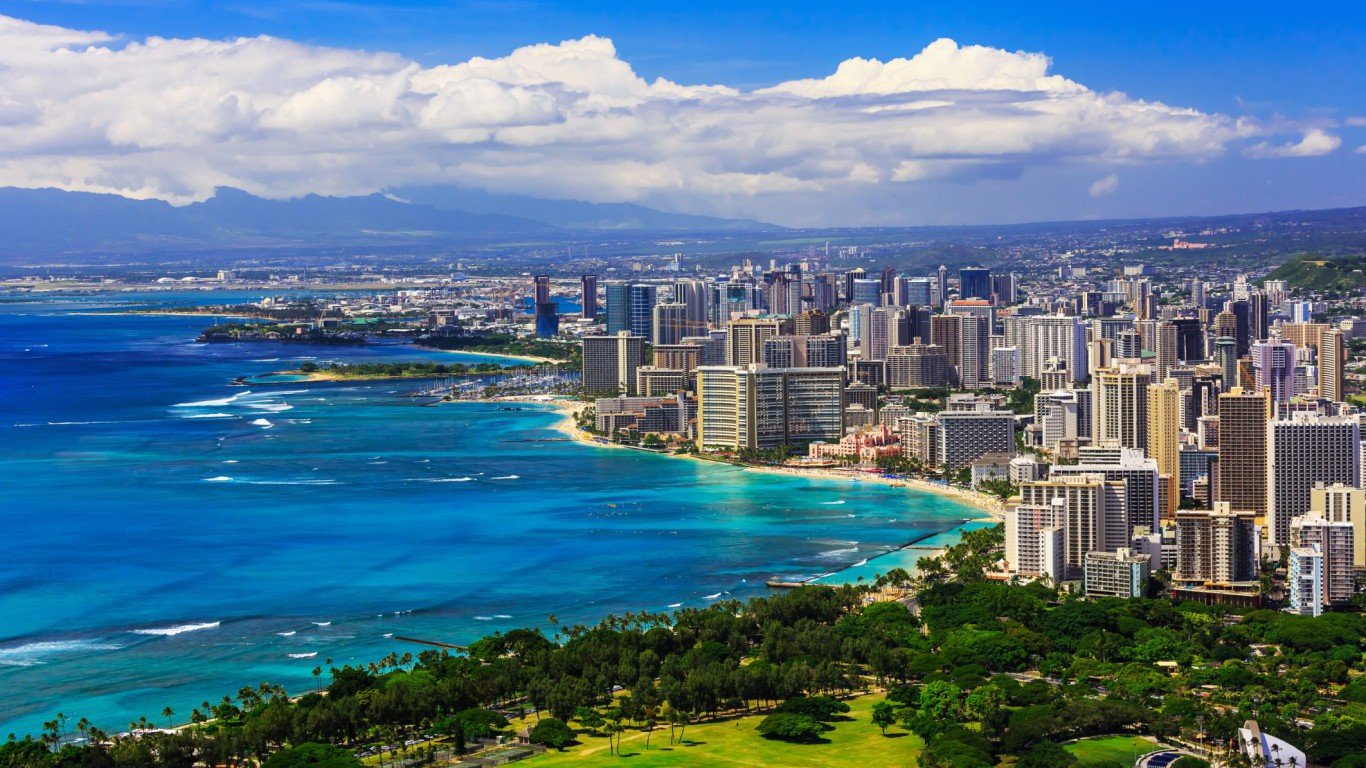
Source: Thinkstock
38. Urban Honolulu, Hawaii
> Population: 992,605
> Physically active adults: 81.3% (top 25%)
> Population with access to exercise locations: 94.6% (top 10%)
> Obesity rate: 22.3% (bottom 10%)
> Adults in fair or poor health: 12.5% (bottom 25%)
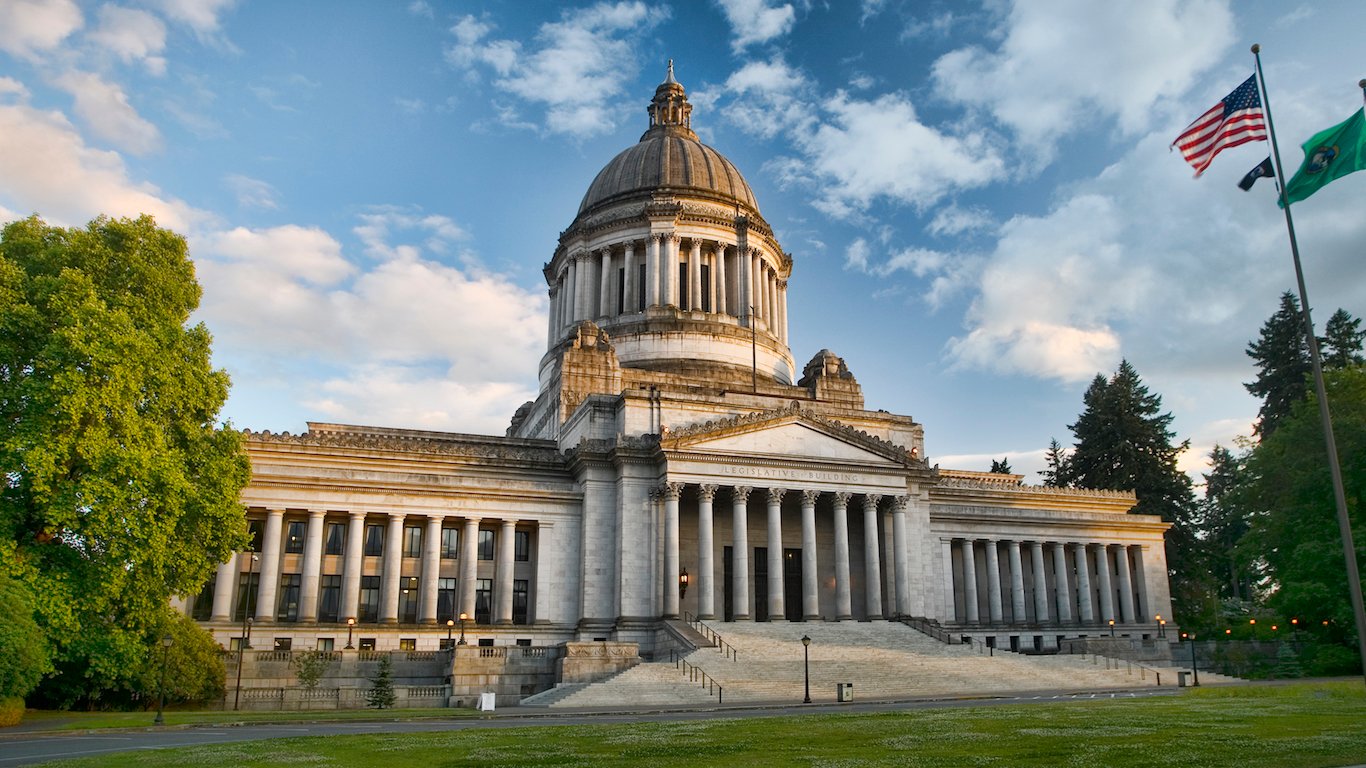
Source: Thinkstock
37. Olympia-Tumwater, Washington
> Population: 275,222
> Physically active adults: 83.4% (top 10%)
> Population with access to exercise locations: 89.5% (top 25%)
> Obesity rate: 28.1%
> Adults in fair or poor health: 13.0% (bottom 25%)
[in-text-ad-2]
Source: Nick Kelly / Faithlife Corporation / Wikimedia Commons
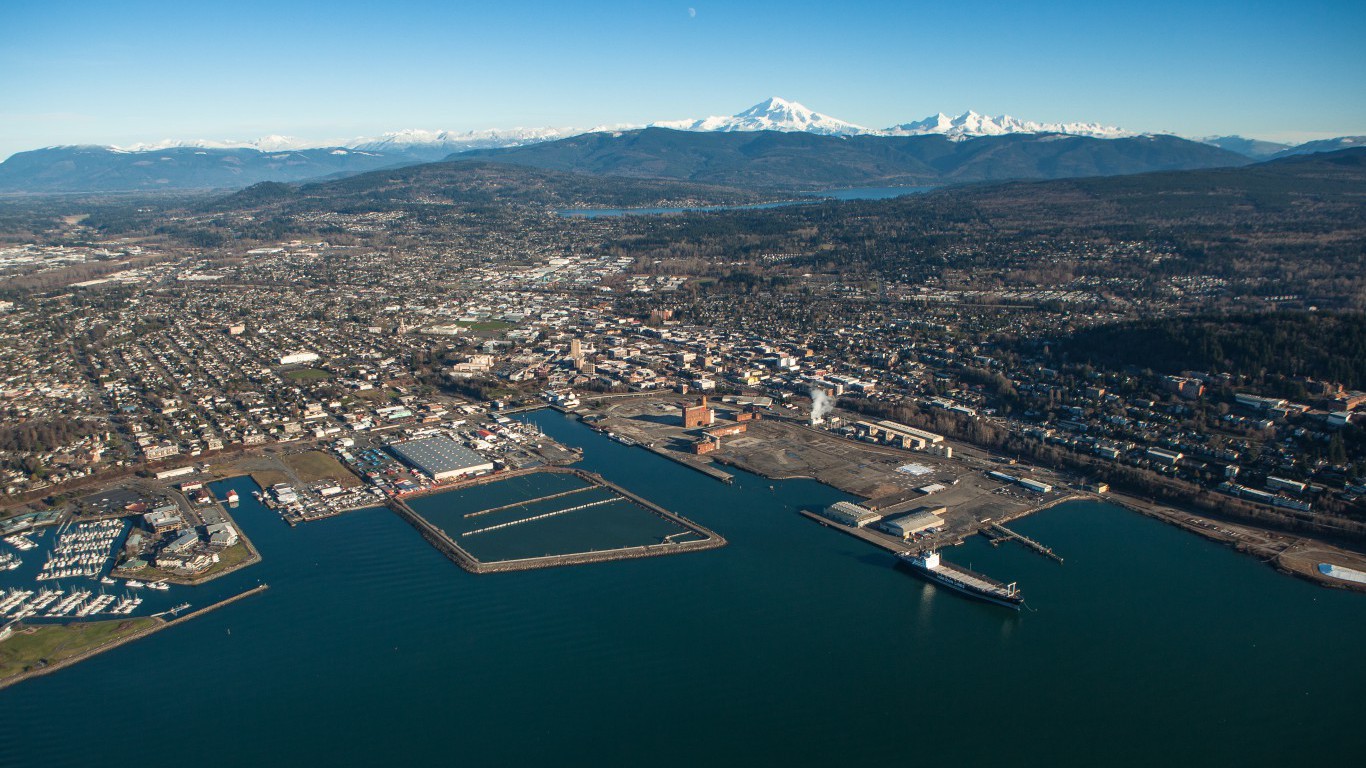
36. Bellingham, Washington
> Population: 216,800
> Physically active adults: 84.8% (top 10%)
> Population with access to exercise locations: 87.0%
> Obesity rate: 23.1% (bottom 10%)
> Adults in fair or poor health: 12.8% (bottom 25%)

Source: Jon Bilous / Shutterstock.com
35. Barnstable Town, Massachusetts
> Population: 214,276
> Physically active adults: 84.2% (top 10%)
> Population with access to exercise locations: 88.5% (top 25%)
> Obesity rate: 19.9% (bottom 10%)
> Adults in fair or poor health: 10.3% (bottom 10%)
[in-text-ad]
Source: Thinkstock
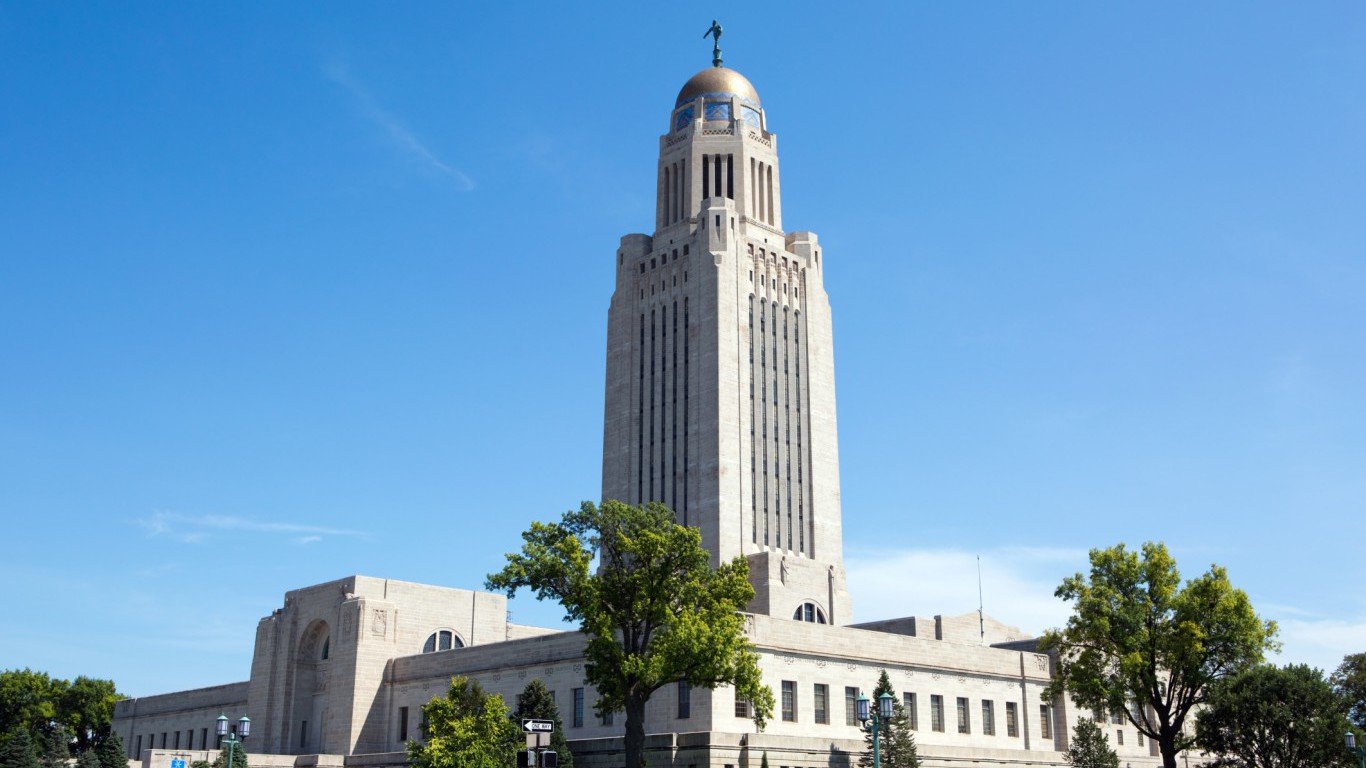
34. Lincoln, Nebraska
> Population: 326,591
> Physically active adults: 82.5% (top 25%)
> Population with access to exercise locations: 93.0% (top 25%)
> Obesity rate: 26.2% (bottom 25%)
> Adults in fair or poor health: 9.8% (bottom 10%)
 24/7 Wall St.
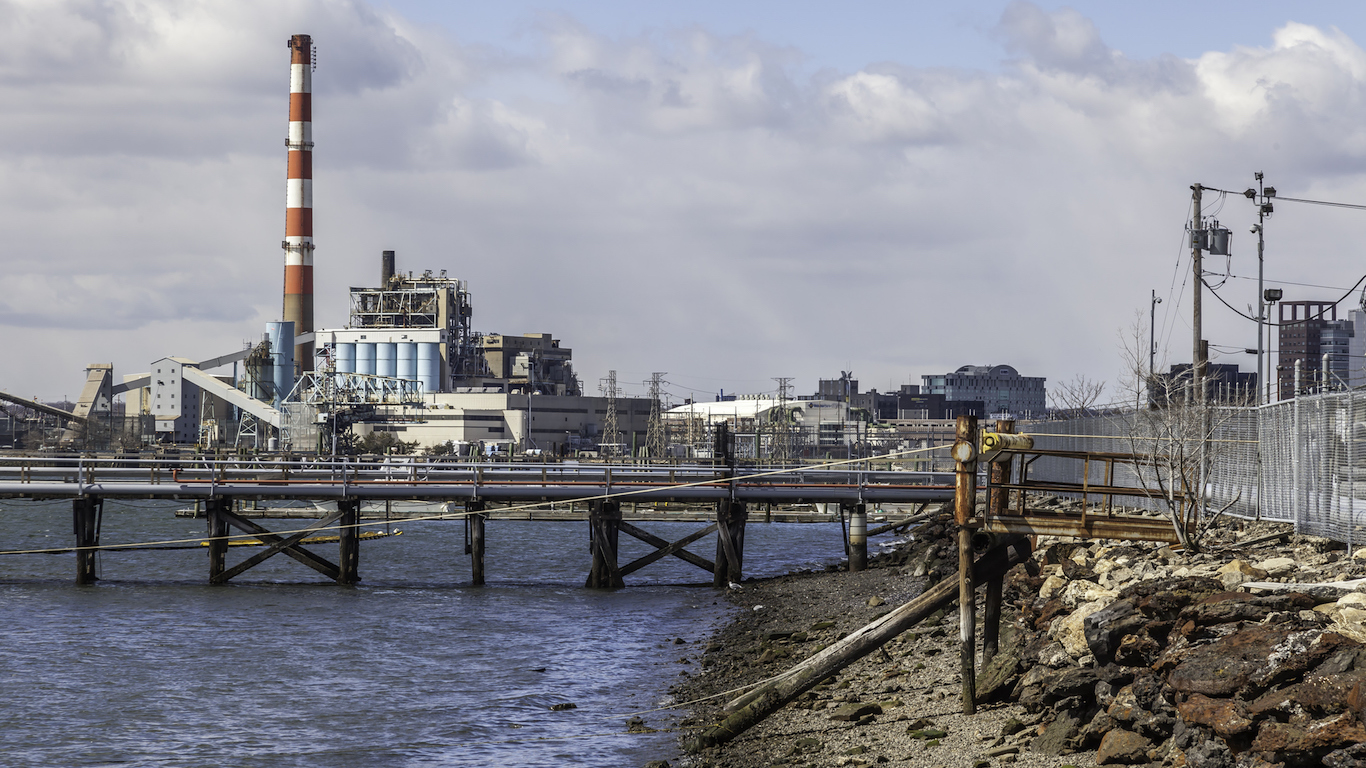
Source: Thinkstock
33. Bridgeport-Stamford-Norwalk, Connecticut
> Population: 944,177
> Physically active adults: 81.2% (top 25%)
> Population with access to exercise locations: 96.8% (top 10%)
> Obesity rate: 21.4% (bottom 10%)
> Adults in fair or poor health: 13.6% (bottom 25%)
Source: Thinkstock
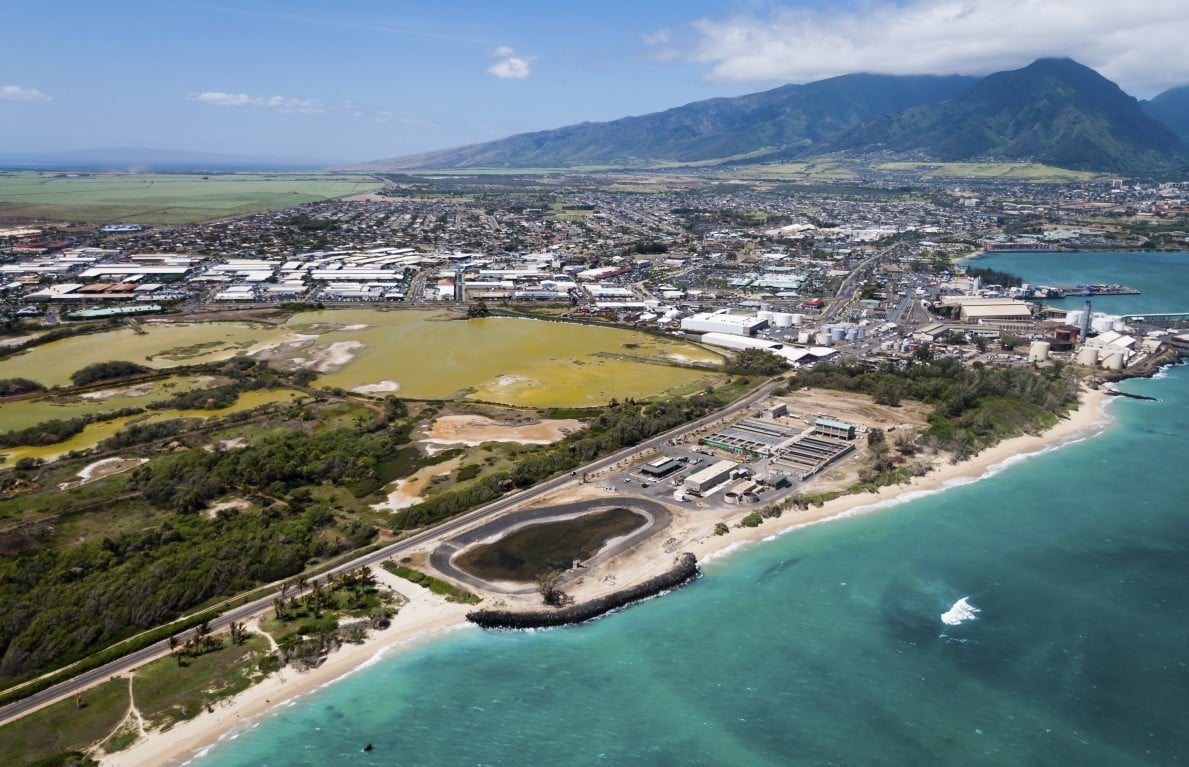
32. Kahului-Wailuku-Lahaina, Hawaii
> Population: 165,474
> Physically active adults: 82.5% (top 25%)
> Population with access to exercise locations: 93.7% (top 10%)
> Obesity rate: 22.4% (bottom 10%)
> Adults in fair or poor health: 11.8% (bottom 10%)
[in-text-ad-2]

Source: Thinkstock
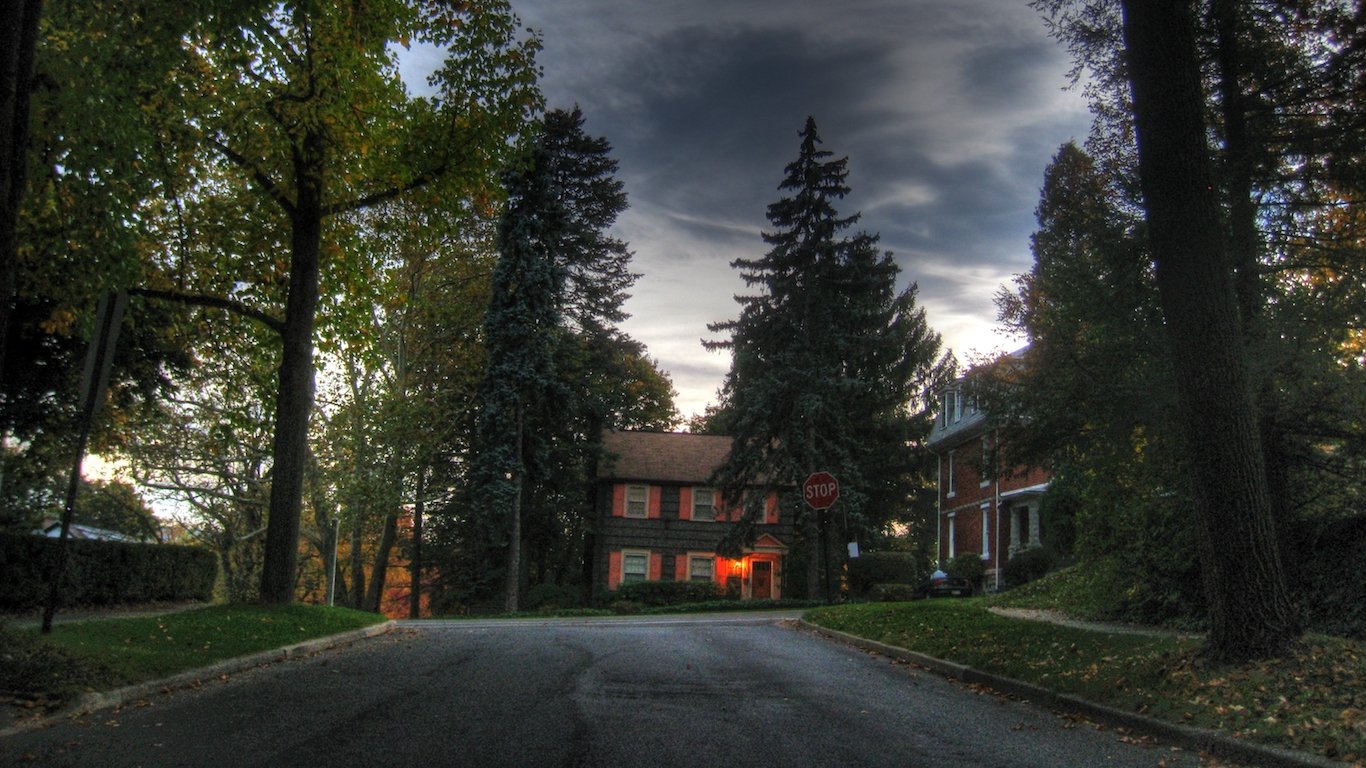
31. Washington-Arlington-Alexandria, District of Columbia
> Population: 6,133,552
> Physically active adults: 82.0% (top 25%)
> Population with access to exercise locations: 95.2% (top 10%)
> Obesity rate: 24.6% (bottom 25%)
> Adults in fair or poor health: 11.9% (bottom 10%)
Source: Thinkstock
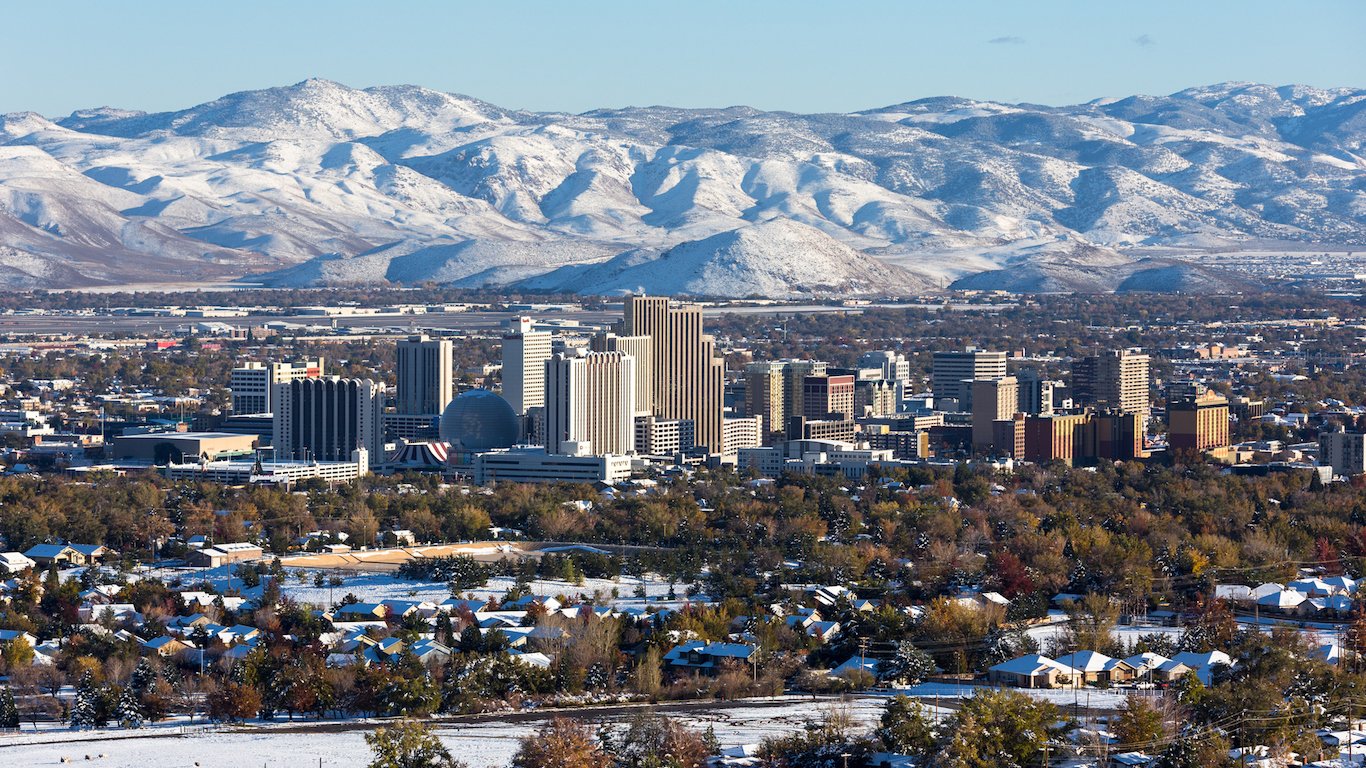
30. Reno, Nevada
> Population: 457,387
> Physically active adults: 83.9% (top 10%)
> Population with access to exercise locations: 90.7% (top 25%)
> Obesity rate: 21.8% (bottom 10%)
> Adults in fair or poor health: 14.8%
[in-text-ad]

Source: Thinkstock
29. Missoula, Montana
> Population: 116,130
> Physically active adults: 84.6% (top 10%)
> Population with access to exercise locations: 89.1% (top 25%)
> Obesity rate: 22.2% (bottom 10%)
> Adults in fair or poor health: 13.1% (bottom 25%)

Source: Thinkstock
28. Ogden-Clearfield, Utah
> Population: 656,061
> Physically active adults: 83.8% (top 10%)
> Population with access to exercise locations: 91.3% (top 25%)
> Obesity rate: 26.9%
> Adults in fair or poor health: 11.9% (bottom 10%)

Source: Thinkstock
27. Minneapolis-St. Paul-Bloomington, Minnesota
> Population: 3,551,036
> Physically active adults: 82.8% (top 25%)
> Population with access to exercise locations: 94.1% (top 10%)
> Obesity rate: 25.6% (bottom 25%)
> Adults in fair or poor health: 10.5% (bottom 10%)
[in-text-ad-2]
Source: JimFeliciano / iStock
26. Vallejo-Fairfield, California
> Population: 440,207
> Physically active adults: 81.8% (top 25%)
> Population with access to exercise locations: 96.8% (top 10%)
> Obesity rate: 30.1%
> Adults in fair or poor health: 15.5%
Source: Thinkstock
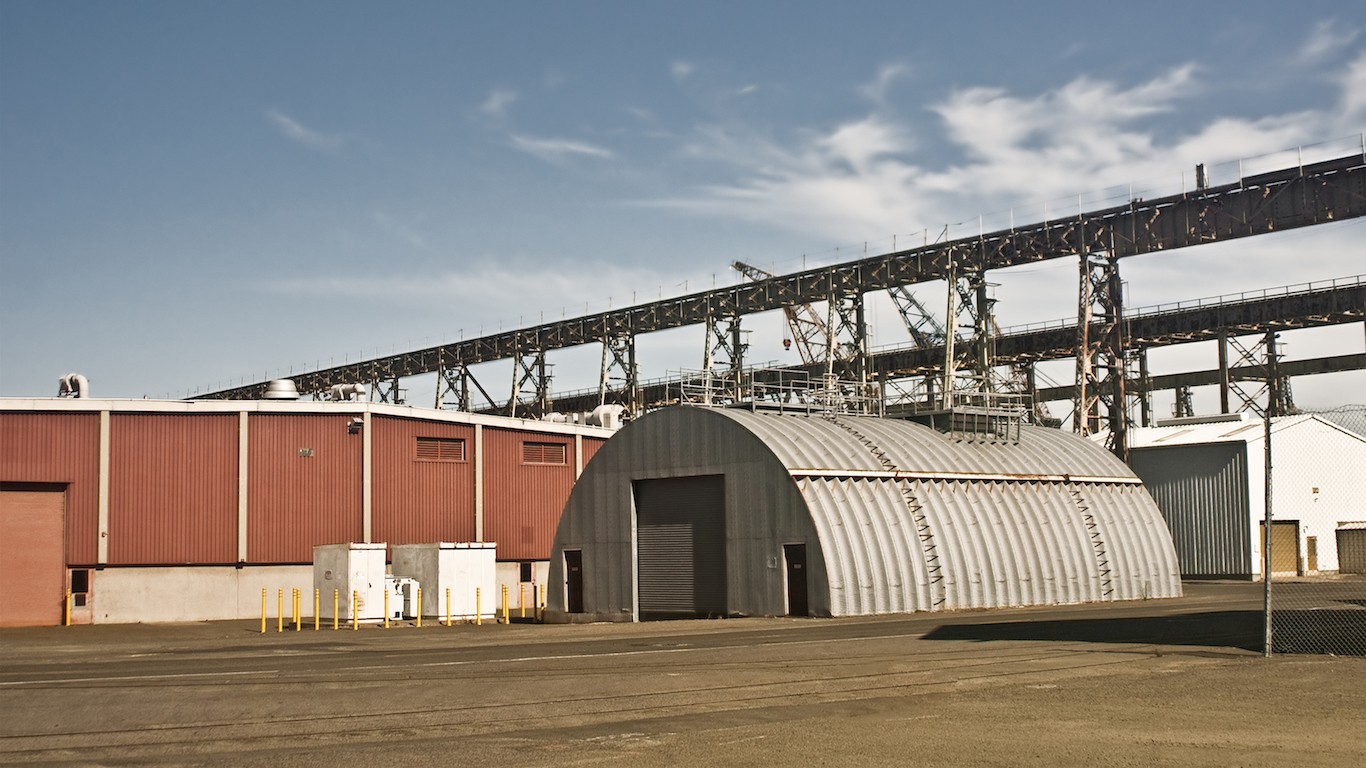
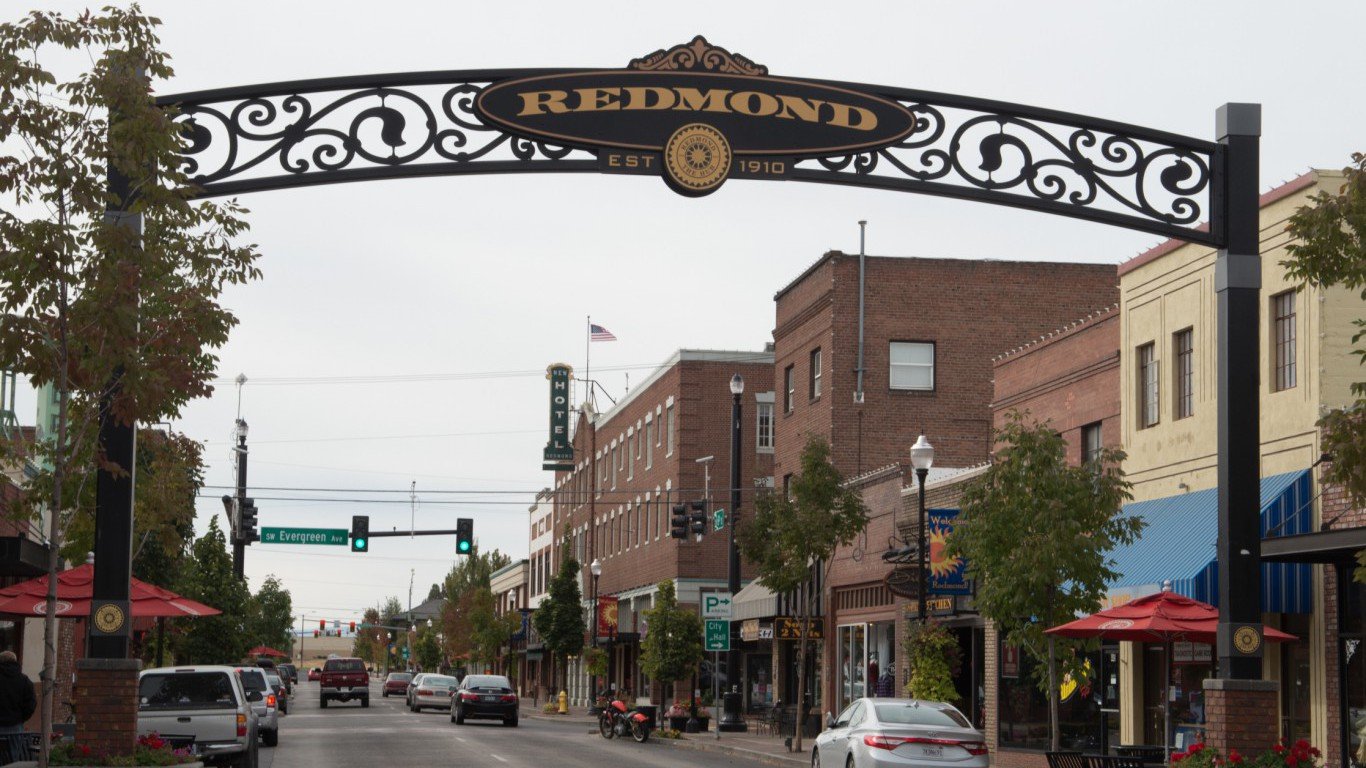
25. Bend-Redmond, Oregon
> Population: 181,307
> Physically active adults: 86.1% (top 10%)
> Population with access to exercise locations: 87.1%
> Obesity rate: 24.1% (bottom 25%)
> Adults in fair or poor health: 12.9% (bottom 25%)
[in-text-ad]
Source: Thinkstock
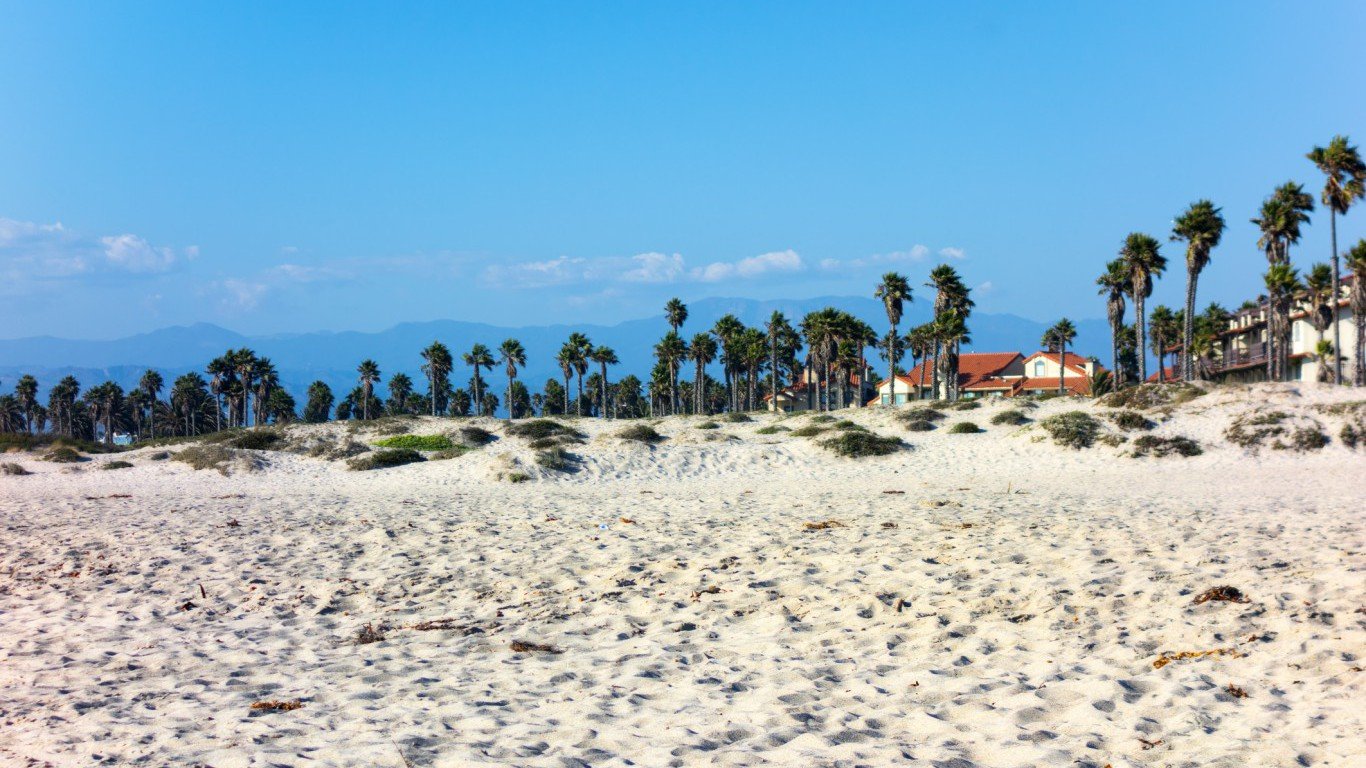
24. Oxnard-Thousand Oaks-Ventura, California
> Population: 849,738
> Physically active adults: 81.9% (top 25%)
> Population with access to exercise locations: 97.8% (top 10%)
> Obesity rate: 20.3% (bottom 10%)
> Adults in fair or poor health: 15.1%
Source: Thinkstock
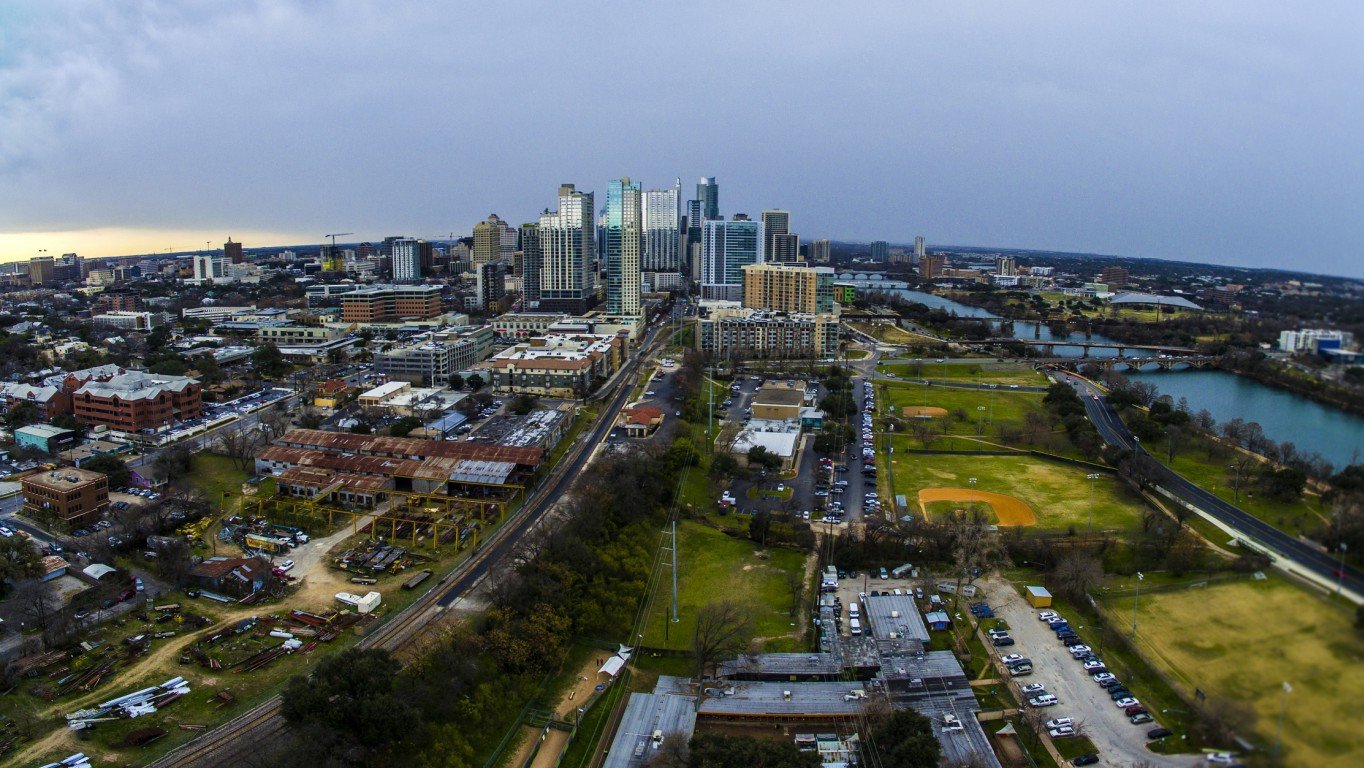
23. Austin-Round Rock, Texas
> Population: 2,056,405
> Physically active adults: 83.9% (top 10%)
> Population with access to exercise locations: 93.4% (top 25%)
> Obesity rate: 24.0% (bottom 25%)
> Adults in fair or poor health: 15.1%
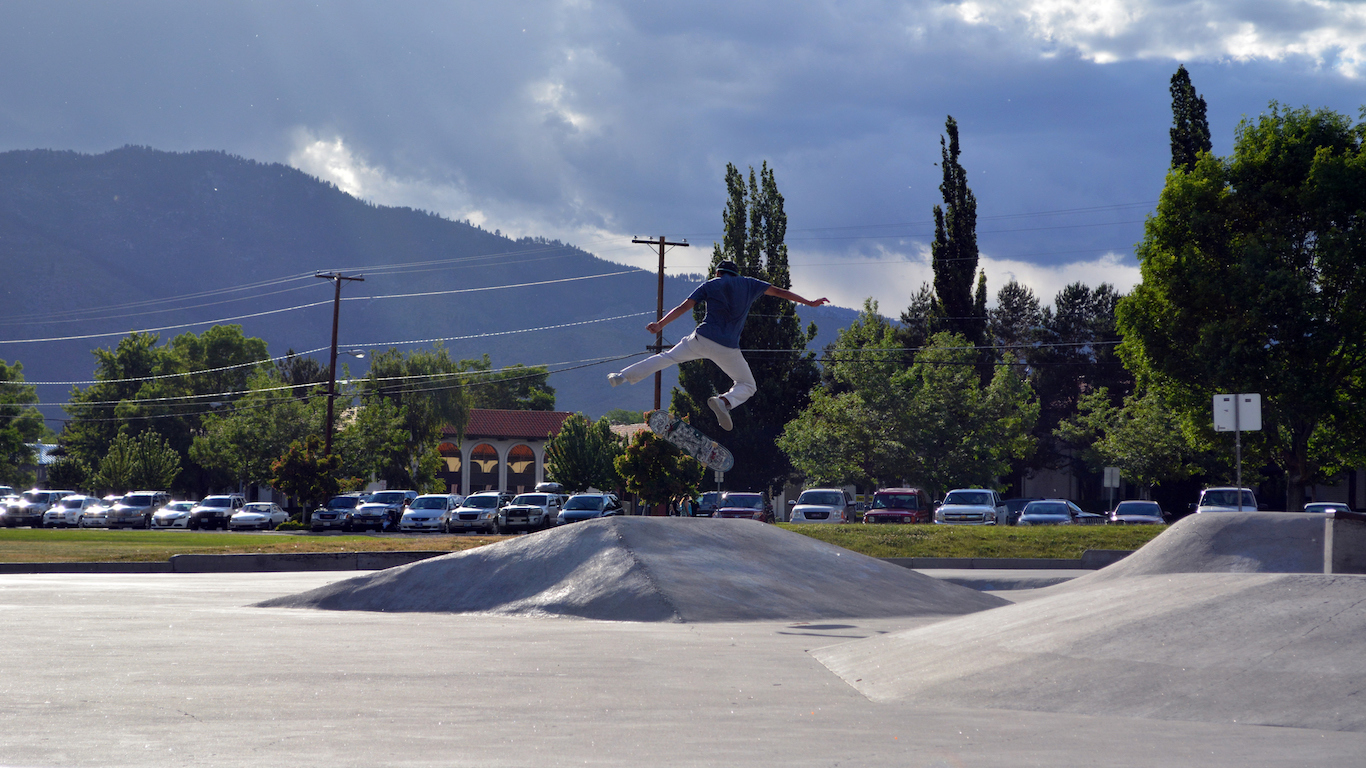
Source: PaaschPhotography / iStock
22. Carson City, Nevada
> Population: 54,742
> Physically active adults: 82.8% (top 25%)
> Population with access to exercise locations: 96.4% (top 10%)
> Obesity rate: 24.6% (bottom 25%)
> Adults in fair or poor health: 17.1%
[in-text-ad-2]

Source: Thinkstock
21. Salt Lake City, Utah
> Population: 1,186,187
> Physically active adults: 83.8% (top 10%)
> Population with access to exercise locations: 94.3% (top 10%)
> Obesity rate: 25.7% (bottom 25%)
> Adults in fair or poor health: 12.7% (bottom 25%)

Source: Thinkstock
20. Ann Arbor, Michigan
> Population: 364,709
> Physically active adults: 84.7% (top 10%)
> Population with access to exercise locations: 92.0% (top 25%)
> Obesity rate: 24.4% (bottom 25%)
> Adults in fair or poor health: 12.4% (bottom 10%)
[in-text-ad]
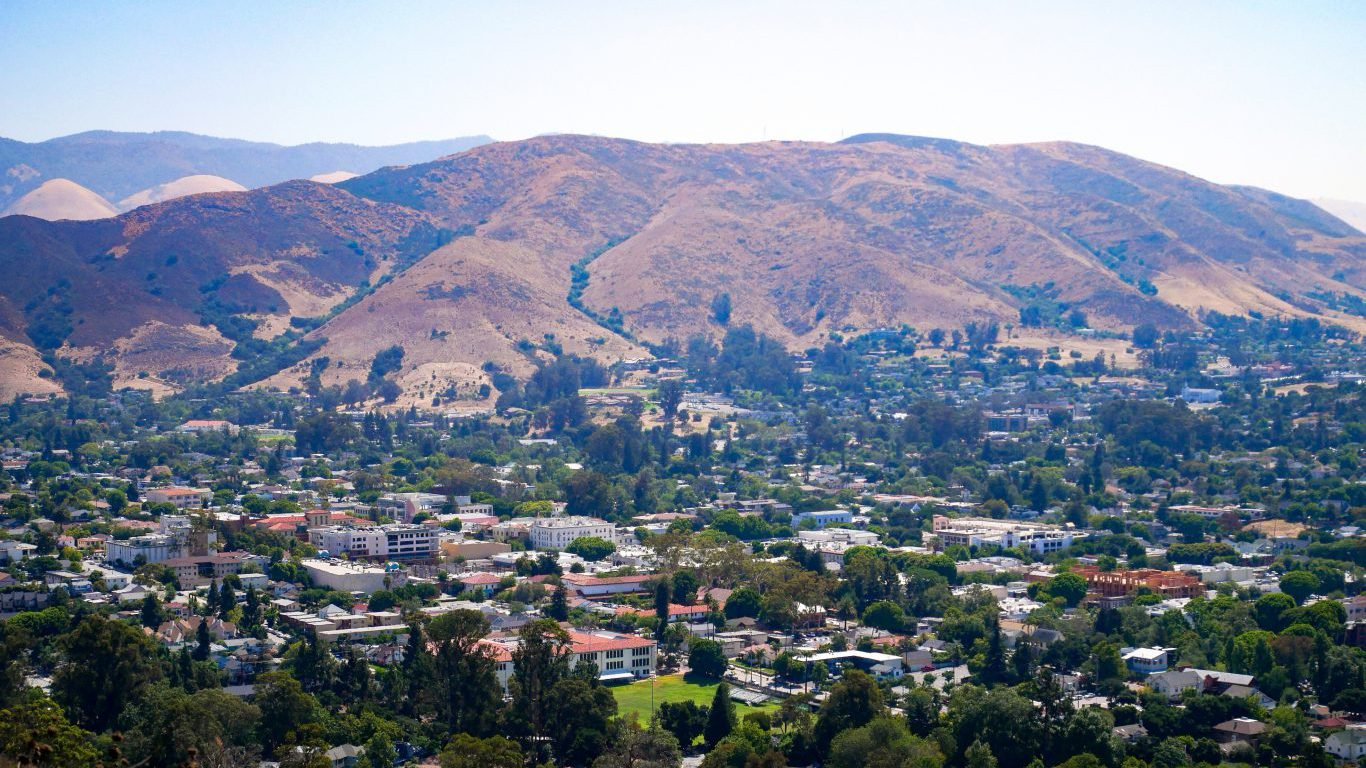
Source: joojoob27 / Shutterstock.com
19. San Luis Obispo-Paso Robles-Arroyo Grande, California
> Population: 282,887
> Physically active adults: 85.9% (top 10%)
> Population with access to exercise locations: 89.2% (top 25%)
> Obesity rate: 24.5% (bottom 25%)
> Adults in fair or poor health: 13.8%
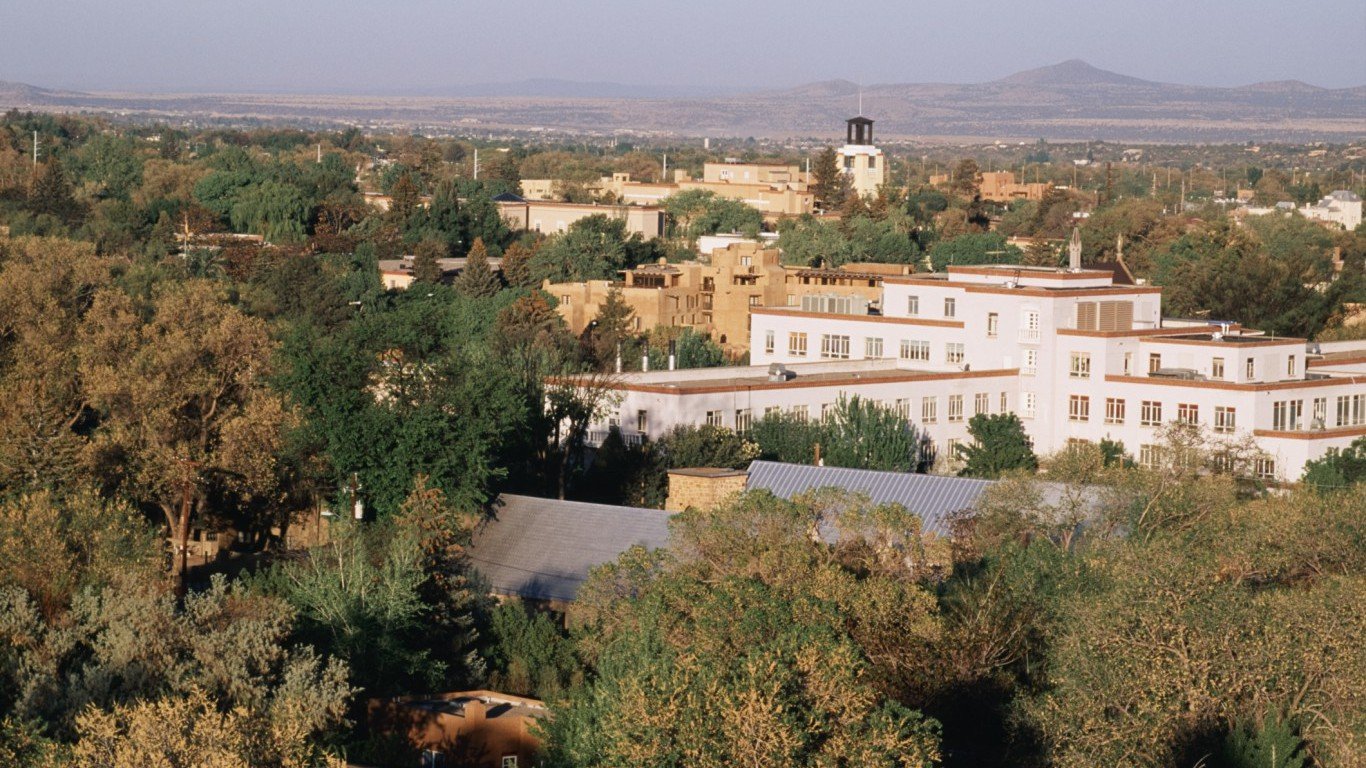
Source: Thinkstock
18. Santa Fe, New Mexico
> Population: 148,651
> Physically active adults: 89.5% (top 10%)
> Population with access to exercise locations: 80.6%
> Obesity rate: 13.7% (bottom 10%)
> Adults in fair or poor health: 16.5%
Source: Thinkstock
17. Napa, California
> Population: 142,166
> Physically active adults: 84.0% (top 10%)
> Population with access to exercise locations: 93.9% (top 10%)
> Obesity rate: 23.7% (bottom 10%)
> Adults in fair or poor health: 14.1%
[in-text-ad-2]
Source: Thinkstock
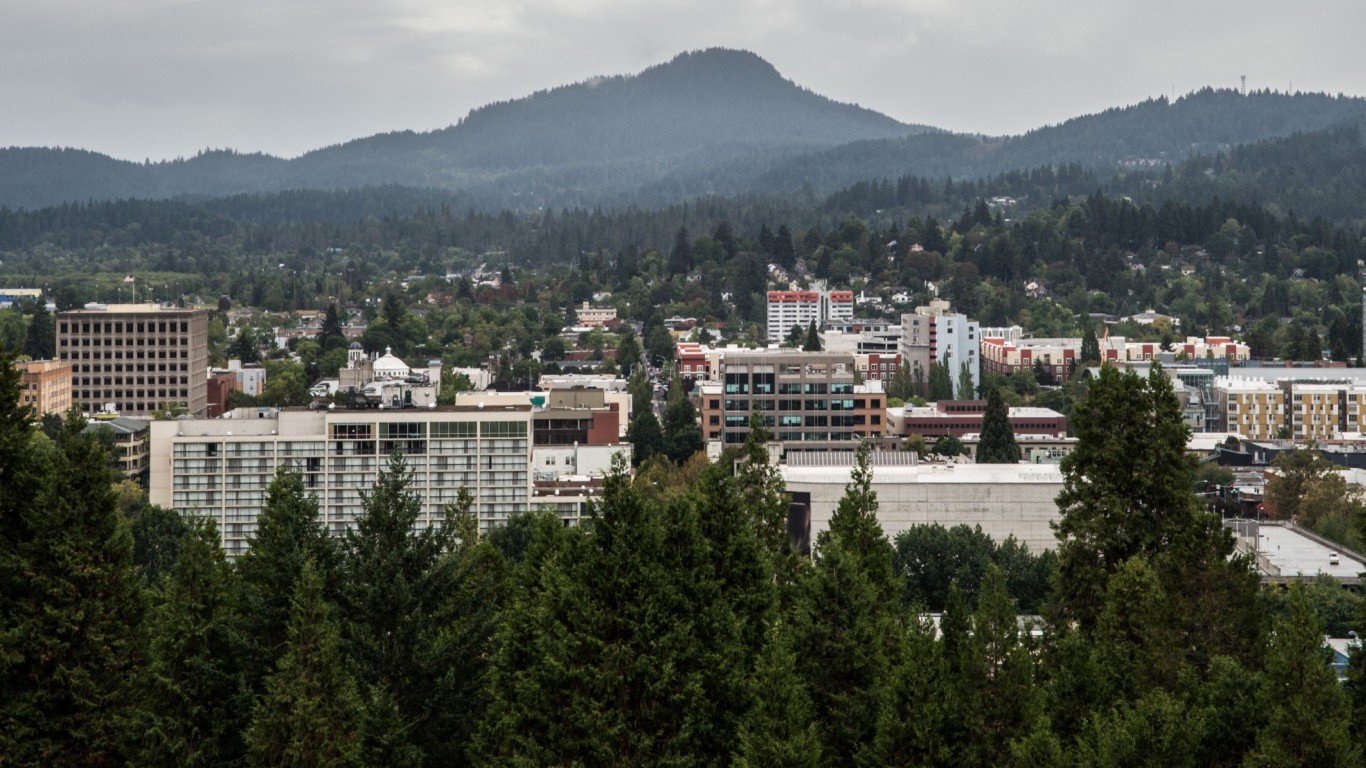
16. Eugene, Oregon
> Population: 369,519
> Physically active adults: 85.4% (top 10%)
> Population with access to exercise locations: 91.1% (top 25%)
> Obesity rate: 27.4%
> Adults in fair or poor health: 15.5%
Source: Thinkstock
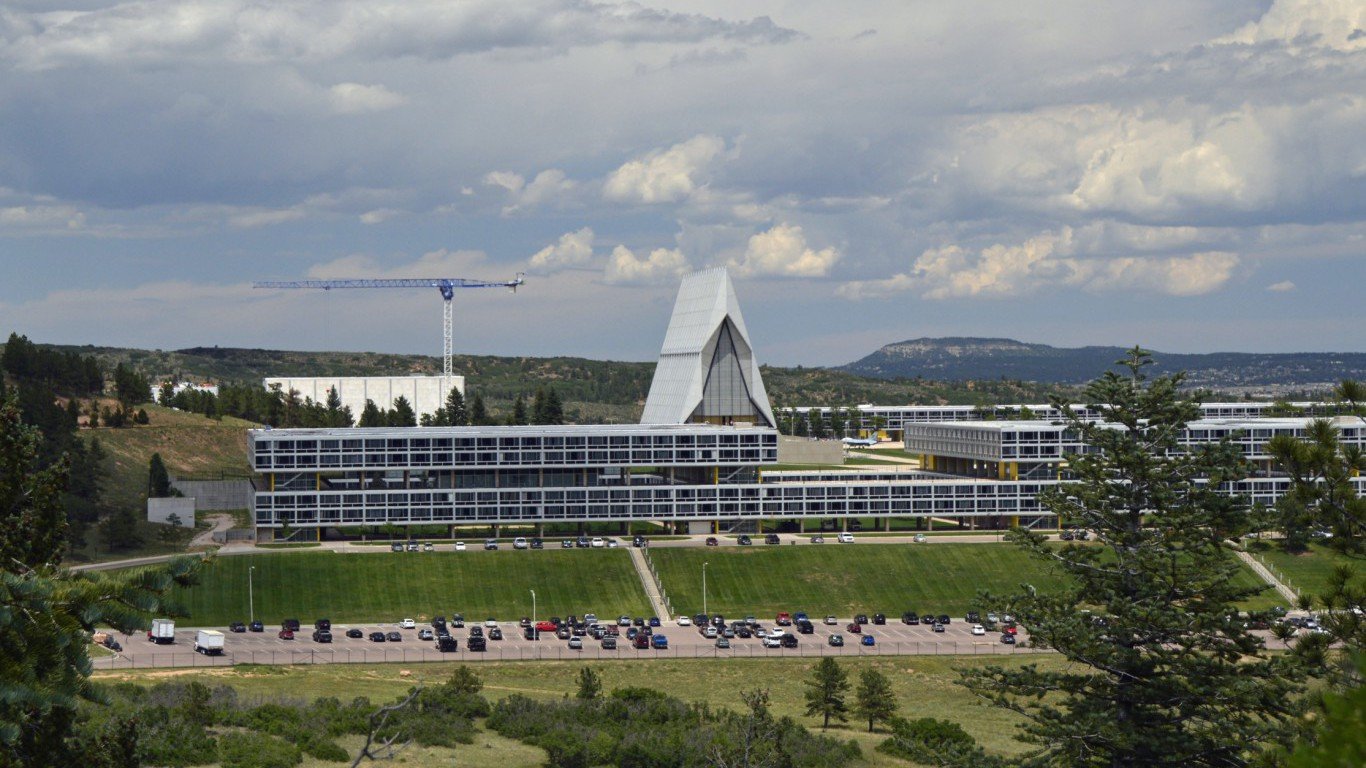
15. Colorado Springs, Colorado
> Population: 712,327
> Physically active adults: 84.5% (top 10%)
> Population with access to exercise locations: 93.3% (top 25%)
> Obesity rate: 22.2% (bottom 10%)
> Adults in fair or poor health: 13.3% (bottom 25%)
[in-text-ad]

Source: Thinkstock
14. Los Angeles-Long Beach-Anaheim, California
> Population: 13,310,447
> Physically active adults: 82.8% (top 25%)
> Population with access to exercise locations: 97.8% (top 10%)
> Obesity rate: 21.0% (bottom 10%)
> Adults in fair or poor health: 18.2%
 24/7 Wall St.
Source: Toribio93 / Shutterstock.com
13. Sacramento–Roseville–Arden-Arcade, California
> Population: 2,296,418
> Physically active adults: 83.6% (top 10%)
> Population with access to exercise locations: 95.9% (top 10%)
> Obesity rate: 25.5% (bottom 25%)
> Adults in fair or poor health: 15.7%
Source: Thinkstock
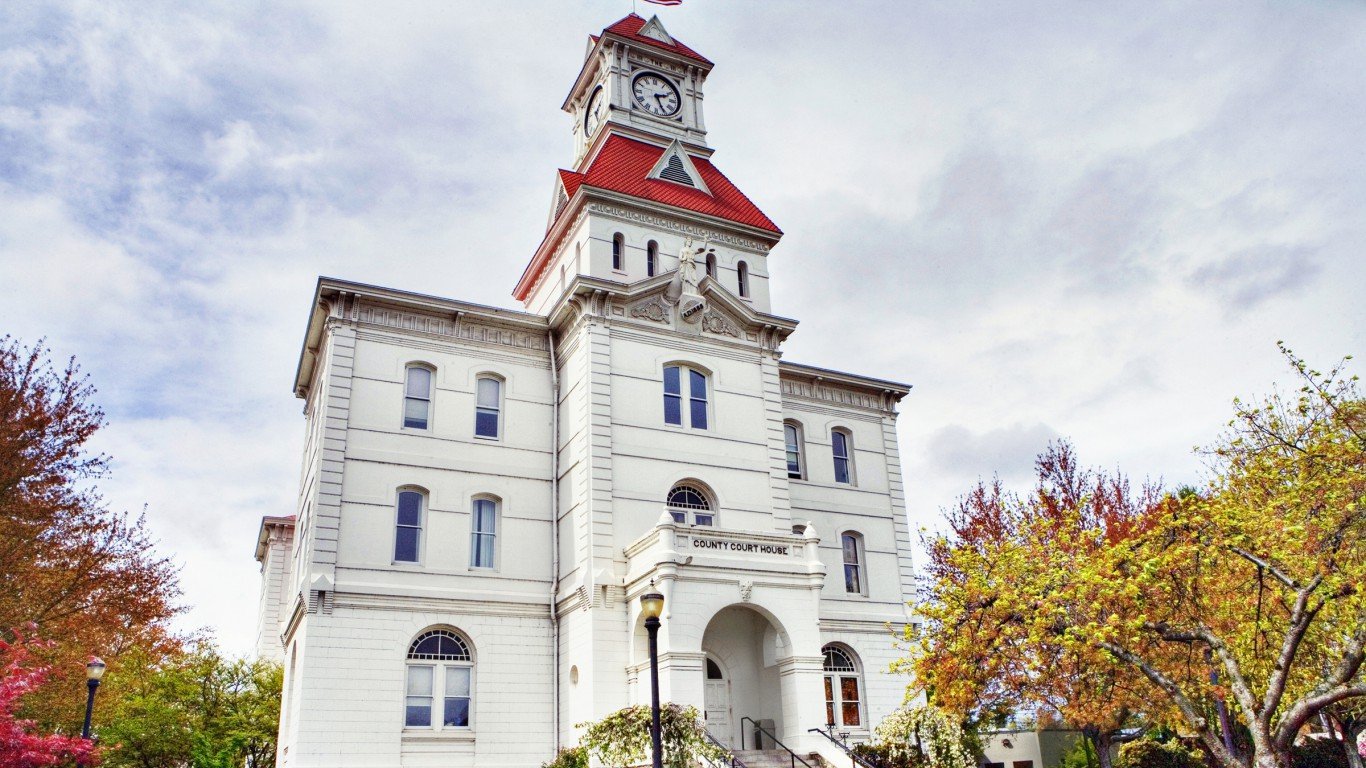
12. Corvallis, Oregon
> Population: 89,385
> Physically active adults: 88.0% (top 10%)
> Population with access to exercise locations: 86.0%
> Obesity rate: 21.6% (bottom 10%)
> Adults in fair or poor health: 14.1%
[in-text-ad-2]

Source: Thinkstock
11. Seattle-Tacoma-Bellevue, Washington
> Population: 3,798,902
> Physically active adults: 84.5% (top 10%)
> Population with access to exercise locations: 95.5% (top 10%)
> Obesity rate: 25.5% (bottom 25%)
> Adults in fair or poor health: 11.4% (bottom 10%)
Source: Thinkstock
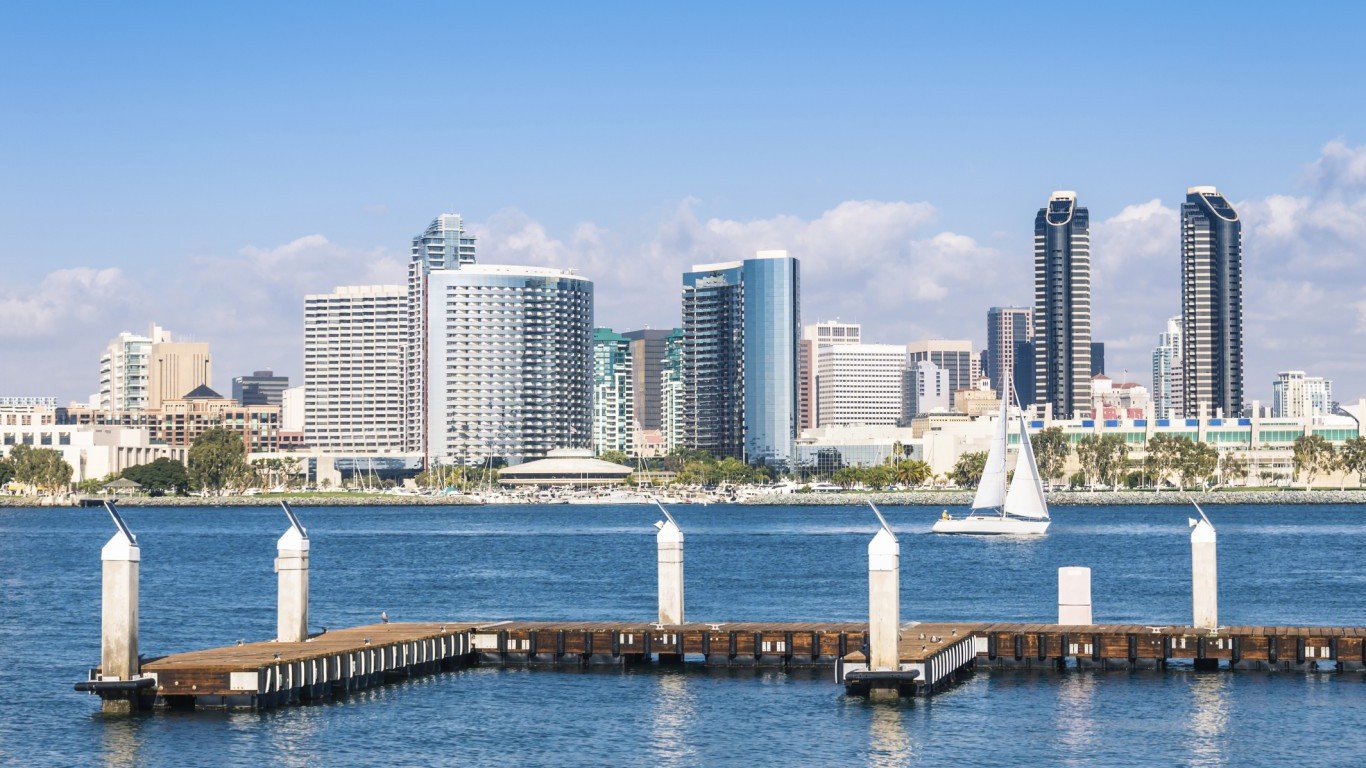
10. San Diego-Carlsbad, California
> Population: 3,317,749
> Physically active adults: 84.4% (top 10%)
> Population with access to exercise locations: 96.1% (top 10%)
> Obesity rate: 19.1% (bottom 10%)
> Adults in fair or poor health: 14.9%
[in-text-ad]

Source: Thinkstock
9. San Francisco-Oakland-Hayward, California
> Population: 4,679,166
> Physically active adults: 83.9% (top 10%)
> Population with access to exercise locations: 98.6% (top 10%)
> Obesity rate: 20.6% (bottom 10%)
> Adults in fair or poor health: 11.6% (bottom 10%)

Source: Thinkstock
8. Portland-Vancouver-Hillsboro, Oregon
> Population: 2,425,325
> Physically active adults: 85.8% (top 10%)
> Population with access to exercise locations: 95.4% (top 10%)
> Obesity rate: 24.8% (bottom 25%)
> Adults in fair or poor health: 13.4% (bottom 25%)

Source: Thinkstock
7. Santa Rosa, California
> Population: 503,070
> Physically active adults: 86.2% (top 10%)
> Population with access to exercise locations: 94.7% (top 10%)
> Obesity rate: 20.9% (bottom 10%)
> Adults in fair or poor health: 14.0%
[in-text-ad-2]
Source: Thinkstock
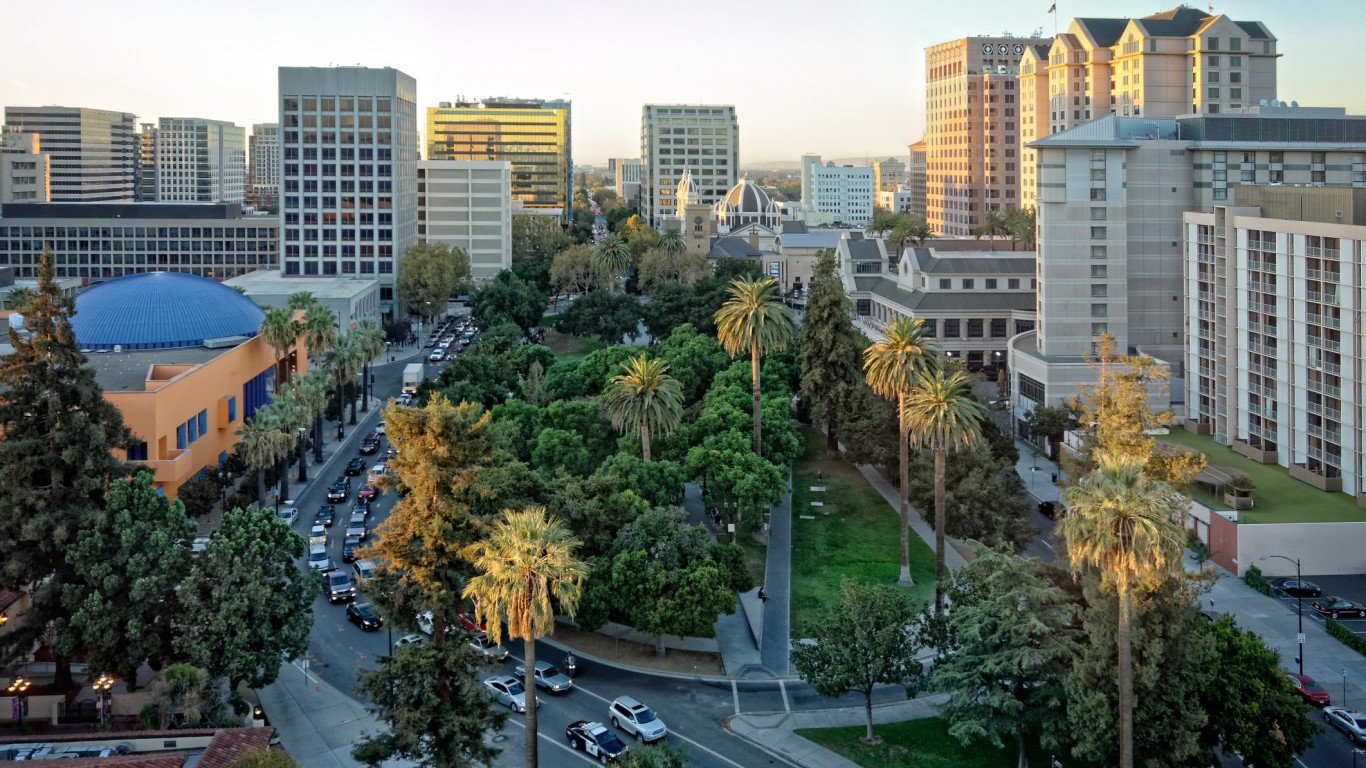
6. San Jose-Sunnyvale-Santa Clara, California
> Population: 1,978,816
> Physically active adults: 84.7% (top 10%)
> Population with access to exercise locations: 98.2% (top 10%)
> Obesity rate: 19.6% (bottom 10%)
> Adults in fair or poor health: 11.7% (bottom 10%)
Source: Thinkstock
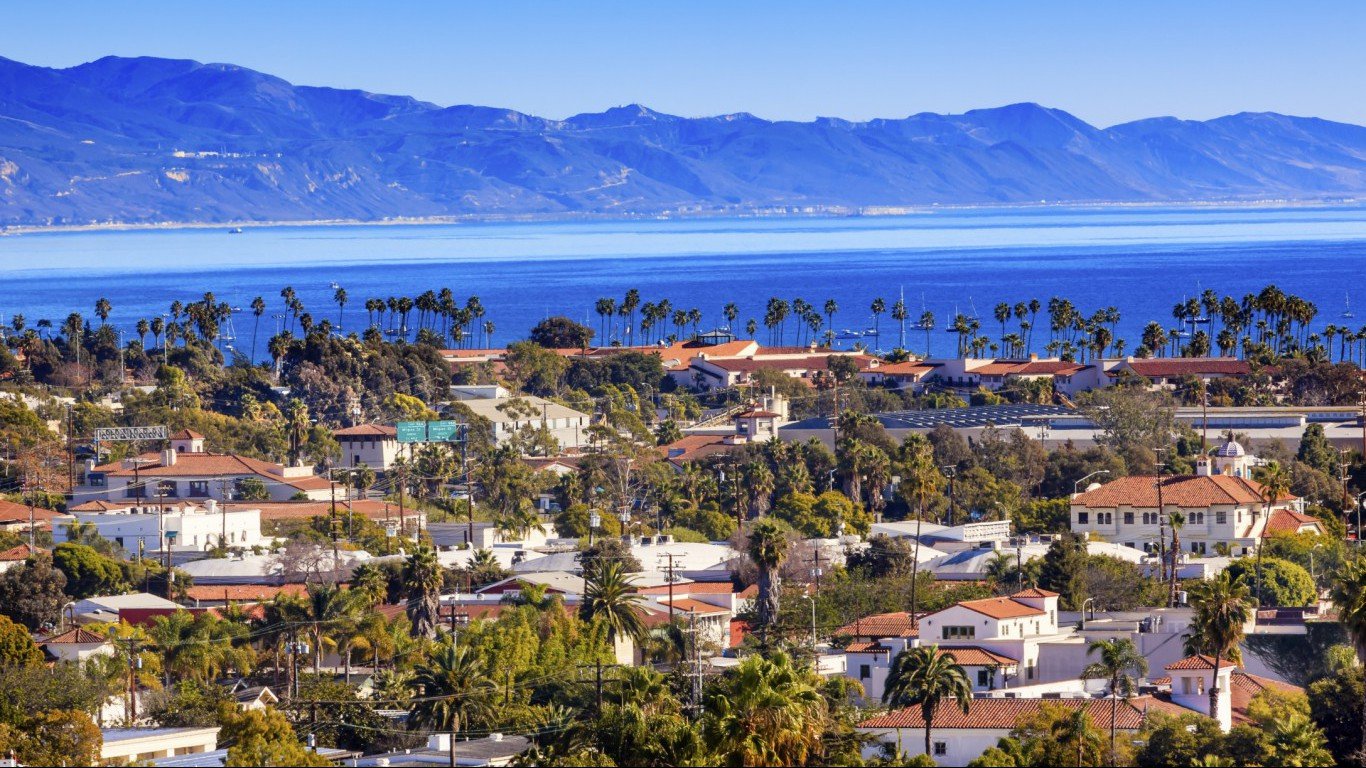
5. Santa Maria-Santa Barbara, California
> Population: 446,170
> Physically active adults: 86.0% (top 10%)
> Population with access to exercise locations: 95.6% (top 10%)
> Obesity rate: 18.2% (bottom 10%)
> Adults in fair or poor health: 18.4% (top 25%)
[in-text-ad]
Source: Thinkstock
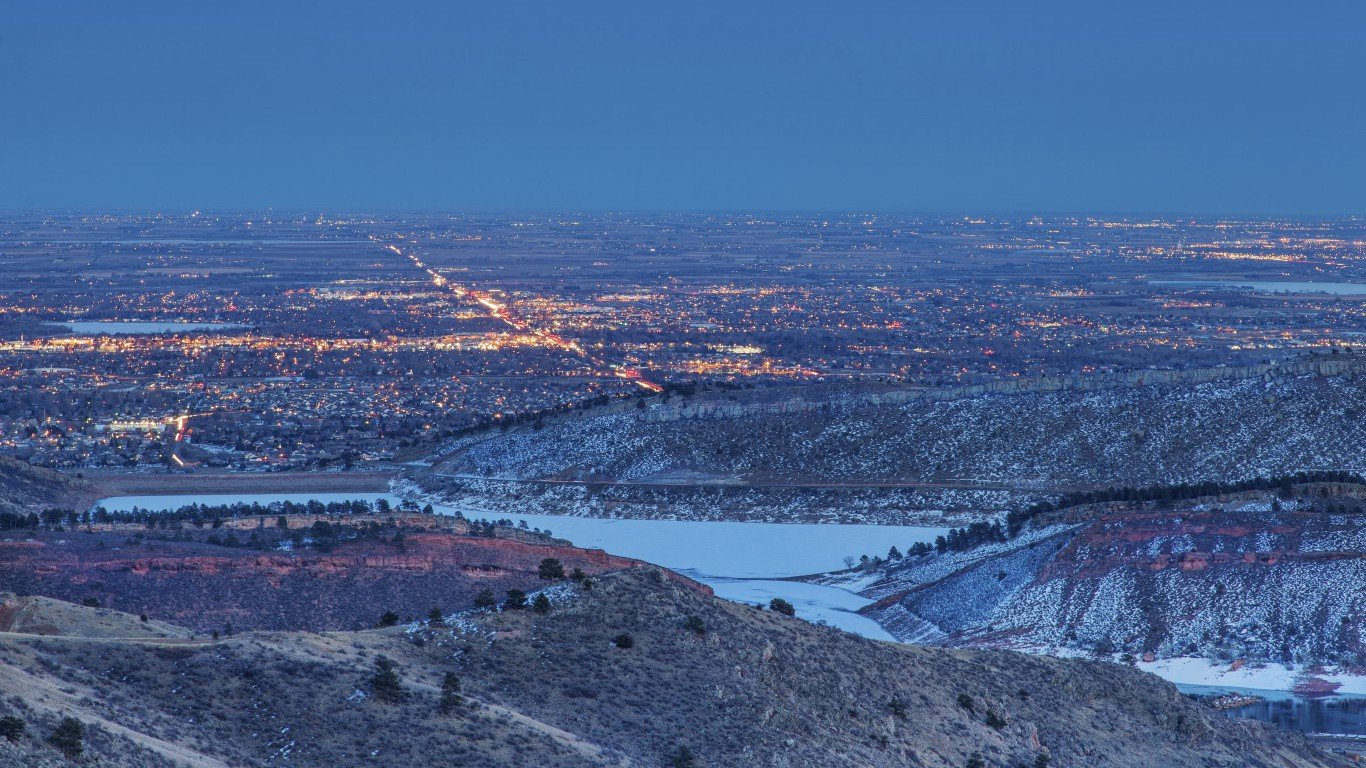
4. Fort Collins, Colorado
> Population: 339,993
> Physically active adults: 87.7% (top 10%)
> Population with access to exercise locations: 92.1% (top 25%)
> Obesity rate: 18.7% (bottom 10%)
> Adults in fair or poor health: 10.0% (bottom 10%)
Source: Thinkstock
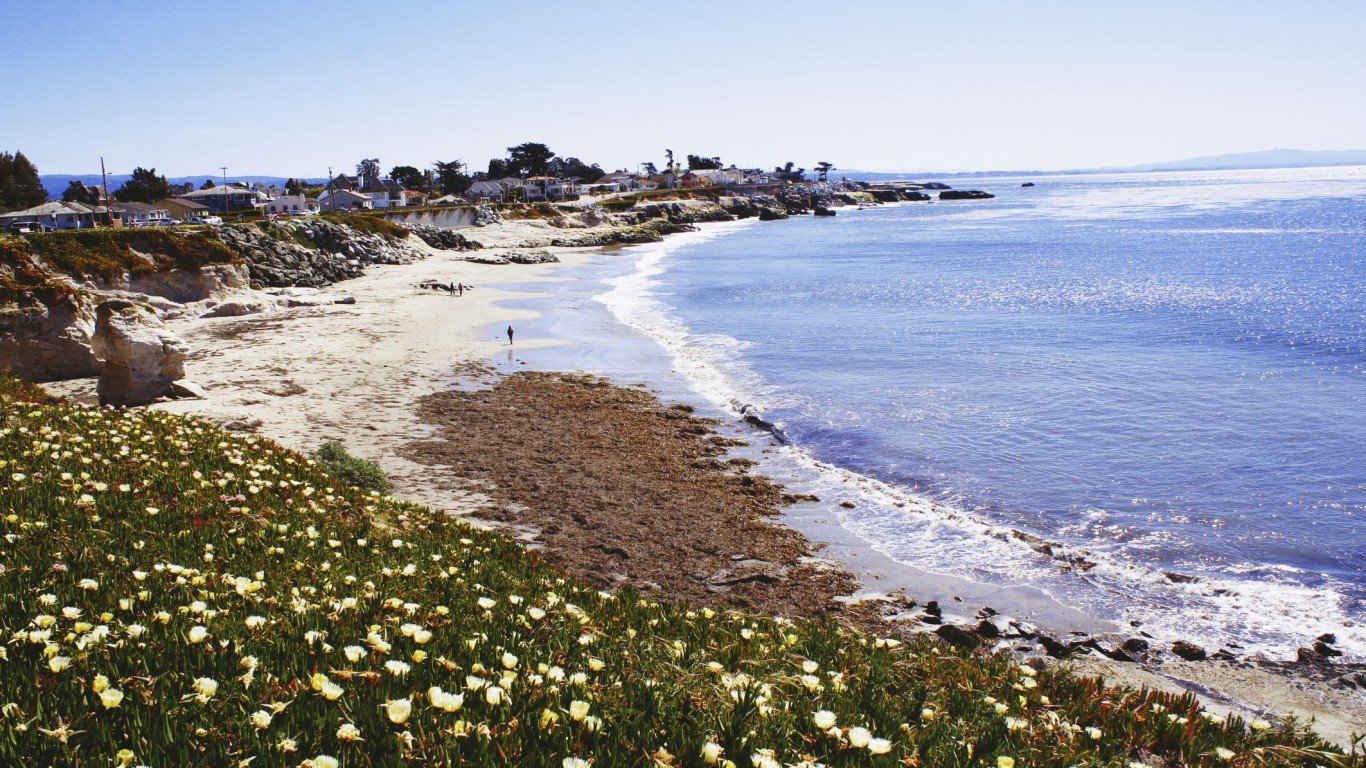
3. Santa Cruz-Watsonville, California
> Population: 274,673
> Physically active adults: 86.7% (top 10%)
> Population with access to exercise locations: 96.1% (top 10%)
> Obesity rate: 20.2% (bottom 10%)
> Adults in fair or poor health: 15.7%

Source: Thinkstock
2. Denver-Aurora-Lakewood, Colorado
> Population: 2,853,077
> Physically active adults: 86.2% (top 10%)
> Population with access to exercise locations: 97.9% (top 10%)
> Obesity rate: 19.8% (bottom 10%)
> Adults in fair or poor health: 12.8% (bottom 25%)
[in-text-ad-2]
Source: MLMims / iStock
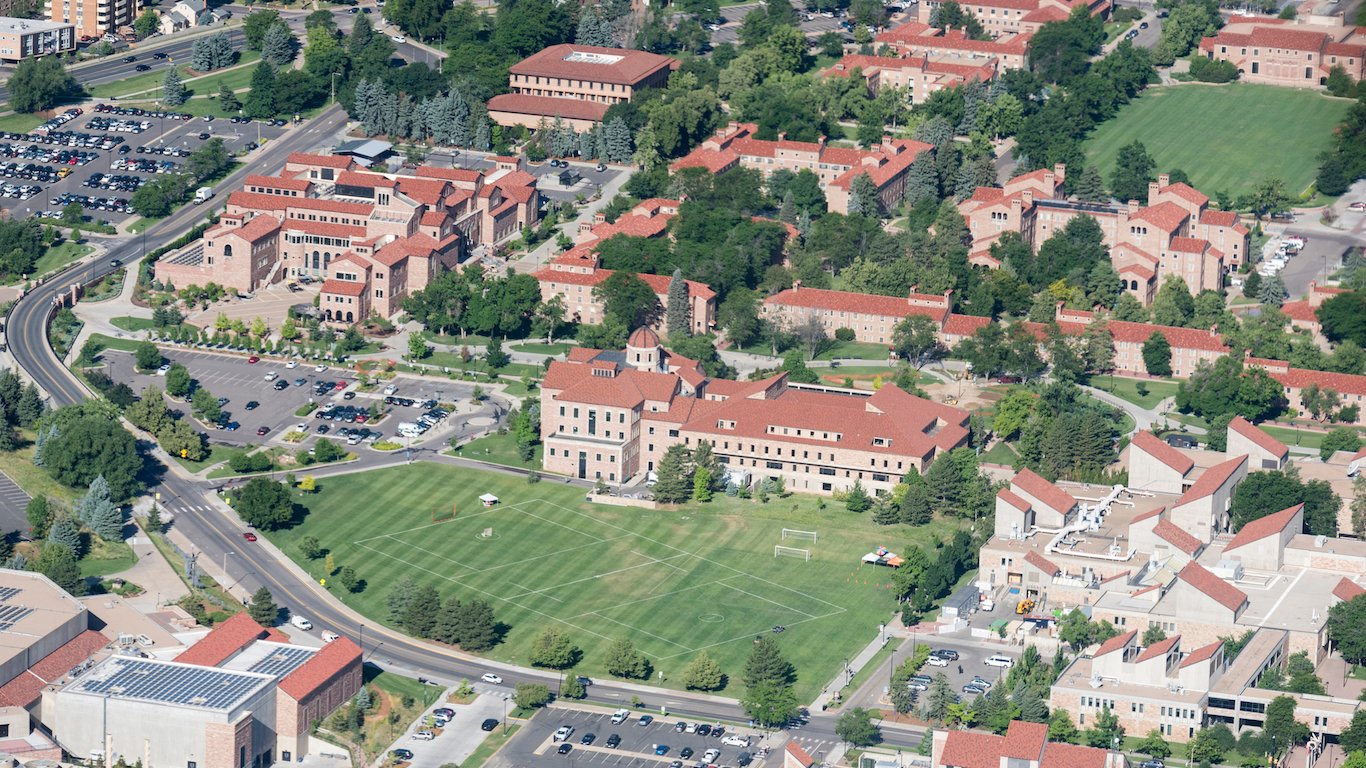
1. Boulder, Colorado
> Population: 322,226
> Physically active adults: 91.3% (top 10%)
> Population with access to exercise locations: 97.7% (top 10%)
> Obesity rate: 13.4% (bottom 10%)
> Adults in fair or poor health: 10.8% (bottom 10%)
Essential Tips for Investing: Sponsored
A financial advisor can help you understand the advantages and disadvantages of investment properties. Finding a qualified financial advisor doesn’t have to be hard. SmartAsset’s free tool matches you with up to three financial advisors who serve your area, and you can interview your advisor matches at no cost to decide which one is right for you. If you’re ready to find an advisor who can help you achieve your financial goals, get started now.
Investing in real estate can diversify your portfolio. But expanding your horizons may add additional costs. If you’re an investor looking to minimize expenses, consider checking out online brokerages. They often offer low investment fees, helping you maximize your profit.
Thank you for reading! Have some feedback for us?
Contact the 24/7 Wall St. editorial team.
Editors' Picks

