Special Report
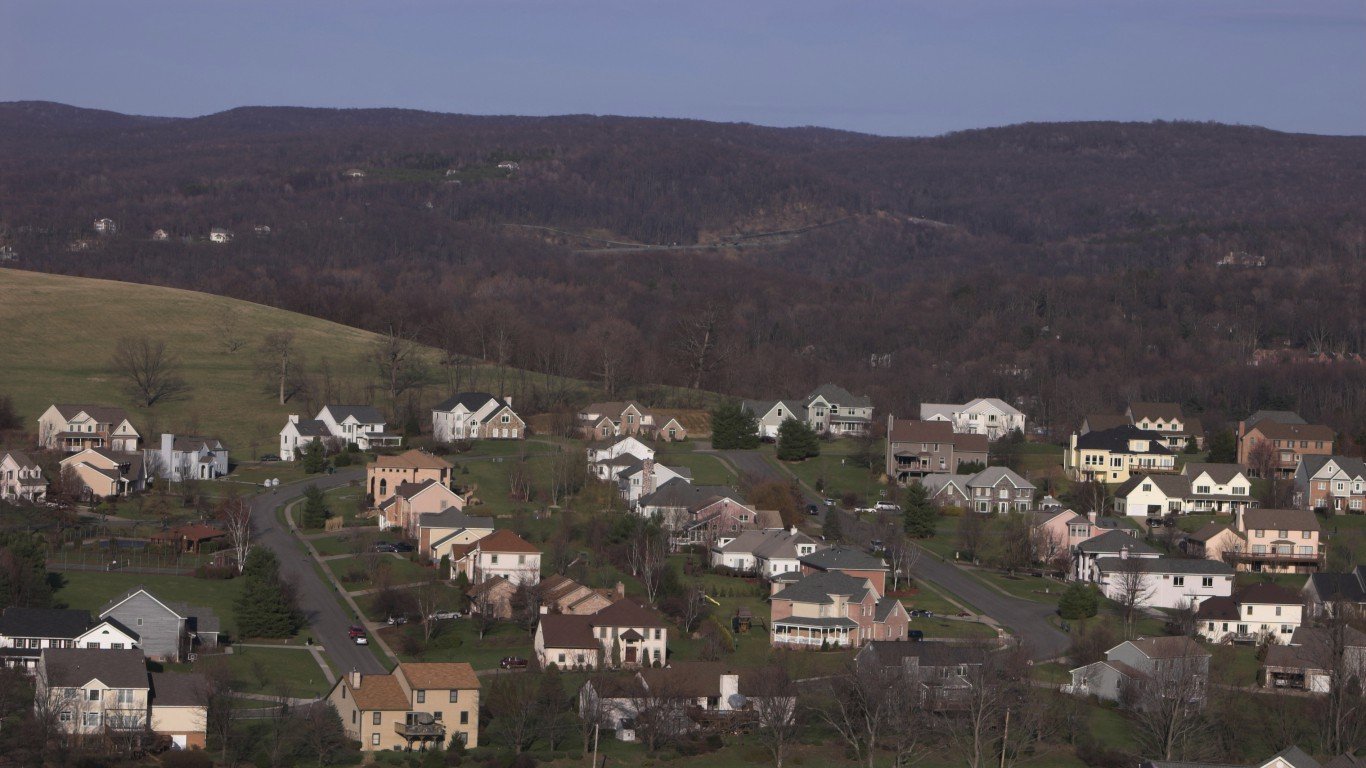
States With the Best (and Worst) Schools
Published:
Last Updated:
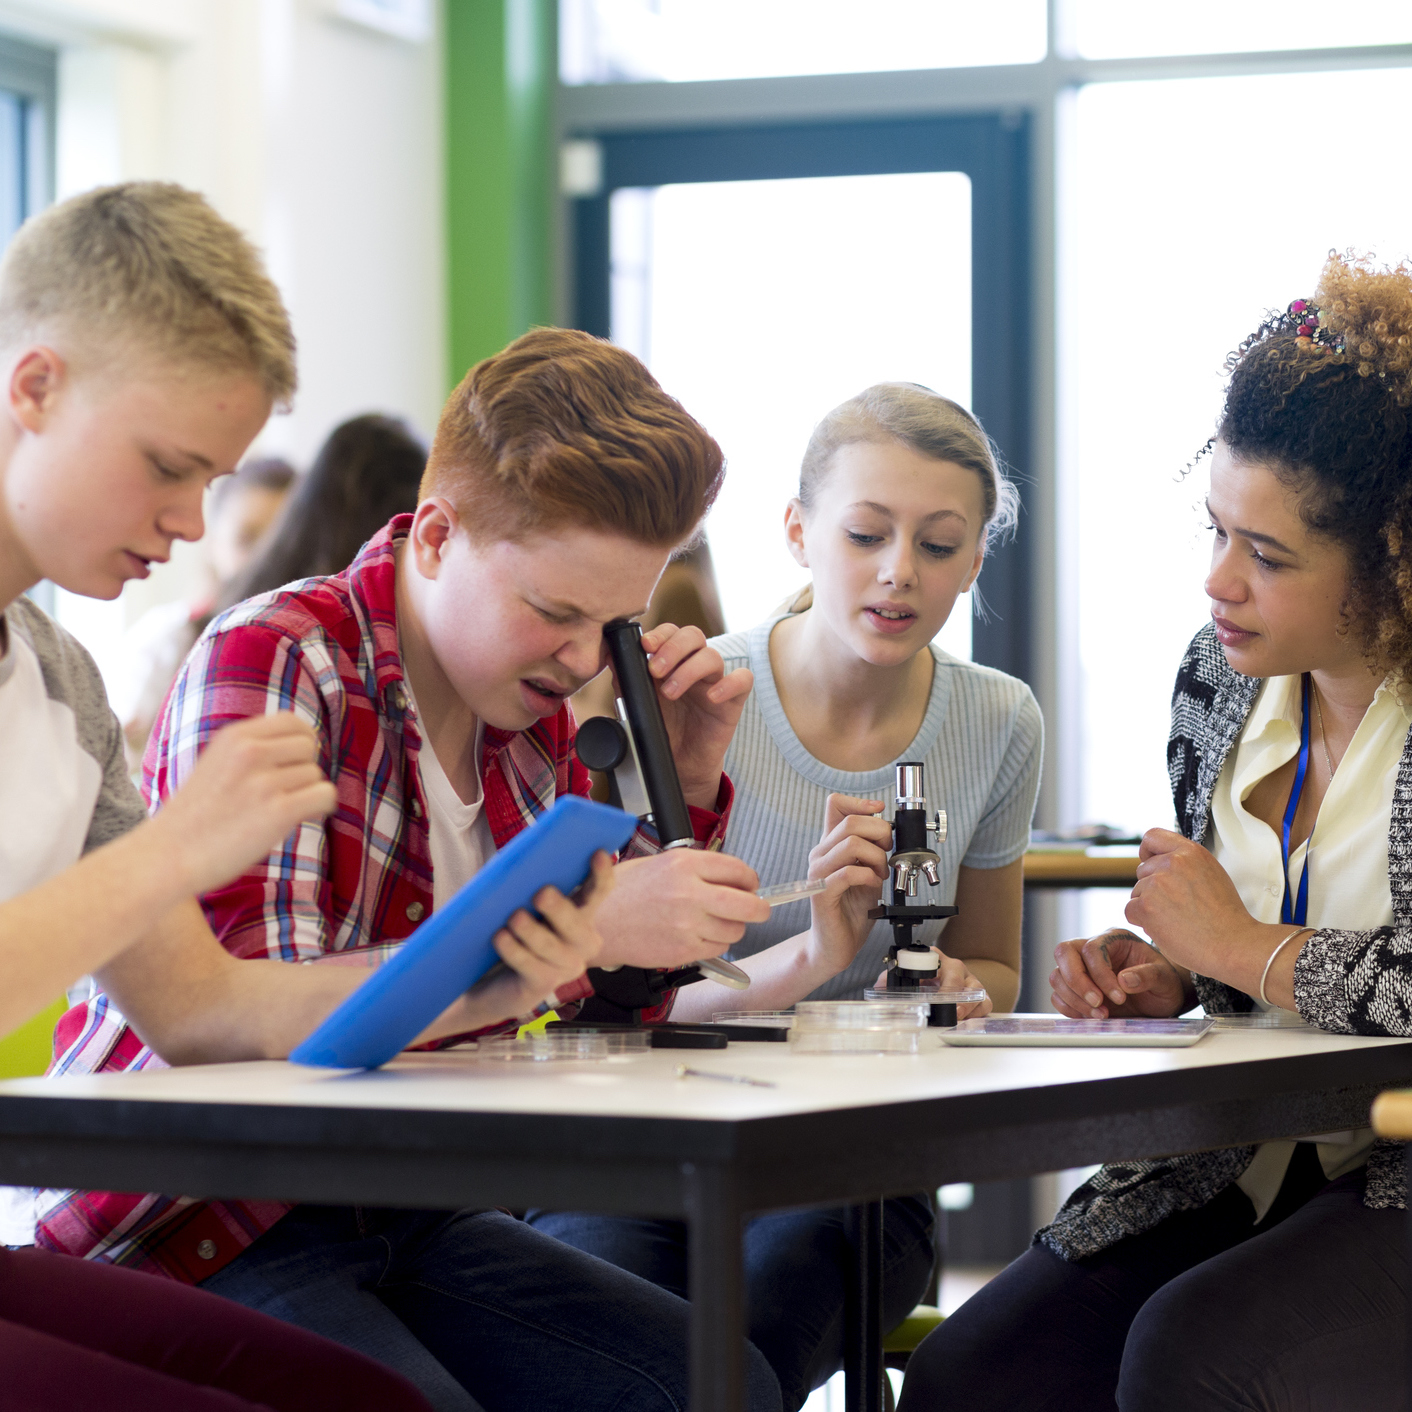
Few issues facing the United States — or any nation — are more important than ensuring children receive a first-rate education. Policymakers and observers disagree as to how to spend public education funds and how exactly schools should be improved. Most agree that school proficiency must be measured.
The U.S. education system is about average compared with other high-income nations, trailing 14 countries on the most recent Programme for International Student Assessment (PISA) test, which in 2015 evaluated millions of 15-year-old students in over 70 countries. Many U.S. students perform as well or better than students in countries with top schools, but such achievements are limited to few states.
To highlight this geographic disparity, 24/7 Wall St. reviewed education data for each state in the 2018 edition of the Quality Counts report, provided by Education Week. The education research center considered dozens of metrics across three broad categories that can determine the strength of a school system: school finances, student achievements, and environmental factors.
Education Week’s rankings of state education systems have changed relatively little over the past several decades. States with the best and worst schools continue to cluster in particular regions, with top rated schools grouped primarily in the more affluent regions of the Northeast and Midatlantic. In an interview with 24/7 Wall St., Sterling Lloyd, assistant director of the Education Week Research Center, noted this year’s report “reflects a mix of strengths and weaknesses along with substantial disparities in the performance of high and low-performing states.”
The picture is not entirely static. But while there have been encouraging developments — high school graduation and college participation increased over the past year — “[Most] schools continue to struggle with wide achievement and funding gaps,” Lloyd said.
Click here to see the states with the best (and worst) schools.
Click here to see our detailed findings.
Click here to see our methodology.

1. Massachusetts
> High school graduation rate: 87.5% (13th highest)
> Public school spending: $14,569 per pupil (11th highest)
> 8th grade NAEP proficiency: 50.8% (math) 45.7% (reading)
> Adults with at least a bachelor’s degree: 42.7% (the highest)
> Adults 25-64 with incomes at or above national median: 62.6% (the highest)
Massachusetts has the nation’s best schools, according to the latest EdWeek ranking of state public education systems. Even top-ranked states in education do not necessarily lead uniformly in the three categories measured — chances of success, school finance, and achievements — but Massachusetts does.
Parent education levels, for example, which are among the best predictors of student success, are among the highest in Massachusetts. Of children in the state, 63.4% have at least one parent with a college degree, the fourth highest such share of all states. Per-pupil spending in the state, at $14,569, while not in the top 10 is still well above the national average per-pupil expenditure of $12,526. Also, overall K-12 student achievement in Massachusetts is better than in any other state. Half or more of fourth and eighth graders in Massachusetts are proficient in math. For reference, only about 39% of fourth graders and 32% of eighth graders nationwide are proficient in math.
[in-text-ad]

2. New Jersey
> High school graduation rate: 90.1% (2nd highest)
> Public school spending: $16,337 per pupil (6th highest)
> 8th grade NAEP proficiency: 46.2% (math) 40.6% (reading)
> Adults with at least a bachelor’s degree: 38.6% (4th highest)
> Adults 25-64 with incomes at or above national median: 60.0% (4th highest)
Like many states in the Northeast, New Jersey has among the highest per-pupil spending levels in the country. Adjusted for regional cost differences, the state public school system spends about $16,300 per pupil, sixth most in the country. Of the state’s total taxable resources, 4.8% goes towards education, second highest percentage in the country after only Vermont.
Higher spending on public education does not always guarantee better outcomes, but in New Jersey, the higher funding appears to have translated to good outcomes. The state’s fourth and eighth-grade students are among the top 10 in NAEP math and reading proficiency, and 16.3% of eighth graders are advanced in math, the second highest percentage among states.

3. Vermont
> High school graduation rate: 87.7% (11th highest)
> Public school spending: $20,795 per pupil (the highest)
> 8th grade NAEP proficiency: 42.1% (math) 43.8% (reading)
> Adults with at least a bachelor’s degree: 36.4% (8th highest)
> Adults 25-64 with incomes at or above national median: 53.4% (17th highest)
Vermont’s annual per pupil spending of $20,795 is the highest of all states. The public education investment, which funds school staff, supplies, and supports pre-K and kindergarten programs, helps make the state’s schools third best in the nation. The percentage of eligible students enrolled in pre-K and kindergarten programs, at 56.6% and 83.0%, respectively, are each among the highest of all states.
Equity in education funding has been a long-standing concern in the United States, and no state has particularly well-distributed educational resources or outcomes. However, by some measures Vermont’s school system is more equitable than most. For instance, the gap in test scores of children in low-income families and their higher income peers is close to the smallest of all states.

4. New Hampshire
> High school graduation rate: 88.2% (9th highest)
> Public school spending: $15,719 per pupil (8th highest)
> 8th grade NAEP proficiency: 46.3% (math) 45.0% (reading)
> Adults with at least a bachelor’s degree: 36.6% (7th highest)
> Adults 25-64 with incomes at or above national median: 57.4% (7th highest)
Parent education levels are among the best predictors of student success. In New Hampshire, close to two-thirds of children have at least one parent with a college degree, the highest proportion of all states, versus approximately half of children nationwide. A college education is one of the most reliable paths to gainful employment and financial stability, which in turn help families provide resources to support the success of children. Of children in New Hampshire, 77.3% are in families with incomes at least twice the poverty level, the highest such percentage of all states. The way in which resources lead to achievement is complicated, but financial stability can increase the likelihood of academic success. New Hampshire has the nation’s lowest poverty rate, at 7.3% of all residents.
Likely due in part to this strong foundation, New Hampshire student achievements on standardized tests are some of the highest in the country. For example, 45.9% and 45.0% of fourth and eighth graders are proficient in reading — each second largest share among states.
[in-text-ad-2]

5. Connecticut
> High school graduation rate: 87.4% (15th highest)
> Public school spending: $17,283 per pupil (5th highest)
> 8th grade NAEP proficiency: 36.1% (math) 43.3% (reading)
> Adults with at least a bachelor’s degree: 38.6% (4th highest)
> Adults 25-64 with incomes at or above national median: 61.5% (3rd highest)
Preschool can be important for childhood development, and in Connecticut, a larger share of children gain this advantage than in any other state. Of the state’s 3- and 4-year-olds, 65.6% are enrolled in preschool, compared to the 47.7% of the nation’s preschool aged children. Kindergarten enrollment in the state, at 80.7%, is third highest in the country.
The strong early childhood education programs in the state may partially explain students’ success in later years. For example, 43.5% of fourth graders and 43.3% of eighth graders in the state’s public schools are proficient in reading, each the fourth largest share of any state and well above the comparable nationwide shares of 34.8% and 32.7%, respectively. Additionally, the state’s public schools report more high scoring advanced placement test scores — adjusted to the 11th and 12th grade student body — than all but two other states.
6. Maryland
> High school graduation rate: 87.6% (12th highest)
> Public school spending: $13,075 per pupil (19th highest)
> 8th grade NAEP proficiency: 34.7% (math) 37.4% (reading)
> Adults with at least a bachelor’s degree: 39.3% (3rd highest)
> Adults 25-64 with incomes at or above national median: 61.6% (2nd highest)
Maryland’s education system ranks as sixth best in the country and the best among southern states. The typical Maryland household earns $78,945 a year, the highest median income of any state. With a strong tax base, Maryland’s education spending is relatively high. The state allocates about 3.7% of its taxable resources to education, more than the 3.3% average among states. Monetarily, the state spends $13,075 per pupil per year, about $500 more than is typical.
By several measures, Maryland public schools are high achieving. The state boasts the best ratio of high scoring AP tests per 100 11th and 12th graders in the country. Additionally, some 87.6% of high school students in the state graduate with a diploma, compared to only 84.1% of high schoolers nationwide.
[in-text-ad]
7. Wyoming
> High school graduation rate: 80.0% (12th lowest)
> Public school spending: $17,700 per pupil (4th highest)
> 8th grade NAEP proficiency: 35.3% (math) 36.0% (reading)
> Adults with at least a bachelor’s degree: 27.1% (11th lowest)
> Adults 25-64 with incomes at or above national median: 51.7% (21st highest)
Wyoming is the only state entirely located west of the Mississippi River with a public school system that ranks among the nation’s 10 best. While the connection between school spending and educational outcomes is a matter for debate, Wyoming allocates a larger than typical share of its budget to its public school system. Some 4.7% of Wyoming’s taxable resources goes towards education — higher than the average spending across all states of 3.3% and the fourth largest share among states. Partially as a result, every public school student in the state benefits from greater spending on a per pupil basis than the national average.
Wyoming public school students are also more likely than most to meet some important achievement targets. For example, 41.2% of fourth graders in the state are proficient in reading, and 35.3% of eighth graders are proficient in math, compared to the respective 34.8% and 32.1% shares nationwide.

8. Pennsylvania
> High school graduation rate: 86.1% (21st highest)
> Public school spending: $15,291 per pupil (9th highest)
> 8th grade NAEP proficiency: 36.0% (math) 39.1% (reading)
> Adults with at least a bachelor’s degree: 30.8% (22nd highest)
> Adults 25-64 with incomes at or above national median: 53.2% (18th highest)
The majority of the best public school systems are clustered in the Northeast — and Pennsylvania’s is one of them. As is the case in most states with strong public school systems, Pennsylvania schools are well funded. About 95% of public school students in the state attend districts with higher than average per-pupil expenditures.
Public school students in the state are more likely to be able to read at the appropriate level than students in the vast majority of other states. Some 41.2% of fourth graders and 39.1% of eighth graders in the state are proficient in reading, each the seventh largest shares among states.

9. New York
> High school graduation rate: 80.4% (13th lowest)
> Public school spending: $18,665 per pupil (3rd highest)
> 8th grade NAEP proficiency: 30.9% (math) 32.8% (reading)
> Adults with at least a bachelor’s degree: 35.7% (9th highest)
> Adults 25-64 with incomes at or above national median: 55.0% (13th highest)
Equity has been a long-standing concern in the U.S. education system. And while education resources are not distributed perfectly in any state, some states do far more than others to narrow the gap. New York, home to the largest city in the nation, is one such state. Between 2003 and 2015, the achievement gap between eighth graders living in poverty and their wealthier peers narrowed by the largest amount of all states. Widely accessible, free to the public preschool likely helped shrink achievement gaps. Just over 58% of 3- and 4-year old children in New York are enrolled in preschool, the third highest percentage of all states. Well-funded public school systems in turn help provide these early education programs. Annual public school funding totals $18,665 per pupil in New York, the third highest expenditure of all states.
[in-text-ad-2]

10. Minnesota
> High school graduation rate: 82.2% (16th lowest)
> Public school spending: $12,692 per pupil (22nd highest)
> 8th grade NAEP proficiency: 47.8% (math) 39.7% (reading)
> Adults with at least a bachelor’s degree: 34.8% (11th highest)
> Adults 25-64 with incomes at or above national median: 58.1% (6th highest)
Children raised by parents who are relatively financially secure and well educated are often better equipped to succeed academically. In Minnesota, 64.1% of children are raised by at least one parent with a college degree or higher, the second largest such share of any state. Additionally, 69.4% of children in the state live in families with incomes that are at least double the poverty level — one of the largest such shares of any state. Partially as a result, public school students in the state report near nation-leading outcomes in some measures. For example, 53.4% of fourth graders and 47.8% of eighth graders are proficient in math, each the second highest share of any state, trailing only Massachusetts.
While large shares of students in Minnesota have relatively stable home lives, not all benefit from equal funding at school. The best funded school districts in Minnesota receive about $4,290 more in funding per pupil then those with the lowest funding. Partially as a result, only about 45% of students in the state live in districts with above average per-pupil spending.

11. Rhode Island
> High school graduation rate: 82.8% (20th lowest)
> Public school spending: $15,002 per pupil (10th highest)
> 8th grade NAEP proficiency: 32.0% (math) 34.8% (reading)
> Adults with at least a bachelor’s degree: 34.1% (12th highest)
> Adults 25-64 with incomes at or above national median: 56.4% (11th highest)
While Rhode Island’s public school system ranks better than most in the country, it lags behind most others in New England and the Northeast in general. The state has considerable room for improvement in its kindergarten enrollment rate. Only 74.7% of eligible children are enrolled in kindergarten, one of the lowest such shares in the country and considerably smaller than the national kindergarten enrollment rate of 78.3%.
In other measures, such school funding, Rhode Island excels. Every child in the state lives in a district where per-pupil expenditures are at or above the national average. Only seven other states have similarly wide-spread high spending.
[in-text-ad]

12. Maine
> High school graduation rate: 87.0% (17th highest)
> Public school spending: $15,912 per pupil (7th highest)
> 8th grade NAEP proficiency: 35.4% (math) 35.6% (reading)
> Adults with at least a bachelor’s degree: 30.1% (25th highest)
> Adults 25-64 with incomes at or above national median: 49.1% (21st lowest)
Though Maine’s schools outrank those in the vast majority of states, they trail the education systems of every other New England state. Some 35.6% of fourth graders in Maine are proficient in reading — a larger share than the 34.8% of fourth graders nationwide who are but a smaller share than any other state in the region. Fourth grade reading proficiency rates are at least 40% across the rest of New England. By eighth grade, Maine’s reading proficiency rate overtakes that of Rhode Island but still trails other New England states.
The regional shortcomings in Maine schools are not likely attributable to inadequate school funding. The state allocates 4.3% of tax revenue to education, nearly the largest such share among states and well above the 3.3% average nationwide. Partially as result, the per-pupil spending in the state of nearly $16,000 a year is more than in all but six other states.
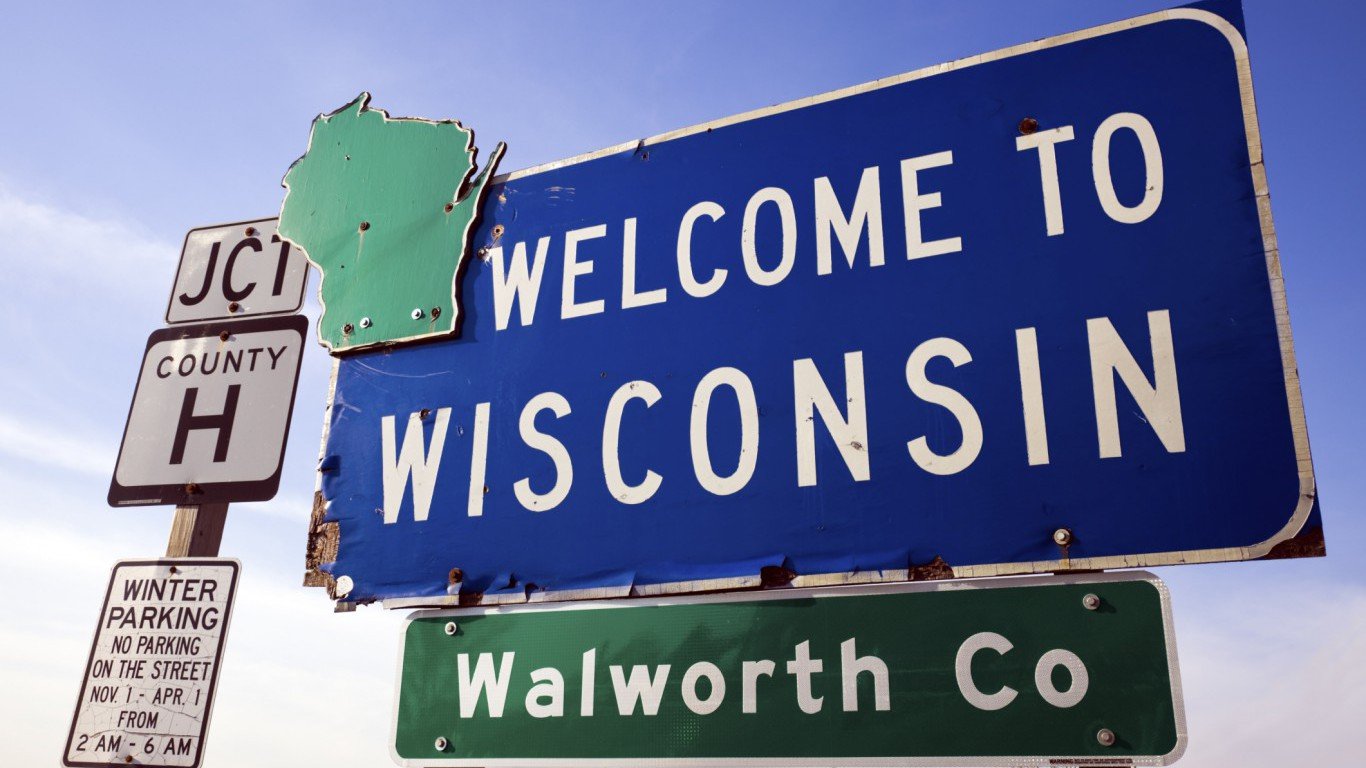
13. Wisconsin
> High school graduation rate: 88.2% (9th highest)
> Public school spending: $12,442 per pupil (24th highest)
> 8th grade NAEP proficiency: 40.8% (math) 39.0% (reading)
> Adults with at least a bachelor’s degree: 29.5% (23rd lowest)
> Adults 25-64 with incomes at or above national median: 53.0% (20th highest)
Wisconsin’s education system ranks as 13th best in the country and second best in the Midwest. One of the most telling metrics for any school system is its high school graduation rate, and Wisconsin’s is better than most. Some 88.2% of public high school students in the state graduate with a diploma, compared to 84.1% of high school students nationwide.
Students in Wisconsin tend to perform better than those in most states even before their high school years. Some 45.4% of fourth graders and 40.8% of eighth graders are proficient in math, compared to, respectively, 39.4% and 32.1% nationwide. Similarly, 36.9% of fourth graders and 39.0% of eighth graders in Wisconsin are proficient in reading compared to, respectively, 34.8% and 32.7% nationwide.
14. Virginia
> High school graduation rate: 86.7% (20th highest)
> Public school spending: $10,358 per pupil (15th lowest)
> 8th grade NAEP proficiency: 37.6% (math) 35.9% (reading)
> Adults with at least a bachelor’s degree: 38.1% (6th highest)
> Adults 25-64 with incomes at or above national median: 57.0% (9th highest)
After only Maryland, Virginia has the best school system in the South. Across several grade levels, students in Virginia outperform their counterparts in most other states by a number of measures. For example, among fourth graders in the state, 47.3% are proficient in math, and 42.9% are proficient in reading — well above the respective 39.4% and 34.8% shares nationwide. Additionally, there are more high scoring AP test results in the state — adjusted for the number of 11th and 12th graders — than in any other state except Maryland.
The success of students in Virginia is due in part to factors outside of the classroom. Students with college educated parents are more likely to succeed academically, and an estimated 59.0% of children in the state have at least one parent with a post-secondary education, the eighth largest share among states.
[in-text-ad-2]
15. North Dakota
> High school graduation rate: 87.5% (13th highest)
> Public school spending: $14,372 per pupil (12th highest)
> 8th grade NAEP proficiency: 39.2% (math) 33.7% (reading)
> Adults with at least a bachelor’s degree: 29.6% (25th lowest)
> Adults 25-64 with incomes at or above national median: 57.2% (8th highest)
Several indicators suggest students in North Dakota are more likely to succeed than students in most other states. Children raised in financially secure families with college-educated parents are more likely to succeed academically than those who are not. In North Dakota, 68.8% of children are in families with incomes at least double the poverty level income, a larger share than the 58.7% of children who do nationwide. Additionally, 64.0% of children in the state have at least one parent with a post-secondary degree, the third largest share among states. Such advantages outside of the classroom likely help boost the state’s graduation rate, which at 87.5% is better than in most states.
There is room for improvement in the state, however. Early childhood education can be critical to cognitive development, and North Dakota did not start funding pre-K programs until 2015. Partially as a result, only 31.1% of 3- and 4-year olds in the state attend pre-K, the second smallest share in the country.

16. Illinois
> High school graduation rate: 85.5% (25th highest)
> Public school spending: $13,403 per pupil (17th highest)
> 8th grade NAEP proficiency: 32.2% (math) 35.1% (reading)
> Adults with at least a bachelor’s degree: 34.0% (13th highest)
> Adults 25-64 with incomes at or above national median: 53.7% (15th highest)
Early education can be critical for a child’s social and cognitive development, and young children are more likely to be enrolled in a pre-K program in Illinois than the vast majority of other states. An estimated 55.8% of 3- and 4-year olds attend preschool, the sixth highest share of all states and well above the nationwide share of 47.7%.
The high early childhood education enrollment rates may partially explain slightly better outcomes of older Illinois students. For example, some 35.5% of fourth graders and 35.1% of eighth graders in the state are proficient in reading, compared to 34.8% of fourth graders and 32.7% of eighth graders nationwide.
[in-text-ad]

17. Iowa
> High school graduation rate: 91.3% (the highest)
> Public school spending: $13,102 per pupil (18th highest)
> 8th grade NAEP proficiency: 37.3% (math) 35.6% (reading)
> Adults with at least a bachelor’s degree: 28.4% (17th lowest)
> Adults 25-64 with incomes at or above national median: 53.2% (18th highest)
Graduation rates are one of the most important and often cited metrics for gauging the success of any school or school system. In Iowa, 91.3% of public high school students graduate with a diploma, the largest share of any state and considerably higher than the U.S. graduation rate of 84.1%. Additionally, fourth and eighth graders in the state are more likely to be proficient in math and reading than the typical American fourth or eighth grader.
There is room for improvement in other areas in Iowa schools, however. While students may graduate on time, relatively few are mastering higher level coursework. The state’s school system reports just 15 high scores on AP exams for every 100 11th and 12th graders, well below the U.S. average of 29 per 100 11th and 12th grade students.

18. Delaware
> High school graduation rate: 85.5% (25th highest)
> Public school spending: $14,224 per pupil (13th highest)
> 8th grade NAEP proficiency: 29.5% (math) 31.1% (reading)
> Adults with at least a bachelor’s degree: 31.0% (20th highest)
> Adults 25-64 with incomes at or above national median: 53.6% (16th highest)
Delaware allocates a smaller share of its budget to education than is typical. Only about 2.7% of the state’s taxable resources goes into its school system, one of the smallest shares among states and below the 3.3% average funding across states. Despite the lower school spending as a share of total state spending, most students in Delaware benefit from higher than average spending. Delaware schools spend the equivalent of $14,224 per student per year, more than most states and above the $12,526 average per pupil expenditure across the country.
Spending does not translate directly to results, however. Only 36.8% of fourth graders in the state and 29.5% of eighth graders are proficient in math, well below the comparable 39.4% and 32.1% shares nationwide.
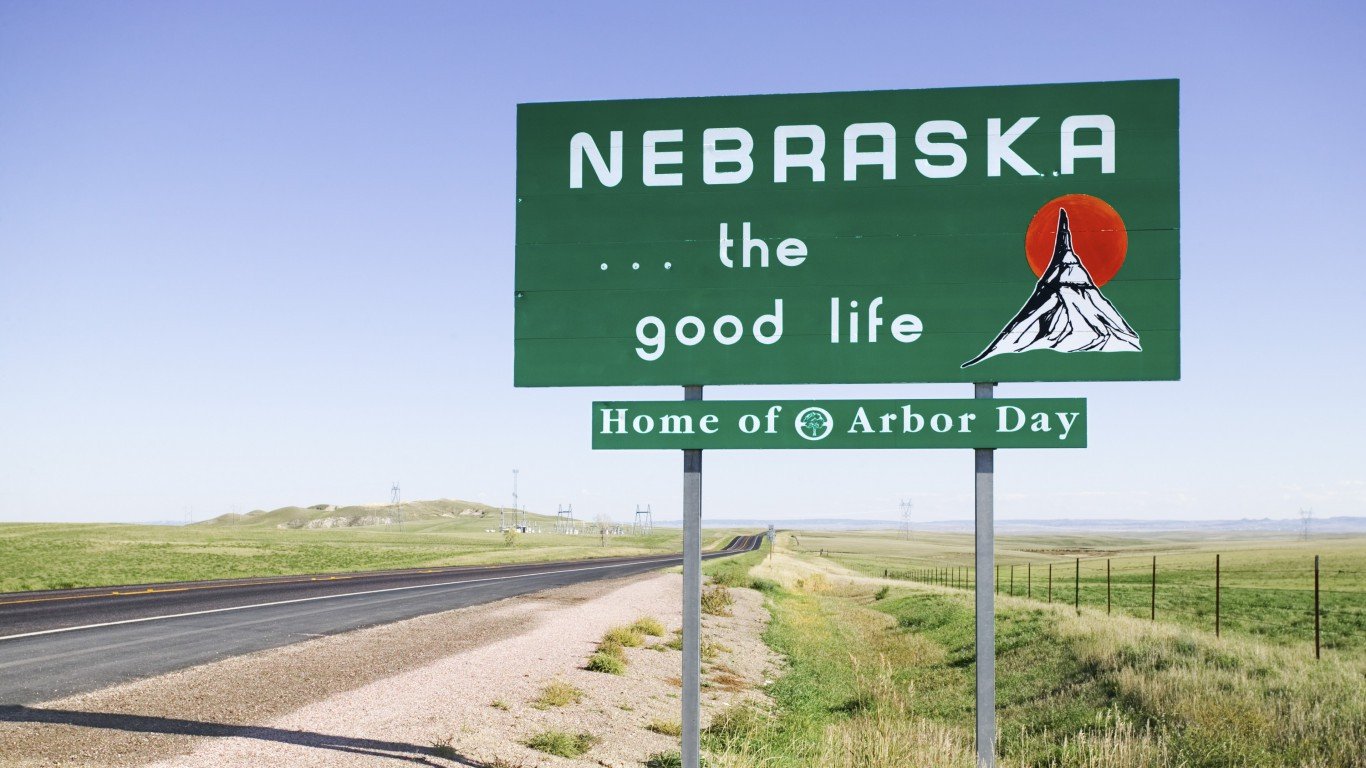
19. Nebraska
> High school graduation rate: 89.3% (4th highest)
> Public school spending: $14,028 per pupil (14th highest)
> 8th grade NAEP proficiency: 37.7% (math) 37.8% (reading)
> Adults with at least a bachelor’s degree: 31.4% (19th highest)
> Adults 25-64 with incomes at or above national median: 51.6% (23rd highest)
Early childhood education can be critical for students’ cognitive development. In Nebraska, only 41.5% of 3- and 4-year olds are enrolled in pre-K, and only 73.3% of eligible children are enrolled in kindergarten — each among the smallest shares of any state.
Early childhood education can increase the likelihood of success later in life, and despite the low early education enrollment rates, students in Nebraska are more likely than most to graduate from high school. Some 89.3% of high schoolers graduate with a diploma, the fourth highest graduation rate among states and well above the 84.1% U.S. graduation rate.
[in-text-ad-2]

20. Washington
> High school graduation rate: 79.7% (11th lowest)
> Public school spending: $10,395 per pupil (16th lowest)
> 8th grade NAEP proficiency: 39.3% (math) 37.4% (reading)
> Adults with at least a bachelor’s degree: 35.1% (10th highest)
> Adults 25-64 with incomes at or above national median: 56.9% (10th highest)
The typical Washington state household earns $67,106 a year, considerably more than the median household income nationwide of $57,617. While Washington’s tax base is stronger than that of most states, the state allocates a relatively small share of its funds to education. Washington uses only 2.8% of its taxable resources on education, below the 3.3% average across all states. Partially as a result, per-pupil spending in the state is lower than in most other states at about $10,395 per year, below the $12,526 national average per-pupil funding.
School budgets are only one factor in education outcomes, and despite the lower than typical spending, Washington schools perform well in several areas. For example, 46.9% of fourth graders and 37.4% of eighth graders are proficient in reading, the seventh and 12th highest shares among states.
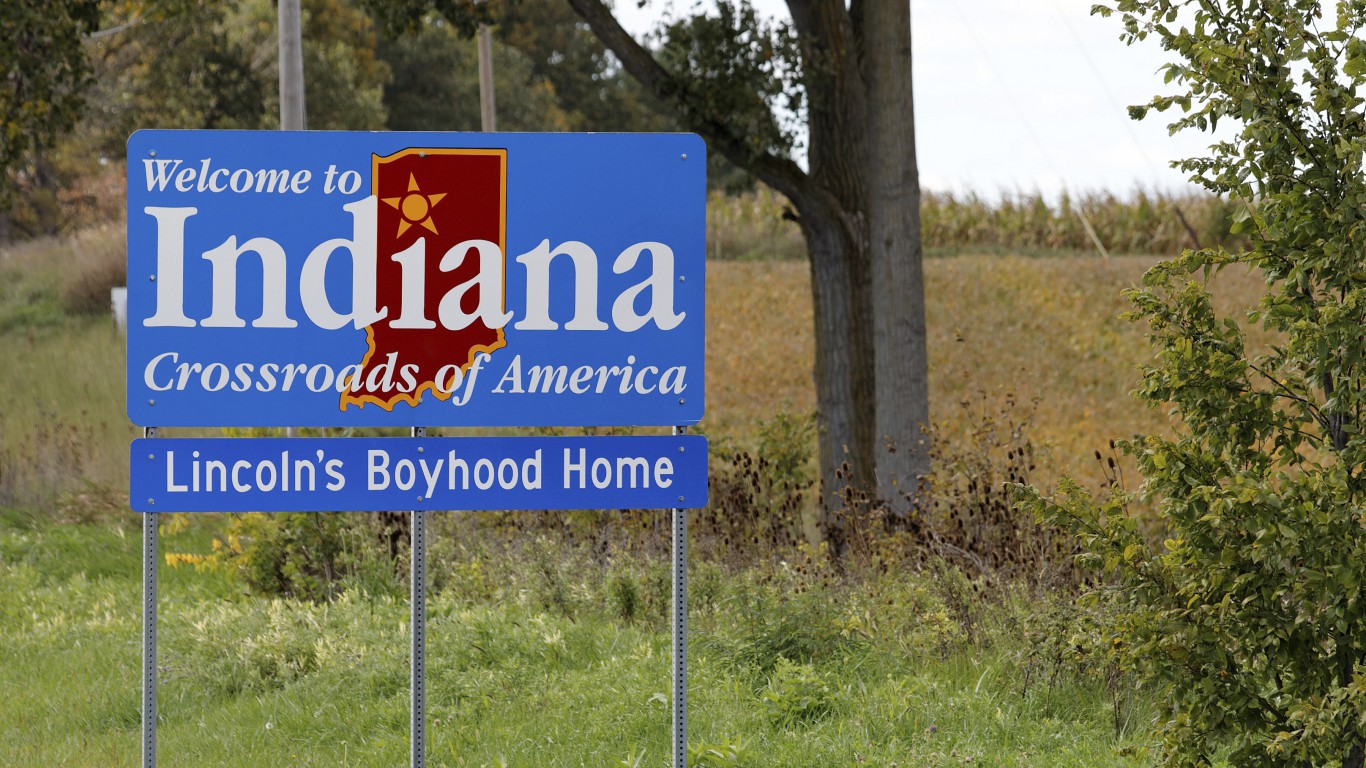
21. Indiana
> High school graduation rate: 86.8% (19th highest)
> Public school spending: $11,342 per pupil (21st lowest)
> 8th grade NAEP proficiency: 38.7% (math) 37.1% (reading)
> Adults with at least a bachelor’s degree: 25.6% (9th lowest)
> Adults 25-64 with incomes at or above national median: 48.5% (18th lowest)
Per-pupil school expenditures are lower in Indiana than in most states. The state spends the equivalent of $11,342 per student per year on education, below the average expenditure across all states of $12,526. Only 3.5% of students in Indiana live in districts where per-pupil spending matches or exceeds the national average spending.
However, better outcomes are never the result of higher spending alone, and by many measures, public school students in Indiana are excelling. Some 49.7% of fourth graders and 38.7% of eighth graders are proficient in math, well above the corresponding 39.4% and 32.1% shares of fourth and eighth graders nationwide.
[in-text-ad]

22. Ohio
> High school graduation rate: 83.5% (22nd lowest)
> Public school spending: $12,543 per pupil (23rd highest)
> 8th grade NAEP proficiency: 35.4% (math) 35.5% (reading)
> Adults with at least a bachelor’s degree: 27.5% (14th lowest)
> Adults 25-64 with incomes at or above national median: 50.4% (24th lowest)
A strong early childhood education is generally good policy as cognitive stimulation at a young age can greatly increase an individual’s chances of success later in life. In Ohio, there is apparent room for improvement. Only 44.4% of 3- and 4-year olds in the state are enrolled in pre-K, compared the 47.7% enrollment rate nationwide. Additionally, only 75.4% of eligible children in the state attend kindergarten, below the nationwide share of 78.3%.
Despite the slightly lower than typical enrollment in early childhood education programs, public school students in Ohio outperform their peers nationwide in several measures. For example, fourth and eighth graders in the state are more likely to be proficient in reading and math than the typical fourth or eighth grader nationwide.

23. Alaska
> High school graduation rate: 76.1% (4th lowest)
> Public school spending: $20,640 per pupil (2nd highest)
> 8th grade NAEP proficiency: 31.8% (math) 31.4% (reading)
> Adults with at least a bachelor’s degree: 29.6% (25th lowest)
> Adults 25-64 with incomes at or above national median: 59.6% (5th highest)
Few measures are as indicative of a school system’s overall quality as the graduation rate — and Alaska’s is one of the lowest of any state. Only 76.1% of high school students graduate with a diploma compared to 84.1% of high school students nationwide. The low graduation rate is partially the result of students not mastering course material in critical years. Among fourth graders in the state, only 35.1% are proficient in math and 29.9% are proficient in reading, compared to 39.4% and 34.8% of fourth graders nationwide. Eighth graders in Alaska are also less likely to be proficient in reading and math compared to the typical eighth grader nationwide.
While Alaska’s per-pupil annual education spending of $20,640 is nearly the most of any state, much of it is necessitated by challenges unique to the state, namely its size and climate. As a result, the state’s education budget is not comparable to that of most states.
24. Montana
> High school graduation rate: 85.6% (24th highest)
> Public school spending: $13,849 per pupil (15th highest)
> 8th grade NAEP proficiency: 38.9% (math) 36.9% (reading)
> Adults with at least a bachelor’s degree: 31.0% (20th highest)
> Adults 25-64 with incomes at or above national median: 46.0% (11th lowest)
Children facing fewer risk factors, like living in poverty, are often at an advantage academically. In Montana, 59.4% of children live in families with an annual income at least double the poverty level income — roughly in line with the 58.7% share of children nationwide. Montana’s 85.6% high school graduation rate also closely mirrors the U.S. graduation rate of 84.1%.
In other ways, students in Montana are dissimilar from the typical American public school student. For example, fourth and eighth graders in the state are more likely than the typical student to be proficient in math and reading. However, 11th and 12th graders in Montana are less likely to have mastered advanced placement course material.
[in-text-ad-2]

25. Colorado
> High school graduation rate: 78.9% (6th lowest)
> Public school spending: $9,733 per pupil (10th lowest)
> 8th grade NAEP proficiency: 36.9% (math) 38.2% (reading)
> Adults with at least a bachelor’s degree: 39.9% (2nd highest)
> Adults 25-64 with incomes at or above national median: 56.0% (12th highest)
Educational outcomes are mixed for Colorado public schools. For example, fourth and eighth graders in the state are more likely to be proficient in reading and math than students nationwide. Additionally, 11th and 12th graders in the state are more likely than the typical 11th or 12th grader to score well on advanced placement tests.
In other areas, Colorado schools have considerable room for improvement. Only 78.9% of high school students in the state graduate with a diploma, one of the lowest graduation rates of any state school system. States with better-funded school systems often report better outcomes than schools with smaller budgets, and Colorado spends the equivalent of only $9,733 per pupil per year, well below the average per pupil spending nationwide of $12,526.

26. Hawaii
> High school graduation rate: 82.7% (19th lowest)
> Public school spending: $13,436 per pupil (16th highest)
> 8th grade NAEP proficiency: 30.0% (math) 25.7% (reading)
> Adults with at least a bachelor’s degree: 31.9% (18th highest)
> Adults 25-64 with incomes at or above national median: 53.9% (14th highest)
Children facing fewer risk factors, like living in poverty, are often at an advantage academically. In Hawaii, 72.3% of children live in families with incomes at least double the poverty level, nearly the largest such share of any state and well above the 58.7% share of American children nationwide. Public school students in the state also benefit from relatively well and equitably funded schools. The state spends the equivalent of $13,436 per pupil per year, compared to $12,526 average per-pupil spending nationwide. Hawaii is one of only a handful of states in which every public school student attends a district with higher than average education spending.
Still, relative financial security at home and high education spending are no guarantee of widespread academic success, and in Hawaii, only 82.7% of high school students graduate with a diploma — a smaller share than the U.S. high school graduation rate of 84.1%.
[in-text-ad]

27. Kansas
> High school graduation rate: 85.7% (23rd highest)
> Public school spending: $11,761 per pupil (25th lowest)
> 8th grade NAEP proficiency: 33.2% (math) 34.8% (reading)
> Adults with at least a bachelor’s degree: 32.8% (15th highest)
> Adults 25-64 with incomes at or above national median: 51.2% (24th highest)
Though Kansas allocates 3.6% of its taxable resources to education spending — more than the 3.3% average spending across all states — per-pupil school spending is still relatively low. Kansas spends $11,761 per pupil per year on public schools, about $800 less than the average per-pupil expenditure across all states.
Better-funded school systems often report better outcomes and greater investment in public schools lead to some needed improvement in Kansas schools. Nationwide, the share of fourth and eighth graders proficient in math climbed by 5.9 and 5.2 percentage points between 2003 and 2015. Kansas is the only state in the country to report a decline in the share of both fourth and eighth graders proficient in math over the same period.
28. Kentucky
> High school graduation rate: 88.6% (7th highest)
> Public school spending: $10,945 per pupil (18th lowest)
> 8th grade NAEP proficiency: 27.7% (math) 36.1% (reading)
> Adults with at least a bachelor’s degree: 23.4% (5th lowest)
> Adults 25-64 with incomes at or above national median: 47.4% (15th lowest)
More affluent states tend to report better academic outcomes among public school students, but Kentucky is relatively poor. Some 18.5% of Kentucky residents live below the poverty line, one of the highest poverty rates among states and well above the 14.0% U.S. poverty rate. While the achievement gap between students living in poverty and those who are not is closing nationwide, Kentucky is one of only a handful of states where the gap between poorer fourth and eighth graders and those in financially secure families is growing.
Despite some discouraging trends, public school students in Kentucky are more likely to graduate than those in most other states. Some 88.6% of Kentucky high schoolers graduate with a diploma compared to 84.1% of high school students nationwide.
29. Florida
> High school graduation rate: 80.7% (14th lowest)
> Public school spending: $9,737 per pupil (11th lowest)
> 8th grade NAEP proficiency: 26.1% (math) 30.3% (reading)
> Adults with at least a bachelor’s degree: 28.6% (19th lowest)
> Adults 25-64 with incomes at or above national median: 42.9% (3rd lowest)
Florida’s public schools receive some of the lowest funding of any state school system in the country. The state allocates only 2.7% of its taxable resources to school funding, well below the 3.3% average funding across all state school systems. Partially as a result, annual per-pupil education spending is only $9,737, or about $2,800 less than the typical spending nationwide.
Despite potentially inadequate funding, by some measures, Florida’s school system is relatively successful. For example, Florida has the fifth highest number of high AP test scores of any state relative to the number of 11th and 12th grade students in the state. Improving markedly in recent years, between 2000 and 2014, the number of high advanced placement test scores per 100 juniors and seniors climbed by 28.2, the third greatest improvement of any state.
[in-text-ad-2]

30. Utah
> High school graduation rate: 85.2% (24th lowest)
> Public school spending: $7,207 per pupil (the lowest)
> 8th grade NAEP proficiency: 37.9% (math) 38.0% (reading)
> Adults with at least a bachelor’s degree: 32.6% (17th highest)
> Adults 25-64 with incomes at or above national median: 50.9% (25th highest)
Students with college educated parents are more likely to excel academically than students with parents with lower educational attainment. In Utah, 61.8% of children are raised by at least one parent with a post-secondary degree, one of the largest such shares of any state.
While many public school students in Utah may benefit from a supportive home environment, the state government may not be doing enough for students inside the classroom. Utah spends only $7,207 per pupil on public education annually, the least of any state and about $5,300 less than the average per-pupil expenditure across all states. Despite potentially underfunded classrooms, fourth and eighth graders in the state are more likely than most in other state school systems to be proficient in reading and math.
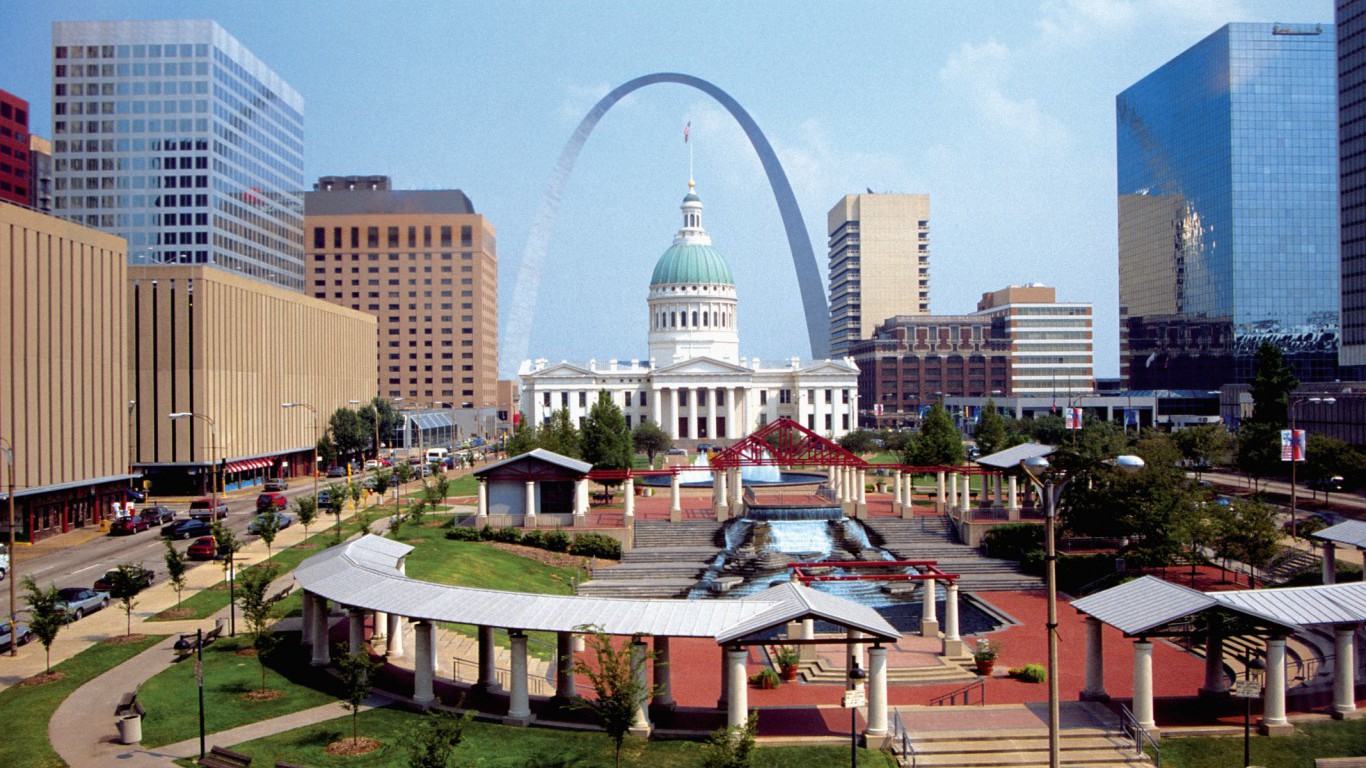
31. Missouri
> High school graduation rate: 89.0% (6th highest)
> Public school spending: $11,558 per pupil (23rd lowest)
> 8th grade NAEP proficiency: 31.4% (math) 36.3% (reading)
> Adults with at least a bachelor’s degree: 28.5% (18th lowest)
> Adults 25-64 with incomes at or above national median: 48.5% (18th lowest)
Equity in school funding is one of the most important measures in gauging the quality of a state’s school financing. In Missouri, the best funded schools receive about $3,342 more per pupil per year than those with the lowest funding and only 11.8% of students live in districts with above average per pupil education expenditures. As a result, the vast majority of public school students in the state may be at a disadvantage. Relatively low school spending may partially explain why the share of eighth graders who are proficient in reading has slipped by half a percentage point from 2003 to 2016, even as the vast majority of states are reporting improvements in that metric.
Missouri public schools do excel in some areas. For example, 89.0% of public high school students in the state graduate with a diploma, a larger share than in all but six other states.
[in-text-ad]

32. Georgia
> High school graduation rate: 79.4% (7th lowest)
> Public school spending: $9,742 per pupil (12th lowest)
> 8th grade NAEP proficiency: 28.4% (math) 30.2% (reading)
> Adults with at least a bachelor’s degree: 30.5% (23rd highest)
> Adults 25-64 with incomes at or above national median: 48.6% (19th lowest)
Students growing up in financially insecure environments can be at a considerable disadvantage academically. In Georgia, only 53.7% of children live in families with incomes at least double the poverty level income, a smaller share than the 58.7% of children nationwide. Additionally, Georgia spends only $9,742 per pupil per year on education, or about $2,800 less than the average per pupil expenditure among states. The relatively large share of low-income families and low school funding may partially explain some poor outcomes in Georgia’s public school system.
Only 79.4% of high school students in the state graduate with a diploma compared the 84.1% of students nationwide. Additionally, both fourth and eighth graders in Georgia are less likely to be proficient in math and reading than in most states.

33. Michigan
> High school graduation rate: 79.7% (11th lowest)
> Public school spending: $12,765 per pupil (21st highest)
> 8th grade NAEP proficiency: 28.5% (math) 31.8% (reading)
> Adults with at least a bachelor’s degree: 28.3% (16th lowest)
> Adults 25-64 with incomes at or above national median: 49.6% (23rd lowest)
Few state school systems report worse achievement metrics than Michigan. The share of fourth graders in Michigan public schools who are proficient in reading fell by 2.5 percentage points between 2003 and 2015, even as the share improved by 4.9 percentage points nationwide over the same period. Today, only 28.6% of fourth graders in the state are proficient in reading, well below the 34.8% share nationwide. Both fourth and eighth graders in Michigan are less likely to be proficient in math and reading than the typical American public school student in the same grades.
Improved mastery of basic skills would likely go a long way to improve graduation rates in the state. Currently, only 79.7% of high school students in Michigan graduate with a diploma, well below the 84.1% U.S. graduation rate.

34. Oregon
> High school graduation rate: 74.8% (3rd lowest)
> Public school spending: $11,515 per pupil (22nd lowest)
> 8th grade NAEP proficiency: 33.7% (math) 35.7% (reading)
> Adults with at least a bachelor’s degree: 32.7% (16th highest)
> Adults 25-64 with incomes at or above national median: 48.9% (20th lowest)
Due in large part to low funding and subpar student achievement, Oregon’s public school system is worse than that of most states. Oregon spends $11,515 per pupil on education annually, about $1,000 less per pupil than the average national expenditure. While outcomes are not directly related to spending, greater investment in public education may go a long way to improve outcomes of public school students in the state. For example, fewer than 3 in every 4 high schoolers in Oregon graduate with a diploma, well below the 84.1% U.S. high school graduation rate.
[in-text-ad-2]

35. California
> High school graduation rate: 83.0% (21st lowest)
> Public school spending: $9,417 per pupil (8th lowest)
> 8th grade NAEP proficiency: 27.1% (math) 28.4% (reading)
> Adults with at least a bachelor’s degree: 32.9% (14th highest)
> Adults 25-64 with incomes at or above national median: 51.7% (21st highest)
California has the largest network of public schools in the country — and also one of the worst performing. Only 29.2% of fourth graders in the state are proficient in math, and only 27.8% are proficient in reading — each the third lowest share of any state. While low, the fourth grade reading proficiency rate is much improved from only a few years ago. Between 2003 and 2015, fourth grade reading proficiency increased by 7.0 percentage points, far outpacing the 4.9 percentage point improvement across the U.S. as a whole.
Children who are raised speaking English as a second language often face additional academic challenges at American public schools. Only 64.1% of California students have parents who are fluent english speakers, the smallest share of any state in the country.

36. Tennessee
> High school graduation rate: 88.5% (8th highest)
> Public school spending: $9,605 per pupil (9th lowest)
> 8th grade NAEP proficiency: 29.2% (math) 32.8% (reading)
> Adults with at least a bachelor’s degree: 26.1% (10th lowest)
> Adults 25-64 with incomes at or above national median: 45.4% (9th lowest)
Robust early childhood education programs in a state can help set students up for academic success in later years. In Tennessee, only 37.8% of 3- and 4-year olds are enrolled in pre-K, one of the smallest shares of any state and about 10 percentage points below the comparable U.S. enrollment figure. Additionally, only 74.9% of eligible children in the state are enrolled in kindergarten, below the 78.3% U.S. figure.
Greater enrollment in early childhood education programs may help boost poor academic achievement in the state. Currently, fourth graders in the state are less likely to be proficient in reading than the typical fourth grader nationwide, and eighth graders in Tennessee are less likely to be proficient in math.
[in-text-ad]
37. West Virginia
> High school graduation rate: 89.8% (3rd highest)
> Public school spending: $12,993 per pupil (20th highest)
> 8th grade NAEP proficiency: 20.5% (math) 27.2% (reading)
> Adults with at least a bachelor’s degree: 20.8% (the lowest)
> Adults 25-64 with incomes at or above national median: 43.8% (5th lowest)
Children from financially insecure families can be at a considerable disadvantage academically. West Virginia is one of the poorest states in the country, and only 49.7% of children in the state are raised in families with income at least twice the poverty level income. In comparison, 58.7% of children nationwide live in relatively financially stable families.
In some measures of academic achievement, West Virginia schools are lagging. For example, fourth and eighth graders in the state are less likely than those in most other states to be proficient in math and reading, and 11th and 12th graders are less likely to master advanced placement course material. Still, some 89.8% of high schoolers in the state graduate with a diploma, the third highest graduation rate of any state.
38. South Dakota
> High school graduation rate: 83.9% (23rd lowest)
> Public school spending: $11,133 per pupil (19th lowest)
> 8th grade NAEP proficiency: 33.7% (math) 34.4% (reading)
> Adults with at least a bachelor’s degree: 28.9% (22nd lowest)
> Adults 25-64 with incomes at or above national median: 50.7% (25th lowest)
South Dakota’s public school system is relatively poorly funded. The state allocates only 2.6% of its total annual budget to education, well below the 3.3% average expenditure across all states. Partially as a result, only about 11.2% of students in the state attend districts with higher than the national average per pupil spending. School budgets are only one factor that can impact academic success, and fourth and eighth graders are about as likely to be proficient in math and reading as their peers nationwide. High schoolers in the state are also about as likely to graduate with a diploma compared to the typical American high school student.

39. North Carolina
> High school graduation rate: 85.9% (22nd highest)
> Public school spending: $9,217 per pupil (6th lowest)
> 8th grade NAEP proficiency: 32.6% (math) 30.4% (reading)
> Adults with at least a bachelor’s degree: 30.4% (24th highest)
> Adults 25-64 with incomes at or above national median: 46.2% (12th lowest)
A well-funded school system can be tremendously beneficial for its students, and North Carolina has one of the most poorly funded school systems in the country. The state allocates only 2.3% of its tax revenues to education spending, the smallest share of any state. Monetarily, North Carolina spends $9,217 per student per year, one of the lowest per-pupil expenditures of any state and about $3,300 less than the U.S. average.
Better-funded schools often report better academic outcomes. Despite the lower spending, some 44.4% of fourth graders and 32.6% of eighth graders in the state are proficient in math, slightly higher than the respective 39.4% and 32.1% shares nationwide. Still, while fourth grade math proficiency rates are higher than typical, eighth graders in North Carolina are less likely to be proficient in reading than students in most other states.
[in-text-ad-2]

40. Texas
> High school graduation rate: 89.1% (5th highest)
> Public school spending: $8,485 per pupil (4th lowest)
> 8th grade NAEP proficiency: 32.3% (math) 28.0% (reading)
> Adults with at least a bachelor’s degree: 28.9% (22nd lowest)
> Adults 25-64 with incomes at or above national median: 49.3% (22nd lowest)
Students in financially stable households with college-educated parents can be at a considerable advantage academically. In Texas, only 52.9% of children are raised in households with incomes at least double the poverty level income, a smaller share than the 58.7% of children nationwide. Additionally, only 40.8% of children are raised by at least one parent with a college degree, well below the 49.6% of children nationwide.
Another disadvantage for public school students in Texas is low funding. The state’s education spending works out to only about $8,485 per student per year, one of the lowest per-pupil expenditures of any state and about $4,000 less than the U.S. average. Despite some disadvantages, some 89.1% of high schoolers in Texas graduate with a diploma, well above the 84.1% U.S. graduation rate.

41. South Carolina
> High school graduation rate: 82.6% (18th lowest)
> Public school spending: $11,178 per pupil (20th lowest)
> 8th grade NAEP proficiency: 25.7% (math) 27.8% (reading)
> Adults with at least a bachelor’s degree: 27.2% (13th lowest)
> Adults 25-64 with incomes at or above national median: 44.3% (6th lowest)
South Carolina allocates about 3.9% of taxable resources to education, more than most states and more than the 3.3% U.S. average. Despite education spending accounting for a larger than typical share of state resources, South Carolina is relatively poor, and as a result, the state spends less monetarily on education than most states at $11,178 per pupil per year — which is about $1,350 less than the average per-pupil spending across states.
As is often the case in states with relatively low per-pupil spending, South Carolina’s standardized test results have considerable room for improvement. For example, only about 1 in every 4 eighth graders in the state are proficient in math, one of the smallest shares in the country. Further, the state’s eighth grade math proficiency rate fell by 1.5 percentage points between 2003 and 2016, the largest decline of any state. Additionally, only 27.8% of eighth graders in South Carolina are proficient in reading, below the 32.7% U.S. average.
[in-text-ad]

42. Arkansas
> High school graduation rate: 87.0% (17th highest)
> Public school spending: $11,758 per pupil (24th lowest)
> 8th grade NAEP proficiency: 24.9% (math) 26.8% (reading)
> Adults with at least a bachelor’s degree: 22.4% (3rd lowest)
> Adults 25-64 with incomes at or above national median: 42.2% (2nd lowest)
Financial stability at home can greatly improve a child’s chance of success in the classroom. In Arkansas, only 47.7% of children live in families with income at least double the poverty level income, nearly the smallest share of any state in the country. Students with college-educated parents also have a greater chance for academic success, and only 39.3% of children in the state are raised by at least one parent with a post-secondary degree, below the 49.6% of children nationwide. Children in Arkansas may also be at a considerable disadvantage in the classroom. Only 12.9% of students attend districts with higher than per-pupil education spending than the national average.
Due to a confluence to these factors and more, Arkansas schools underperform in a number of important measures. Fourth and eighth graders in the state are less likely than most to be proficient in reading and math, and juniors and seniors in high school are less likely than most to score well on advanced placement tests.

43. Alabama
> High school graduation rate: 87.1% (16th highest)
> Public school spending: $10,142 per pupil (14th lowest)
> 8th grade NAEP proficiency: 17.2% (math) 25.6% (reading)
> Adults with at least a bachelor’s degree: 24.7% (7th lowest)
> Adults 25-64 with incomes at or above national median: 46.3% (13th lowest)
Alabama has one of the worst performing public school systems in the country. Only 26.1% of fourth graders and 17.2% of eighth graders in the state are proficient in math, each the smallest such share of any state.
For many, early childhood education can be tremendously beneficial for cognitive development, and in Alabama, relatively few children benefit from preschool programs. Only 42.9% of 3- and 4-year olds in the state are enrolled in pre-K, a smaller share than in most states and below the 47.7% average enrollment nationwide. Greater investment in education may help boost pre-K enrollment and standardized test scores in the state. Currently, only 1.9% of students in Alabama attends school districts with greater than average per-pupil education spending nationwide.

44. Arizona
> High school graduation rate: 79.5% (8th lowest)
> Public school spending: $8,131 per pupil (2nd lowest)
> 8th grade NAEP proficiency: 34.8% (math) 31.1% (reading)
> Adults with at least a bachelor’s degree: 28.9% (22nd lowest)
> Adults 25-64 with incomes at or above national median: 47.7% (16th lowest)
Children who are raised speaking English as a second language often face additional academic challenges at American public schools. In Arizona, only 79.4% of children are raised by parents who speak fluent English, one of the smallest shares of any state. This unique academic hurdle faced by a relatively large share of children may partially explain Arizona’s low graduation rate. Only 79.5% of high school students in the state graduate with a diploma compared to 84.1% of high school students nationwide.
The large share of ESL students and low graduation rate may suggest Arizona needs to invest more in its education system. The state spends only $8,131 per pupil per year on its public schools, the second lowest per-pupil education expenditure of any state in the country.
[in-text-ad-2]

45. Oklahoma
> High school graduation rate: 81.6% (15th lowest)
> Public school spending: $9,227 per pupil (7th lowest)
> 8th grade NAEP proficiency: 22.9% (math) 29.4% (reading)
> Adults with at least a bachelor’s degree: 25.2% (8th lowest)
> Adults 25-64 with incomes at or above national median: 46.0% (11th lowest)
Mastering a subject matter at a young age can be critical to academic success down the road as certain subjects are cumulative, building on concepts learned in previous years. Math is one such subject, perhaps more so than any other. In Oklahoma, the share of fourth graders who are proficient in math increased by 10.7 percentage points between 2003 and 2015, nearly the largest improvement in the country. Despite the improvement, Oklahoma lags behind much of the country in math proficiency. Only 36.7% of fourth graders and 22.9% of eighth graders are proficient in math, below the comparable 39.4% and 32.1% U.S. shares.
Children raised by parents not fluent in English face a host of unique challenges academically, and parts of Oklahoma are making concerted efforts to help accommodate their ESL students. Free Spanish language classes became available to Oklahoma City Public School employees in early 2018. One of the program’s intended functions is to allow educators to better communicate with Spanish speaking parents.
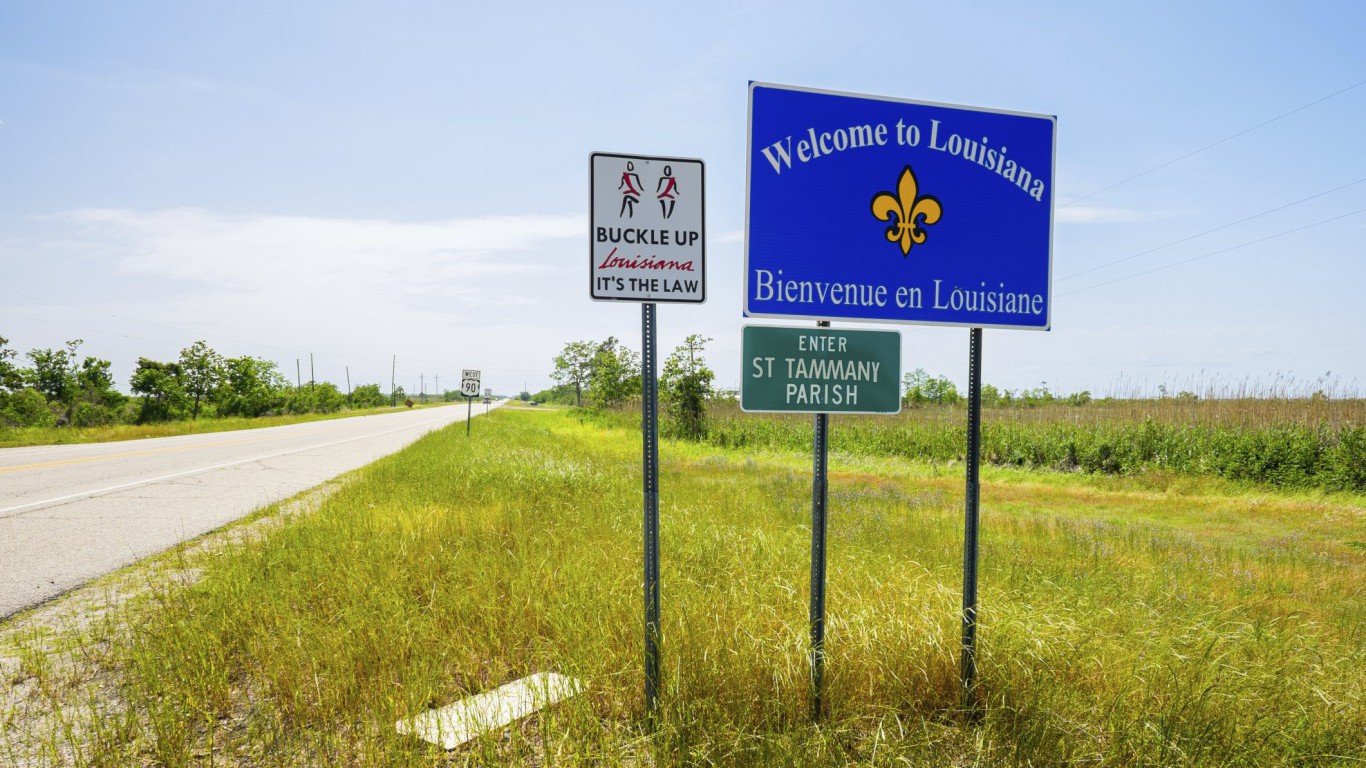
46. Louisiana
> High school graduation rate: 78.6% (5th lowest)
> Public school spending: $12,153 per pupil (25th highest)
> 8th grade NAEP proficiency: 17.9% (math) 23.3% (reading)
> Adults with at least a bachelor’s degree: 23.4% (5th lowest)
> Adults 25-64 with incomes at or above national median: 46.5% (14th lowest)
Children with college-educated parents are more likely to succeed academically than those raised by adults with only a high school education. In Louisiana, only 39.2% of children have at least one parent with a post-secondary degree, the smallest share of any state other than Nevada. Uneven funding throughout public schools in the state is an additional disadvantage for many students. Only 29.6% of Louisiana public school students attend districts with higher than average per pupil spending nationwide.
A confluence of these and other factors have led to some poor outcomes. For example, only 78.6% of high school students in the state graduate with a diploma, the fifth lowest graduation rate of any state. Additionally, only 17.9% of eighth graders in the state are proficient in math, the second smallest share of any state.
[in-text-ad]

47. Idaho
> High school graduation rate: 79.7% (11th lowest)
> Public school spending: $8,422 per pupil (3rd lowest)
> 8th grade NAEP proficiency: 34.0% (math) 37.2% (reading)
> Adults with at least a bachelor’s degree: 27.6% (15th lowest)
> Adults 25-64 with incomes at or above national median: 45.0% (8th lowest)
Idaho’s public school system is one of three western states to rank among the five worst in the country. A robust early childhood education program can have a positive impact on cognitive development. In Idaho, only 30.6% of 3- and 4-year olds are enrolled in pre-K, the smallest share of any state. Currently, Idaho is one of only a handful of states without a publicly funded pre-K system, despite the fact that 76% of voters would support spending for such a program, according to a recent poll.
Should state lawmakers implement a pre-K program, it could help improve outcomes in the Idaho’s underperforming public schools. Currently, only 79.7% of high school students in the state graduate with a diploma, below the 84.1% U.S. high school graduation rate.
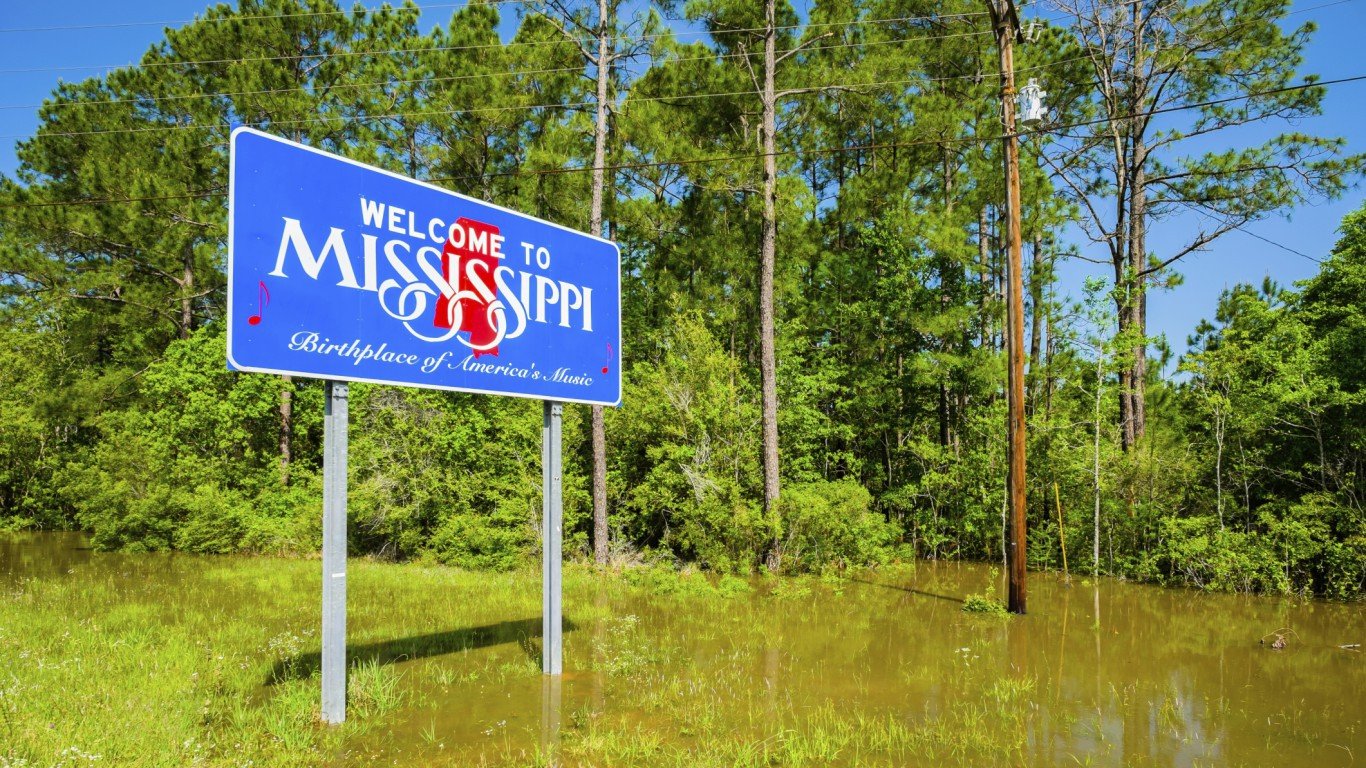
48. Mississippi
> High school graduation rate: 82.3% (17th lowest)
> Public school spending: $9,885 per pupil (13th lowest)
> 8th grade NAEP proficiency: 21.8% (math) 20.0% (reading)
> Adults with at least a bachelor’s degree: 21.8% (2nd lowest)
> Adults 25-64 with incomes at or above national median: 41.4% (the lowest)
State education rankings do not tend to change much over time, and states with the best and worst schools tend to cluster in particular regions. The picture is not entirely static, however, and notable improvements occurred last year in states in various regions. Mississippi is one such state. The poorest state in the nation had some of the largest gains in fourth and eighth grade achievement on math and reading tests between 2003 and 2015. Still, Mississippi remains the state with nearly the worst schools in the nation.
Getting a good start early in the school system is a key foundation in a child’s academic career. The likelihood a child will benefit from this foundation depends a great deal on the education and income level of his or her family. Mississippi has the nation’s lowest median household income and highest poverty rate. Of children in the state, most live in families earning incomes less than twice the poverty level, and only 42.8% of children have at least one parent with a college degree, each among the lowest such percentages of all states.
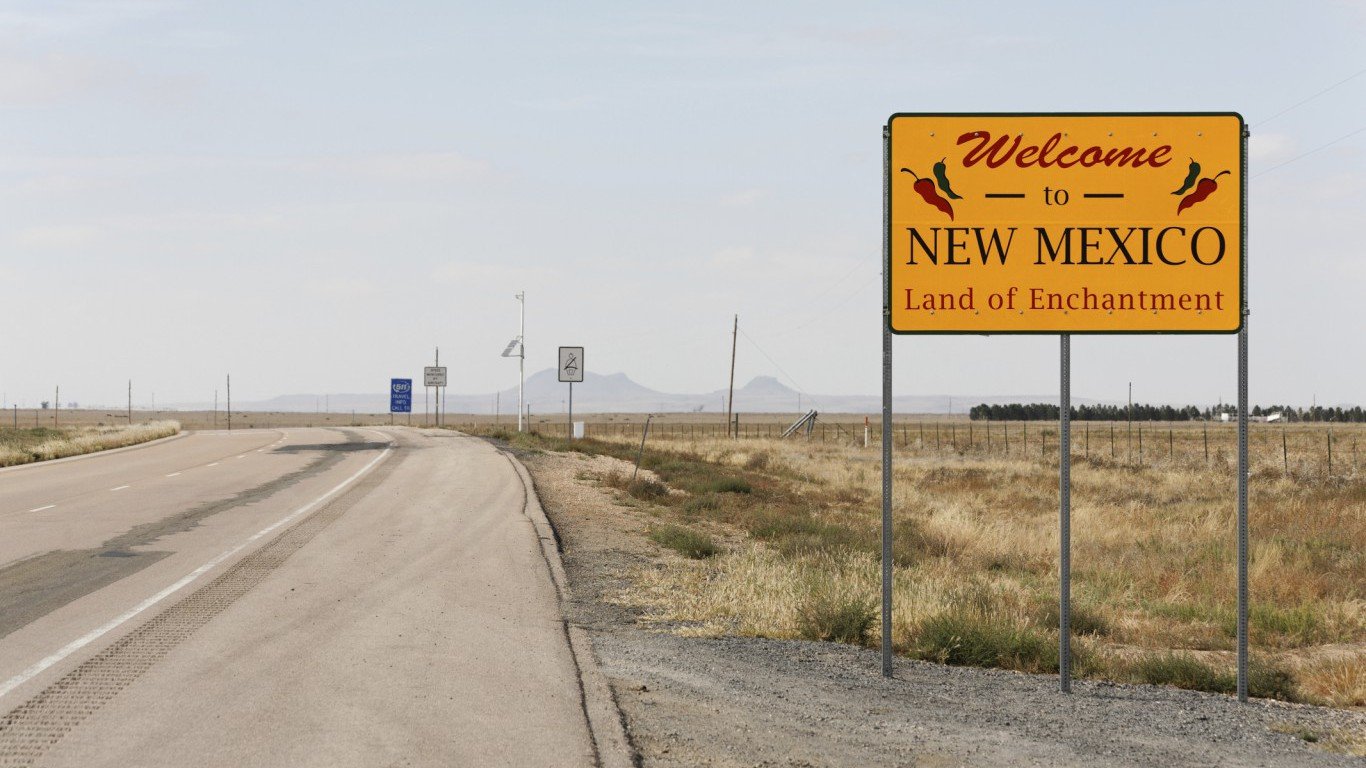
49. New Mexico
> High school graduation rate: 71.0% (the lowest)
> Public school spending: $10,768 per pupil (17th lowest)
> 8th grade NAEP proficiency: 20.6% (math) 20.1% (reading)
> Adults with at least a bachelor’s degree: 27.2% (13th lowest)
> Adults 25-64 with incomes at or above national median: 43.2% (4th lowest)
Students who speak English as a second language face unique academic challenges in U.S. schools. In New Mexico, only 82.1% of children are raised by parents who speak fluent English, one of the smallest shares of any state. Many students likely face additional hurdles outside of the classroom as only 45.2% of children are raised by at least one parent with a college degree, the smallest share of any state.
Due to these challenges and others, New Mexico public schools report some of the worst outcomes in the country. Only about 1 in 5 eighth graders in the state are proficient in reading, and a similar share of students are proficient in math, each nearly the smallest proficiency rates of any state. Reading and math skills build on themselves year after year, and the low proficiency rates may partially explain the state’s low graduation rate. Only 71.0% of high schoolers in the state graduate with a diploma, the smallest share of any state and well below the 84.1% comparable U.S. rate.
[in-text-ad-2]
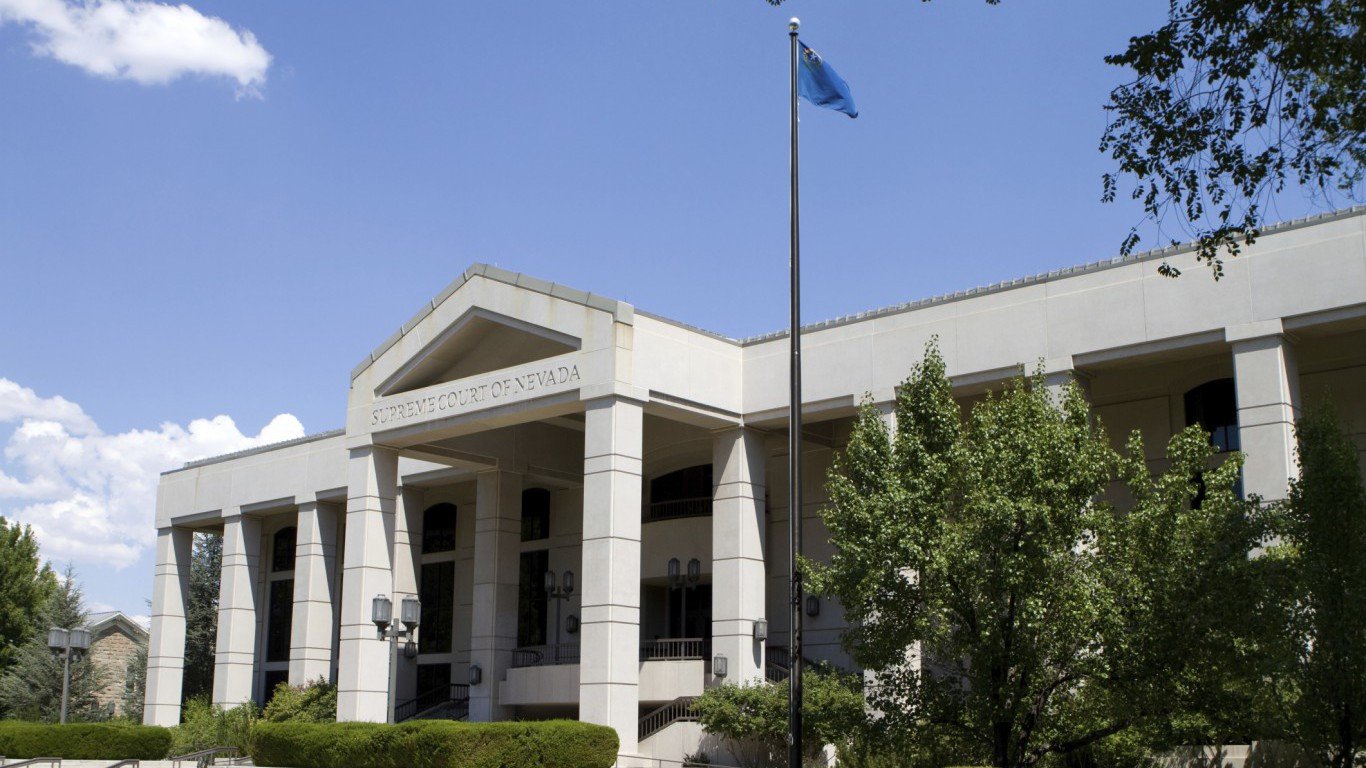
50. Nevada
> High school graduation rate: 73.6% (2nd lowest)
> Public school spending: $8,801 per pupil (5th lowest)
> 8th grade NAEP proficiency: 26.1% (math) 27.4% (reading)
> Adults with at least a bachelor’s degree: 23.5% (6th lowest)
> Adults 25-64 with incomes at or above national median: 44.6% (7th lowest)
Children brought up speaking a language other than English often struggle academically in U.S., english-speaking classrooms. In Nevada, only 73.8% of children are raised by parents who speak fluent English, one of the smallest shares of any state. Integrating ESL students requires additional funding, and Nevada appears to be falling short. The state spends only 2.8% of its taxable resources on schools, well below the 3.3% average across all states. The small share of state expenses the state spends on education translates to a low monetary funding of only $8,801 per student per year, which is about $3,700 less than is typical nationwide.
The low funding in conjunction with poor academic outcomes make Nevada’s school system the worst of any state. Only 73.6% of high school students in the state graduate on time, the second-lowest graduation rate after New Mexico.
Detailed findings:
A strong foundation at home is one of the best predictors of a child’s future academic achievement and success. Research suggests that children facing fewer risk factors, such as living in poverty, and with advantages such as well-educated parents, are more likely to succeed academically. A child from a high-income family may enjoy greater access to books and a personal computer as well as access to extracurricular activities that require some monetary investment. These educational tools and learning experiences are generally less available to poorer children.
In the United States, 58.7% of children are raised in families with incomes at least double the poverty level — a minimum level of income considered necessary for financial stability. A larger share of children live in such households in all but one of the states in the top half of the rankings. The share is greater than the national share in only five of the 25 lower ranked states.
A state’s spending on its public school system is only one factor related to the success of its students. Still, a school’s budget is important. “States with high overall grades in the report card tend to have relatively high spending” Lloyd said.
Across all states, public schools spend an average of $12,526 per pupil per year. In all but five of the 25 best ranking states, annual per pupil spending is higher than the national average.
Because school budgets are funded largely by property taxes as well as extensive private fundraising, a child from a high-income family is also more likely to attend school in a well-funded school district. Children attending such schools benefit from a range of additional advantages, including teachers with higher pay and greater qualifications. By contrast, families and school districts in low-income areas may not have the resources to help children get off to a good start.
Research indicates that pre-K programs benefit all children regardless of family income level, and preschool can be especially beneficial to children in poverty. Despite the higher stakes for low-income families, the likelihood of a child attending preschool is lower in states in which more families face financial instability.
Standardized test scores are by no means perfect measures of academic achievement, but they are among the only ways to compare student performance across states. Student test scores on the National Assessment of Educational Progress (NAEP) track closely with other school quality metrics. Nationwide, 39.4% of fourth grade students are proficient in mathematics, and 34.8% are proficient in reading. A larger share of students are proficient in math in all but five of the states in the top half of the rankings. Only one state in the top half of the rankings reports a lower share of fourth grade students who are proficient in reading.
Methodology:
24/7 Wall St. reviewed Education Week’s Quality Counts 2018 report. The education research center reviewed dozens of metrics grouped into three equally-weighted categories:
> The Chance-for-Success Index examines the role of education in promoting positive outcomes over the course of an individual’s lifetime.
> The School Finance Index evaluates spending on education and equity in funding across districts within a state.
> The K-12 Achievement Index, last updated in 2016 and containing data for the 2014-2015 school year, scores states on current academic performance, change over time, and poverty-based gaps.
We also considered each state’s median household income, poverty rate, the percentage of residents 25 and older with at least a high school diploma and the percentage with at least a bachelor’s degree from the U.S. Census’ Bureau’s 2016 American Community Survey. State monthly and annual unemployment rates came from the U.S. Bureau of Labor Statistics.
Graduation rates are defined as the percent of public high school students who graduated on time with a standard diploma for the 2015-2016 school year. All other data are for the most recent available year and are based on Education Week’s analysis of data from the U.S. Census Bureau and other sources.
Take the quiz below to get matched with a financial advisor today.
Each advisor has been vetted by SmartAsset and is held to a fiduciary standard to act in your best interests.
Here’s how it works:
1. Answer SmartAsset advisor match quiz
2. Review your pre-screened matches at your leisure. Check out the
advisors’ profiles.
3. Speak with advisors at no cost to you. Have an introductory call on the phone or introduction in person and choose whom to work with in the future
Take the retirement quiz right here.
Thank you for reading! Have some feedback for us?
Contact the 24/7 Wall St. editorial team.


 24/7 Wall St.
 24/7 Wall St.
 24/7 Wall St.
 24/7 Wall St.