
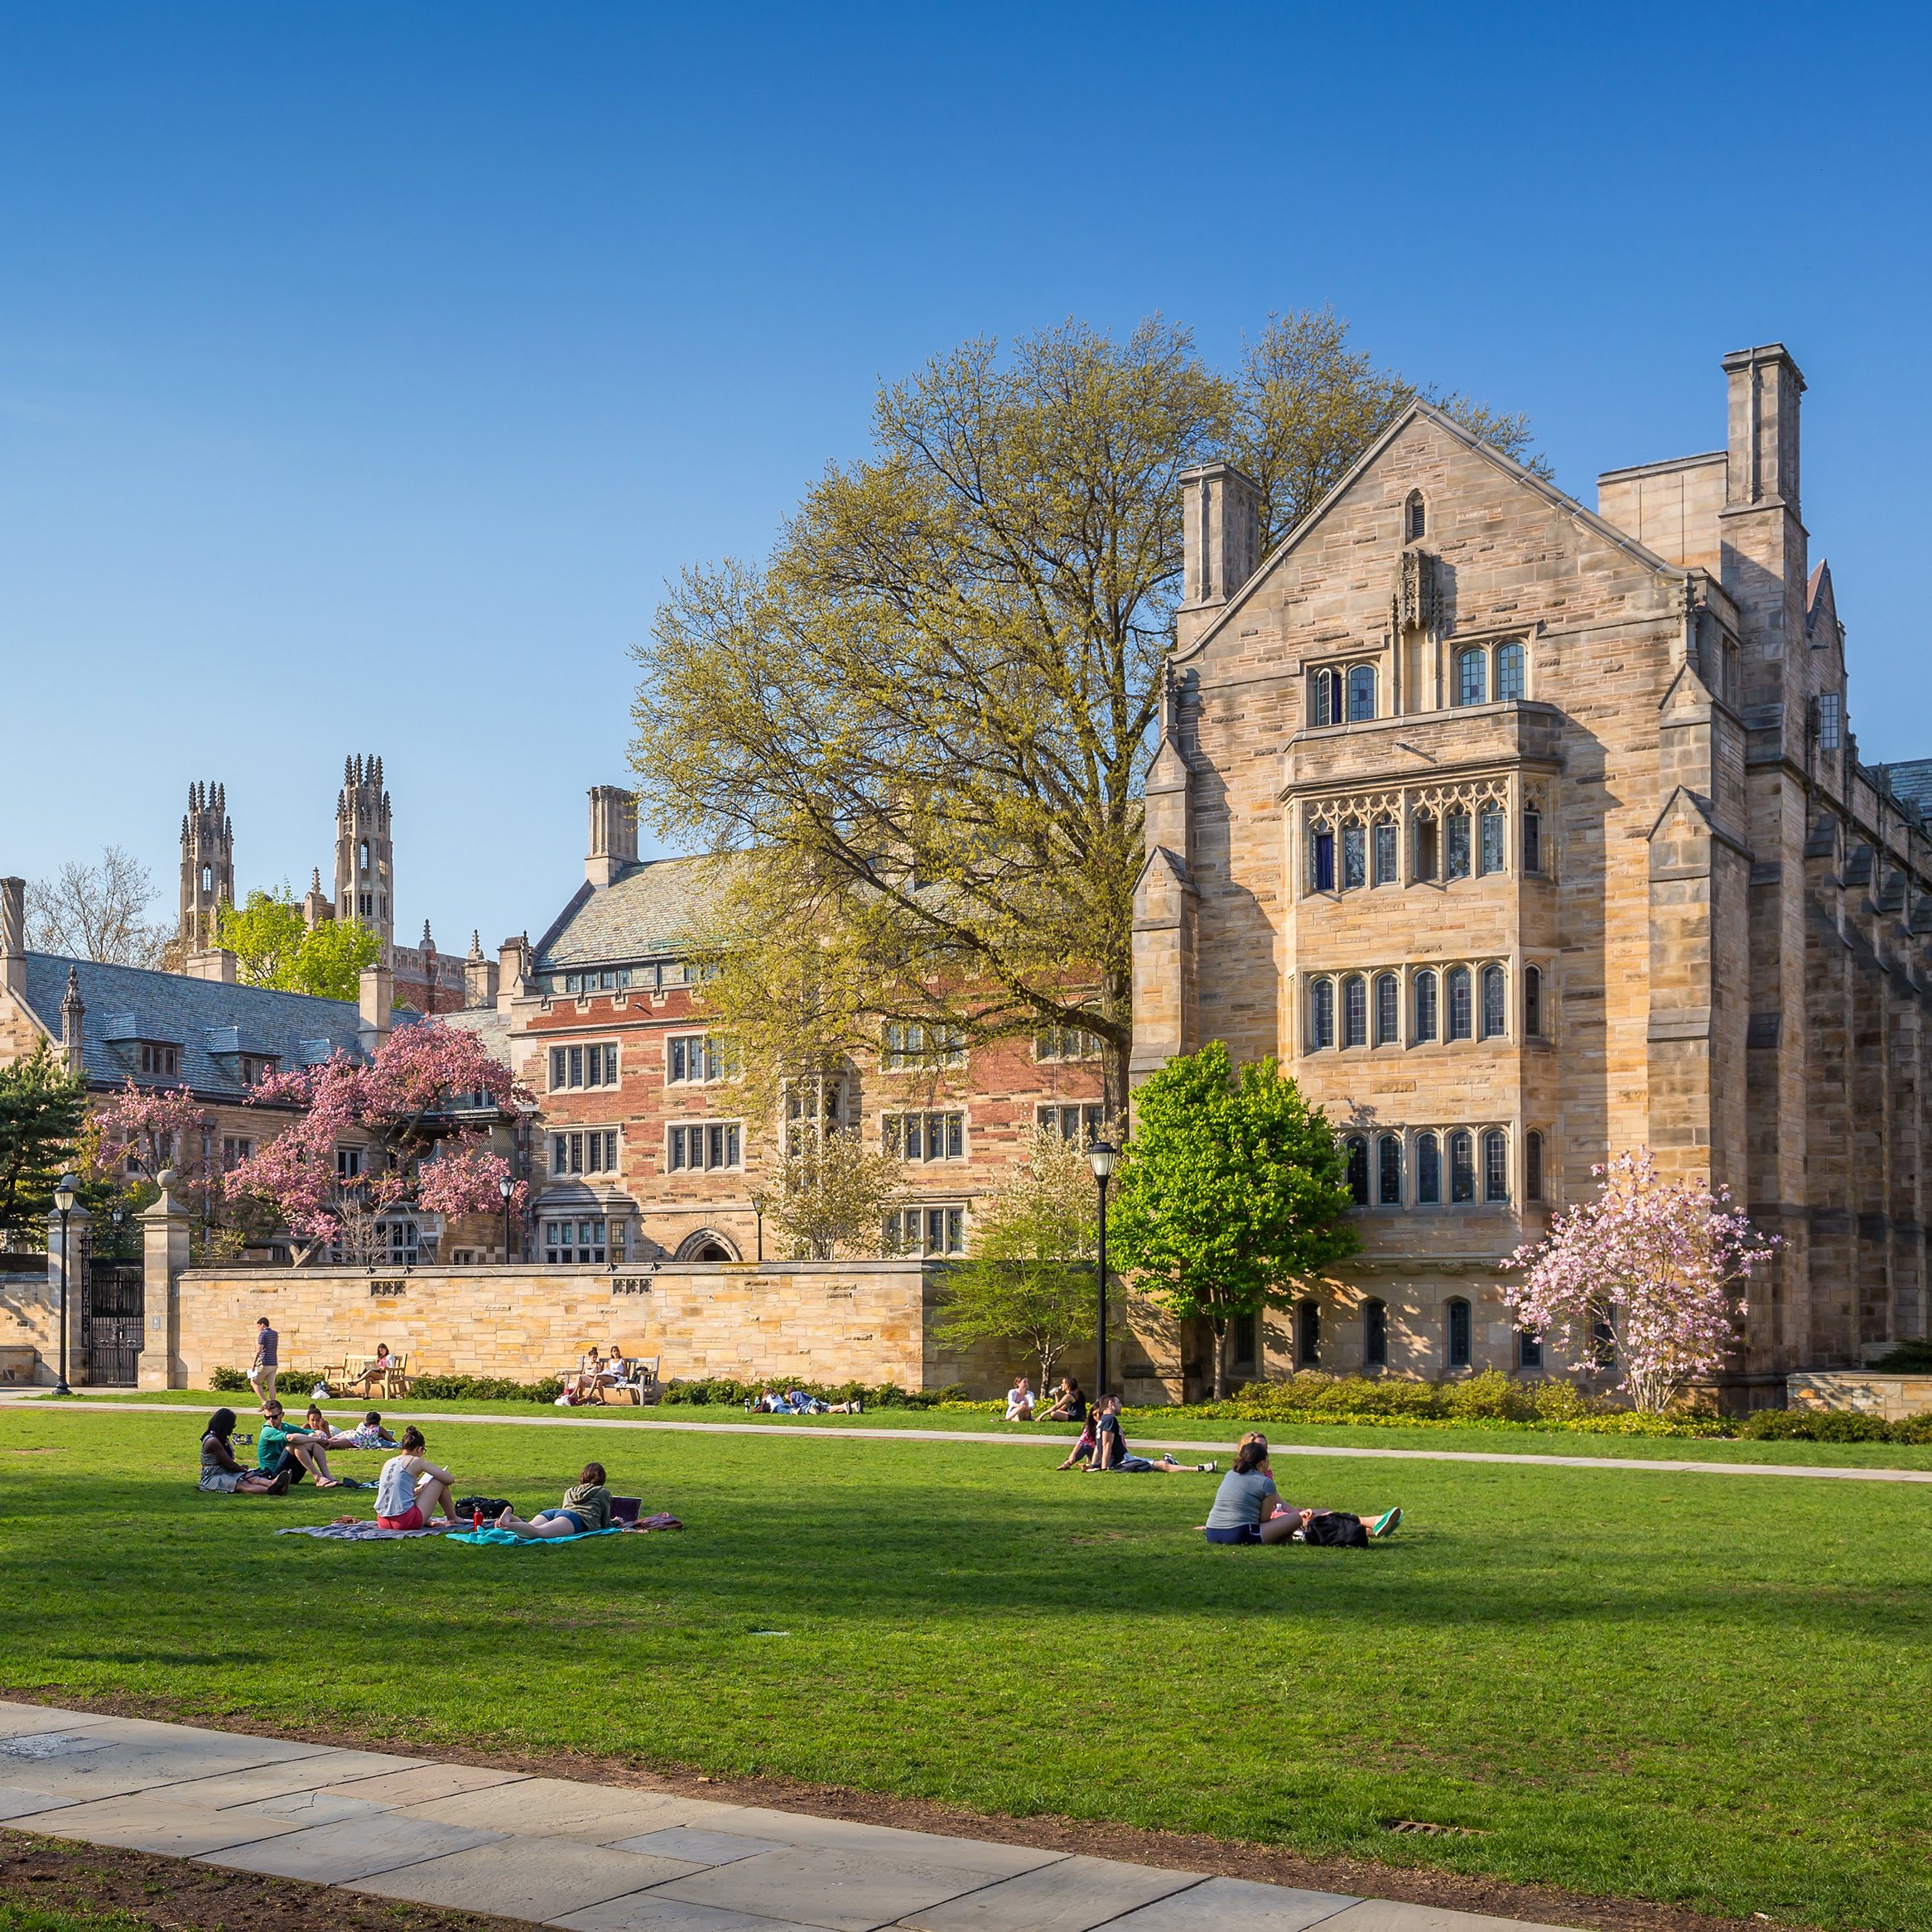
Since hitting 10.0% in October 2009 — its highest level in over two and a half decades — the unemployment rate has been steadily declining in the United States. Today, the unemployment rate sits at a healthy 4.1%. While much of the American workforce now has an easier time finding a job than they did nine years ago, there are dozens of jobs with unemployment rates reminiscent of those in the immediate wake of the Great Recession.
Due to a range of factors, including broad economic forces related to globalization and technological advances, certain jobs are becoming less secure. Today’s job market is more competitive than it was in decades past, and workers with higher educational attainment and more specialized skills are rewarded.
Not only are high-skill workers with higher educational attainment more likely to earn higher wages, but also they are far less likely to face the prospect of unemployment. For a number of highly specialized occupations, including tax examiners, dental hygienists, and statisticians, unemployment rates are only a fraction of a percentage point. Meanwhile, a number of lower-skilled occupations face the opposite extreme. Occupations such as dishwashers, produce sorters, and telemarketers have unemployment rates well into the double digits.
24/7 Wall St. reviewed unemployment rates by occupation from the Bureau of Labor Statistics to identify the workers with the best and worst job security. The 30 jobs with the highest job security have unemployment rates below 1.0%, while the 30 jobs with the lowest job security have unemployment rates of 7.5% or above.
Click here to see the jobs with the best job security.
Click here to see the jobs with the worst job security.
Click here to see our detailed findings and methodology.
Correction: Due to a data processing error, a previous version of the story incorrectly noted the typical entry level education requirements for six occupations on this list. For those same occupations, projected annual job growth and median annual wage, which were previously noted as N/A, have also been updated.

Source: PeopleImages / Getty Images
30. Statisticians
> Unemployment rate: 0.9% (tied – 25th highest job security)
> Labor force: 88,000
> Median annual wage: $80,500
> Proj. job growth 2016-2026: +33.4%
> Typical entry level edu. required: Master’s degree
[in-text-ad]

Source: Thinkstock
29. Insurance underwriters
> Unemployment rate: 0.9% (tied – 25th highest job security)
> Labor force: 105,000
> Median annual wage: $67,680
> Proj. job growth 2016-2026: -5.2%
> Typical entry level edu. required: Bachelor’s degree

Source: Thinkstock
28. Dentists
> Unemployment rate: 0.9% (tied – 25th highest job security)
> Labor force: 161,000
> Median annual wage: $158,120
> Proj. job growth 2016-2026: +19.1%
> Typical entry level edu. required: Doctoral or professional degree

Source: Thinkstock
27. Psychologists
> Unemployment rate: 0.9% (tied – 25th highest job security)
> Labor force: 189,000
> Median annual wage: $77,030
> Proj. job growth 2016-2026: +13.8%
> Typical entry level edu. required: Doctoral or professional degree
[in-text-ad-2]

Source: Thinkstock
26. Postal service mail carriers
> Unemployment rate: 0.9% (tied – 25th highest job security)
> Labor force: 309,000
> Median annual wage: $58,110
> Proj. job growth 2016-2026: -12.1%
> Typical entry level edu. required: High school diploma

Source: Thinkstock
25. Lawyers
> Unemployment rate: 0.9% (tied – 25th highest job security)
> Labor force: 1.2 million
> Median annual wage: $118,160
> Proj. job growth 2016-2026: +9.4%
> Typical entry level edu. required: Doctoral or professional degree
[in-text-ad]

Source: Thinkstock
24. Physician assistants
> Unemployment rate: 0.8% (tied – 21st highest job security)
> Labor force: 117,000
> Median annual wage: $101,480
> Proj. job growth 2016-2026: +37.4%
> Typical entry level edu. required: Master’s degree
 24/7 Wall St.
Source: Thinkstock
23. Speech-language pathologists
> Unemployment rate: 0.8% (tied – 21st highest job security)
> Labor force: 142,000
> Median annual wage: $74,680
> Proj. job growth 2016-2026: +17.5%
> Typical entry level edu. required: Master’s degree

Source: Thinkstock
22. Librarians
> Unemployment rate: 0.8% (tied – 21st highest job security)
> Labor force: 196,000
> Median annual wage: $57,680
> Proj. job growth 2016-2026: +8.9%
> Typical entry level edu. required: Master’s degree
[in-text-ad-2]

Source: Thinkstock
21. Special education teachers
> Unemployment rate: 0.8% (tied – 21st highest job security)
> Labor force: 426,000
> Median annual wage: $58,710
> Proj. job growth 2016-2026: +7.8%
> Typical entry level edu. required: Bachelor’s degree

Source: Thinkstock
20. Credit authorizers, checkers, and clerks
> Unemployment rate: 0.7% (tied – 17th highest job security)
> Labor force: 55,000
> Median annual wage: $36,930
> Proj. job growth 2016-2026: +2.8%
> Typical entry level edu. required: High school diploma
[in-text-ad]

Source: http://www.policehow.com/how-to-become-a-probation-officer.php
19. Probation officers and correctional treatment specialists
> Unemployment rate: 0.7% (tied – 17th highest job security)
> Labor force: 100,000
> Median annual wage: $50,160
> Proj. job growth 2016-2026: +5.7%
> Typical entry level edu. required: Bachelor’s degree
 24/7 Wall St.
Source: Thinkstock
18. Clinical laboratory technologists and technicians
> Unemployment rate: 0.7% (tied – 17th highest job security)
> Labor force: 379,000
> Median annual wage: $51,770
> Proj. job growth 2016-2026: +12.7%
> Typical entry level edu. required: Bachelor’s degree

Source: Thinkstock
17. Clergy
> Unemployment rate: 0.7% (tied – 17th highest job security)
> Labor force: 409,000
> Median annual wage: $45,740
> Proj. job growth 2016-2026: +8.0%
> Typical entry level edu. required: Bachelor’s degree
[in-text-ad-2]

Source: Thinkstock
16. Chiropractors
> Unemployment rate: 0.6% (tied – 12th highest job security)
> Labor force: 51,000
> Median annual wage: $67,520
> Proj. job growth 2016-2026: +10.5%
> Typical entry level edu. required: Doctoral or professional degree

Source: Thinkstock
15. Tax examiners and collectors, and revenue agents
> Unemployment rate: 0.6% (tied – 12th highest job security)
> Labor force: 65,000
> Median annual wage: $52,060
> Proj. job growth 2016-2026: -0.6%
> Typical entry level edu. required: Bachelor’s degree
[in-text-ad]

Source: Thinkstock
14. Directors of religious activities and education
> Unemployment rate: 0.6% (tied – 12th highest job security)
> Labor force: 82,000
> Median annual wage: $38,610
> Proj. job growth 2016-2026: +7.3%
> Typical entry level edu. required: Bachelor’s degree

Source: Thinkstock
13. Private detectives and investigators
> Unemployment rate: 0.6% (tied – 12th highest job security)
> Labor force: 95,000
> Median annual wage: $48,190
> Proj. job growth 2016-2026: +10.5%
> Typical entry level edu. required: High school diploma

Source: Thinkstock
12. Police and sheriff’s patrol officers
> Unemployment rate: 0.6% (tied – 12th highest job security)
> Labor force: 708,000
> Median annual wage: $59,680
> Proj. job growth 2016-2026: +7.0%
> Typical entry level edu. required: High school diploma
[in-text-ad-2]

Source: Thinkstock
11. First-line supervisors of police and detectives
> Unemployment rate: 0.5% (tied – 8th highest job security)
> Labor force: 95,000
> Median annual wage: $84,840
> Proj. job growth 2016-2026: +6.6%
> Typical entry level edu. required: High school diploma

Source: Thinkstock
10. Occupational therapists
> Unemployment rate: 0.5% (tied – 8th highest job security)
> Labor force: 123,000
> Median annual wage: $81,910
> Proj. job growth 2016-2026: +21.2%
> Typical entry level edu. required: Master’s degree
[in-text-ad]

Source: monkeybusinessimages / iStock
9. Emergency medical technicians and paramedics
> Unemployment rate: 0.5% (tied – 8th highest job security)
> Labor force: 224,000
> Median annual wage: $32,670
> Proj. job growth 2016-2026: +15.1%
> Typical entry level edu. required: Postsecondary nondegree award

Source: Thinkstock
8. Physicians and surgeons
> Unemployment rate: 0.5% (tied – 8th highest job security)
> Labor force: 1.1 million
> Median annual wage: $208,000+
> Proj. job growth 2016-2026: +12.8%
> Typical entry level edu. required: Doctoral or professional degree

Source: Thinkstock
7. Dental hygienists
> Unemployment rate: 0.4% (7th highest job security)
> Labor force: 169,000
> Median annual wage: $72,910
> Proj. job growth 2016-2026: +19.6%
> Typical entry level edu. required: Associate’s degree
[in-text-ad-2]

Source: PointImages / Getty Images
6. Precision instrument and equipment repairers
> Unemployment rate: 0.3% (tied – 3rd highest job security)
> Labor force: 63,000
> Median annual wage: $47,920
> Proj. job growth 2016-2026: +2.7%
> Typical entry level edu. required: Associate’s degree

Source: Thinkstock
5. Court, municipal, and license clerks
> Unemployment rate: 0.3% (tied – 3rd highest job security)
> Labor force: 90,000
> Median annual wage: $36,670
> Proj. job growth 2016-2026: +6.6%
> Typical entry level edu. required: High school diploma
[in-text-ad]

Source: Thinkstock
4. Respiratory therapists
> Unemployment rate: 0.3% (tied – 3rd highest job security)
> Labor force: 100,000
> Median annual wage: $58,670
> Proj. job growth 2016-2026: +23.4%
> Typical entry level edu. required: Associate’s degree
 24/7 Wall St.
Source: llucky78 / Getty Images
3. Water and wastewater treatment plant and system operators
> Unemployment rate: 0.3% (tied – 3rd highest job security)
> Labor force: 107,000
> Median annual wage: $45,760
> Proj. job growth 2016-2026: -3.2%
> Typical entry level edu. required: High school diploma

Source: Thinkstock
2. First-line supervisors of correctional officers
> Unemployment rate: 0.2% (tied – the highest job security)
> Labor force: 52,000
> Median annual wage: $60,560
> Proj. job growth 2016-2026: -7.8%
> Typical entry level edu. required: High school diploma
[in-text-ad-2]

Source: Thinkstock
1. Appraisers and assessors of real estate
> Unemployment rate: 0.2% (tied – the highest job security)
> Labor force: 97,000
> Median annual wage: $51,850
> Proj. job growth 2016-2026: +14.4%
> Typical entry level edu. required: Bachelor’s degree

Source: shironosov / iStock
30. Stock clerks and order fillers
> Unemployment rate: 7.5% (tied – 29th lowest job security)
> Labor force: 1.6 million
> Median annual wage: $23,840
> Proj. job growth 2016-2026: +5.0%
> Typical entry level edu. required: High school diploma
[in-text-ad]

Source: Thinkstock
29. Cashiers
> Unemployment rate: 7.5% (tied – 29th lowest job security)
> Labor force: 3.5 million
> Median annual wage: $20,180
> Proj. job growth 2016-2026: -0.8%
> Typical entry level edu. required: None

Source: Thinkstock
28. Tax preparers
> Unemployment rate: 7.6% (tied – 26th lowest job security)
> Labor force: 116,000
> Median annual wage: $36,550
> Proj. job growth 2016-2026: +10.8%
> Typical entry level edu. required: High school diploma

Source: Thinkstock
27. Welding, soldering, and brazing workers
> Unemployment rate: 7.6% (tied – 26th lowest job security)
> Labor force: 649,000
> Median annual wage: $39,390
> Proj. job growth 2016-2026: +5.5%
> Typical entry level edu. required: High school diploma
[in-text-ad-2]

Source: Thinkstock
26. Food preparation workers
> Unemployment rate: 7.6% (tied – 26th lowest job security)
> Labor force: 1.2 million
> Median annual wage: $21,440
> Proj. job growth 2016-2026: +7.9%
> Typical entry level edu. required: None

Source: Thinkstock
25. First-line supervisors of farming, fishing, and forestry workers
> Unemployment rate: 8.0% (25th lowest job security)
> Labor force: 67,000
> Median annual wage: $45,320
> Proj. job growth 2016-2026: +4.6%
> Typical entry level edu. required: High school diploma
[in-text-ad]

Source: sanjeri / Getty Images
24. Crushing, grinding, polishing, mixing, and blending workers
> Unemployment rate: 8.1% (tied – 22nd lowest job security)
> Labor force: 78,000
> Median annual wage: N/A
> Proj. job growth 2016-2026: N/A
> Typical entry level edu. required: N/A
 24/7 Wall St.
Source: welcomia / Shutterstock.com
23. Gaming services workers
> Unemployment rate: 8.1% (tied – 22nd lowest job security)
> Labor force: 98,000
> Median annual wage: $24,880
> Proj. job growth 2016-2026: +0.7%
> Typical entry level edu. required: High school diploma

Source: aydinmutlu / Getty Images
22. Painters, construction and maintenance
> Unemployment rate: 8.1% (tied – 22nd lowest job security)
> Labor force: 588,000
> Median annual wage: $37,570
> Proj. job growth 2016-2026: +6.1%
> Typical entry level edu. required: None
[in-text-ad-2]

Source: wathanyu / Getty Images
21. Grounds maintenance workers
> Unemployment rate: 8.4% (21st lowest job security)
> Labor force: 1.5 million
> Median annual wage: $28,470
> Proj. job growth 2016-2026: +8.5%
> Typical entry level edu. required: None

Source: Thinkstock
20. Carpet, floor, and tile installers and finishers
> Unemployment rate: 8.5% (20th lowest job security)
> Labor force: 200,000
> Median annual wage: N/A
> Proj. job growth 2016-2026: N/A
> Typical entry level edu. required: N/A
[in-text-ad]

Source: gerenme / Getty Images
19. Helpers–production workers
> Unemployment rate: 8.7% (tied – 18th lowest job security)
> Labor force: 55,000
> Median annual wage: $24,830
> Proj. job growth 2016-2026: +11.6%
> Typical entry level edu. required: High school diploma

Source: Thinkstock
18. Farming, fishing, and forestry occupations
> Unemployment rate: 8.7% (tied – 18th lowest job security)
> Labor force: 1.3 million
> Median annual wage: $45,320
> Proj. job growth 2016-2026: +4.6%
> Typical entry level edu. required: High school diploma

Source: Thinkstock
17. Cleaners of vehicles and equipment
> Unemployment rate: 8.8% (tied – 16th lowest job security)
> Labor force: 363,000
> Median annual wage: $22,220
> Proj. job growth 2016-2026: +10.8%
> Typical entry level edu. required: None
[in-text-ad-2]

Source: Thinkstock
16. Combined food preparation and serving workers, including fast food
> Unemployment rate: 8.8% (tied – 16th lowest job security)
> Labor force: 408,000
> Median annual wage: $19,440
> Proj. job growth 2016-2026: +16.8%
> Typical entry level edu. required: None

Source: Thinkstock
15. Models, demonstrators, and product promoters
> Unemployment rate: 8.9% (15th lowest job security)
> Labor force: 67,000
> Median annual wage: $21,870
> Proj. job growth 2016-2026: -0.9%
> Typical entry level edu. required: None
[in-text-ad]

Source: Thinkstock
14. Miscellaneous agricultural workers
> Unemployment rate: 9.1% (14th lowest job security)
> Labor force: 940,000
> Median annual wage: $31,160
> Proj. job growth 2016-2026: +4.5%
> Typical entry level edu. required: None

Source: Thinkstock
13. Molders and molding machine setters, operators, and tenders for metal and plastic
> Unemployment rate: 9.2% (tied – 11th lowest job security)
> Labor force: 50,000
> Median annual wage: $30,480
> Proj. job growth 2016-2026: -15.0%
> Typical entry level edu. required: High school diploma

Source: Thinkstock
12. Counter attendants, cafeteria, food concession, and coffee shop
> Unemployment rate: 9.2% (tied – 11th lowest job security)
> Labor force: 248,000
> Median annual wage: $19,970
> Proj. job growth 2016-2026: +4.6%
> Typical entry level edu. required: None
[in-text-ad-2]

Source: Thinkstock
11. Laborers and freight, stock, and material movers, hand
> Unemployment rate: 9.2% (tied – 11th lowest job security)
> Labor force: 2.1 million
> Median annual wage: $25,980
> Proj. job growth 2016-2026: +7.6%
> Typical entry level edu. required: None

Source: Thinkstock
10. Lifeguards and other recreational, and all other protective service workers
> Unemployment rate: 9.5% (10th lowest job security)
> Labor force: 150,000
> Median annual wage: $20,290
> Proj. job growth 2016-2026: +7.7%
> Typical entry level edu. required: None
[in-text-ad]

Source: Drazen_ / Getty Images
9. Construction laborers
> Unemployment rate: 9.7% (9th lowest job security)
> Labor force: 2.2 million
> Median annual wage: $33,430
> Proj. job growth 2016-2026: +12.6%
> Typical entry level edu. required: None
 24/7 Wall St.
Source: Thinkstock
8. Order clerks
> Unemployment rate: 9.8% (8th lowest job security)
> Labor force: 119,000
> Median annual wage: $33,370
> Proj. job growth 2016-2026: -2.0%
> Typical entry level edu. required: High school diploma

Source: Thinkstock
7. Hand packers and packagers
> Unemployment rate: 10.2% (7th lowest job security)
> Labor force: 600,000
> Median annual wage: $22,130
> Proj. job growth 2016-2026: +1.8%
> Typical entry level edu. required: None
[in-text-ad-2]

Source: Jens_Lambert_Photography / Getty Images
6. Roofers
> Unemployment rate: 10.6% (6th lowest job security)
> Labor force: 246,000
> Median annual wage: $37,760
> Proj. job growth 2016-2026: +11.3%
> Typical entry level edu. required: None

Source: Thinkstock
5. Graders and sorters of agricultural products
> Unemployment rate: 11.0% (5th lowest job security)
> Labor force: 124,000
> Median annual wage: $22,520
> Proj. job growth 2016-2026: -0.9%
> Typical entry level edu. required: None
[in-text-ad]
Source: Thinkstock
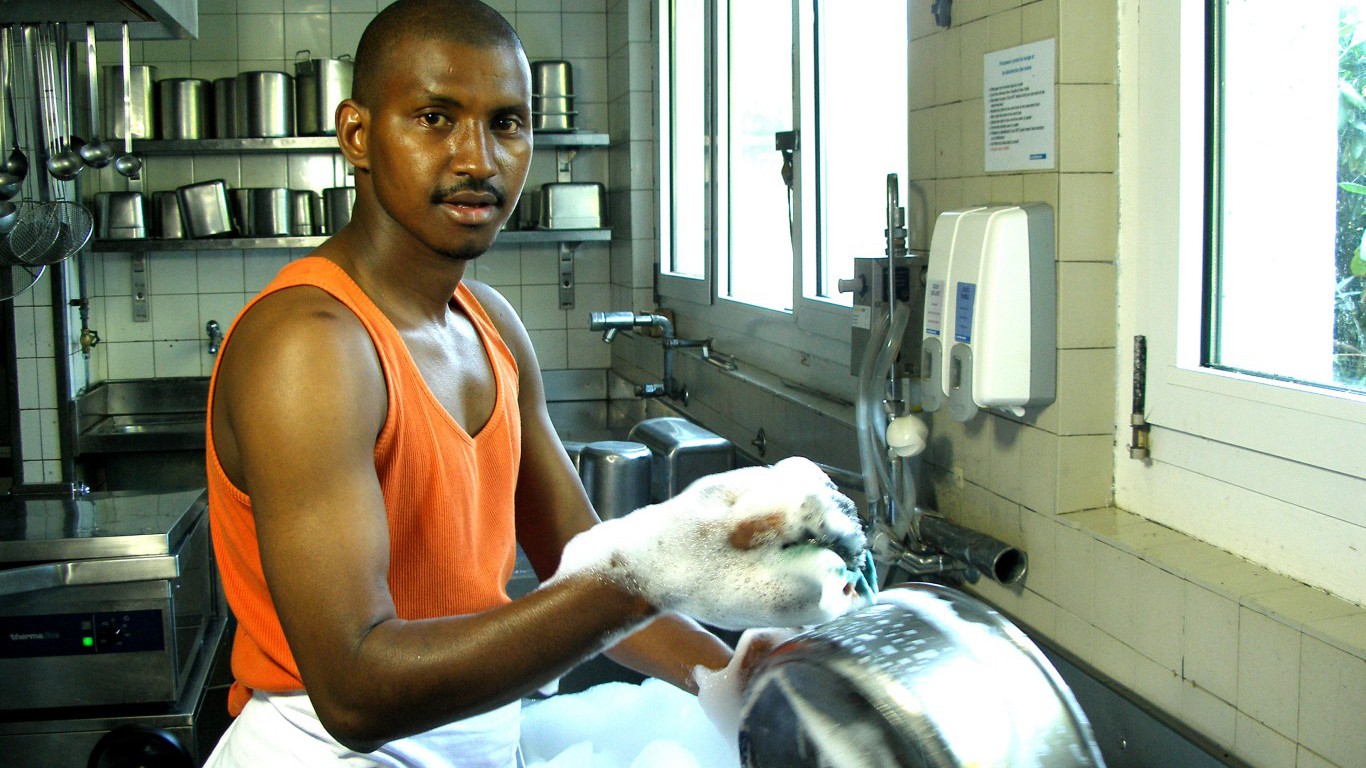
4. Dishwashers
> Unemployment rate: 12.9% (4th lowest job security)
> Labor force: 314,000
> Median annual wage: $20,800
> Proj. job growth 2016-2026: +4.3%
> Typical entry level edu. required: None
 24/7 Wall St.
Source: Thinkstock
3. Telemarketers
> Unemployment rate: 14.4% (3rd lowest job security)
> Labor force: 68,000
> Median annual wage: $24,300
> Proj. job growth 2016-2026: +0.0%
> Typical entry level edu. required: None

Source: Thinkstock
2. Crossing guards
> Unemployment rate: 14.7% (2nd lowest job security)
> Labor force: 74,000
> Median annual wage: $26,700
> Proj. job growth 2016-2026: +8.5%
> Typical entry level edu. required: None
[in-text-ad-2]

Source: Thinkstock
1. Actors
> Unemployment rate: 24.2% (the lowest job security)
> Labor force: 53,000
> Median annual wage: N/A
> Proj. job growth 2016-2026: +11.7%
> Typical entry level edu. required: Some college, no degree
Perhaps the starkest difference between occupations with high job security and those with relatively low job security is the education level typically required for the position. The increasingly competitive U.S. job market has put a premium on highly specialized skills. Of the jobs with the highest job security for which education data is available, two thirds require some formal post-secondary education — including many that require a master’s degree or a doctorate.
Meanwhile, all but one of the jobs with low job security for which education data is available require at most a high school diploma, and often not even that.
While occupations with high job security more often than not have low unemployment rates due to their highly specialized nature, the reasons for the high unemployment rates among the jobs with the lowest job security are more varied.
One of the most common underlying causes of high unemployment is the high turnover rate in some of these occupations. Occupations like dishwashers and cashiers are often just a stepping stone in a young adult’s career. Other jobs, like grounds maintenance workers, material movers, and agricultural workers often report high turnover due to their highly physical nature.
In other cases, high unemployment rates are attributable to a range of broader market forces, such as technological advances and an oversaturation of workers.
No matter the cause, the low educational requirement in industries with high unemployment means workers are plentiful and often easily replaceable.
Perhaps not surprisingly, occupations with the best job security also tend to provide greater financial compensation. In over half of the jobs with unemployment rates below 1%, the typical worker earns over $50,000 a year. In two of the jobs with the lowest unemployment rates, the median annual wage tops $100,0000.
Conversely, none of the jobs with the highest unemployment rates have a median annual wage exceeding $50,000. In the majority of jobs with poor job security, the typical worker earns less than $30,000 per year.
Jobs with better job security are also more likely to remain in high demand in the coming years. According the the BLS, total employment in the United States is projected to rise by 7.0% between 2016 and 2026. Of the 24 jobs with the best job security and for which employment growth projections are available, 15 either match or exceed the 7.0% total job growth expectations — including 10 with double digit projected growth and four in which employment is projected to increase by over 20%.
Ten-year employment growth projections are lower than 7.0% in the majority of occupations with the highest unemployment rates.
To identify the 30 jobs with the best job security and the 30 jobs with the worst job security, 24/7 Wall St. reviewed 2017 unemployment rates for 363 occupations from the Bureau of Labor Statistics. In keeping with BLS publication standards, we only considered occupations with a labor force of 50,000 or more. Unemployed members of an occupational labor force need to have been last employed in this occupation prior to unemployment. Employment projections from 2016 through 2026 came from the BLS’ Employment Projections program. Typical entry-level education requirement and median annual wage also came from the BLS. Annual wages exclude those of part-time workers in a given profession.
Take This Retirement Quiz To Get Matched With A Financial Advisor (Sponsored)
Take the quiz below to get matched with a financial advisor today.
Each advisor has been vetted by SmartAsset and is held to a fiduciary standard to act in your best interests.
Here’s how it works:
1. Answer SmartAsset advisor match quiz
2. Review your pre-screened matches at your leisure. Check out the
advisors’ profiles.
3. Speak with advisors at no cost to you. Have an introductory call on the phone or introduction in person and choose whom to work with in the future
Take the retirement quiz right here.
Thank you for reading! Have some feedback for us?
Contact the 24/7 Wall St. editorial team.
Editors' Picks

