
It seems there is no shortage of reports about mass shootings and high murder rates in major U.S. cities like Chicago. Yet the overall violent crime rate in the United States is more or less unchanged, falling from 387 incidents per 100,000 people in 2011 to 386 incidents per 100,000 people in 2016.
According to the FBI’s definition, violent crime includes four types of offenses: rape, robbery, aggravated assault, and murder. In a country as large and diverse as the United States, nationwide figures are rarely good indicators of local trends. This is especially true in the case of crime, which tends to be highly local and varies significantly not just between states and cities, but even within neighborhoods.
Changes in violent crime fluctuated widely across the country over the past half decade. In a number of metropolitan areas, like Ames, Iowa, Muncie, Indiana, and Bend, Oregon, it improved substantially, dropping by more than 40%. In other metropolitan areas, violent crime increased substantially. In Monroe, Louisiana, the violent crime rate rose by nearly 90%.
In some states, changes in violent crime rates at the metropolitan level mirror statewide trends. In Florida, where the violent crime rate decreased by 16.5%, 15 of the 16 metropolitan areas with comparable data also reported declining violent crime rates. However, this is not always the case. In Wisconsin, the violent crime rate increased by nearly 30%, but no state metropolitan reported an increase in violent crime of more than 14%.
Reviewing changes in violent crime rates from 2011 through 2016 , 24/7 Wall St. reviewed the metropolitan statistical area in each state where violent crime increased the most.
Click here to see the cities where crime is soaring in every state.
Click here to see our detailed findings and methodology.

Source: Brent Moore / Flickr
1. Alabama
> Metro area: None
> 5-yr. change in crime rate: +26.7% (state)
> 2016 violent crimes per 100,000: 532 (state)
> 2016 murders: 407 (state)
> 2016 unemployment rate: 6.0% (state)
Crime data for each of Alabama’s 10 metro areas the FBI tracks is not comparable from 2011 to 2016 due to changes in reporting methods. As a result, the metro area with the largest increase in violent crime is unidentifiable. However, Alabama as a whole reported one of the largest five-year increases in violent crime of any state.
There were 532 violent crimes in the state for every 100,000 people in 2016, a 26.7% increase from the rate in 2011 of 420 violent crimes per 100,000 people. Meanwhile, the U.S. violent crime has remained effectively unchanged from 387 incidents per 100,000 in 2011 to 386 in 2016.
[in-text-ad]
Source: Thinkstock
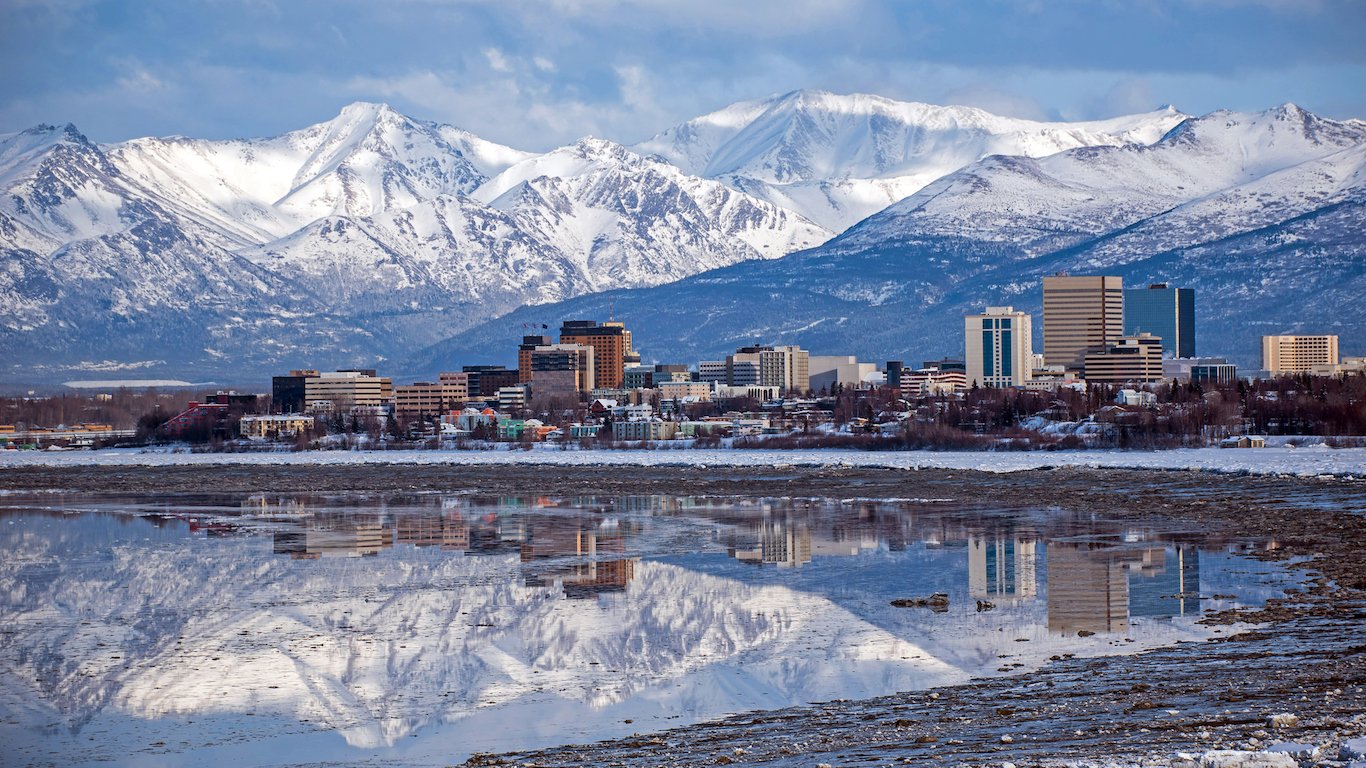
2. Alaska
> Metro area: Anchorage
> 5-yr. change in crime rate: +41.3% (metro area) +32.6% (state)
> 2016 violent crimes per 100,000: 1,115 (metro area) 804 (state)
> 2016 murders: 28 (metro area) 52 (state)
> 2016 unemployment rate: 5.9% (metro area) 6.6% (state)
Anchorage, Alaska’s 41.3% increase in violent crime over the past five years is among the larger increases of metropolitan areas on this list. It is also significantly greater than the 19.4% increase recorded in Alaska’s other major metro area, Fairbanks, and the statewide 32.6% uptick in violent crime.
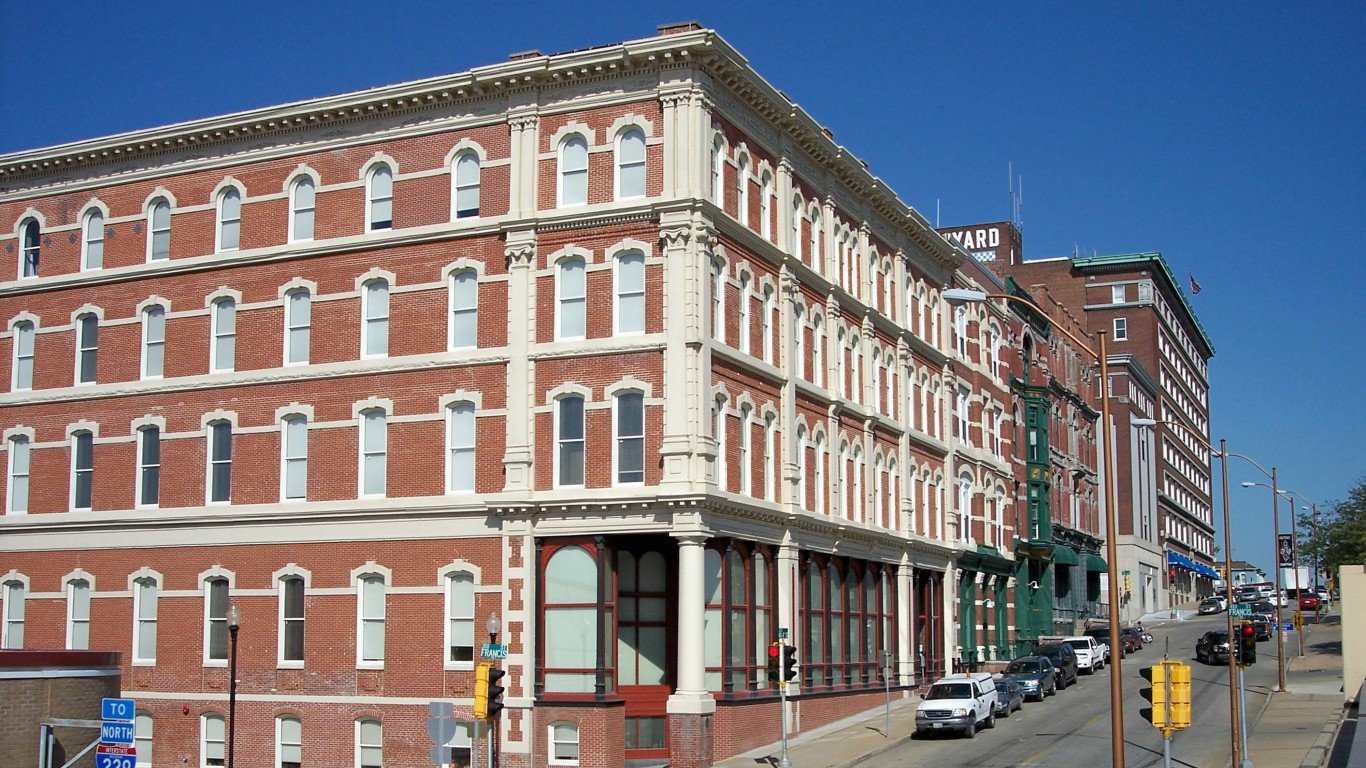
Currently, the Anchorage metro area ranks among the most dangerous in the country. There were 1,115 violent crimes for every 100,000 residents in 2016, the second most of any U.S. metro area.
 24/7 Wall St.
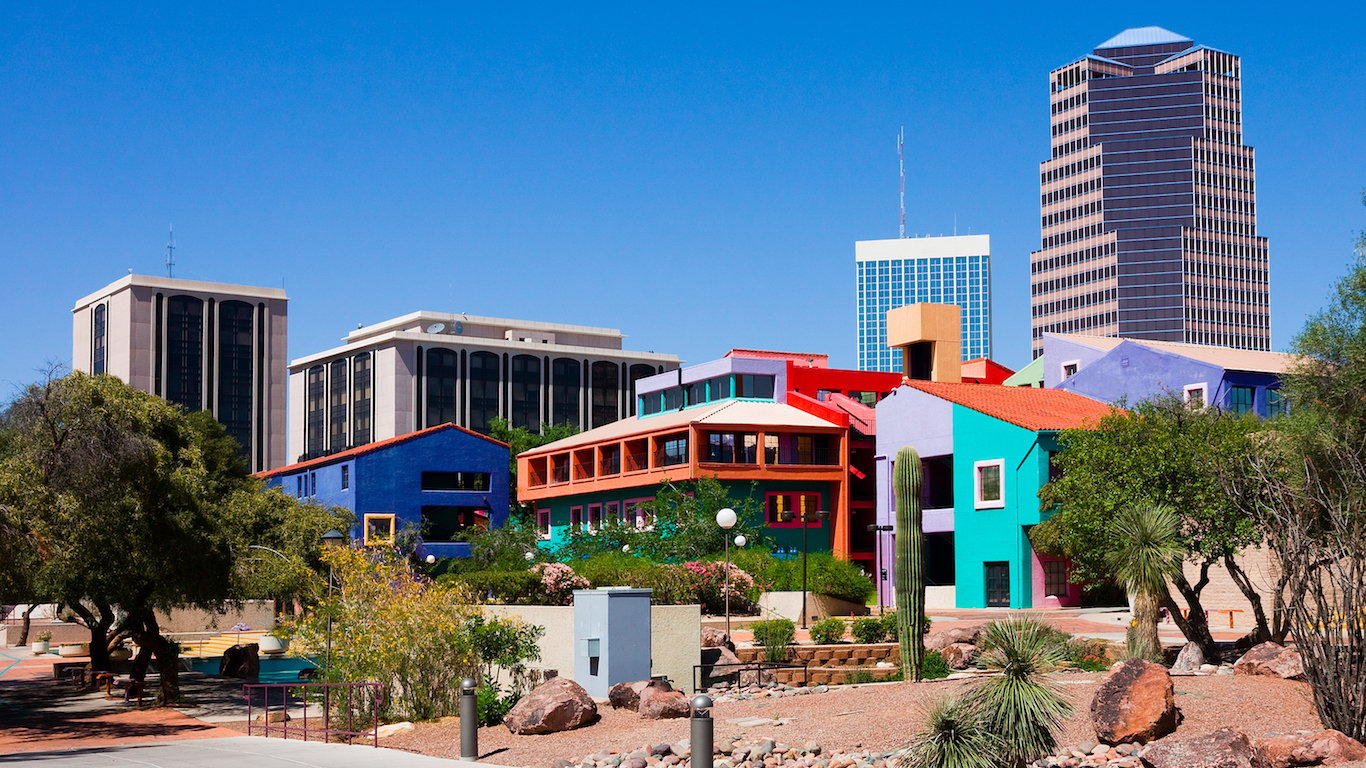
Source: photoquest7 / iStock
3. Arizona
> Metro area: Tucson
> 5-yr. change in crime rate: +14.5% (metro area) +15.8% (state)
> 2016 violent crimes per 100,000: 496 (metro area) 470 (state)
> 2016 murders: 49 (metro area) 380 (state)
> 2016 unemployment rate: 4.9% (metro area) 5.3% (state)
Like the state of Arizona as a whole, Tucson’s violent crime rose during the last five years. The metro area’s violent crime rate increased from 433 incidents to 496 incidents per 100,000 people — a 14.5% increase that closely mirrors the state’s violent crime increase of 15.8%. While violent crime is on the rise in Tucson and Arizona as a whole, crime is not on the rise in every metro area in the state. In the Flagstaff and Prescott metro areas, violent crime is down by 12.0% and 18.9%, respectively.

Source: Tizod / iStock
4. Arkansas
> Metro area: Hot Springs
> 5-yr. change in crime rate: +27.1% (metro area) +14.6% (state)
> 2016 violent crimes per 100,000: 652 (metro area) 551 (state)
> 2016 murders: 4 (metro area) 216 (state)
> 2016 unemployment rate: 4.3% (metro area) 4.0% (state)
Even as the violent crime rate remained effectively unchanged nationwide over the past half decade, it rose by close to 15% in Arkansas. It also rose in each of the state’s four metro areas with comparable data, but none had as large of an increase as Hot Springs, where the violent crime rate rose by 27.1%, from 513 incidents per 100,000 in 2011 to 652 per 100,000 in 2016. Other, non-violent types of crime also rose in Hot Springs. For example, the motor vehicle theft rate in the metro area increased by 26% over the same period.
[in-text-ad-2]
Source: joojoob27 / Shutterstock.com
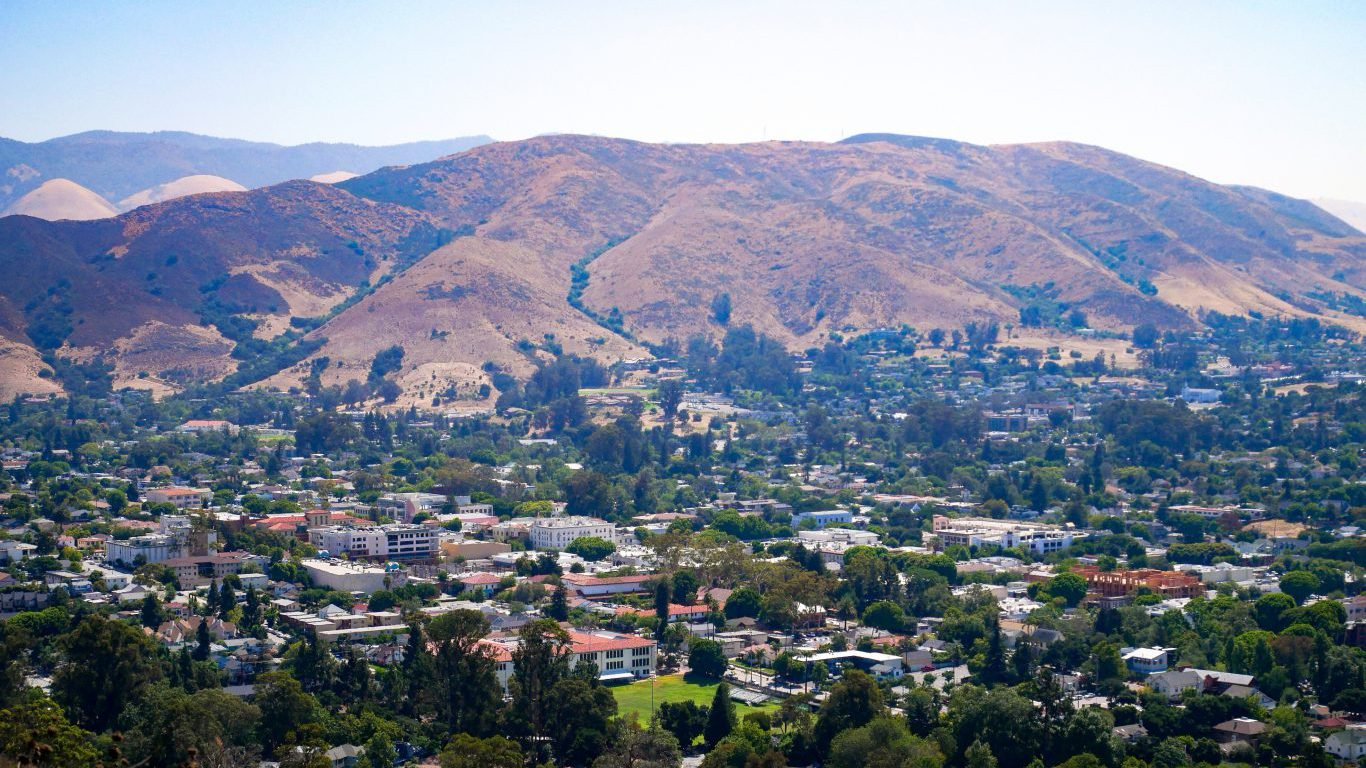
5. California
> Metro area: San Luis Obispo-Paso Robles-Arroyo Grande
> 5-yr. change in crime rate: +58.7% (metro area) +8.3% (state)
> 2016 violent crimes per 100,000: 396 (metro area) 445 (state)
> 2016 murders: 4 (metro area) 1,930 (state)
> 2016 unemployment rate: 4.3% (metro area) 5.4% (state)
The San Luis Obispo-Paso Robles-Arroyo Grande metropolitan area’s 58.7% five year increase in violent crime is the sixth largest increase of any U.S. metro area. In stark contrast, the nearby Visalia-Porterville metro area’s violent crime rate dropped by 18.7% over the same period. One sliver of positive news for San Luis Obispo is that the violent crime rate fell slightly from 2014 to 2016 after a considerable increase from 2012 to 2014. Despite the increase, the metro area is about as safe as the U.S. as a whole, with a violent crime rate of 396 incidents per 100,000.
Source: Eleaf / Wikimedia Commons
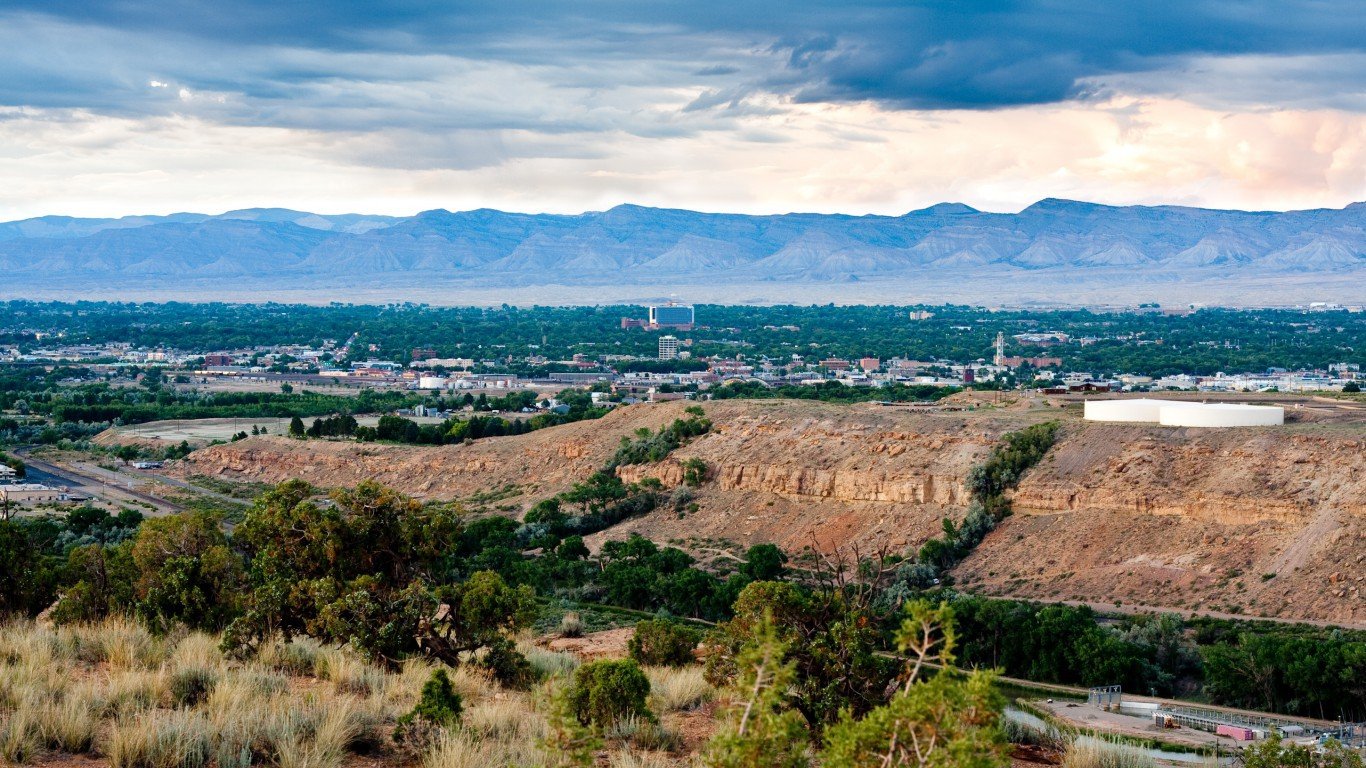
6. Colorado
> Metro area: Grand Junction
> 5-yr. change in crime rate: +15.7% (metro area) +7.0% (state)
> 2016 violent crimes per 100,000: 349 (metro area) 343 (state)
> 2016 murders: 9 (metro area) 204 (state)
> 2016 unemployment rate: 5.4% (metro area) 3.3% (state)
The increase in violent crime in Grand Junction, Colorado from 2011 to 2016 is more than double the comparable statewide increase. However, despite the different rates of change, the actual violent crime rates in 2016 were not that different. There were 349 violent crimes in the Grand Junction metro area per 100,000 residents compared to 343 per 100,000 across Colorado. Grand Junction’s violent crime rate is also lower than that of both the Colorado Springs and Denver-Aurora-Lakewood metro areas. However, this could change if the Grand Junction’s upward trajectory continues.
[in-text-ad]

Source: Thinkstock
7. Connecticut
> Metro area: None
> 5-yr. change in crime rate: -16.8% (state)
> 2016 violent crimes per 100,000: 227 (state)
> 2016 murders: 78 (state)
> 2016 unemployment rate: 5.1% (state)
In most states, at least one metro area reported an increase in violent crime in the last five years. In Connecticut, however, none did. In both of the state’s metro areas for which sufficient crime data is available — Bridgeport-Stamford-Norwalk and Norwich-New London — the violent crime rate declined by 21.7% and 26.5%, respectively. Statewide, the crime rate fell by 16.8% from 273 incidents per 100,000 residents to 227 over that time. New Jersey is the only state in the country to report a steeper decline than Connecticut in violent crime between 2011 and 2016.

Source: Mobilus In Mobili / Flickr
8. Delaware
> Metro area: None
> 5-yr. change in crime rate: -9.1% (state)
> 2016 violent crimes per 100,000: 509 (state)
> 2016 murders: 56 (state)
> 2016 unemployment rate: 4.4% (state)
Delaware is one of a few states where crime rates in major metro areas are lower than they were a half decade ago. In Dover, the only metro area in the state for which the FBI tracks crime statistics, the violent crime rate is down 23.9% from 2011, a year when there were 622 violent crimes for every 100,000 residents. The falling violent crime rate in Dover contributed to a 9.1% decline in the violent crime rate statewide.
Despite the improvement, both Dover and Delaware remain more dangerous than the United States as a whole. There were 509 violent crimes in Delaware for every 100,000 residents and 474 in Dover in 2016, each well above the U.S. violent crime rate of 386 per 100,000.
Source: Thinkstock
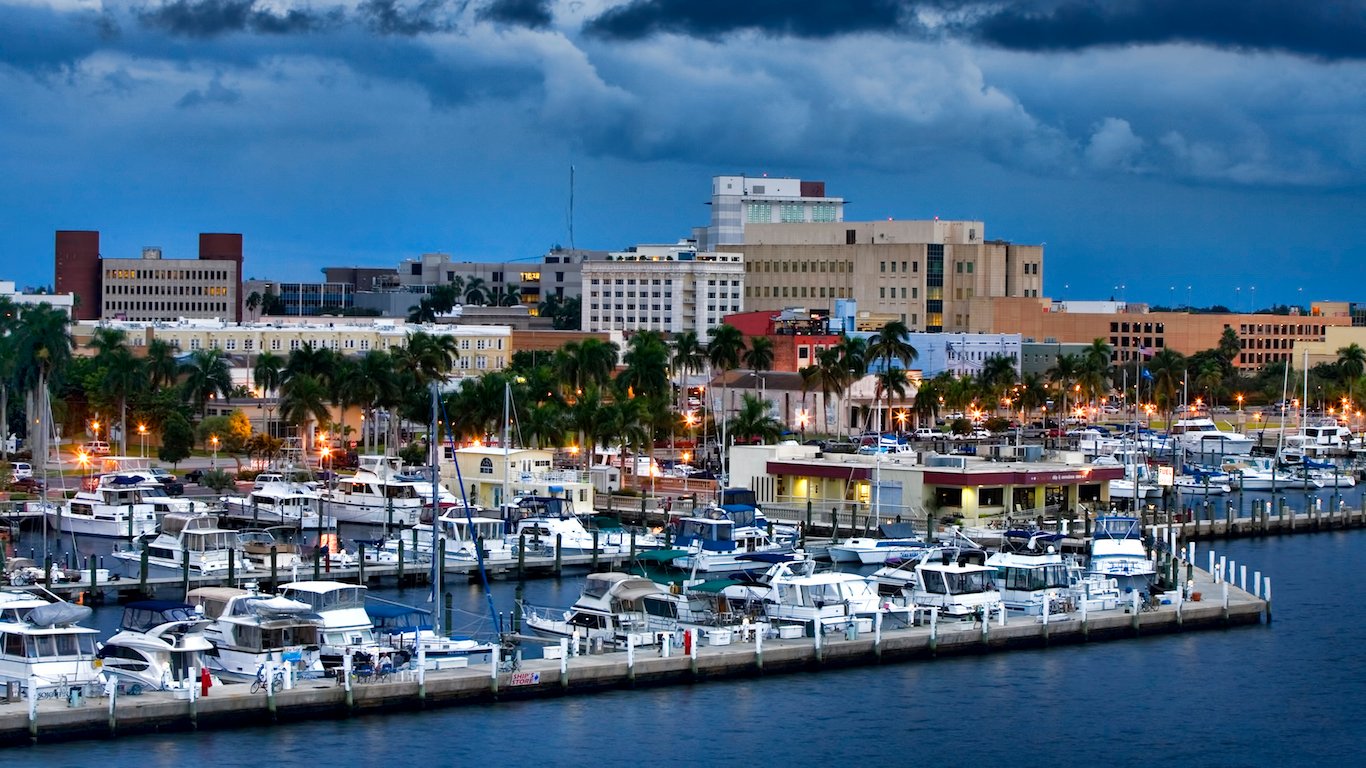
9. Florida
> Metro area: Cape Coral-Fort Myers
> 5-yr. change in crime rate: +0.7% (metro area) -16.5% (state)
> 2016 violent crimes per 100,000: 355 (metro area) 430 (state)
> 2016 murders: 41 (metro area) 1,111 (state)
> 2016 unemployment rate: 4.6% (metro area) 4.9% (state)
Of the 16 metro areas in Florida for which sufficient data is available, the Cape Coral-Fort Myers metro area was the only one to report a five year increase in violent crime. Climbing from 353 incidents per 100,000 people to 355 incidents, the uptick in violent crime was negligible. Across Florida as a whole, the violent crime rate decreased by 16.5% from 2011 to 2016. Despite the decrease, Florida is slightly more dangerous than the U.S. as a whole. There were 430 violent crimes for every 100,000 state residents in 2016 compared to just 386 nationwide.
[in-text-ad-2]
Source: Schnitzel_bank / Flickr
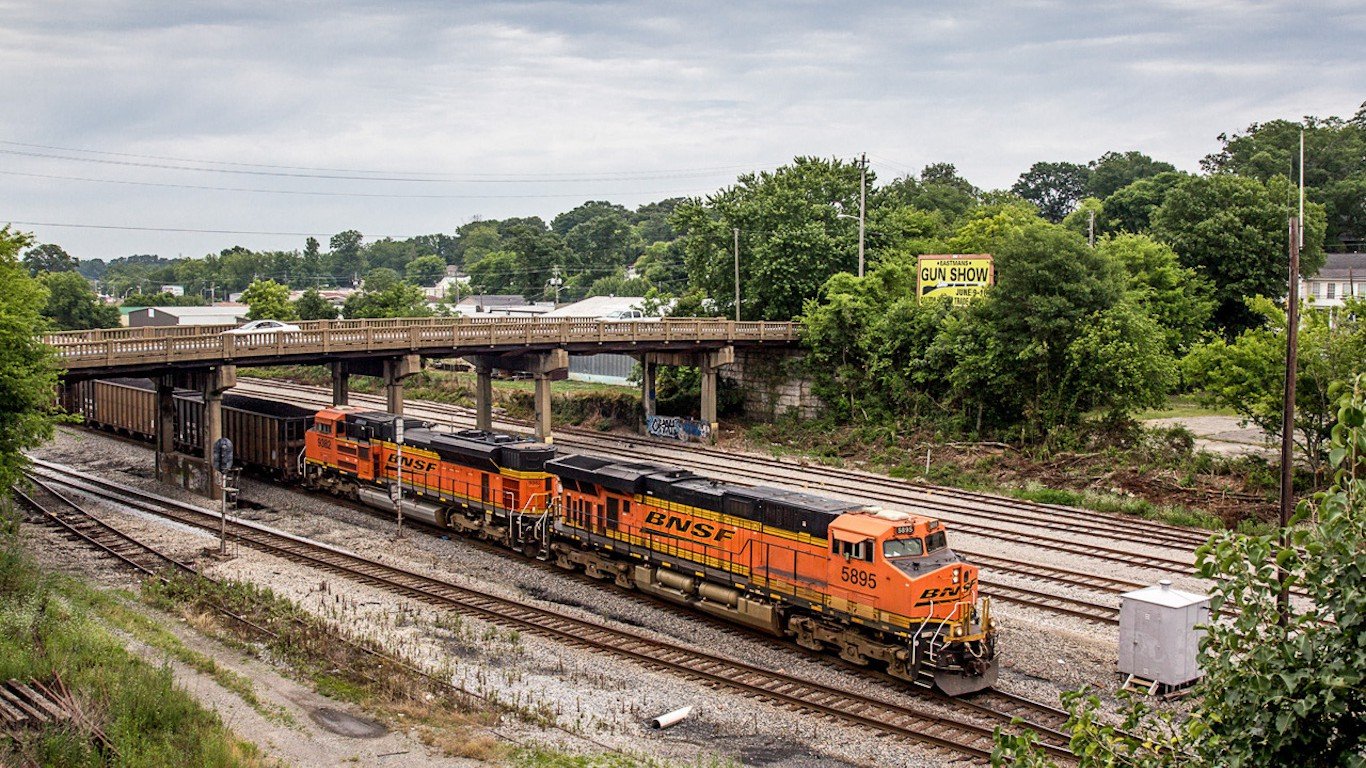
10. Georgia
> Metro area: Dalton
> 5-yr. change in crime rate: +208.1% (metro area) +6.5% (state)
> 2016 violent crimes per 100,000: 689 (metro area) 398 (state)
> 2016 murders: 0 (metro area) 681 (state)
> 2016 unemployment rate: 6.2% (metro area) 5.4% (state)
The incidence of violent crime increased in Dalton, Georgia from 224 reported cases per 100,000 people — which at the time was below the state figure — to 689 incidents per 100,000 in 2016, which is well above the state figure of 398 incidents per 100,000. The over 200% spike represents not only the largest increase in violent crime in the state over that period, but also the largest of any metropolitan area in the United States. While Dalton’s sudden jump in crime is somewhat inexplicable, its high violent crime rate maybe be partly the result of poor social and economic conditions, including low educational attainment, higher poverty, and above average unemployment.

Source: Thinkstock
11. Hawaii
> Metro area: None
> 5-yr. change in crime rate: +7.7% (state)
> 2016 violent crimes per 100,000: 309 (state)
> 2016 murders: 35 (state)
> 2016 unemployment rate: 3.0% (state)
Due to inconsistent reporting methods, five year changes in the crime rates in Hawaii’s two metro areas — Kahului-Wailuku-Lahaina and Urban Honolulu — are not calculable. Currently, each ranks among the safer U.S. metro areas, with 273 and 335 violent crimes per 100,000 residents, respectively.
Across Hawaii as a whole, the incidence of violent crime has crept up over the last five years. There were 309 violent crimes per 100,000 state residents in 2016, a 7.7% increase from 287 crimes per 100,000 in 2011.
[in-text-ad]
Source: Thinkstock
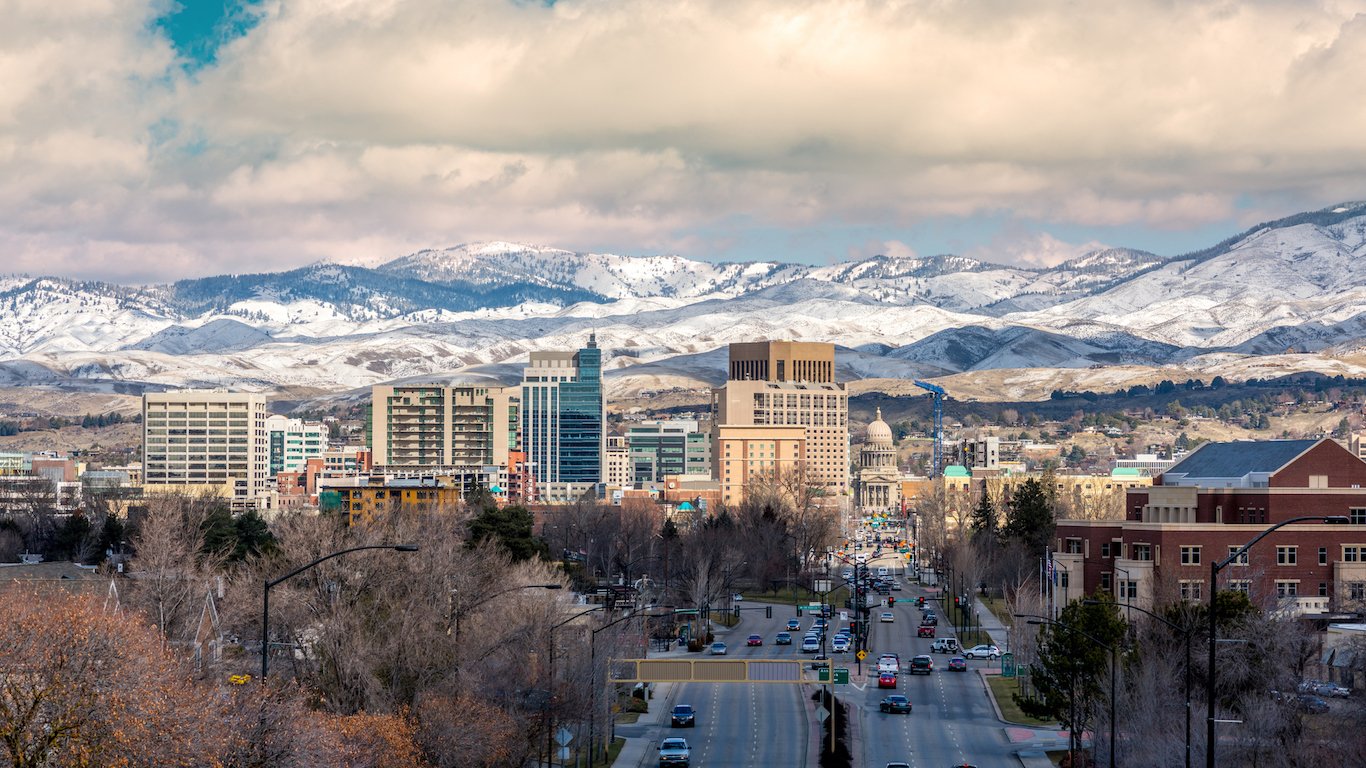
12. Idaho
> Metro area: Boise City
> 5-yr. change in crime rate: +16.8% (metro area) +14.6% (state)
> 2016 violent crimes per 100,000: 244 (metro area) 230 (state)
> 2016 murders: 17 (metro area) 49 (state)
> 2016 unemployment rate: 3.7% (metro area) 3.8% (state)
Boise City’s violent crime rate has risen steadily over the past five years, from 209 incidents per 100,000 people in 2011 to 244 in 2016. The metro area’s 16.8% violent crime rate increase between 2011 and 2016 is slightly above the state’s 14.6% increase. However, Boise’s violent crime rate remains well below the national rate of 386 incidents per 100,000. Like many metropolitan areas with low crime rates, Boise’s poverty and unemployment rates are below the comparable national rates.

Source: Daniel Schwen / Wikimedia Commons
13. Illinois
> Metro area: Danville
> 5-yr. change in crime rate: +37.3% (metro area) +1.6% (state)
> 2016 violent crimes per 100,000: 808 (metro area) 436 (state)
> 2016 murders: 0 (metro area) 1,054 (state)
> 2016 unemployment rate: 7.2% (metro area) 5.9% (state)
The 37.3% increase in Danville’s violent crime rate over the last five years is surprising when considering the state of Illinois’ mild 1.6% increase over the same period. In many of the state’s other major metropolitan areas the violent crime rate decreased substantially, including a 19.5% drop in Decatur, a 19.7% decrease in Kankakee, and a 22.5% decline Champaign-Urbana. Danville’s population has declined over this period of increased violence, dropping from 81,871 in 2011 to 78,439 in 2016.
Source: Thinkstock
14. Indiana
> Metro area: Michigan City-LaPorte
> 5-yr. change in crime rate: +79.5% (metro area) +22.0% (state)
> 2016 violent crimes per 100,000: 301 (metro area) 405 (state)
> 2016 murders: 2 (metro area) 439 (state)
> 2016 unemployment rate: 5.9% (metro area) 4.4% (state)
In the last half decade, the violent crime rate across Indiana climbed by 22.0%, a larger increase than in the vast majority of states. Crime rates were driven up in part by a dramatic increase in violent crime in the Michigan City-LaPorte metro area. Between 2011 and 2016, the violent crime rate in the metro area jumped 79.5% from 168 incidents per 100,000 residents to 301 incidents.
Despite recording the largest increase in violent crime in the state, Michigan City-LaPorte is safer than both Indiana and the country as a whole. The metro area’s violent crime rate of 301 incidents per 100,000 residents is well below the statewide rate of 405 per 100,000 and nationwide rate of 386 per 100,000.
[in-text-ad-2]
Source: Thinkstock
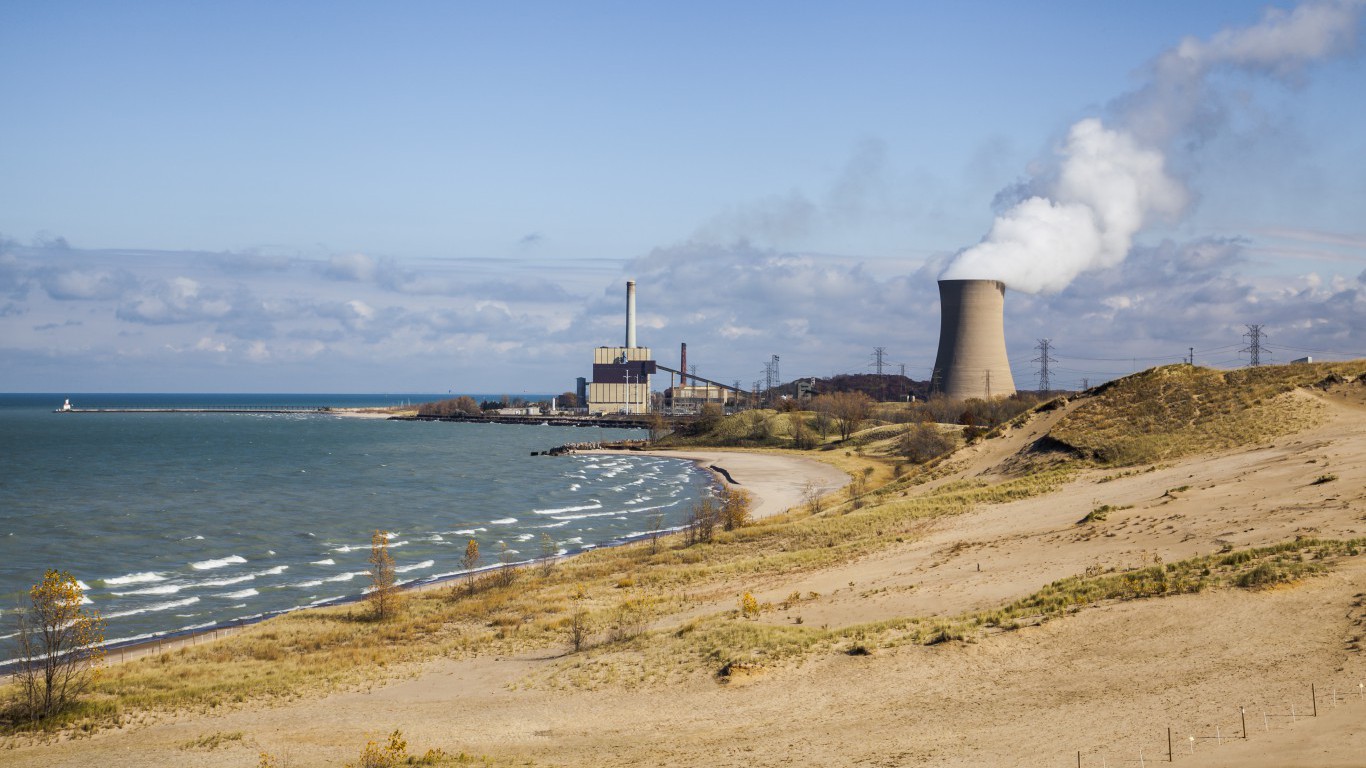
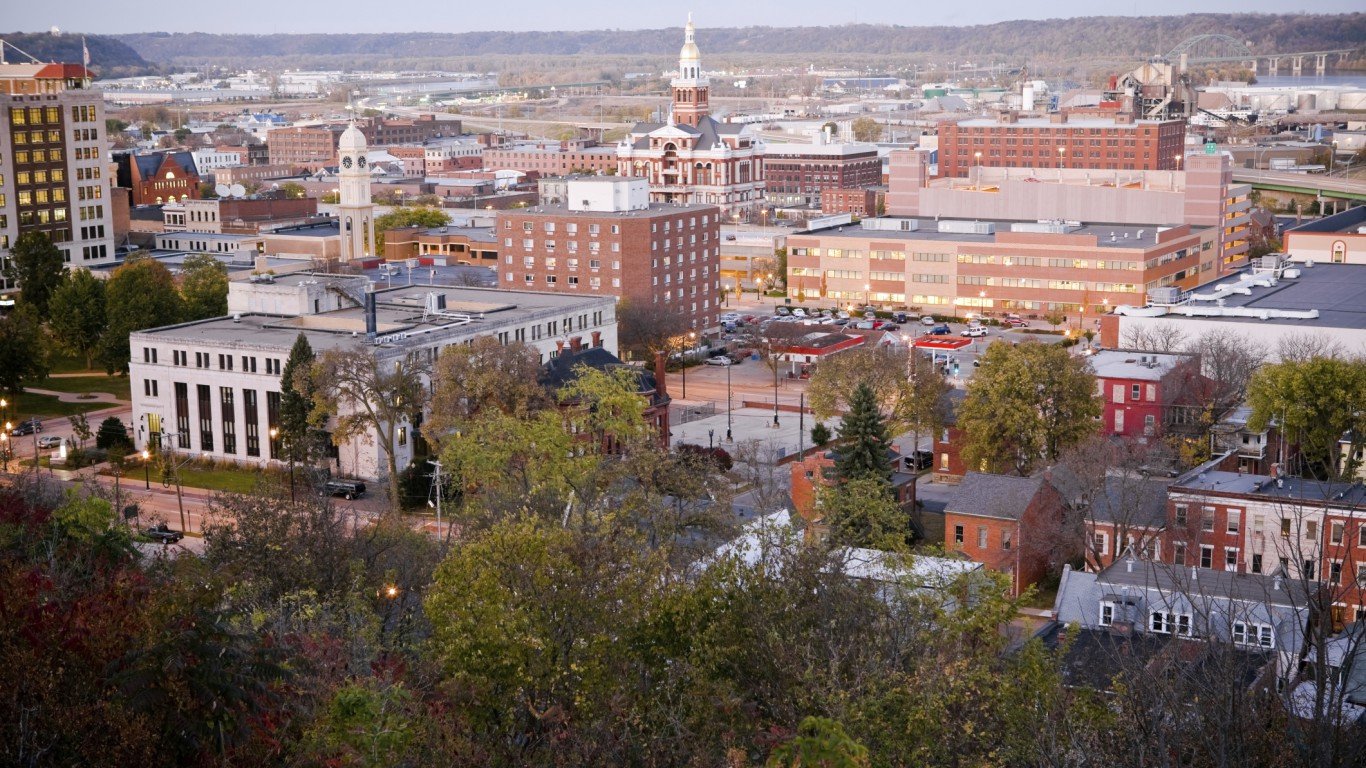
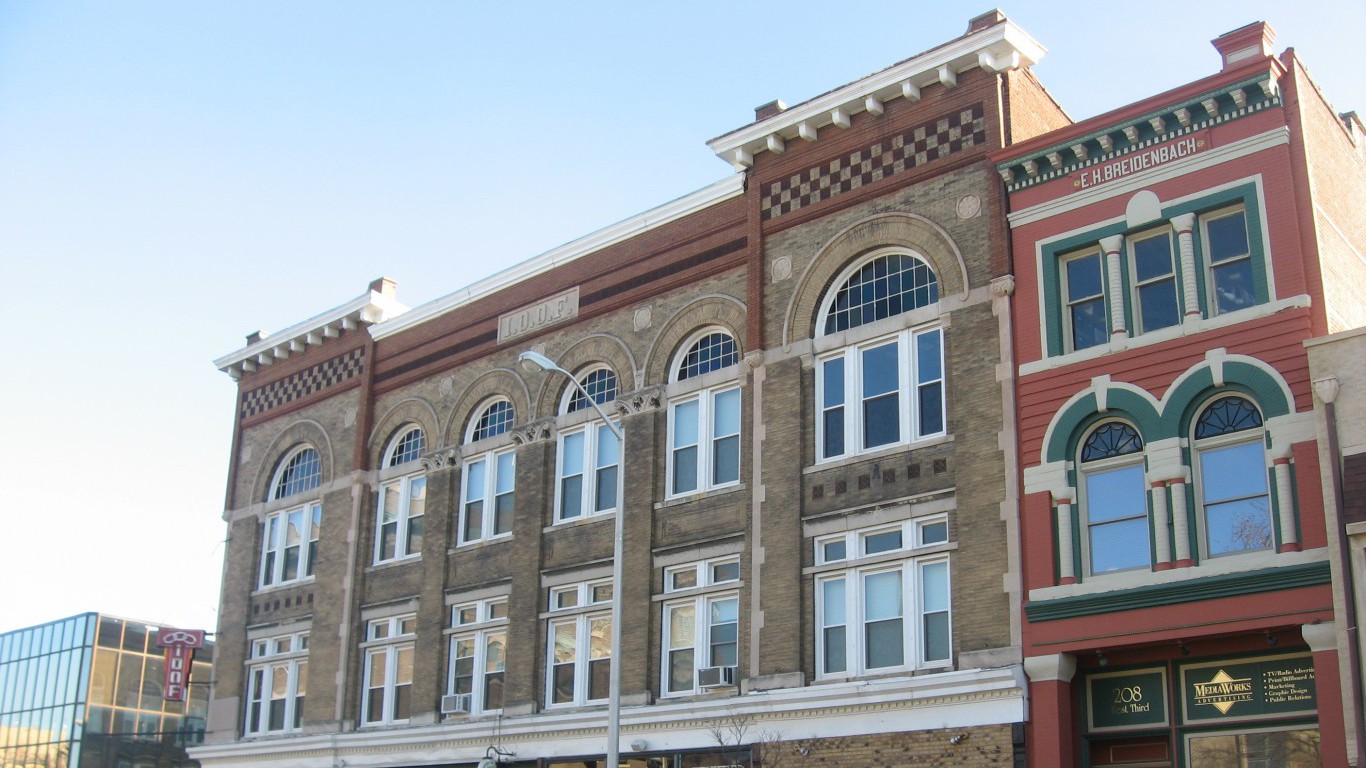
15. Iowa
> Metro area: Dubuque
> 5-yr. change in crime rate: +56.5% (metro area) +13.7% (state)
> 2016 violent crimes per 100,000: 243 (metro area) 291 (state)
> 2016 murders: 2 (metro area) 71 (state)
> 2016 unemployment rate: 3.6% (metro area) 3.7% (state)
Over the past five years, violent crime increased by at least 10% in every major metropolitan area in Iowa for which data is available with the single exception of Ames, where it fell by more than 40%. However, in the metro area of Dubuque, the violent crime rate increased by 56%, from 155 incidents per 100,000 people to 243 per 100,000. That figure is still well below the national violent crime rate of 386 incidents per 100,000, as is the violent crime rate of nearly every metro area in Iowa with the exception of Waterloo and Davenport. Unemployment has been correlated with violent crime, and Dubuque, like every other relatively safe Iowa metro area, has an unemployment rate that falls below the national figure of 4.9%.

Source: America's Power / Wikimedia Commons
16. Kansas
> Metro area: Topeka
> 5-yr. change in crime rate: +4.1% (metro area) +7.5% (state)
> 2016 violent crimes per 100,000: 392 (metro area) 380 (state)
> 2016 murders: 21 (metro area) 111 (state)
> 2016 unemployment rate: 4.1% (metro area) 4.2% (state)
The violent crime rate in Topeka, Kansas climbed by 4.1% in the last half decade, the largest reported increase of any metro area in the state. Despite the increase, Topeka is not the most dangerous metro area in Kansas. In Wichita, there were 709 violent crimes for every 100,000 residents in 2016, well above the comparable 391 per 100,000 rate in the Topeka metro area.
Across Kansas as a whole, there were 380 incidents of violent crime per 100,000 people, up 7.5% from the year before.
[in-text-ad]
Source: Wikimedia Commons
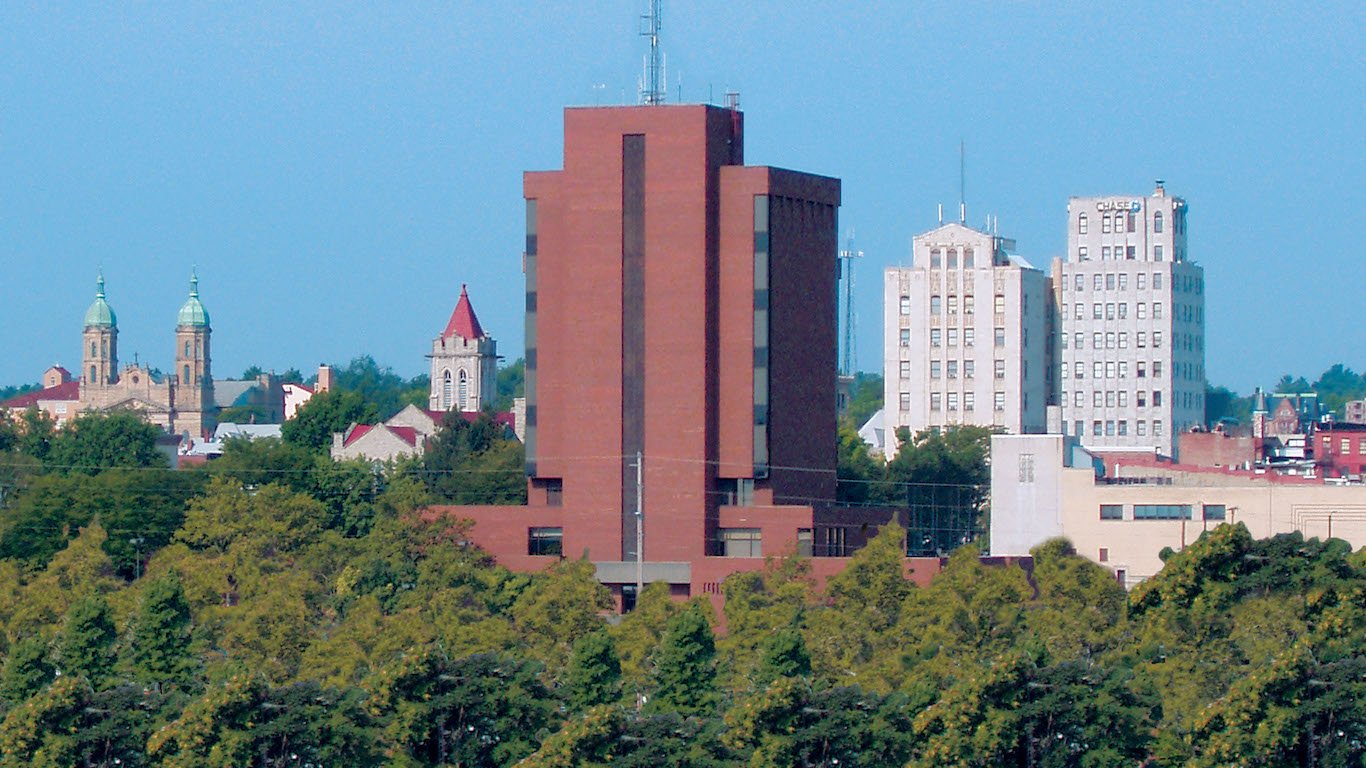
17. Kentucky
> Metro area: Owensboro
> 5-yr. change in crime rate: +1.1% (metro area) -2.5% (state)
> 2016 violent crimes per 100,000: 143 (metro area) 232 (state)
> 2016 murders: 2 (metro area) 260 (state)
> 2016 unemployment rate: 4.6% (metro area) 5.0% (state)
Due to inconsistent data collection methods, Owensboro is the only one of the five metro areas in Kentucky for which five-year crime rate changes are calculable. Between 2011 and 2016 the metro area’s violent crime rate increased by a negligible 1.1%, while the prevalence of violent crime fell by 2.5% across the state as a whole.
Despite the uptick, Owensboro is one of the safest regions in the state. The metro area’s violent crime rate of 143 incidents per 100,000 is lower than in all but one other metro area in the state and well below the rate across Kentucky as a whole of 232 violent crimes per 100,000.

Source: Thinkstock
18. Louisiana
> Metro area: Monroe
> 5-yr. change in crime rate: +85.5% (metro area) +1.9% (state)
> 2016 violent crimes per 100,000: 1,187 (metro area) 566 (state)
> 2016 murders: 20 (metro area) 554 (state)
> 2016 unemployment rate: 6.1% (metro area) 6.1% (state)
Violent crime in the Monroe metro area in Louisiana increased by more than 80% in the last five years. There were 1,187 violent crimes per 100,000 metro area residents in 2016, the highest violent crime rate not just of metro areas in the state, but also metro areas nationwide. The biggest single cause of the increase is the higher incidence of aggravated assault. The number of reported incidents of assault in the Monroe area rose from 941 in 2011 to 1,716 in 2016.
Like many metropolitan areas with high incidence of violent crime, Monroe’s population struggles with high poverty. In Monroe, 24% of the population lives at or below the poverty line, 10 percentage points above the national poverty rate.

Source: Thinkstock
19. Maine
> Metro area: Bangor
> 5-yr. change in crime rate: +19.6% (metro area) +0.5% (state)
> 2016 violent crimes per 100,000: 96 (metro area) 124 (state)
> 2016 murders: 0 (metro area) 20 (state)
> 2016 unemployment rate: 3.8% (metro area) 3.9% (state)
The Bangor, Maine metropolitan area’s violent crime rate increased by 19.6% from 2011 to 2016. Compared to the state’s slight increase of 0.5%, Bangor’s increase is notably greater. In other areas in the state crime decreased. For example, in the Lewiston-Auburn area, violent crime fell 11.7% over the same period.
Despite the increase, Bangor is one of the safest metro areas in the country. There were only 96 violent crimes for every 100,000 residents in 2016, a fraction of the U.S. violent crime rate of 386 incidents per 100,000.
[in-text-ad-2]

Source: Thinkstock
20. Maryland
> Metro area: Baltimore-Columbia-Towson
> 5-yr. change in crime rate: +9.9% (metro area) -4.5% (state)
> 2016 violent crimes per 100,000: 710 (metro area) 472 (state)
> 2016 murders: 395 (metro area) 481 (state)
> 2016 unemployment rate: 4.4% (metro area) 4.3% (state)
The violent crime rate in the Baltimore-Columbia-Towson metro area between 2011 and 2016 jumped by nearly 10% — even as the statewide crime rate fell by 4.5%. Up from 646 violent crimes per 100,000 people in 2011, Baltimore’s current annual violent crime rate of 710 incidents per 100,000 ranks among the highest of any metro area in the country.
Baltimore-Columbia-Towson metro area’s crime rate is driven in large part by violence in the city of Baltimore. Of the 395 homicides across the metro area, 318 occurred in Baltimore, making 2016 the second deadliest year in the city’s history.
Source: Protophobic / Wikimedia Commons
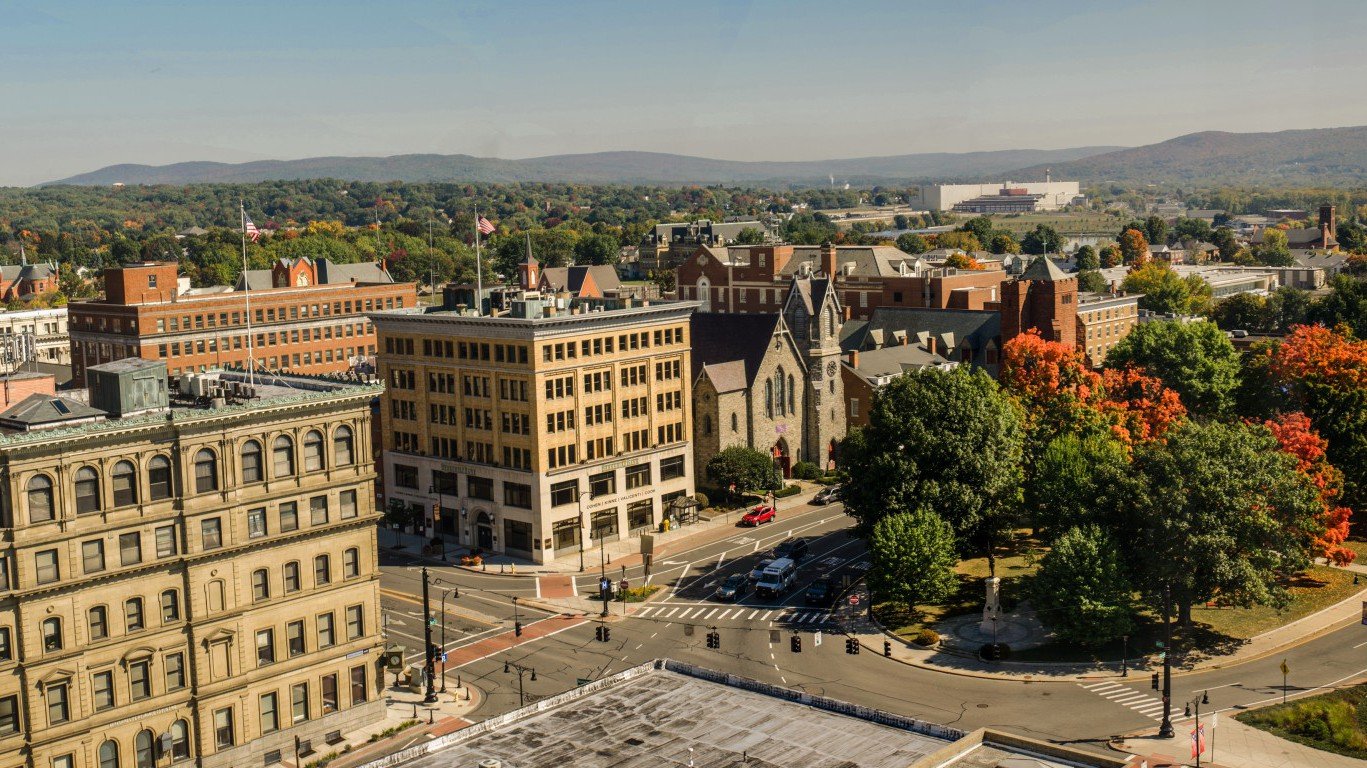
21. Massachusetts
> Metro area: Pittsfield
> 5-yr. change in crime rate: +24.9% (metro area) -12.0% (state)
> 2016 violent crimes per 100,000: 513 (metro area) 377 (state)
> 2016 murders: 3 (metro area) 134 (state)
> 2016 unemployment rate: 4.4% (metro area) 3.7% (state)
The violent crime rate in Massachusetts fell by 12% over the last five years — the fifth largest decline among states. However, in the Pittsfield metro area, located in the far west of the state, the violent crime rate rose by about 25% over the same period, from 411 incidents per 100,000 to 513 incidents per 100,000 people.
While Pittsfield’s increase over the last five years puts its violent crime rate well above both the state and national crime rates, it does not match the typical profile of a high crime city. Pittsfield’s poverty rate of 9.8% is well below the national figure of 14.0%. Also, the metro area’s median household income and high school and college attainment figures are above the corresponding national values.
[in-text-ad]

Source: Andrew Jameson / Wikimedia Commons
22. Michigan
> Metro area: Bay City
> 5-yr. change in crime rate: +35.0% (metro area) +3.1% (state)
> 2016 violent crimes per 100,000: 370 (metro area) 459 (state)
> 2016 murders: 3 (metro area) 598 (state)
> 2016 unemployment rate: 5.2% (metro area) 4.9% (state)
While the incidence of violent crime in some parts of Michigan such as Saginaw and Flint decreased substantially in recent years, in others, such as Lansing-East Lansing and Battle Creek, violent crime rates increased significantly. The Bay City metro area had the worst increase, with a 35% surge in violent crime from 2011 to 2016. Still, Bay City’s violent crime rate of 370 incidents per 100,000 residents in 2016 is much lower than some other areas. For instance, Battle Creek’s violent crime rate is 747 incidents per 100,000.

Source: Thinkstock
23. Minnesota
> Metro area: None
> 5-yr. change in crime rate: +9.7% (state)
> 2016 violent crimes per 100,000: 243 (state)
> 2016 murders: 101 (state)
> 2016 unemployment rate: 3.9% (state)
Due to a lack of data, five-year changes in violent crime rates among Minnesota’s five metro areas are unavailable. Across the state as a whole, the incidence of violent crime increased by nearly 10%, more than in most states. Despite the increased violence, Minnesota is one of the safest states in the country. There were 243 violent crimes in the state for every 100,000 people in 2016, fewer than in all but eight other states.
Even Minnesota’s urban areas are relatively safe places. The violent crime rate in each of the state’s five metro areas is below 300 incidents per 100,000 people, and in three it is below 200 per 100,000. For reference, the U.S. violent crime rate is 386 incidents per 100,000 people.
Source: Tiago_Fernandez / iStock
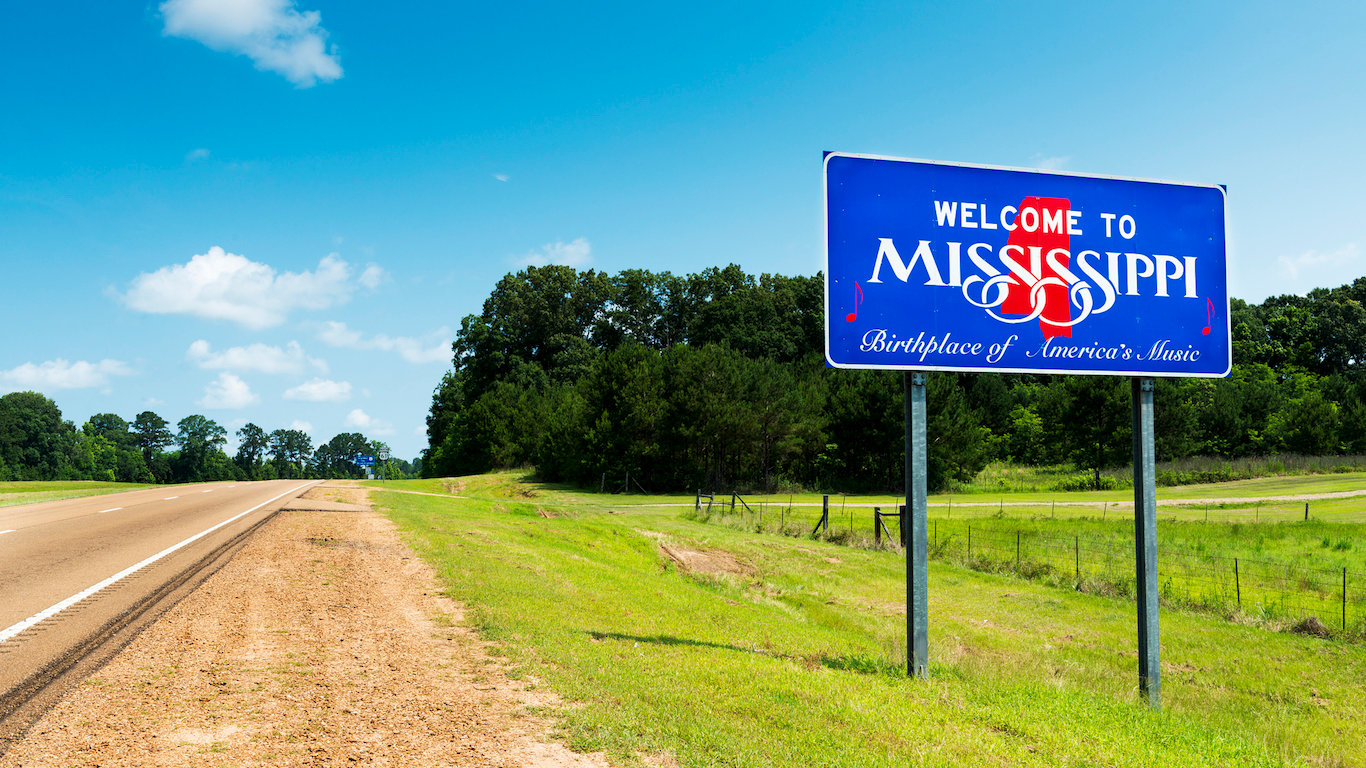
24. Mississippi
> Metro area: None
> 5-yr. change in crime rate: +4.0% (state)
> 2016 violent crimes per 100,000: 281 (state)
> 2016 murders: 238 (state)
> 2016 unemployment rate: 5.8% (state)
Due to insufficient data, the five-year change in the violent crime rate in Hattiesburg, Mississippi — the one metro area in the state for which the FBI tracks crime statistics — is incalculable. Statewide, the violent crime rate climbed by 4.0% in the last five years, one of the smaller increases of any state.
Today, both Mississippi and the Hattiesburg metro area are safer than the U.S. as a whole. There were 199 violent crimes in Hattiesburg and 281 in Mississippi for every 100,000 people, each well below the U.S. violent crime rate of 386 incidents per 100,000 people.
[in-text-ad-2]
Source: Tim Kiser / Wikimedia Commons
25. Missouri
> Metro area: St. Joseph
> 5-yr. change in crime rate: +52.6% (metro area) +16.1% (state)
> 2016 violent crimes per 100,000: 420 (metro area) 519 (state)
> 2016 murders: 10 (metro area) 537 (state)
> 2016 unemployment rate: 4.1% (metro area) 4.5% (state)
There was a 52.6% spike in violent crime in the St. Joseph metropolitan area between 2011 and 2016. The violent crime rate increased from 275 incidents per 100,000 in 2011 to 420 per 100,000 five years later. The incidence of rapes more than doubled over this period, increasing from 22.7 per 100,000 to 47.4. Similarly, the incidence of murder also more than doubled, increasing from 3.1 per 100,000 to 7.9.

Source: Roy Luck / Flickr
26. Montana
> Metro area: None
> 5-yr. change in crime rate: +37.7% (state)
> 2016 violent crimes per 100,000: 368 (state)
> 2016 murders: 36 (state)
> 2016 unemployment rate: 4.1% (state)
Montana has no major metropolitan areas with comparable data over the last five years. However, crime across the state as a whole has increased from a 2011 rate of 268 violent crimes per 100,000 people to a 2016 rate of 368 per 100,000. The increase in the crime rate of 37.7% is nearly the largest of any state in the country, and in sharp contrast to the relatively flat U.S. crime rate. In addition to violent crime, property crime also rose in Montana. The number of reported motor vehicle thefts, for example, increased from under 1,500 to over 2,700.
[in-text-ad]

Source: City of La Vista Government / Facebook
27. Nebraska
> Metro area: None
> 5-yr. change in crime rate: +14.9% (state)
> 2016 violent crimes per 100,000: 291 (state)
> 2016 murders: 49 (state)
> 2016 unemployment rate: 3.2% (state)
Neither of the two major metropolitan areas in Nebraska for which sufficient data is available reported an increase in violent crime in the last five years. The violent crime rate in Lincoln declined by 0.6% since 2011, and in the Omaha-Council Bluffs metro area, the incidence of violent crime dropped 8.5% over the same period. These declines, however, were not enough to reduce violent crime across the state as a whole. Over the same period, Nebraska’s violent crime rate climbed by 14.9%.
Despite the increase, Nebraska is safer than the U.S. as a whole. There were 291 violent crimes in the state for every 100,000 people in 2016, well below the comparable U.S. rate of 386 per 100,000.
Source: Andrew Zarivny / Shutterstock.com
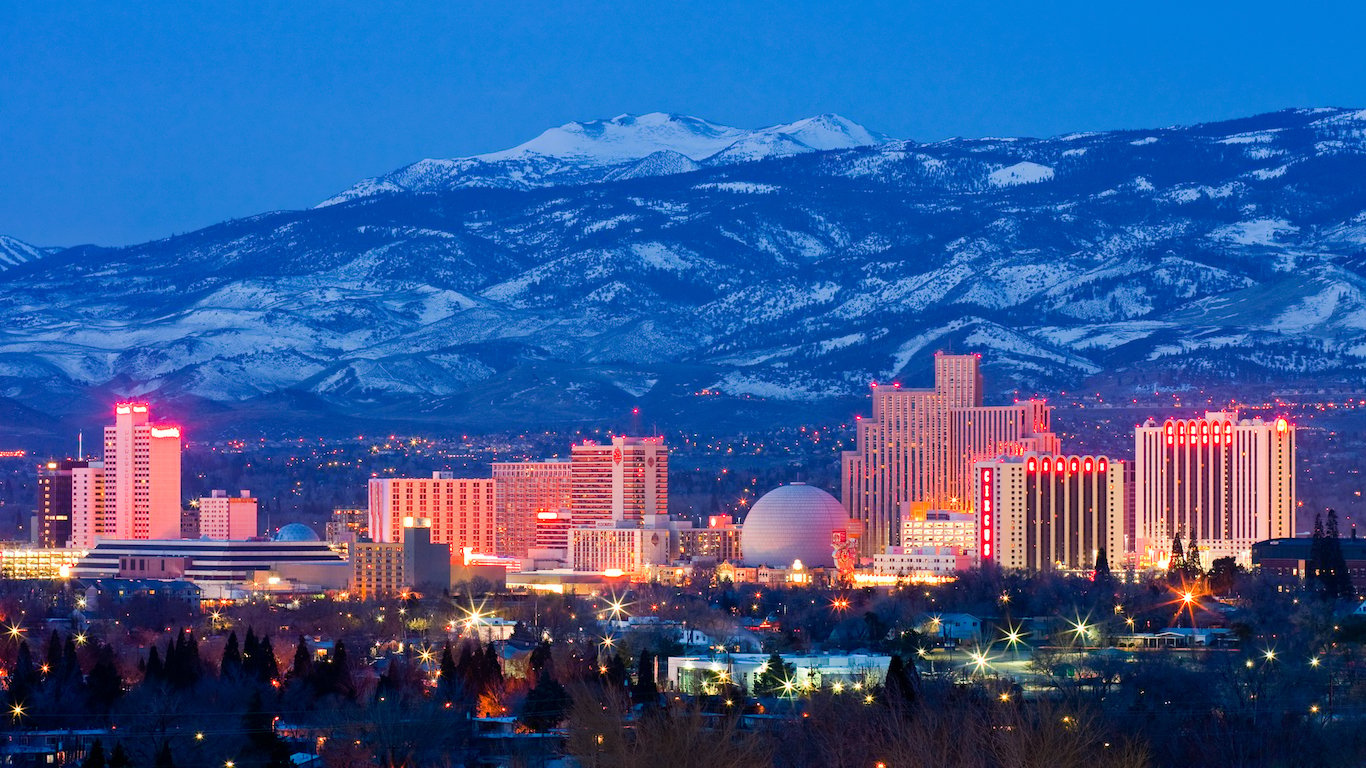
28. Nevada
> Metro area: Reno
> 5-yr. change in crime rate: +31.4% (metro area) +20.6% (state)
> 2016 violent crimes per 100,000: 515 (metro area) 678 (state)
> 2016 murders: 14 (metro area) 224 (state)
> 2016 unemployment rate: 5.0% (metro area) 5.7% (state)
The violent crime rate in Reno increased from 392 incidents per 100,000 residents in 2011 to 515 in 2016. For comparison, across Nevada the rate increased from 562 violent crimes per 100,000 residents to 678 over the same period. Still, the Nevada’s 20.6% increase in violent crime from 2011 was much smaller the Reno’s 31.4% increase over the same time.
The Las Vegas-Henderson-Paradise area reported the highest violent crime rate of all metropolitan areas in the state in 2016, with 771 incidents per 100,000 people.

Source: Thinkstock
29. New Hampshire
> Metro area: Manchester-Nashua
> 5-yr. change in crime rate: +5.5% (metro area) +5.1% (state)
> 2016 violent crimes per 100,000: 269 (metro area) 198 (state)
> 2016 murders: 5 (metro area) 17 (state)
> 2016 unemployment rate: 2.7% (metro area) 2.8% (state)
The incidence of violent crime in the Manchester-Nashua metro area increased by 5.5% in the last five years, roughly in line with the 5.1% uptick across New Hampshire as a whole.
High crime rates are more common in areas with high poverty and lagging economies. In the Manchester-Nashua metro area, only 8.2% of the population lives below the poverty line and only 2.7% of the labor force are out of a job, each well below the corresponding U.S. poverty and unemployment rates of 14.0% and 4.9%. As might be expected, Manchester-Nashua is safer than the U.S. as a whole. There were only 269 incidents of violent crime for every 100,000 residents in 2016, compared to 386 per 100,000 nationwide.
[in-text-ad-2]

Source: Thinkstock
30. New Jersey
> Metro area: None
> 5-yr. change in crime rate: -20.6% (state)
> 2016 violent crimes per 100,000: 245 (state)
> 2016 murders: 372 (state)
> 2016 unemployment rate: 5.0% (state)
New Jersey is one of a handful of states in which violent crime rates dropped in every major metro area in the last five years. Of the two metro areas in the state for which sufficient data is available — Ocean City and Trenton — the incidence of violent crime fell by 26.9% and 7.7%, respectively, from 2011 to 2016. The falling crime rates in the state’s major cities contributed to the largest statewide five-year decrease in violent crime. New Jersey’s violent crime rate fell 20.6% from 308 incidents per 100,000 in 2011 to 245 incidents per 100,000 in 2016.

Source: Christopher Nicol / Wikimedia Commons
31. New Mexico
> Metro area: Farmington
> 5-yr. change in crime rate: +51.6% (metro area) +23.8% (state)
> 2016 violent crimes per 100,000: 947 (metro area) 703 (state)
> 2016 murders: 2 (metro area) 139 (state)
> 2016 unemployment rate: 8.9% (metro area) 6.7% (state)
The violent crime rate in Farmington has increased by 51.6% over the last five years — more than twice as much as the increase of 23.8% across New Mexico over that time. There were increases in all categories of violent crime except for murder, which decreased slightly. The Albuquerque metropolitan area also reported an uptick in violence over this same period — which at 36.1%, was greater than that of the state but still a considerably smaller increase than in Farmington. In addition to recording the largest increase in violent crime in New Mexico, Farmington also has the highest per capita violent crime rate of all metro areas in the state.
[in-text-ad]
Source: Thinkstock
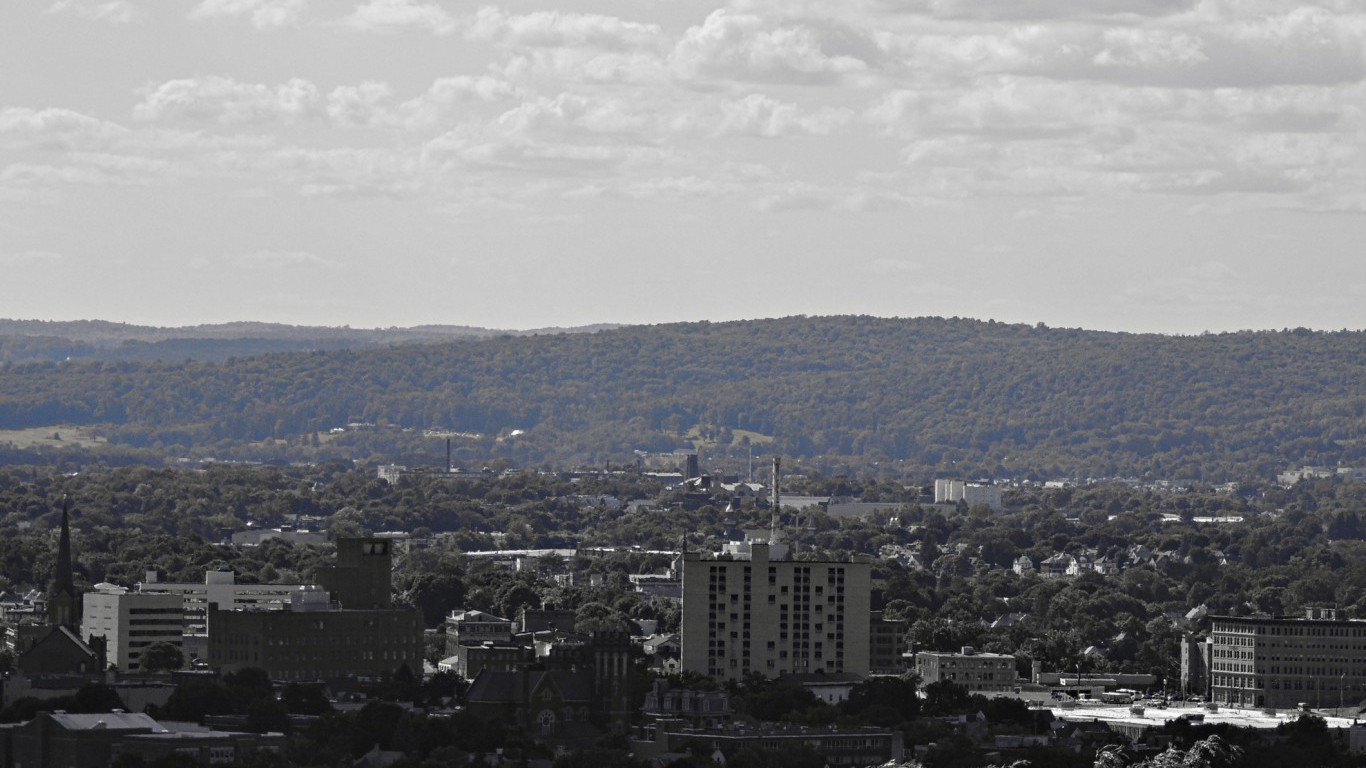
32. New York
> Metro area: Binghamton
> 5-yr. change in crime rate: +33.5% (metro area) -5.5% (state)
> 2016 violent crimes per 100,000: 289 (metro area) 376 (state)
> 2016 murders: 6 (metro area) 630 (state)
> 2016 unemployment rate: 5.3% (metro area) 4.8% (state)
Violent crime in the Binghamton metro area has increased by 33.5% over the last five years, even as it decreased by 5.5% across New York as a whole over the same period. In a number of metropolitan areas in New York, including Syracuse, Buffalo-Cheektowaga-Niagara Falls, and Kingston, violent crime decreased over the same period. Meanwhile, Binghamton reported an increased rate in all categories of violent crime — murder, rape, aggravated assault, and robbery.
Source: Derek Olson Photography / Shutterstock.com
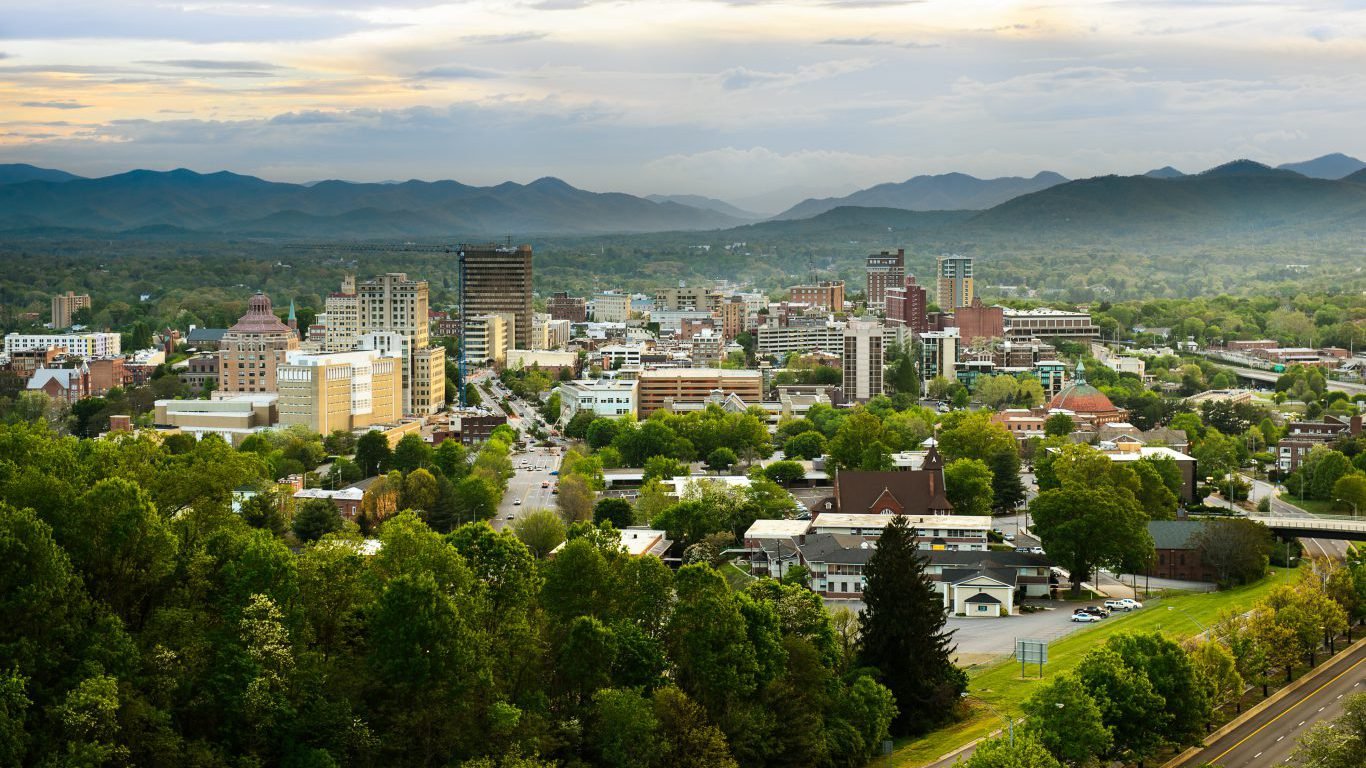
33. North Carolina
> Metro area: Asheville
> 5-yr. change in crime rate: +10.3% (metro area) +6.4% (state)
> 2016 violent crimes per 100,000: 240 (metro area) 372 (state)
> 2016 murders: 23 (metro area) 678 (state)
> 2016 unemployment rate: 4.1% (metro area) 5.1% (state)
The incidence of violent crime in the Asheville metro area climbed 10.3% in the last five years, far outpacing the 6.4% uptick across North Carolina as a whole. Despite the increase, Asheville remains a relatively safe part of the state. There were 240 violent crimes in the metro area for every 100,000 residents in 2016, far fewer than the 372 incidents per 100,000 people across the state.
Meanwhile, the North Carolina metro areas reporting the largest decreases in violent crime remain relatively dangerous. The Rocky Mount metro area, for example, reported a 10.2% drop in the incidence of violent crime in the last five years. Still, there were 448 violent crimes in the metro area for every 100,000 people in 2016, well above the state and nationwide rates.

Source: DavidLeshem / iStock
34. North Dakota
> Metro area: None
> 5-yr. change in crime rate: +1.7% (state)
> 2016 violent crimes per 100,000: 251 (state)
> 2016 murders: 15 (state)
> 2016 unemployment rate: 3.2% (state)
Due to insufficient data, the five-year change in the violent crime rate in Bismarck, North Dakota — the one metro area in the state for which the FBI tracks crime statistics — is incalculable. As of 2016, there were a reported 294 incidents of violent crime for every 100,000 metro area residents — a lower crime rate than in the majority of U.S. metro areas.
While the violent crime rate remained effectively unchanged nationwide over the last five years, it rose just slightly — by 1.7% — in North Dakota. Still, the state’s 2016 violent crime rate of 251 incidents per 100,000 residents is well below the nationwide rate of 386 incidents per 100,000 people.
[in-text-ad-2]
Source: John Siegenthaler / Wikimedia Commons
35. Ohio
> Metro area: Mansfield
> 5-yr. change in crime rate: +31.9% (metro area) -2.3% (state)
> 2016 violent crimes per 100,000: 240 (metro area) 300 (state)
> 2016 murders: 6 (metro area) 654 (state)
> 2016 unemployment rate: 5.5% (metro area) 4.9% (state)
Of the four Ohio metro areas for which sufficient data is available, none reported a greater spike in violence in the last five years than Mansfield. The violent crime rate rose from 182 incidents per 100,000 people in 2011 to 240 per 100,000 in 2016 — a 31.9% spike. The increase was a break from the statewide trend of decreasing violent crime. Over the same period, Ohio’s violent crime rate fell from 307 incidents per 100,000 people to 300 per 100,000, a 2.3% improvement.
As is often the case, a climbing violent crime rate in a given metro area does not necessarily mean the area is especially dangerous. Despite the five-year increase, Mansfield’s violent crime rate of 240 incidents per 100,000 is the lowest of the nine metro areas in Ohio.

Source: Thinkstock
36. Oklahoma
> Metro area: Tulsa
> 5-yr. change in crime rate: +6.3% (metro area) -1.1% (state)
> 2016 violent crimes per 100,000: 589 (metro area) 450 (state)
> 2016 murders: 91 (metro area) 245 (state)
> 2016 unemployment rate: 5.0% (metro area) 4.9% (state)
Across Oklahoma, the incidence of violent crime fell slightly from 455 incidents per 100,000 people in 2011 to 450 per 100,000 in 2016. In a break with the statewide trend, the incidence of violent crime increased by 6.3% in Tulsa over the same period, from 554 crimes per 100,000 to 589 per 100,000. Meanwhile, in Oklahoma City, the only other metro area in the state for which data is available, the incidence of violent crime decreased by 7.1% from 528 incidents per 100,000 people to 491 per 100,000.
[in-text-ad]

Source: Wikimedia Commons
37. Oregon
> Metro area: Medford
> 5-yr. change in crime rate: +23.3% (metro area) +6.9% (state)
> 2016 violent crimes per 100,000: 358 (metro area) 265 (state)
> 2016 murders: 5 (metro area) 113 (state)
> 2016 unemployment rate: 5.8% (metro area) 4.9% (state)
While rates of major crimes such as murder and rape in Medford have decreased between 2011 and 2016, rates of crimes such as robbery and aggravated assault increased, driving the overall violent crime rate in the area higher. Medford also reported the highest violent crime rate statewide in 2016, with 358 incidents per 100,000 residents. For comparison, the violent crime rate in the Corvallis metro area was 128 incidents per 100,000 residents in 2016, and in Bend-Redmond – where violent crime decreased by 54.2% over the last five years – it was 152 per 100,000.
Source: Djorion / Wikimedia Commons
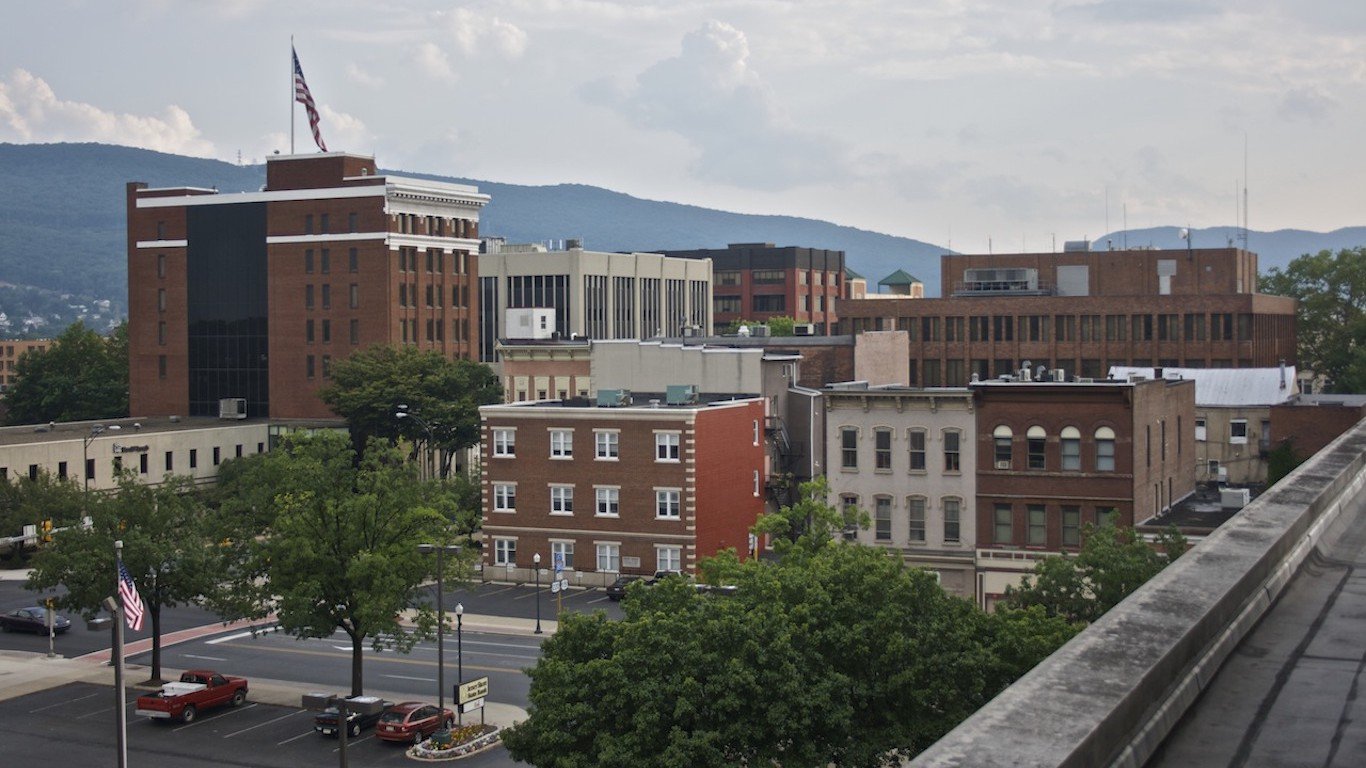
38. Pennsylvania
> Metro area: Williamsport
> 5-yr. change in crime rate: +15.8% (metro area) -10.9% (state)
> 2016 violent crimes per 100,000: 206 (metro area) 316 (state)
> 2016 murders: 7 (metro area) 661 (state)
> 2016 unemployment rate: 6.7% (metro area) 5.4% (state)
Pennsylvania’s violent crime rate declined by about 11% between 2011 and 2016. The crime rate also declined in 10 of the state’s 11 metropolitan statistical areas with comparable data, the vast majority of which were double-digit declines. However, in the 11th metropolitan area, Williamsport, the incidence of violent crime increased by a substantial 15%. Despite the increase, Williamsport’s 2016 violent crime rate of 206 incidents per 100,000 residents remains lower than in the majority of U.S. metro areas.

Source: danlogan / iStock
39. Rhode Island
> Metro area: None
> 5-yr. change in crime rate: -3.5% (state)
> 2016 violent crimes per 100,000: 239 (state)
> 2016 murders: 29 (state)
> 2016 unemployment rate: 5.3% (state)
Due to reporting inconsistencies, the 2011 violent crime data for the Providence-Warwick metro area — the only metro area in Rhode Island — is not comparable to the 2016 violent crime data. Statewide, the incidence of violent crime fell by 3.5% making Rhode Island one of only 13 states where the violent crime rate declined over the past five years.
The Providence metro area is slightly more dangerous than the state as a whole. There were 315 violent crimes in the metro area for every 100,000 people in 2016, considerably more than the 239 violent crimes per 100,000 people across the state.
[in-text-ad-2]

Source: Wikimedia Commons
40. South Carolina
> Metro area: Sumter
> 5-yr. change in crime rate: +16.8% (metro area) -12.3% (state)
> 2016 violent crimes per 100,000: 591 (metro area) 502 (state)
> 2016 murders: 4 (metro area) 366 (state)
> 2016 unemployment rate: 5.7% (metro area) 4.8% (state)
The murder rate in South Carolina’s Sumter metro area decreased from 15.6 per 100,000 people in 2011 to 3.7 per 100,000 in 2016. However, aggravated assaults over this same period increased from 360.6 to 491.3 per 100,000. Due in large part to the increase in the area’s aggravated assault rate, the overall incidence of violent crime in Sumter climbed 16.8% to 591 incidents per 100,000 people in the last five years.
Areas with high poverty rates also tend to have higher violent crime rates. In Sumter, a larger than typical 21.2% of the population live in poverty.

Source: Downtown Sioux Falls Inc. / Facebook
41. South Dakota
> Metro area: Sioux Falls
> 5-yr. change in crime rate: +80.4% (metro area) +64.7% (state)
> 2016 violent crimes per 100,000: 388 (metro area) 418 (state)
> 2016 murders: 10 (metro area) 27 (state)
> 2016 unemployment rate: 2.3% (metro area) 2.8% (state)
In South Dakota, Sioux Falls’ violent crime rate rose by an alarming 80% between 2011 and 2016. While this increase is substantial, because of the area’s previously low violent crime rate, it did not lead to an extraordinarily high crime rate. Sioux Falls’ violent crime rate rose from 215 incidents per 100,000 people in 2011, one of the lowest rates of any metropolitan area that year, to 388 incidents per 100,000 incidents in 2016 — in line with the national rate of 386 per 100,000 incidents.
[in-text-ad]

Source: Thinkstock
42. Tennessee
> Metro area: Chattanooga
> 5-yr. change in crime rate: +7.9% (metro area) +4.1% (state)
> 2016 violent crimes per 100,000: 541 (metro area) 633 (state)
> 2016 murders: 33 (metro area) 486 (state)
> 2016 unemployment rate: 4.9% (metro area) 4.8% (state)
The incidence of violent crime increased by 4.1% in Tennessee from 2011 to 2016. Today, the state ranks among the most dangerous in the country, with a violent crime rate of 633 incidents per 100,000 residents. Crime rates in the state are driven largely by violent crime in major metro areas. Of the state’s nine metro areas tracked by the FBI, seven have a higher violent crime rate than the U.S. as a whole — including Memphis, which is one of the most dangerous metro areas in the country with 1,082 violent crimes per 100,000 people.
In the Chattanooga metro area, the violent crime rate increased by 7.9% over the past half decade. Despite the greater increase in violent crime than the increase statewide, Chattanooga is safer than the state as a whole with a violent crime rate of 541 incidents per 100,000 people.
Source: Larry D. Moore / Wikimedia Commons
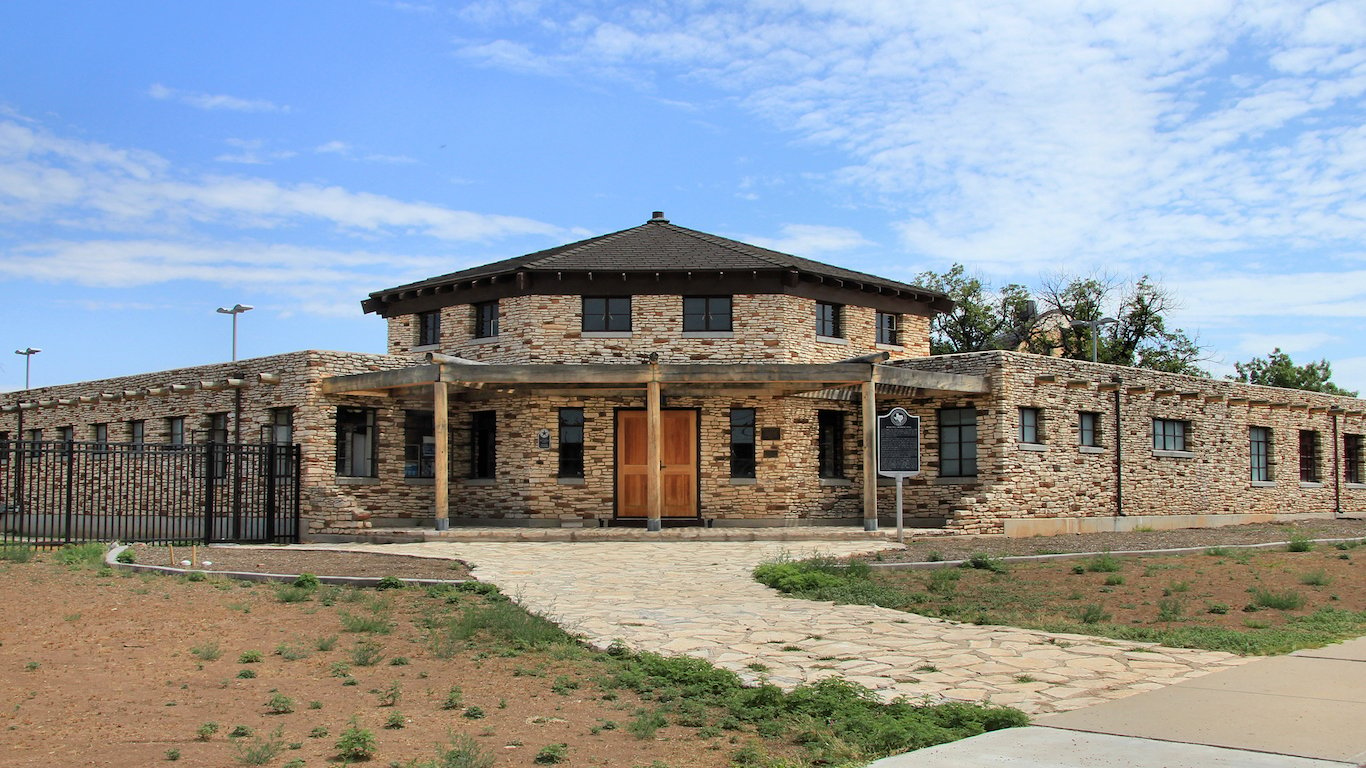
43. Texas
> Metro area: San Angelo
> 5-yr. change in crime rate: +32.7% (metro area) +6.3% (state)
> 2016 violent crimes per 100,000: 334 (metro area) 434 (state)
> 2016 murders: 6 (metro area) 1,478 (state)
> 2016 unemployment rate: 4.5% (metro area) 4.6% (state)
The incidence of violent crime in the San Angelo metro area spiked 32.7% from 2011 to 2016, the largest increase of any metro area in the state and well above the 6.3% statewide uptick.
In many metro areas on this list, the spikes in crime are often the result of a particularly bad 2016 and not part of a broader trend of increasing violence. The San Angelo metro area, however, is not one of them as the incidence of violent crime has increased in each of the last five years. Despite the increase, San Angelo is safer than Texas as a whole. There were 334 violent crimes in the area for every 100,000 residents in 2016, below the 434 incidents per 100,000 residents across the Lone Star State.
Source: Wikimedia Commons
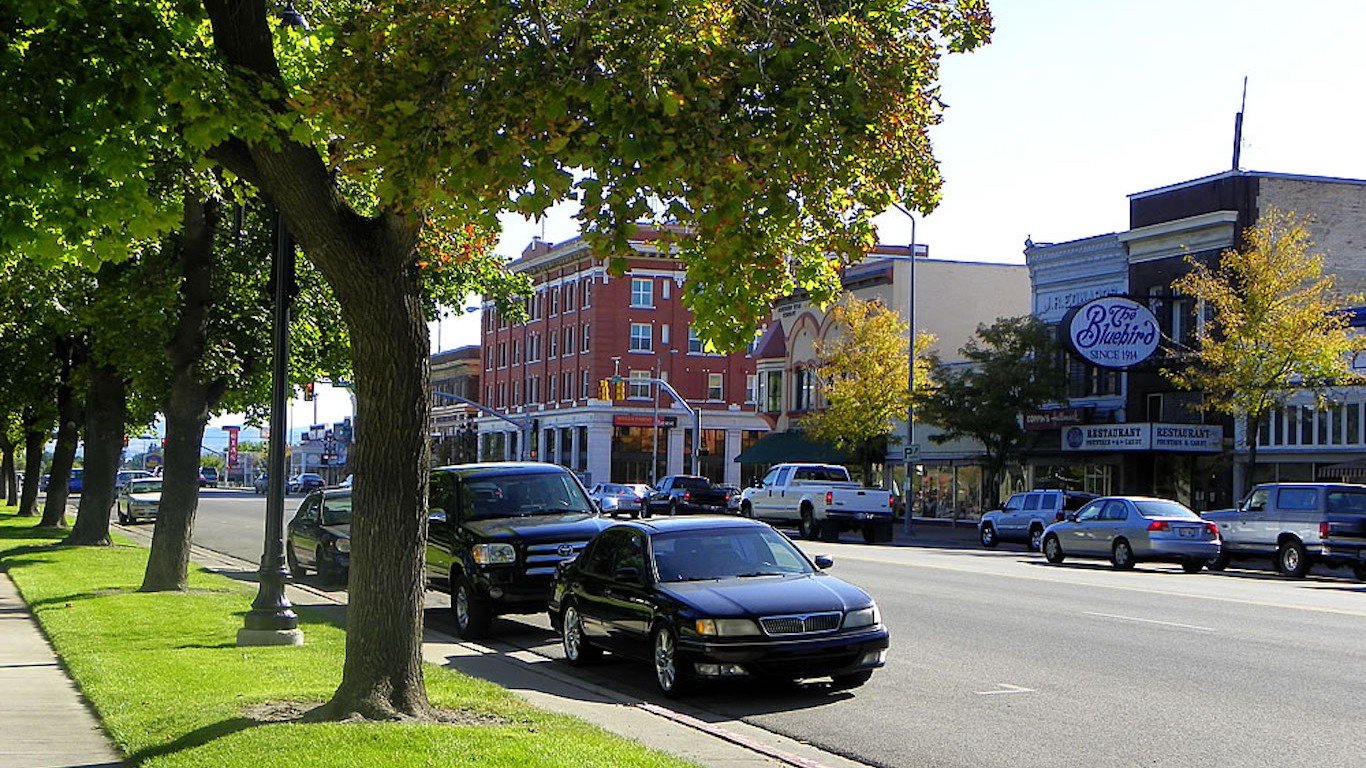
44. Utah
> Metro area: Logan
> 5-yr. change in crime rate: +38.8% (metro area) +24.5% (state)
> 2016 violent crimes per 100,000: 66 (metro area) 243 (state)
> 2016 murders: 2 (metro area) 72 (state)
> 2016 unemployment rate: 3.1% (metro area) 3.4% (state)
Utah’s Logan metropolitan area has an especially low violent crime rate relative to the rest of the country. In 2016, there were 66.2 violent crimes per 100,000 residents, compared to 386.3 per 100,000 nationwide. Today, Logan is the safest metro area in Utah and among the safest nationwide. Nevertheless, violent crime in Logan shot up 38.8% from 2011 to 2016. The murder, rape, and robbery rates all increased. However, there was a slight decrease in aggravated assaults.
[in-text-ad-2]

Source: ciapix / Wikimedia Commons
45. Vermont
> Metro area: None
> 5-yr. change in crime rate: (metro area) +17.1% (state)
> 2016 violent crimes per 100,000: 158 (state)
> 2016 murders: 14 (state)
> 2016 unemployment rate: 3.3% (state)
Vermont’s Burlington metropolitan area does not have comparable crime data over the past five years. However, violent crime across the state rose by 17% between 2011 and 2016, compared to the national 0.2% decrease nationwide. Even with the increase, however, violent crime in the state remains lower than nearly all other states. The state’s 2016 violent crime rate of 158 reported incidents per 100,000 residents is the second lowest of any state, behind only Maine.

Source: Alma mater / Wikimedia Commons
46. Virginia
> Metro area: Harrisonburg
> 5-yr. change in crime rate: +37.3% (metro area) +10.6% (state)
> 2016 violent crimes per 100,000: 163 (metro area) 218 (state)
> 2016 murders: 3 (metro area) 484 (state)
> 2016 unemployment rate: 3.9% (metro area) 4.0% (state)
All major categories of violent crime — murder, rape, robbery, and aggravated assault — increased in Harrisonburg between 2011 and 2016. There were also significant increases in property crime and burglaries in the area over this period. Despite the increase, Harrisonburg is a relatively safe metro area. There were only 163 violent crimes in the metro area per 100,000 people in 2016, below both the state and national rates of 218 and 386 per 100,000, respectively.
[in-text-ad]

Source: Thinkstock
47. Washington
> Metro area: Seattle-Tacoma-Bellevue
> 5-yr. change in crime rate: +7.0% (metro area) +2.6% (state)
> 2016 violent crimes per 100,000: 353 (metro area) 302 (state)
> 2016 murders: 101 (metro area) 195 (state)
> 2016 unemployment rate: 4.5% (metro area) 5.4% (state)
The majority of metro areas in Washington state reported declining violent crime rates between 2011 and 2016. However, the Seattle-Tacoma-Bellevue metro area did not fit in with the broader trend. The incidence of violence in the metro area is now 7.0% higher than it was five years ago, the largest increase of any metro area in the state. The increasing incidence of violence in the state’s largest metro area likely played a considerable roll in driving the violent crime rate up statewide.

Source: BackyardProduction / iStock
48. West Virginia
> Metro area: None
> 5-yr. change in crime rate: +13.4% (state)
> 2016 violent crimes per 100,000: 358 (state)
> 2016 murders: 81 (state)
> 2016 unemployment rate: 6.0% (state)
West Virginia has no metropolitan statistical areas that can be compared across this five-year period. However, the statewide incidence of violent crime in West Virginia rose by 13.4% from 2011 to 2016, from 316 violent crimes per 100,000 residents in 2011 to 358 per 100,000 in 2016. Despite the increase, the state’s violent crime rate remains lower than the national rate of 386 per 100,000 residents.

Source: Thinkstock
49. Wisconsin
> Metro area: Sheboygan
> 5-yr. change in crime rate: +13.9% (metro area) +29.1% (state)
> 2016 violent crimes per 100,000: 155 (metro area) 306 (state)
> 2016 murders: 2 (metro area) 229 (state)
> 2016 unemployment rate: 3.5% (metro area) 4.1% (state)
Sheboygan’s 13.9% five-year increase in violent crime is the largest among Wisconsin’s metropolitan areas, yet is still less than the state’s overall spike of 29.1%. Violent crime in the area increased even as there was economic improvement during that time. The poverty rate dropped from 11.5% in 2012 to 5.4% in 2016, one of the lowest poverty rates nationwide. From 2012 to 2016 the poverty rate dropped rapidly, from 11.5% to 5.4%. The Sheboygan metro area’s unemployment rate of 2.6% as of December 2017 is also especially low. The national jobless rate at the time was 4.1%.
[in-text-ad-2]

Source: Cliff / Wikimedia Commons
50. Wyoming
> Metro area: Cheyenne
> 5-yr. change in crime rate: +3.1% (metro area) +11.4% (state)
> 2016 violent crimes per 100,000: 252 (metro area) 244 (state)
> 2016 murders: 8 (metro area) 20 (state)
> 2016 unemployment rate: 4.1% (metro area) 5.3% (state)
While in many states, increases in violent crimes are often driven by spikes in crime in the state’s metropolitan area, this is not the case in Wyoming. Statewide, the violent crime rate increased by 11.4% over the past five years, yet the largest increase among Wyoming’s metropolitan areas was just 3.1%. While violent crime did not rise by much in Cheyenne, the situation there is far from ideal. For instance, the murder rate in the area increased from 2.2 per 100,000 people in 2011 to 8.2 per 100,000 in 2016. For comparison, the national murder rate is 5.3 per 100,000.
Detailed Findings & Methodology
Many of the metropolitan areas with the largest increases in violent crime are smaller places that had relatively low violent crime rates. In an interview with 24/7 Wall St., John Roman, a senior fellow with the non-partisan research organization NORC at the University of Chicago, said that these metropolitan areas are the kinds of places where the largest increases might be expected. “When you have a relatively small city like that, small changes in violence can cause huge percentage increases,” he explained.
Roman added that several factors can cause major short-term changes in violent crime in metropolitan areas. These can include “disputes between relatively small numbers of people that lead to a lot of violence for a city of that size,” he said. “It could be a gang dispute, it could be a drug trafficking dispute, it could be some sort of other organized criminal enterprise where people are fighting over territory or products. Or it could just simply be bad luck. Even relatively safe cities will have a really bad year.”
While short-term increases in violent crime are likely best explained by the actions of a small group of actors or by anomaly, long-term increases and sustained high violent crime rates are often best explained by key social and economic indicators — in particular education and employment.
“If you look at who is in prison and in jails, it tends to be people who drop out some time during high school. Overall, the more school you complete, the less likely you are to commit a crime,” Roman said. Reviewing all metropolitan areas, those places with lower educational attainment tend to have higher violent crime rates.
Even short-term changes in education levels of a population may have an impact. Among the metropolitan areas that can be compared over five years, Hot Springs, Arkansas had the biggest decline in the share of the population with a bachelor’s degree. Hot Springs also had a 27.1% increase in violent crime over that time — the largest in Arkansas and one of the largest of any U.S. metro area.
Based on figures published by the FBI’s Uniform Crime Report, 24/7 Wall St. identified the metropolitan statistical area where crime rates rose the most in each state from 2011 to 2016, the most recent available year of data. In order to be considered, areas had to retain the same geographic boundaries during the period covered, and they had to retain consistent reporting practices. A number of states had no metropolitan areas that met these criteria. These states were Alabama, Hawaii, Minnesota, Mississippi, Montana, North Dakota, Rhode Island, Vermont, and West Virginia. In addition, four states — Delaware, Connecticut, New Jersey, and Nebraska — had no metropolitan area where the violent crime rate increased between 2011 and 2016. In these cases, we listed the state values. Additionally, we reviewed annual unemployment figures from the Bureau of Labor Statistics for 2011 and 2016, as well as unemployment figures from December 2017. We also considered data from the Census Bureau’s 2016 American Community Survey on household income, educational attainment rates, and poverty.
Sponsored: Want to Retire Early? Here’s a Great First Step
Want retirement to come a few years earlier than you’d planned? Or are you ready to retire now, but want an extra set of eyes on your finances?
Now you can speak with up to 3 financial experts in your area for FREE. By simply clicking here you can begin to match with financial professionals who can help you build your plan to retire early. And the best part? The first conversation with them is free.
Click here to match with up to 3 financial pros who would be excited to help you make financial decisions.
Thank you for reading! Have some feedback for us?
Contact the 24/7 Wall St. editorial team.
Editors' Picks

