Morning commutes are often frustrating for drivers and can be a huge drain on the economy. By one estimate, gridlock costs the U.S. economy upwards of $124 billion per year, and that number is only expected to increase.
Individual workers foot most of the bill, wasting gas idling in traffic jams and wasting time that they could be working. But driving to work is an unavoidable part of working life for many Americans.
Not all commutes are created equal. Some can be brief, relatively stress-free drives, while others can be aggravating and time-consuming. There are differences in the quality of commutes not just between states, but also between cities. Even cities that are close to one another can have widely different driving experiences.
24/7 Wall St. created an index composed of several driving-related measures to identify the worst metropolitan statistical areas to drive in each state. The components of the index, which include average commute time, gas prices, and accident rates, were selected to capture an area’s safety, convenience, and cost of driving.
Click here to see the worst city to drive in every state.
Click here to see our detailed findings and methodology.
Editor’s Note: A previous version of this piece identified the worst MSA for driving in five states as those that are partially located in the state, but for which the primary city is in a different state. Those five states were Arkansas, Kansas, Iowa, Indiana, and New Jersey, and the MSAs have been replaced.

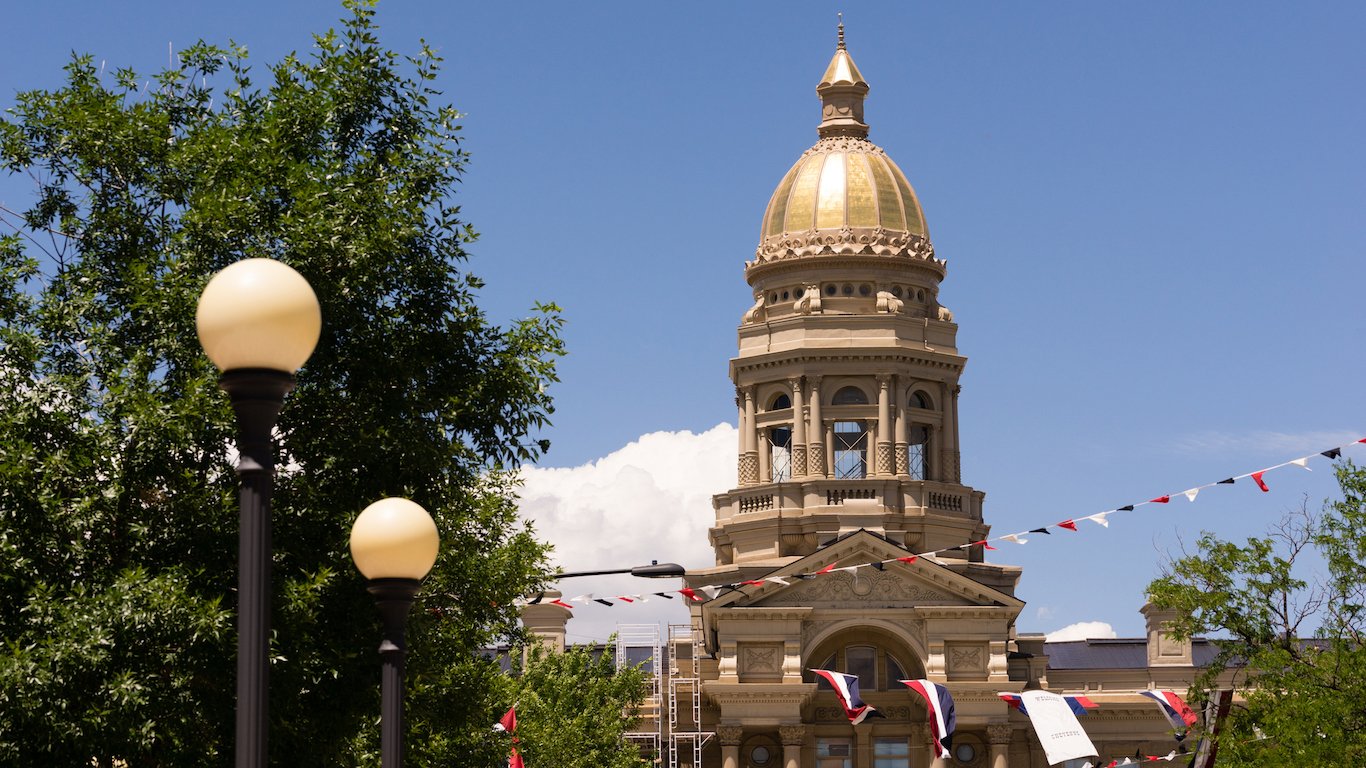
Source: Aparna / Wikimedia Commons
1. Alabama: Gadsden
> Traffic fatalities: 28.3 per 100,000
> Alabama traffic fatalities: 21.3 per 100,000
> Avg. commute: 26.2 minutes
> Alabama avg. commute: 24.6 minutes
> Avg. gas price: N/A
[in-text-ad]
Source: Thinkstock
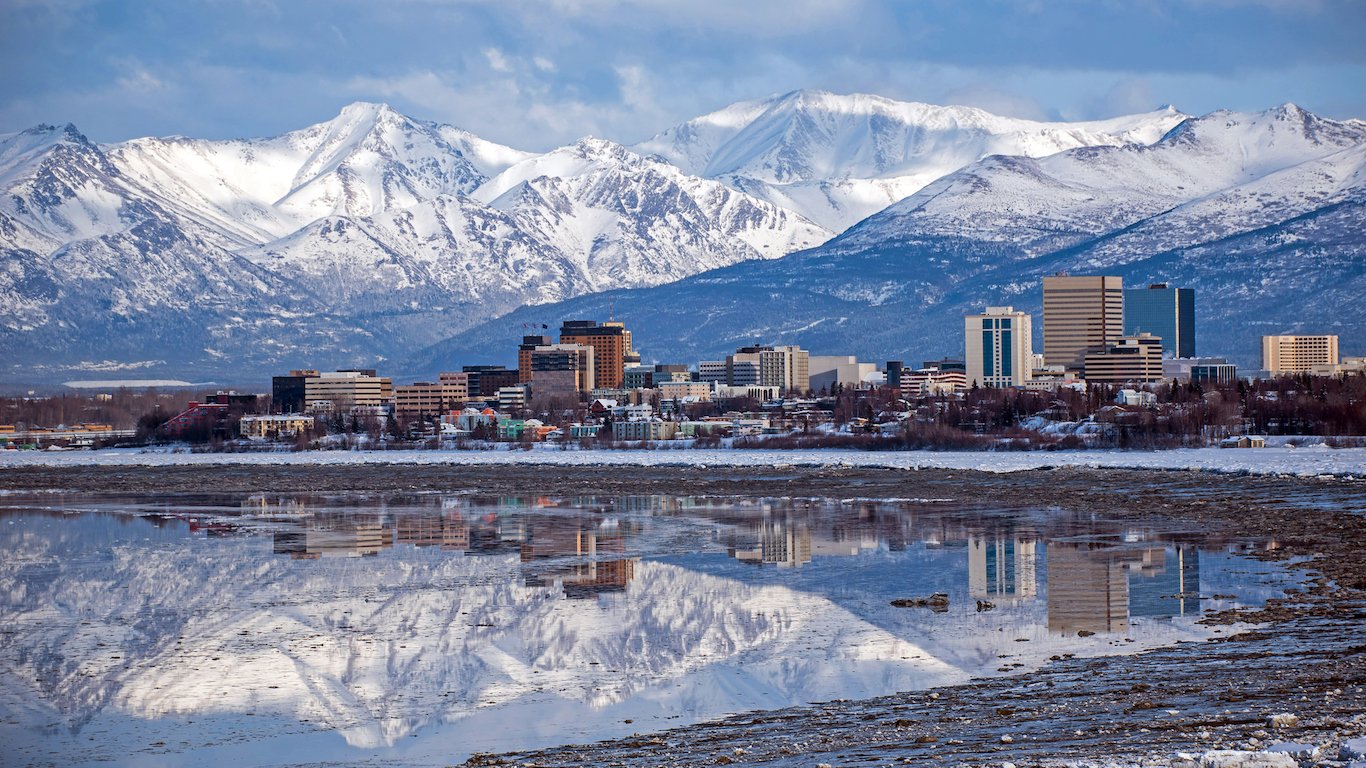
2. Alaska: Anchorage
> Traffic fatalities: 10.2 per 100,000
> Alaska traffic fatalities: 11.3 per 100,000
> Avg. commute: 20.8 minutes
> Alaska avg. commute: 18.0 minutes
> Avg. gas price: $2.50

Source: Thinkstock
3. Arizona: Phoenix-Mesa-Scottsdale
> Traffic fatalities: 11.7 per 100,000
> Arizona traffic fatalities: 13.9 per 100,000
> Avg. commute: 26.4 minutes
> Arizona avg. commute: 25.3 minutes
> Avg. gas price: $2.17
Source: Thinkstock
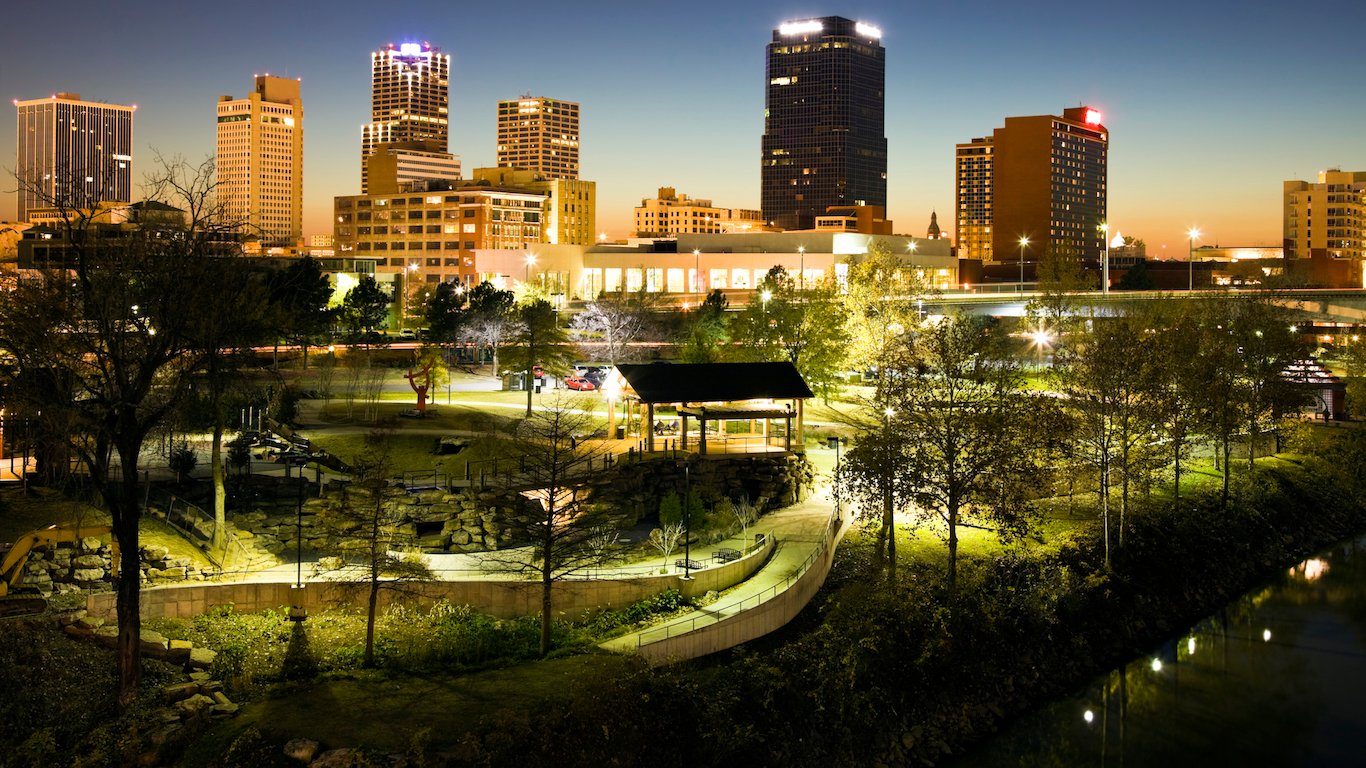
4. Arkansas: Little Rock
> Traffic fatalities: 14.4 per 100,000
> Arkansas traffic fatalities: 18.2 per 100,000
> Avg. commute: 24.4 minutes
> Arkansas avg. commute: 21.2 minutes
> Avg. gas price: N/A
[in-text-ad-2]
Source: Thinkstock
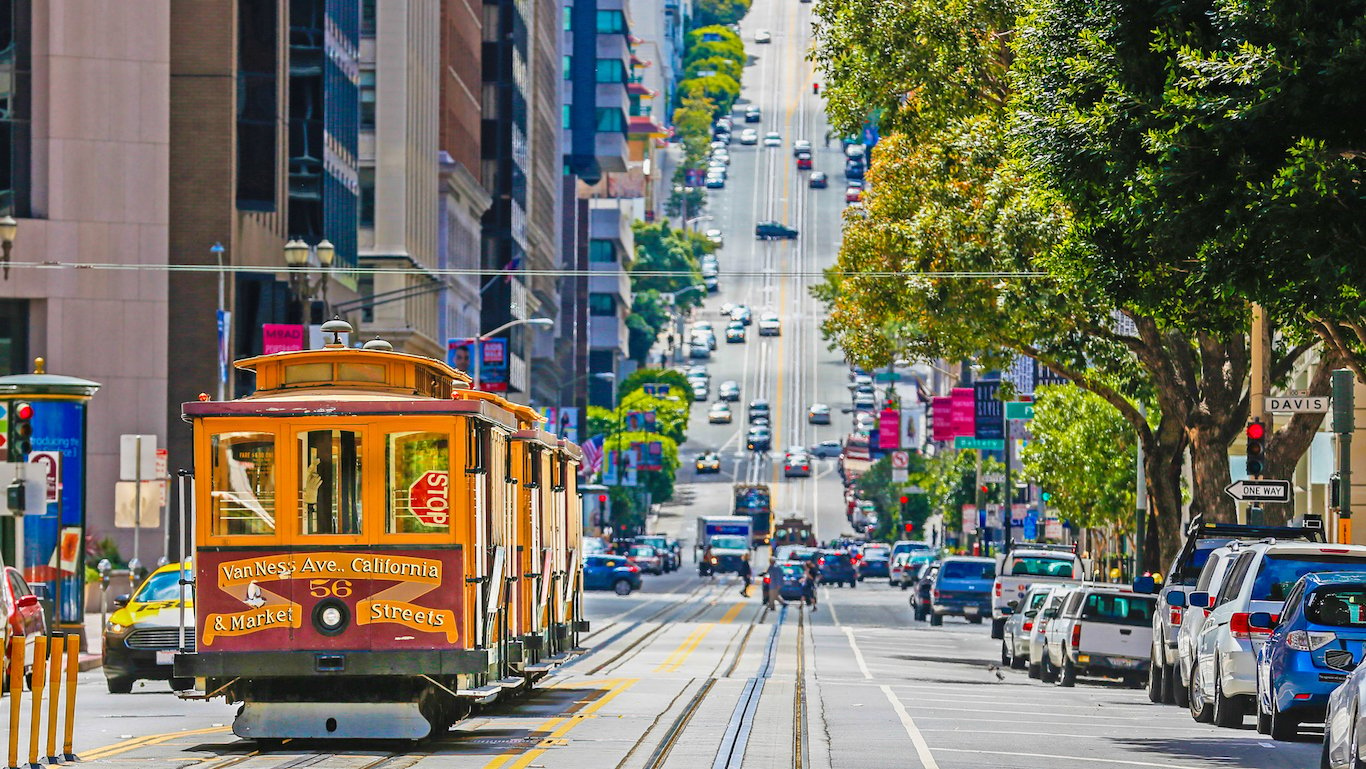
5. California: San Francisco-Oakland-Hayward
> Traffic fatalities: 5.2 per 100,000
> California traffic fatalities: 9.2 per 100,000
> Avg. commute: 33.6 minutes
> California avg. commute: 29.4 minutes
> Avg. gas price: $2.97
Source: Thinkstock
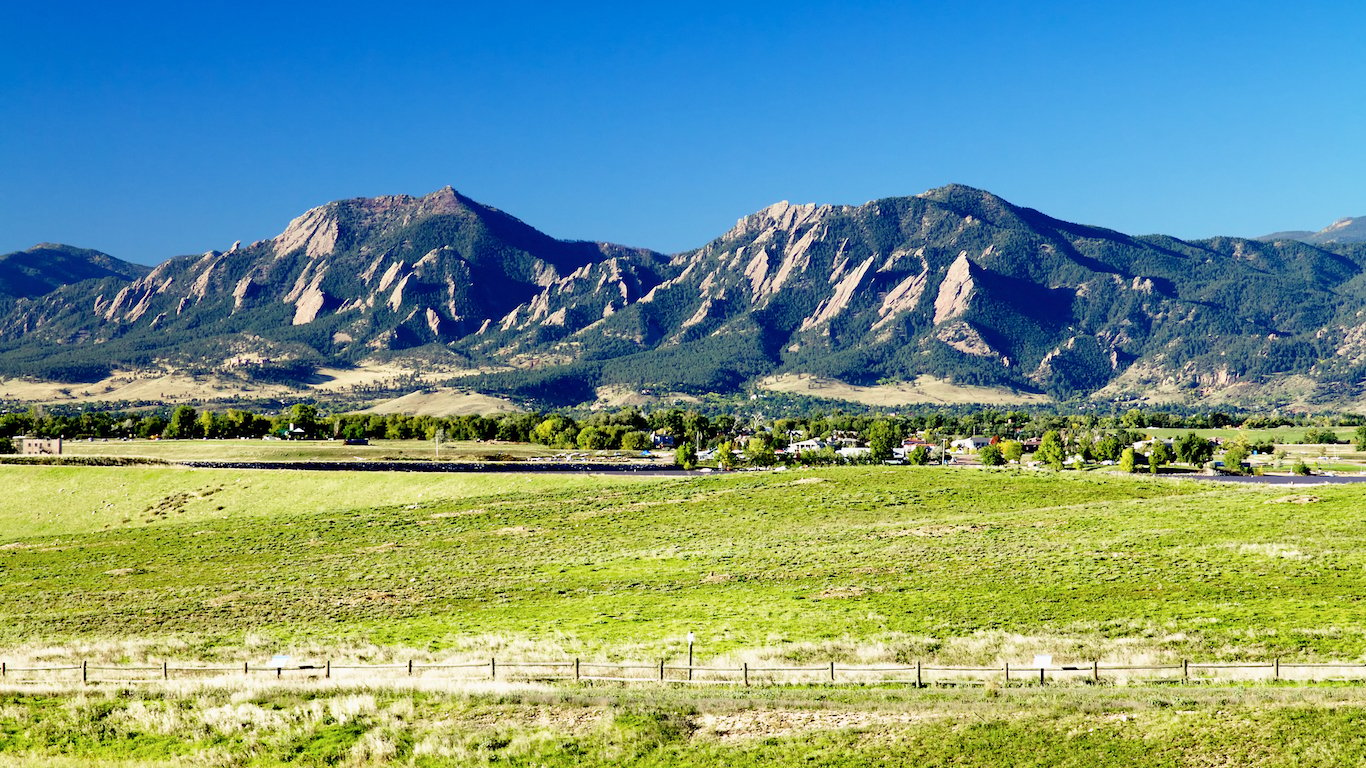
6. Colorado: Boulder
> Traffic fatalities: 7.4 per 100,000
> Colorado traffic fatalities: 11.0 per 100,000
> Avg. commute: 22.1 minutes
> Colorado avg. commute: 25.0 minutes
> Avg. gas price: N/A
[in-text-ad]

Source: Thinkstock
7. Connecticut: Bridgeport-Stamford-Norwalk
> Traffic fatalities: 7.6 per 100,000
> Connecticut traffic fatalities: 8.2 per 100,000
> Avg. commute: 30.2 minutes
> Connecticut avg. commute: 26.3 minutes
> Avg. gas price: $2.35

Source: Jon Bilous / Shutterstock.com
8. Delaware: Dover
> Traffic fatalities: 17.7 per 100,000
> Delaware traffic fatalities: 12.5 per 100,000
> Avg. commute: 27.0 minutes
> Delaware avg. commute: 26.1 minutes
> Avg. gas price: $2.09
Source: Thinkstock
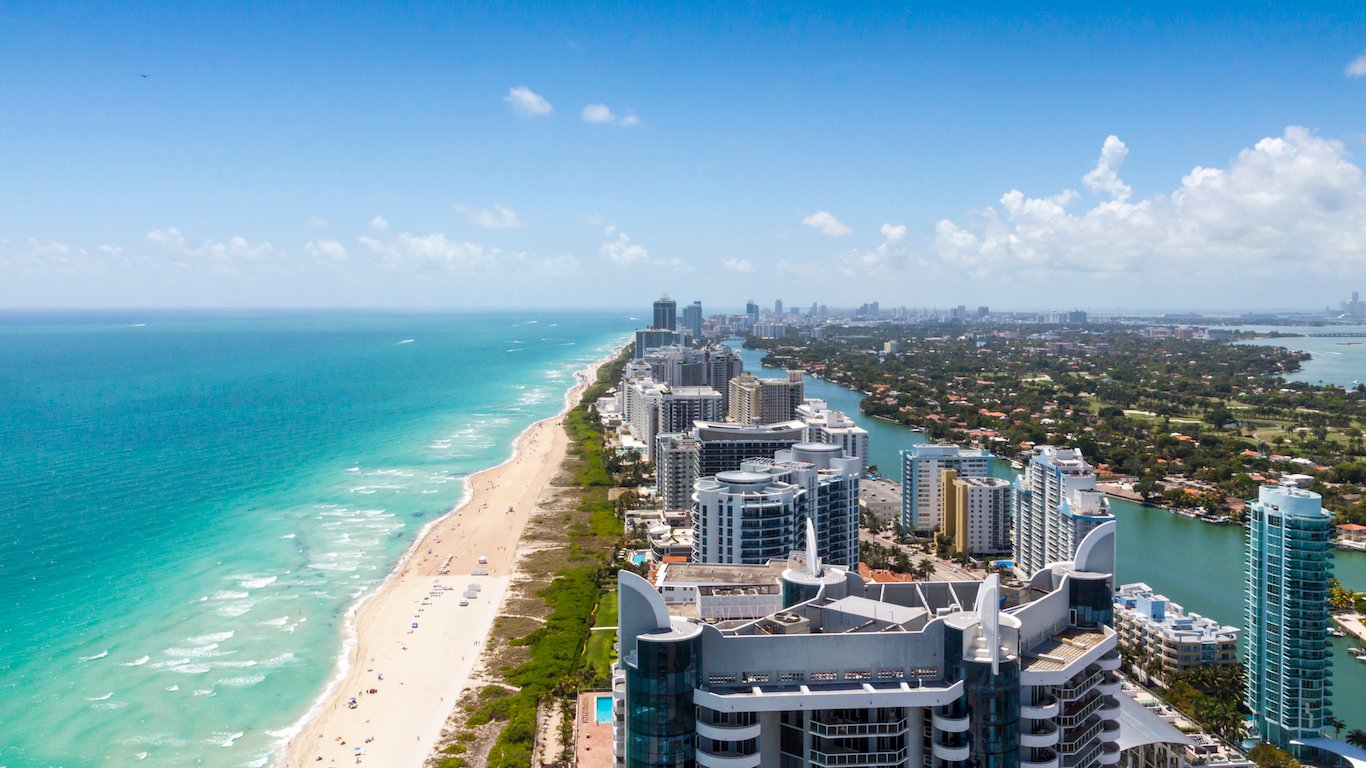
9. Florida: Miami-Fort Lauderdale-West Palm Beach
> Traffic fatalities: 11.9 per 100,000
> Florida traffic fatalities: 15.4 per 100,000
> Avg. commute: 29.6 minutes
> Florida avg. commute: 27.4 minutes
> Avg. gas price: $2.33
[in-text-ad-2]
Source: Thinkstock
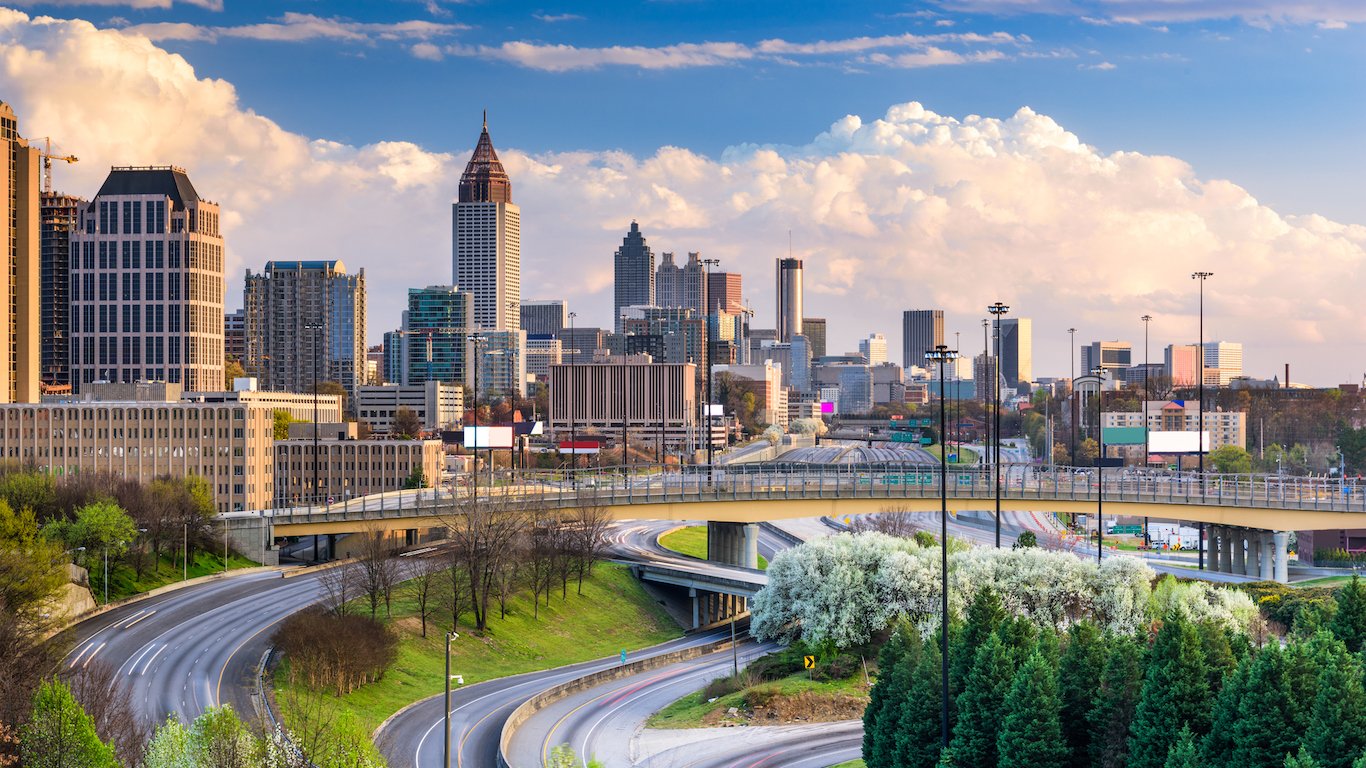
10. Georgia: Atlanta-Sandy Springs-Roswell
> Traffic fatalities: 11.4 per 100,000
> Georgia traffic fatalities: 15.1 per 100,000
> Avg. commute: 32.1 minutes
> Georgia avg. commute: 28.5 minutes
> Avg. gas price: $2.24
Source: Thinkstock
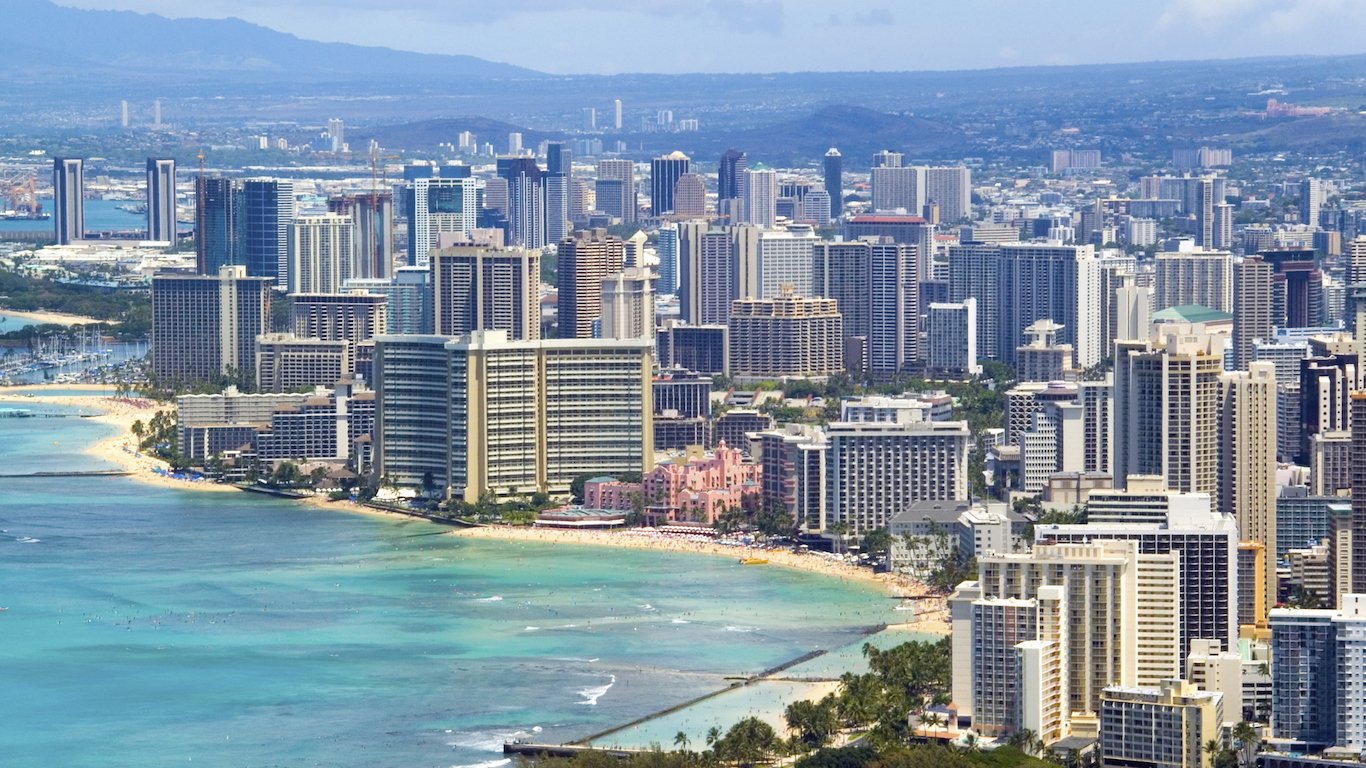
11. Hawaii: Urban Honolulu
> Traffic fatalities: 5.9 per 100,000
> Hawaii traffic fatalities: 8.4 per 100,000
> Avg. commute: 29.0 minutes
> Hawaii avg. commute: 27.4 minutes
> Avg. gas price: $2.79
[in-text-ad]

Source: Thinkstock
12. Idaho: Boise City
> Traffic fatalities: 8.3 per 100,000
> Idaho traffic fatalities: 15.0 per 100,000
> Avg. commute: 22.4 minutes
> Idaho avg. commute: 20.9 minutes
> Avg. gas price: $2.30
 24/7 Wall St.
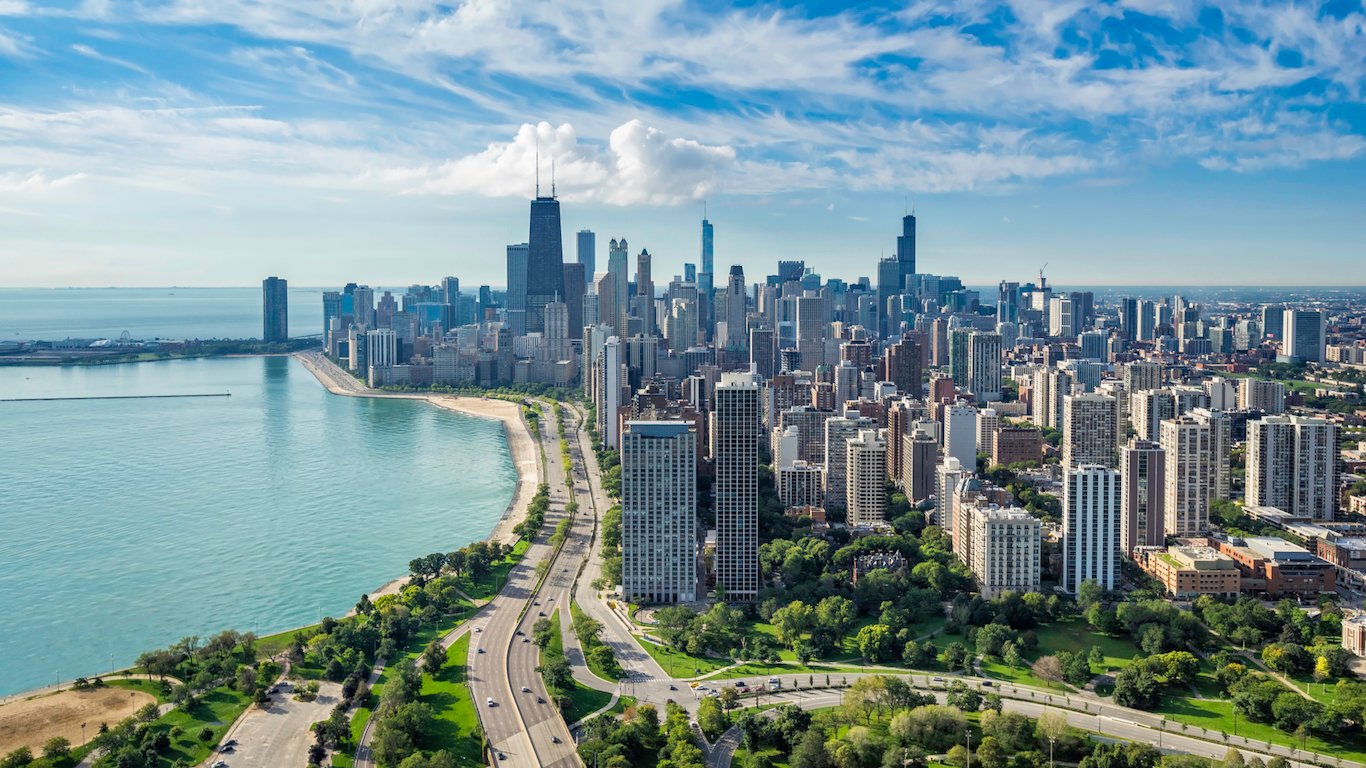
Source: Thinkstock
13. Illinois: Chicago-Naperville-Elgin
> Traffic fatalities: 6.1 per 100,000
> Illinois traffic fatalities: 8.5 per 100,000
> Avg. commute: 31.8 minutes
> Illinois avg. commute: 28.9 minutes
> Avg. gas price: $2.85

Source: Suzanne Tucker / Shutterstock.com
14. Indiana: Michigan City
> Traffic fatalities: 17.3 per 100,000
> Indiana traffic fatalities: 12.4 per 100,000
> Avg. commute: 23.4 minutes
> Indiana avg. commute: 23.6 minutes
> Avg. gas price: N/A
[in-text-ad-2]
Source: Thinkstock
15. Iowa: Davenport
> Traffic fatalities: 9.4 per 100,000
> Iowa traffic fatalities: 12.9 per 100,000
> Avg. commute: 19.6 minutes
> Iowa avg. commute: 19.0 minutes
> Avg. gas price: $2.15
Source: Thinkstock
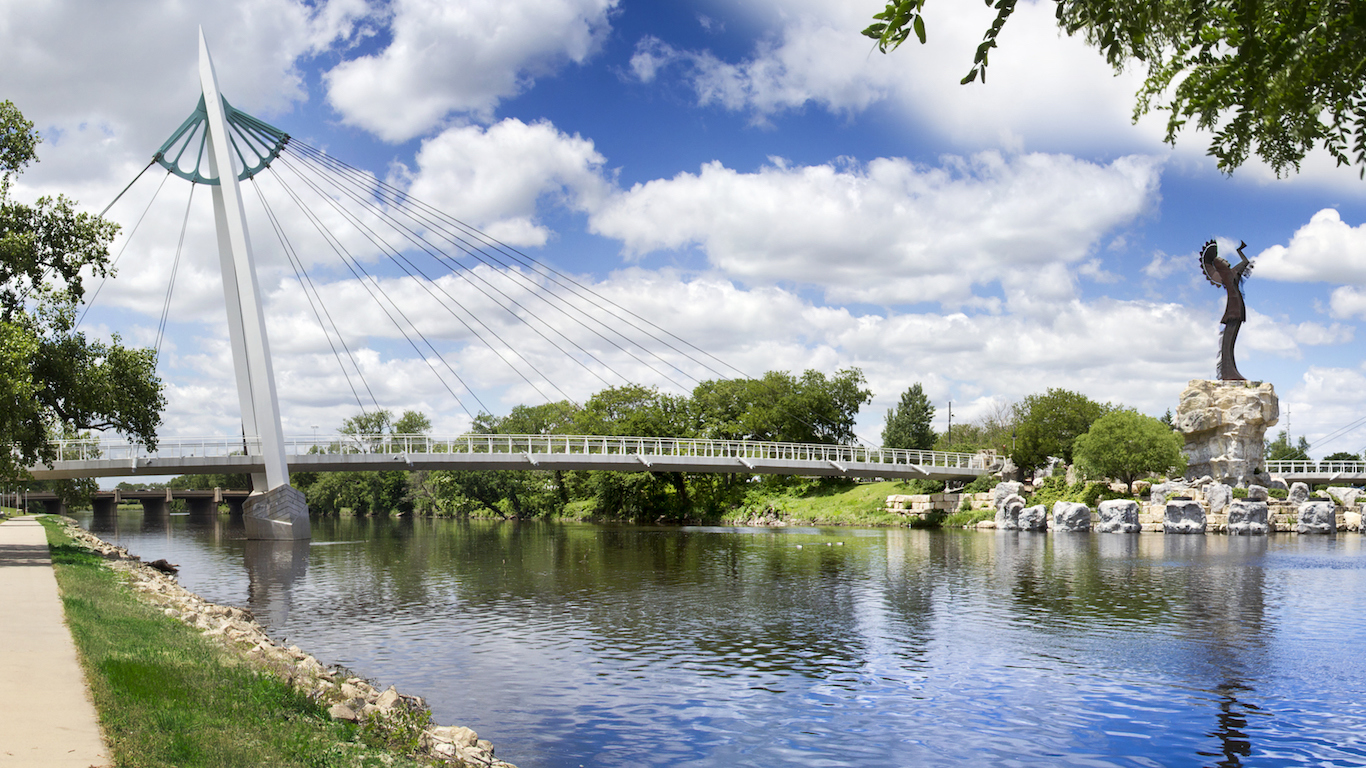
16. Kansas: Wichita
> Traffic fatalities: 12.1 per 100,000
> Kansas traffic fatalities: 14.8 per 100,000
> Avg. commute: 20.2 minutes
> Kansas avg. commute: 19.4 minutes
> Avg. gas price: $2.13
[in-text-ad]
Source: Thinkstock
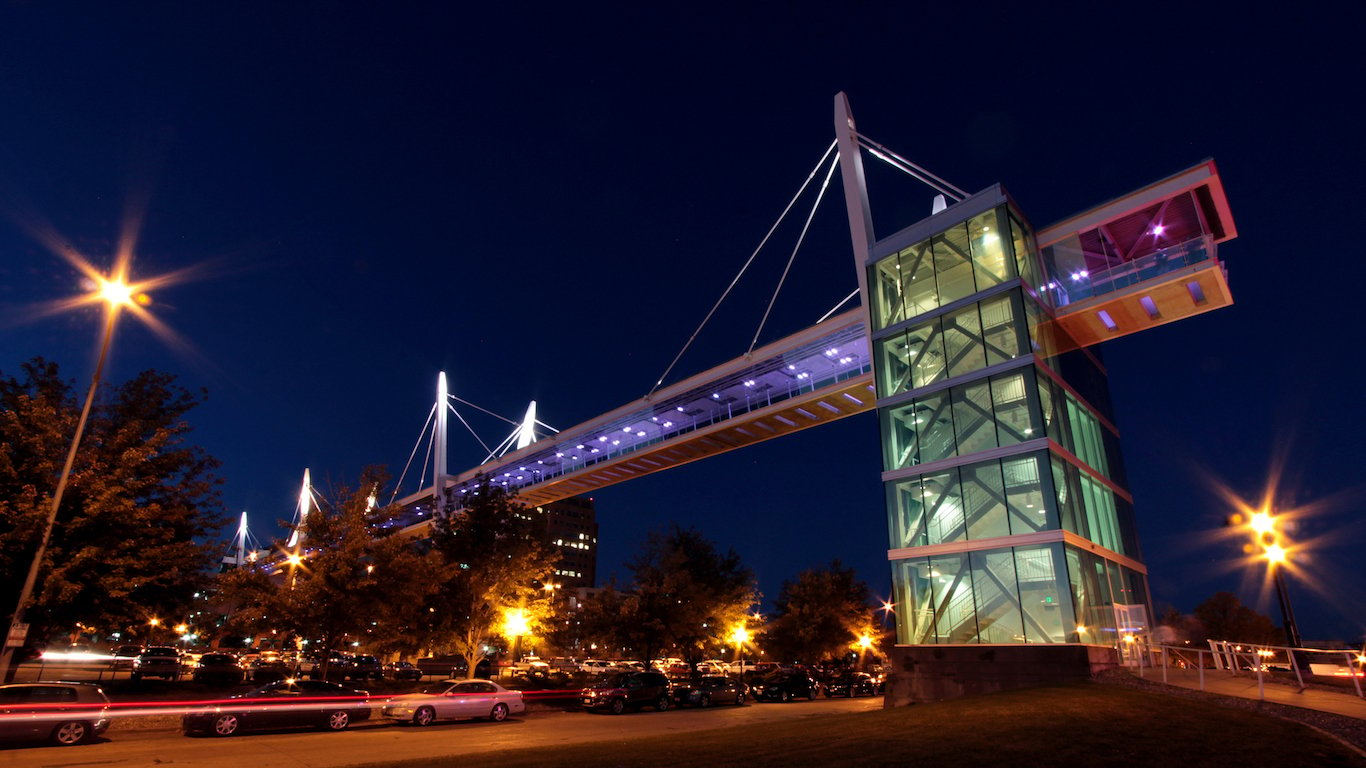
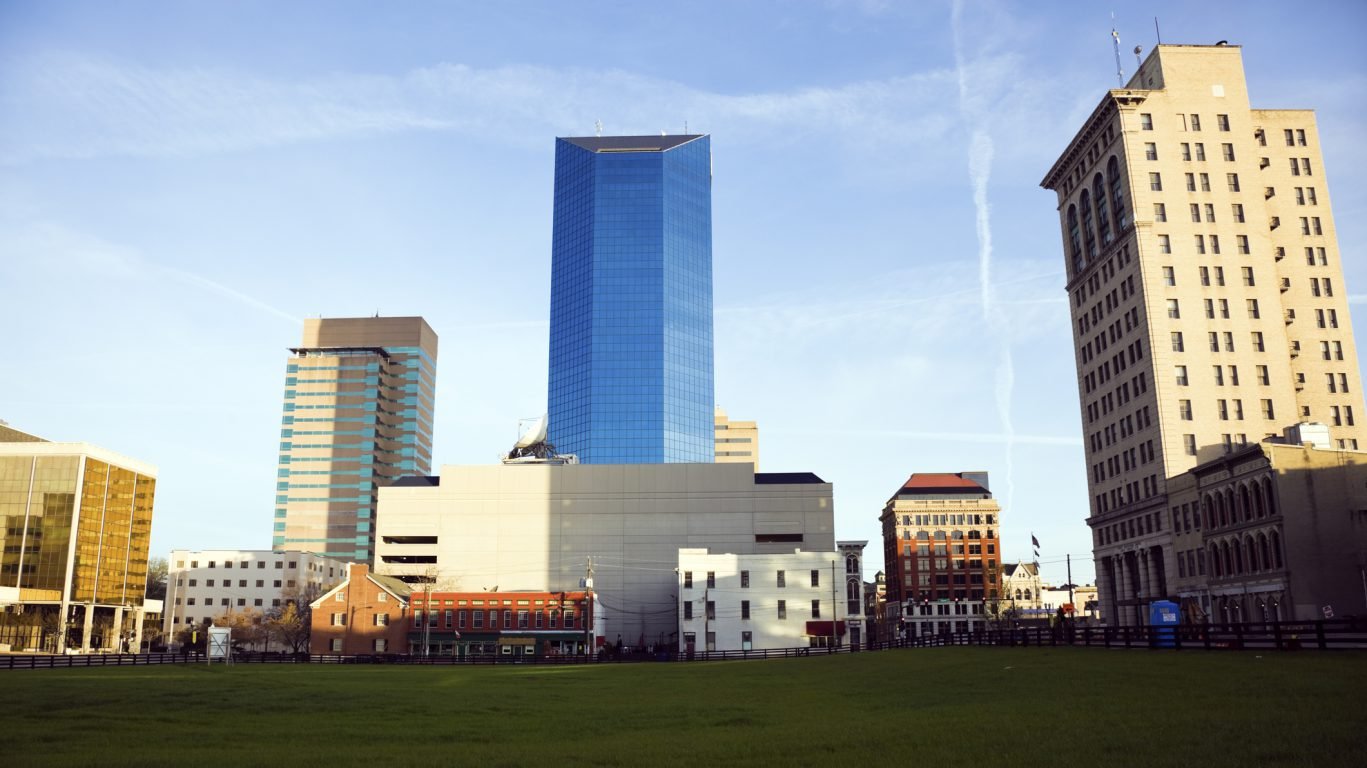
17. Kentucky: Lexington-Fayette
> Traffic fatalities: 16.6 per 100,000
> Kentucky traffic fatalities: 18.8 per 100,000
> Avg. commute: 21.5 minutes
> Kentucky avg. commute: 23.3 minutes
> Avg. gas price: $2.15
 24/7 Wall St.
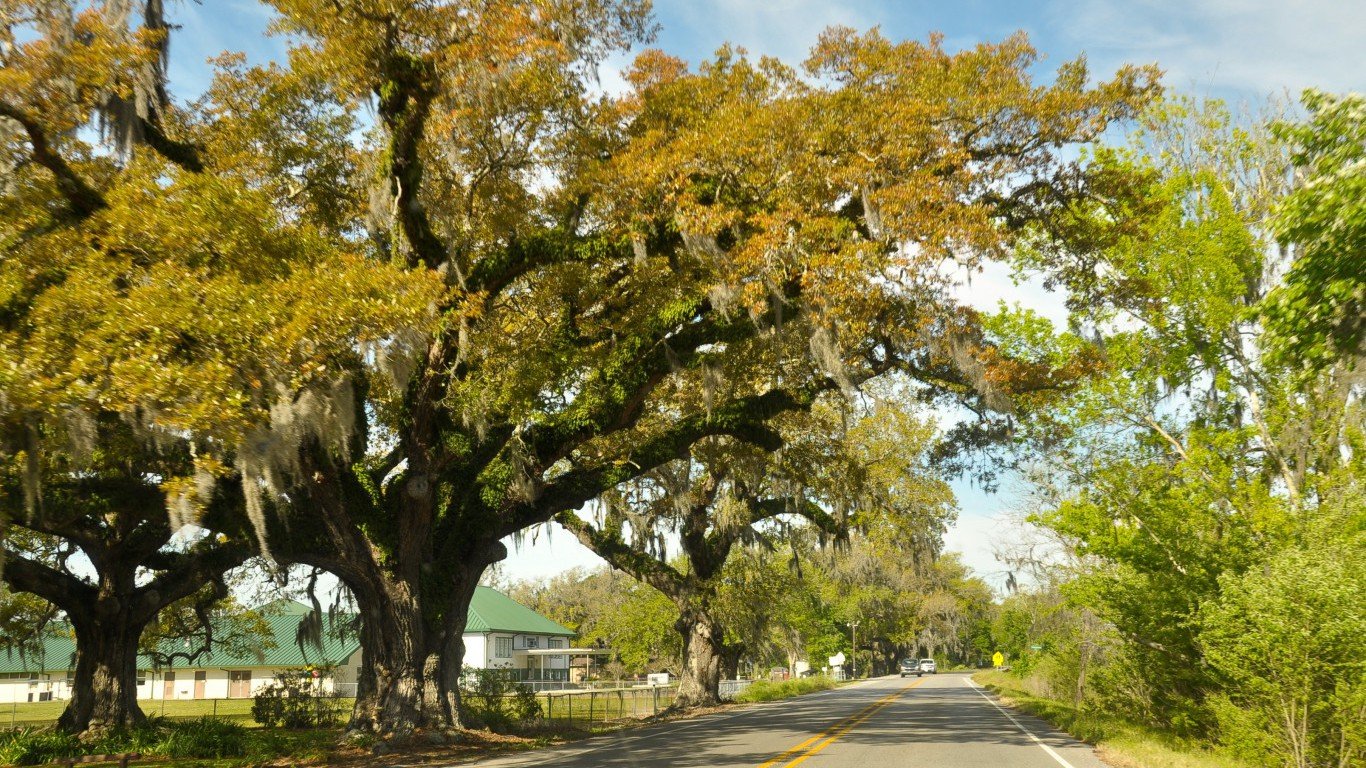
Source: faungg's photos / Flickr
18. Louisiana: Houma-Thibodaux
> Traffic fatalities: 20.8 per 100,000
> Louisiana traffic fatalities: 16.2 per 100,000
> Avg. commute: 24.2 minutes
> Louisiana avg. commute: 25.0 minutes
> Avg. gas price: N/A
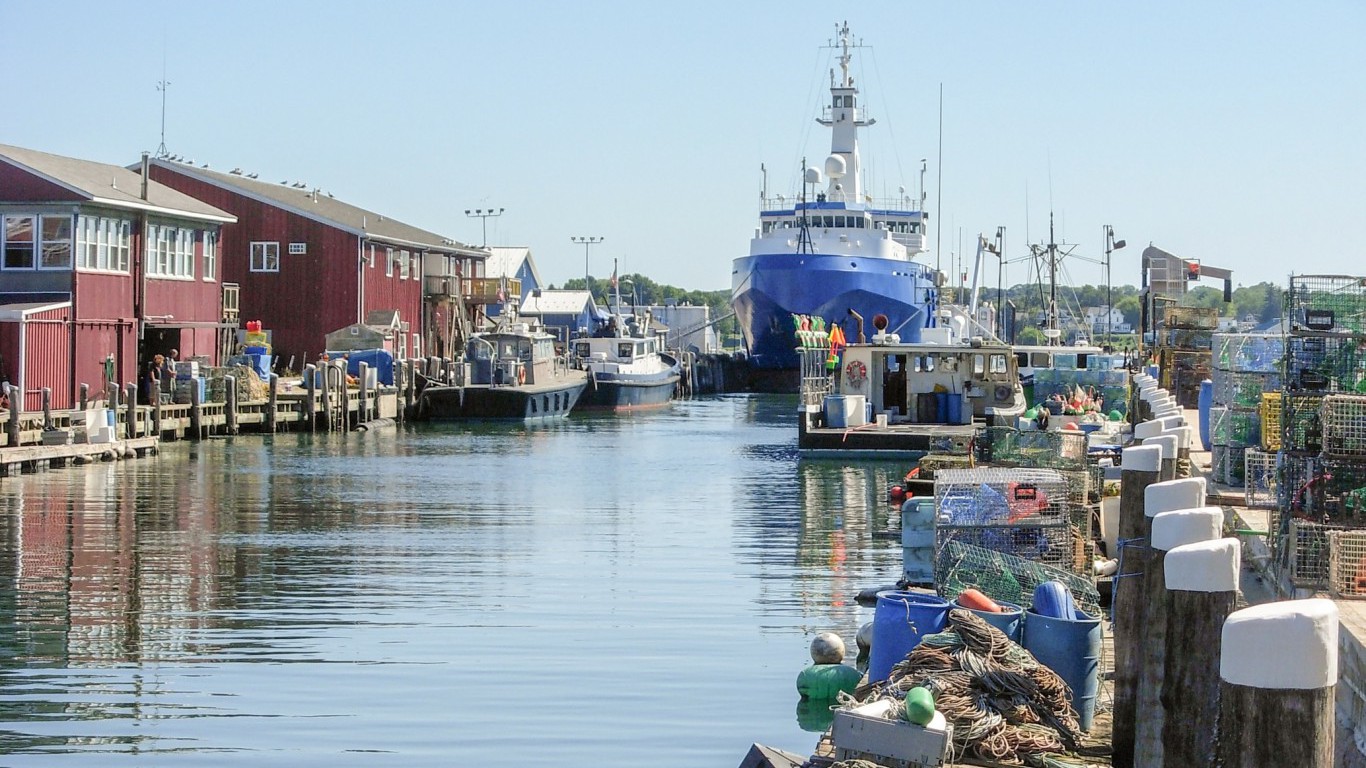
Source: Thinkstock
19. Maine: Portland-South Portland
> Traffic fatalities: 8.9 per 100,000
> Maine traffic fatalities: 12.1 per 100,000
> Avg. commute: 25.4 minutes
> Maine avg. commute: 23.9 minutes
> Avg. gas price: $2.12
[in-text-ad-2]

Source: Thinkstock
20. Maryland: Baltimore-Columbia-Towson
> Traffic fatalities: 7.7 per 100,000
> Maryland traffic fatalities: 8.4 per 100,000
> Avg. commute: 31.0 minutes
> Maryland avg. commute: 32.8 minutes
> Avg. gas price: $2.16

Source: Thinkstock
21. Massachusetts: Boston-Cambridge-Newton
> Traffic fatalities: 5.0 per 100,000
> Massachusetts traffic fatalities: 5.7 per 100,000
> Avg. commute: 31.2 minutes
> Massachusetts avg. commute: 29.6 minutes
> Avg. gas price: $2.18
[in-text-ad]

Source: Thinkstock
22. Michigan: Ann Arbor
> Traffic fatalities: 7.1 per 100,000
> Michigan traffic fatalities: 10.7 per 100,000
> Avg. commute: 24.2 minutes
> Michigan avg. commute: 24.5 minutes
> Avg. gas price: N/A
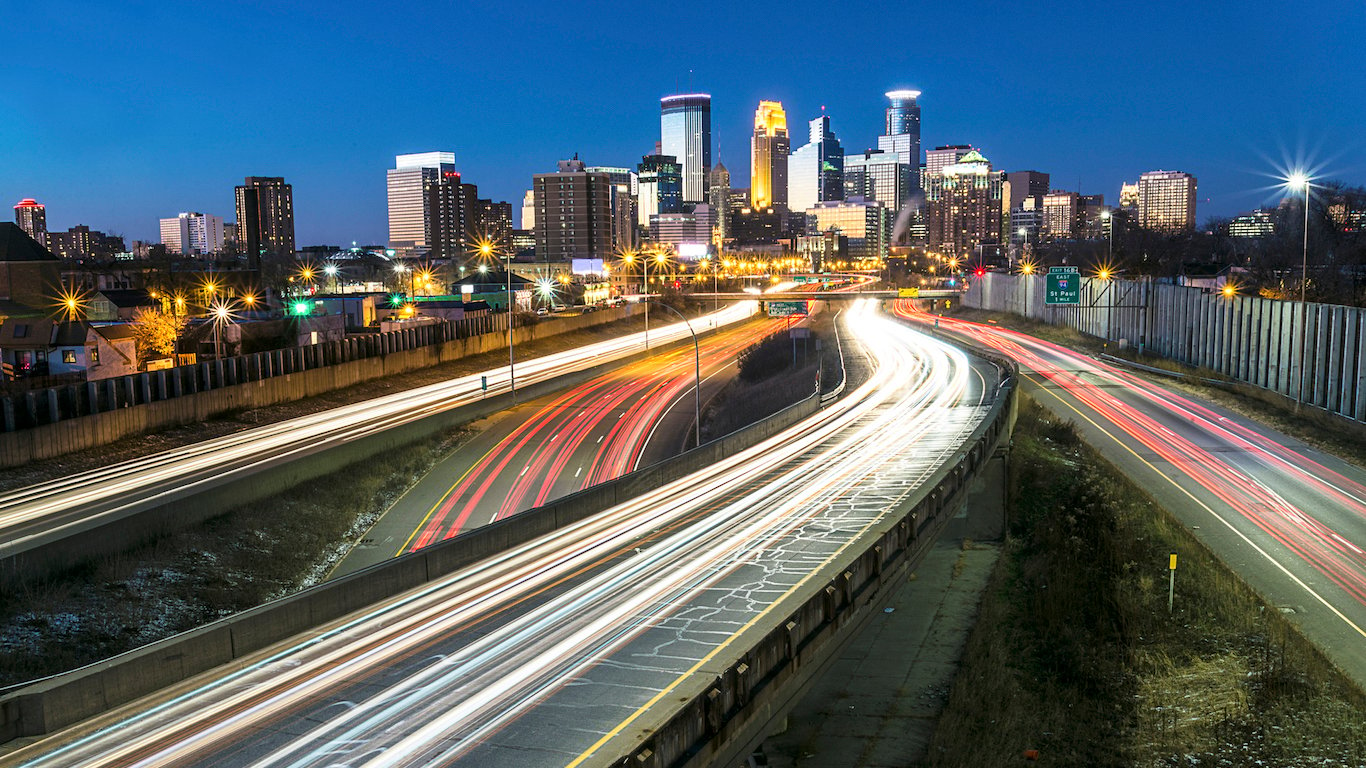
Source: Thinkstock
23. Minnesota: Minneapolis-St. Paul-Bloomington
> Traffic fatalities: 5.2 per 100,000
> Minnesota traffic fatalities: 7.1 per 100,000
> Avg. commute: 25.3 minutes
> Minnesota avg. commute: 23.5 minutes
> Avg. gas price: $2.13
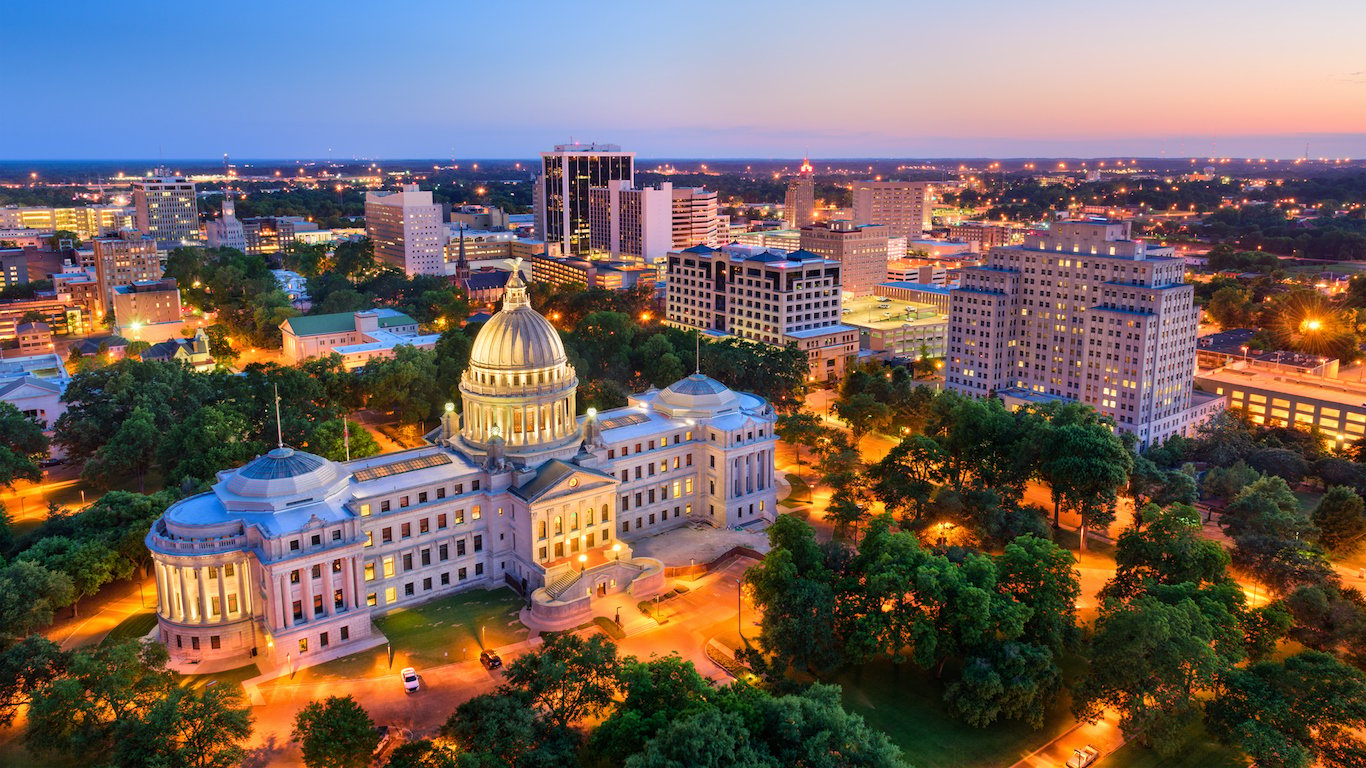
Source: Thinkstock
24. Mississippi: Jackson
> Traffic fatalities: 18.3 per 100,000
> Mississippi traffic fatalities: 23.1 per 100,000
> Avg. commute: 25.1 minutes
> Mississippi avg. commute: 24.3 minutes
> Avg. gas price: $1.95
[in-text-ad-2]

Source: Thinkstock
25. Missouri: Springfield
> Traffic fatalities: 15.8 per 100,000
> Missouri traffic fatalities: 15.5 per 100,000
> Avg. commute: 22.3 minutes
> Missouri avg. commute: 23.7 minutes
> Avg. gas price: $1.95
Source: Thinkstock
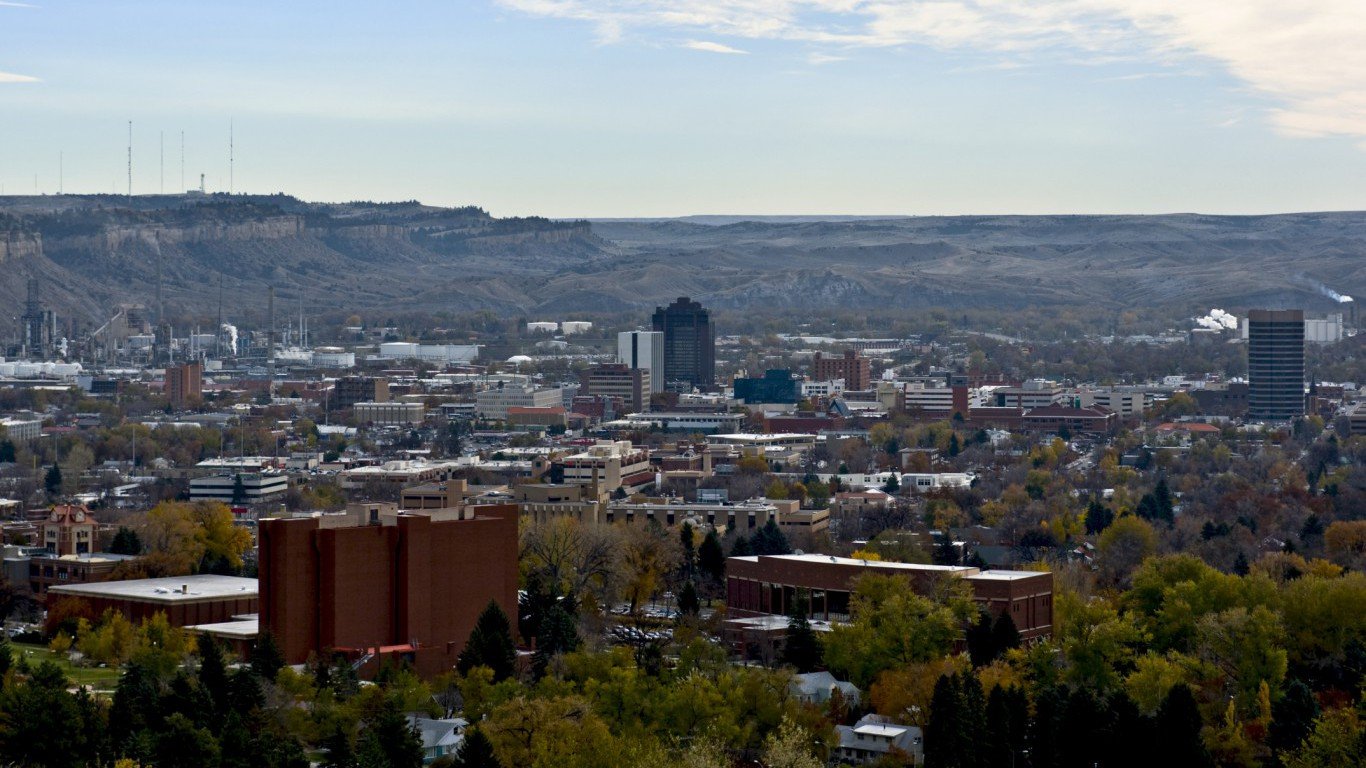
26. Montana: Billings
> Traffic fatalities: 10.6 per 100,000
> Montana traffic fatalities: 18.2 per 100,000
> Avg. commute: 18.3 minutes
> Montana avg. commute: 17.5 minutes
> Avg. gas price: N/A
[in-text-ad]
Source: Thinkstock
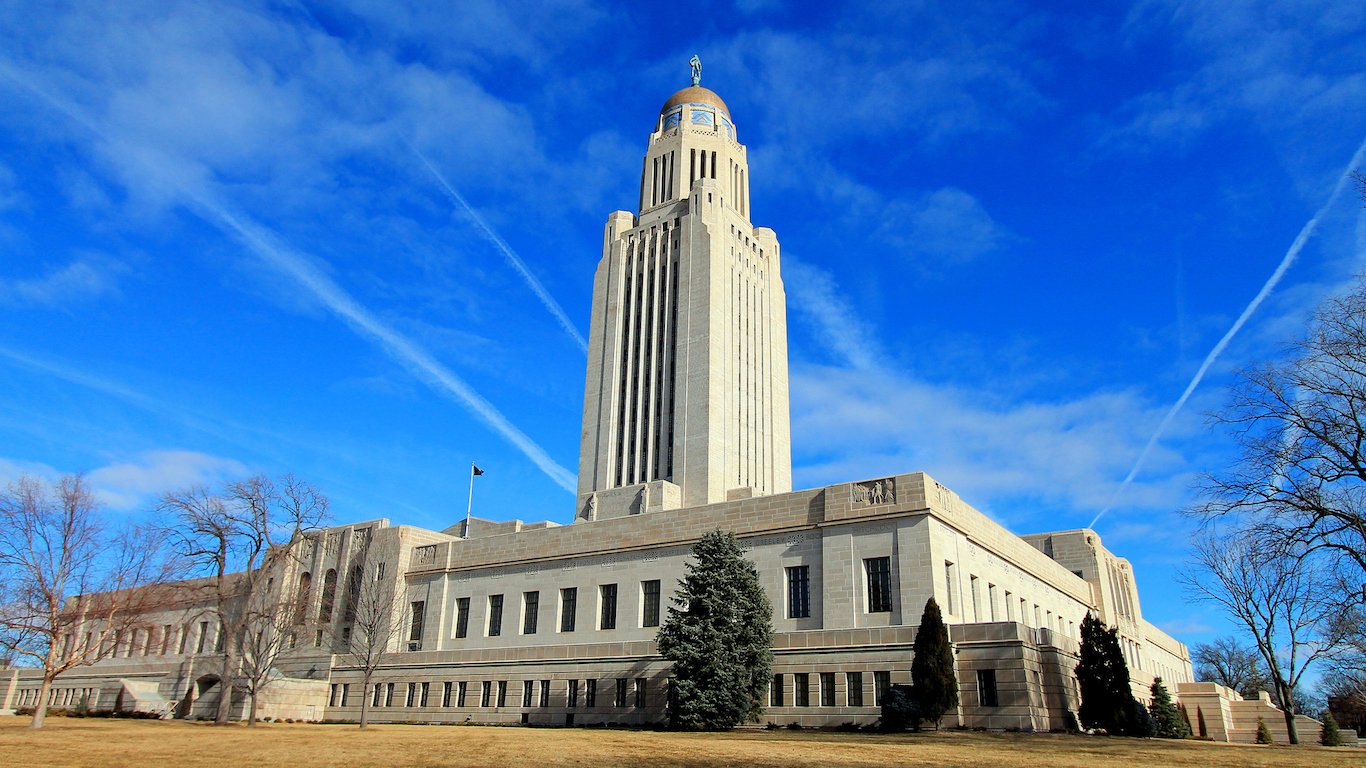
27. Nebraska: Lincoln
> Traffic fatalities: 4.9 per 100,000
> Nebraska traffic fatalities: 11.4 per 100,000
> Avg. commute: 19.4 minutes
> Nebraska avg. commute: 18.6 minutes
> Avg. gas price: $2.17

Source: Thinkstock
28. Nevada: Las Vegas-Henderson-Paradise
> Traffic fatalities: 10.1 per 100,000
> Nevada traffic fatalities: 11.2 per 100,000
> Avg. commute: 24.7 minutes
> Nevada avg. commute: 24.1 minutes
> Avg. gas price: $2.41

Source: Thinkstock
29. New Hampshire: Manchester-Nashua
> Traffic fatalities: 6.6 per 100,000
> New Hampshire traffic fatalities: 10.2 per 100,000
> Avg. commute: 26.9 minutes
> New Hampshire avg. commute: 26.9 minutes
> Avg. gas price: $2.13
[in-text-ad-2]
Source: Thinkstock
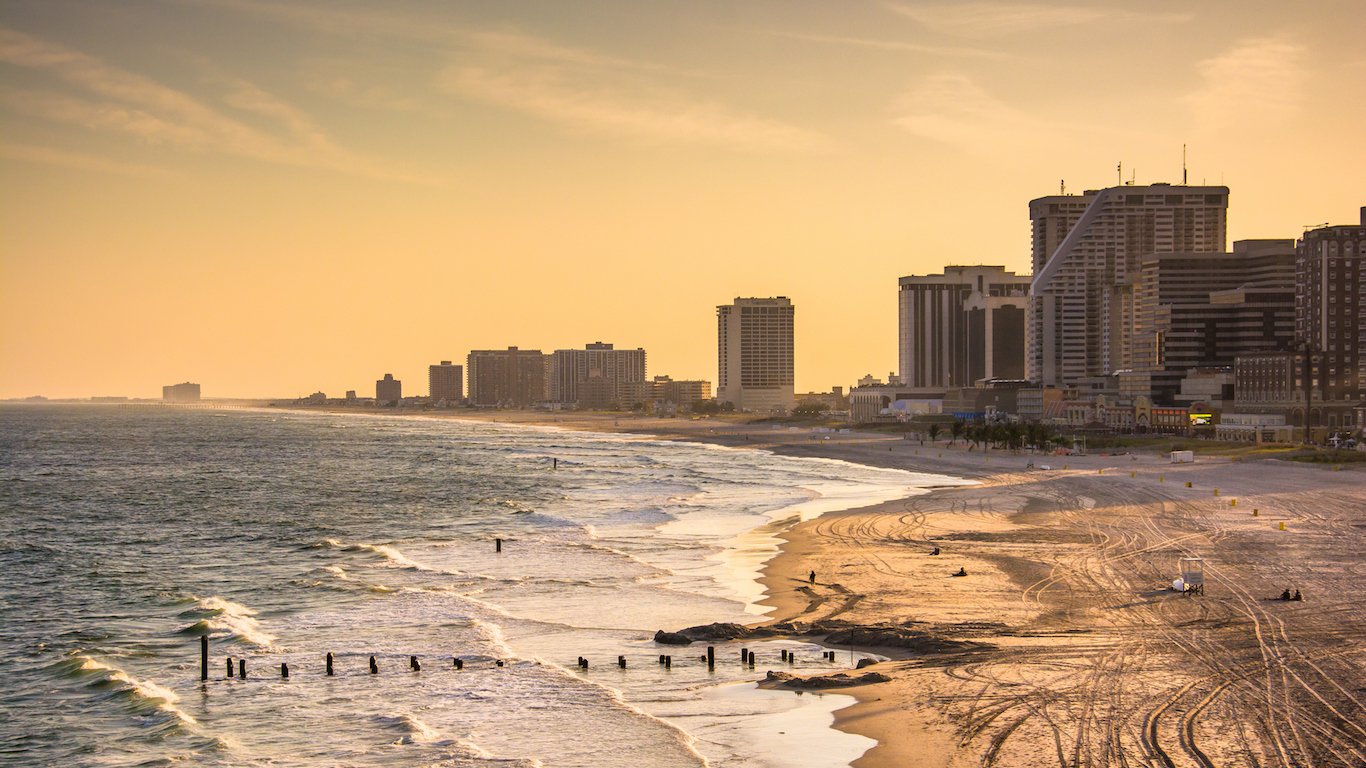
30. New Jersey: Atlantic City
> Traffic fatalities: 14.4 per 100,000
> New Jersey traffic fatalities: 6.7 per 100,000
> Avg. commute: 24.3 minutes
> New Jersey avg. commute: 31.7 minutes
> Avg. gas price: N/A
Source: Thinkstock
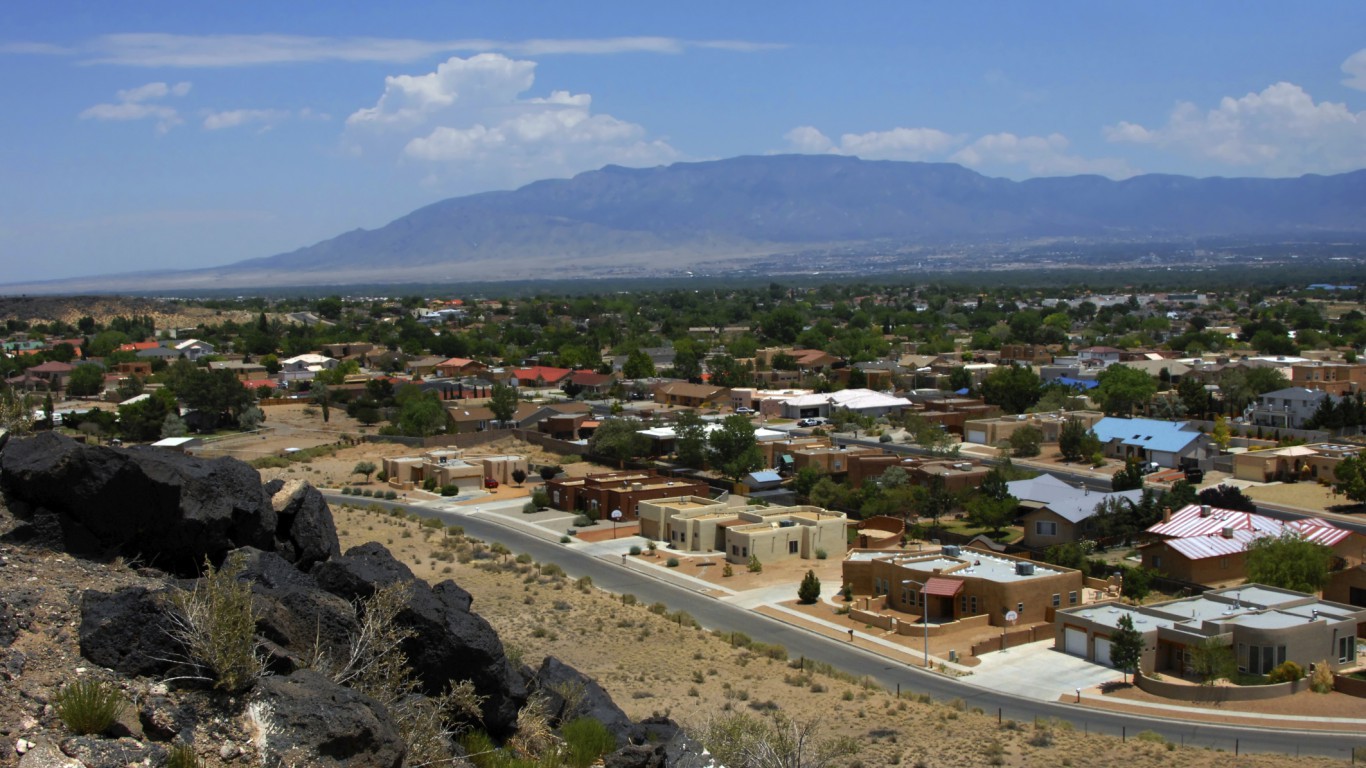
31. New Mexico: Albuquerque
> Traffic fatalities: 14.8 per 100,000
> New Mexico traffic fatalities: 19.3 per 100,000
> Avg. commute: 23.7 minutes
> New Mexico avg. commute: 21.9 minutes
> Avg. gas price: $2.07
[in-text-ad]
Source: Thinkstock
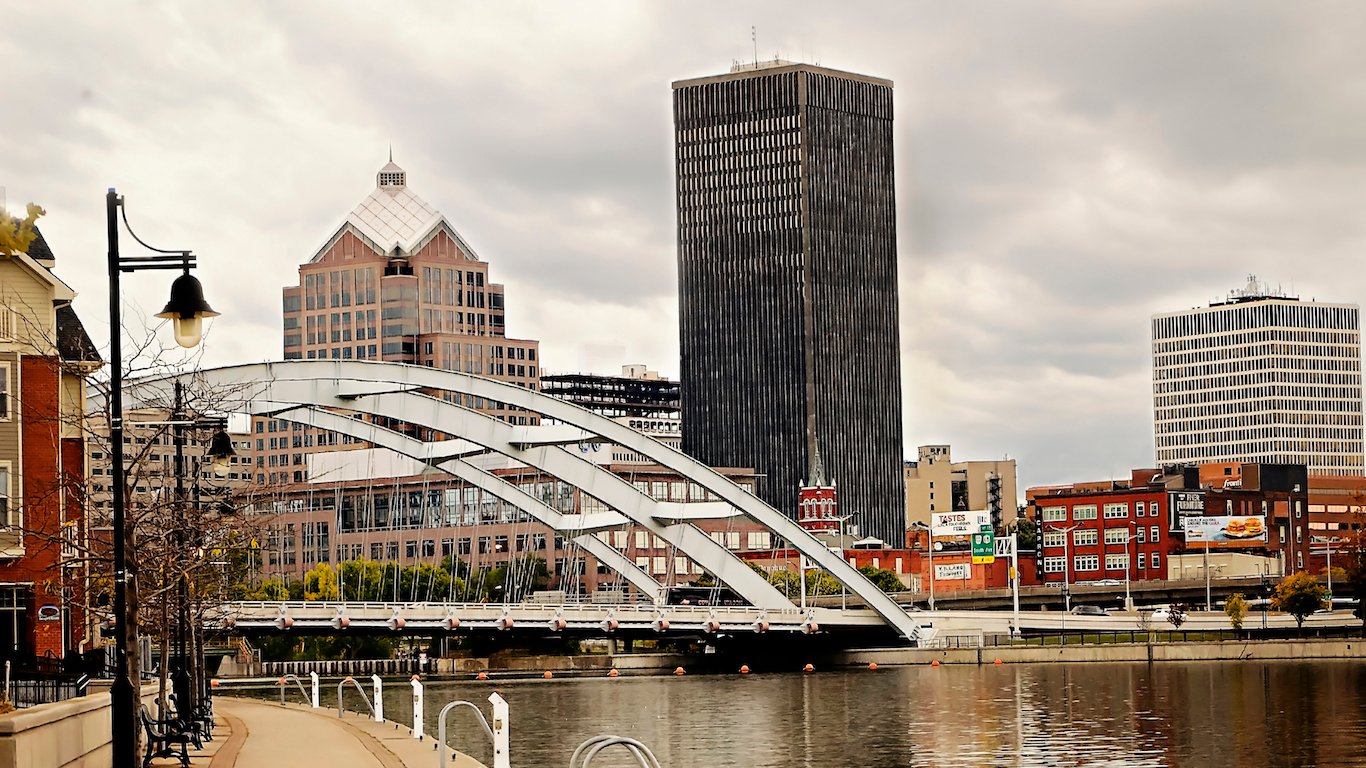
32. New York: Rochester
> Traffic fatalities: 7.0 per 100,000
> New York traffic fatalities: 5.2 per 100,000
> Avg. commute: 21.6 minutes
> New York avg. commute: 33.4 minutes
> Avg. gas price: $2.37
Source: digidreamgrafix / iStock
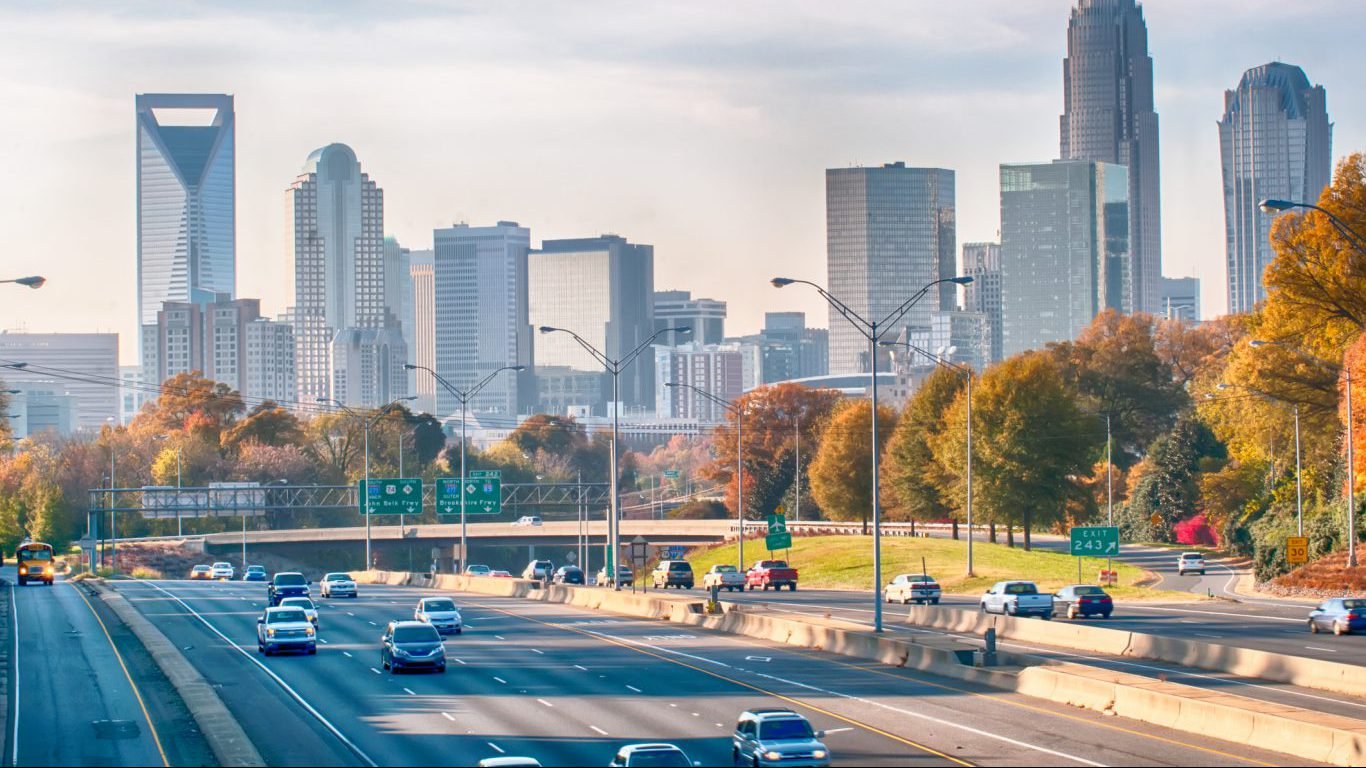
33. North Carolina: Charlotte-Concord-Gastonia
> Traffic fatalities: 12.4 per 100,000
> North Carolina traffic fatalities: 14.3 per 100,000
> Avg. commute: 26.5 minutes
> North Carolina avg. commute: 24.4 minutes
> Avg. gas price: $2.10
Source: Thinkstock
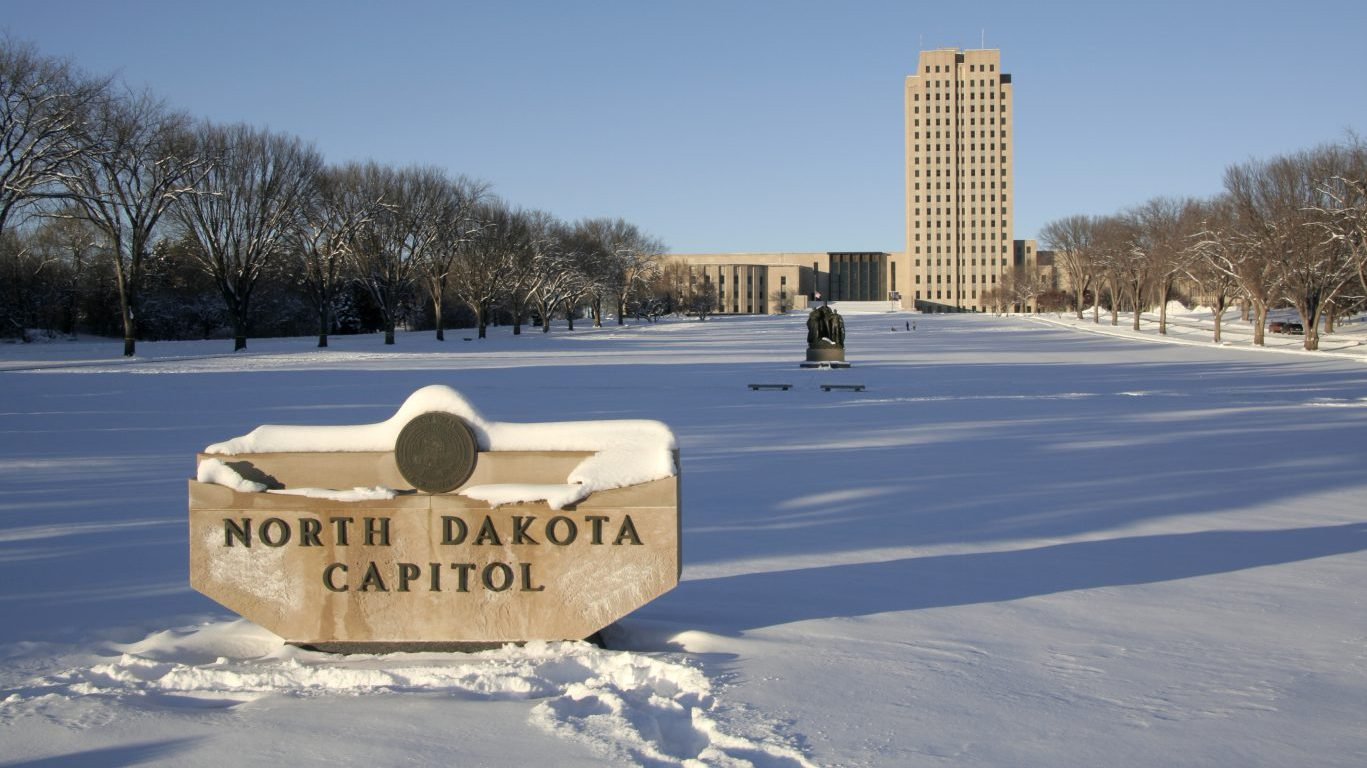
34. North Dakota: Bismarck
> Traffic fatalities: 12.9 per 100,000
> North Dakota traffic fatalities: 14.9 per 100,000
> Avg. commute: 19.3 minutes
> North Dakota avg. commute: 17.4 minutes
> Avg. gas price: $2.26
[in-text-ad-2]

Source: Thinkstock
35. Ohio: Columbus
> Traffic fatalities: 9.4 per 100,000
> Ohio traffic fatalities: 9.7 per 100,000
> Avg. commute: 24.0 minutes
> Ohio avg. commute: 23.4 minutes
> Avg. gas price: $2.17

Source: Thinkstock
36. Oklahoma: Tulsa
> Traffic fatalities: 13.6 per 100,000
> Oklahoma traffic fatalities: 17.4 per 100,000
> Avg. commute: 21.8 minutes
> Oklahoma avg. commute: 21.4 minutes
> Avg. gas price: $1.86
[in-text-ad]
Source: Thinkstock
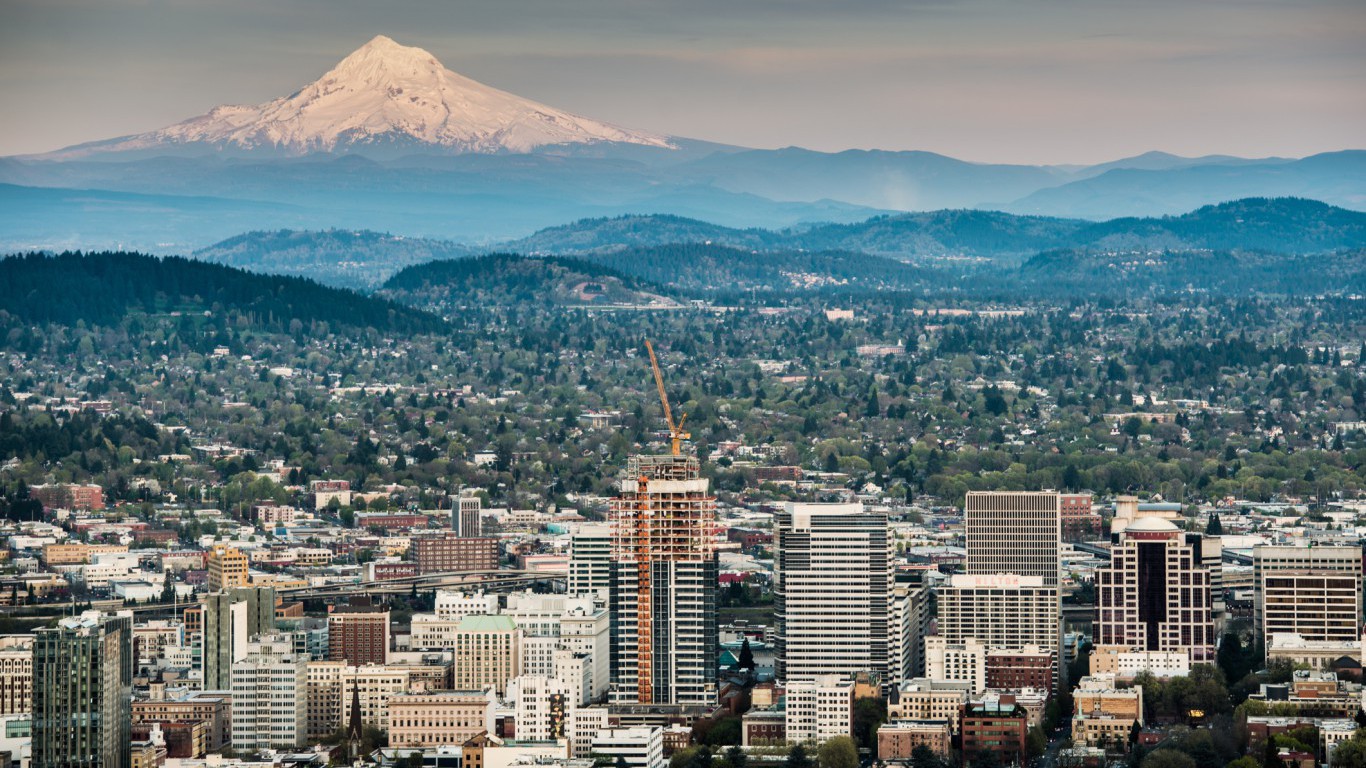
37. Oregon: Portland-Vancouver-Hillsboro
> Traffic fatalities: 7.0 per 100,000
> Oregon traffic fatalities: 12.1 per 100,000
> Avg. commute: 27.5 minutes
> Oregon avg. commute: 23.9 minutes
> Avg. gas price: $2.74
Source: Thinkstock
38. Pennsylvania: East Stroudsburg
> Traffic fatalities: 17.5 per 100,000
> Pennsylvania traffic fatalities: 9.3 per 100,000
> Avg. commute: 39.4 minutes
> Pennsylvania avg. commute: 26.9 minutes
> Avg. gas price: N/A

Source: Thinkstock
39. Rhode Island: Providence-Warwick
> Traffic fatalities: 6.4 per 100,000
> Rhode Island traffic fatalities: 4.8 per 100,000
> Avg. commute: 26.0 minutes
> Rhode Island avg. commute: 24.8 minutes
> Avg. gas price: $2.07
[in-text-ad-2]

Source: Thinkstock
40. South Carolina: Charleston-North Charleston
> Traffic fatalities: 15.5 per 100,000
> South Carolina traffic fatalities: 20.5 per 100,000
> Avg. commute: 25.9 minutes
> South Carolina avg. commute: 24.7 minutes
> Avg. gas price: $2.04
Source: Thinkstock
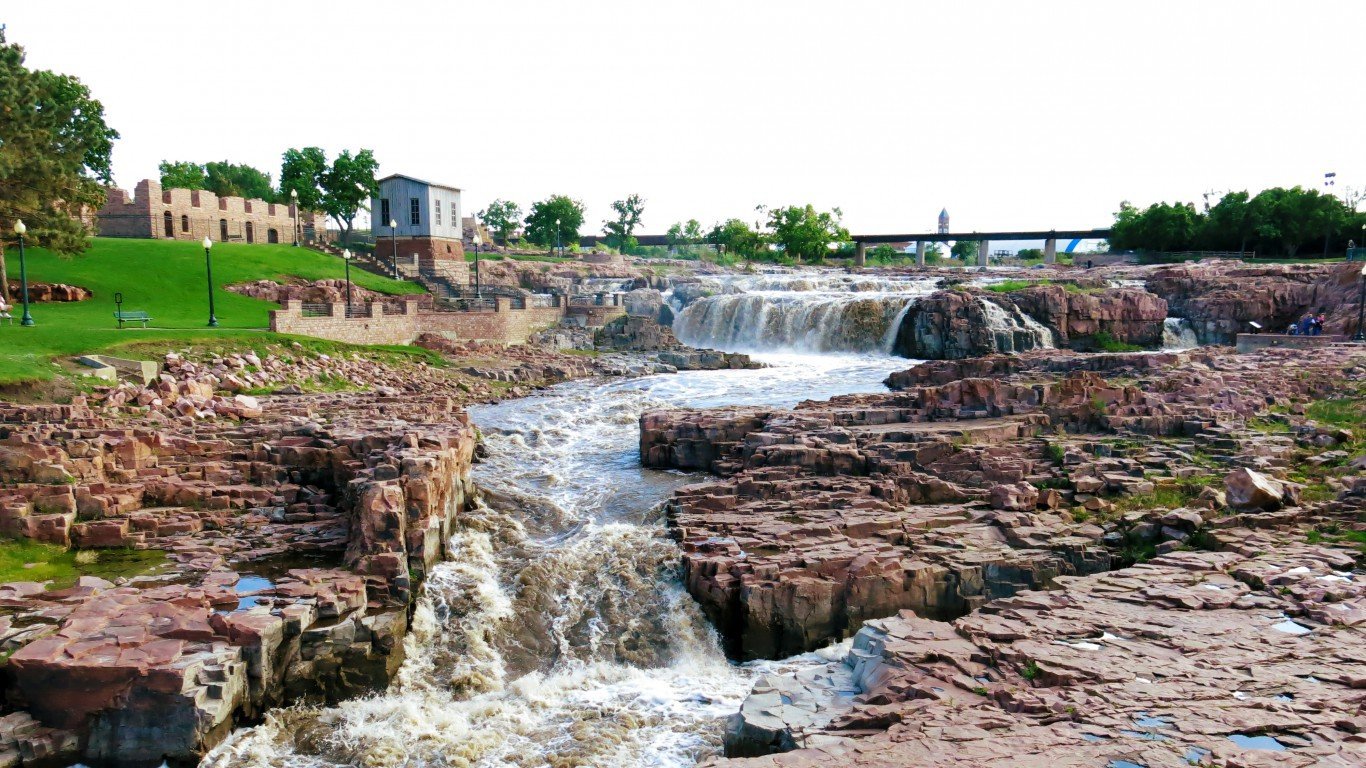
41. South Dakota: Sioux Falls
> Traffic fatalities: 5.5 per 100,000
> South Dakota traffic fatalities: 13.4 per 100,000
> Avg. commute: 18.2 minutes
> South Dakota avg. commute: 16.6 minutes
> Avg. gas price: $2.15
[in-text-ad]
Source: Thinkstock
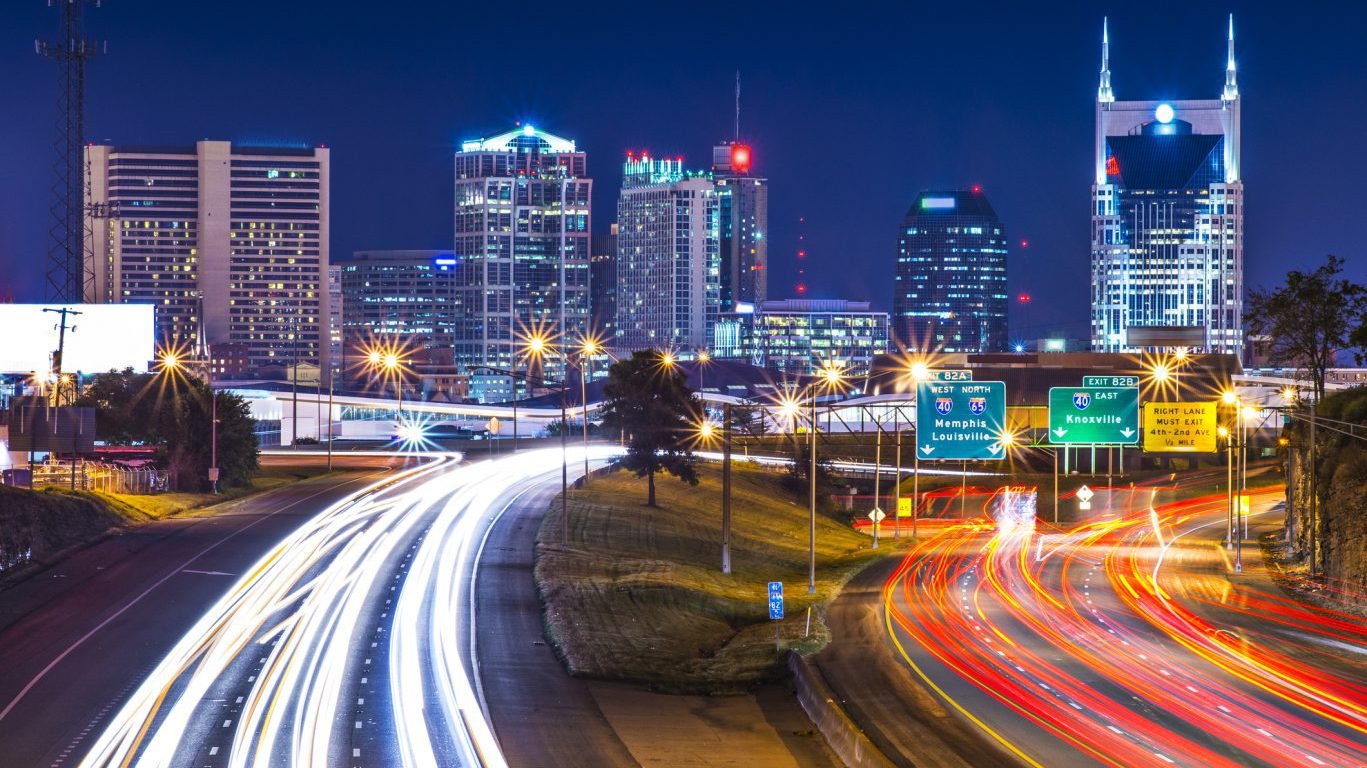
42. Tennessee: Nashville-Davidson–Murfreesboro–Franklin
> Traffic fatalities: 13.2 per 100,000
> Tennessee traffic fatalities: 15.7 per 100,000
> Avg. commute: 27.6 minutes
> Tennessee avg. commute: 25.1 minutes
> Avg. gas price: $1.97
Source: Thinkstock
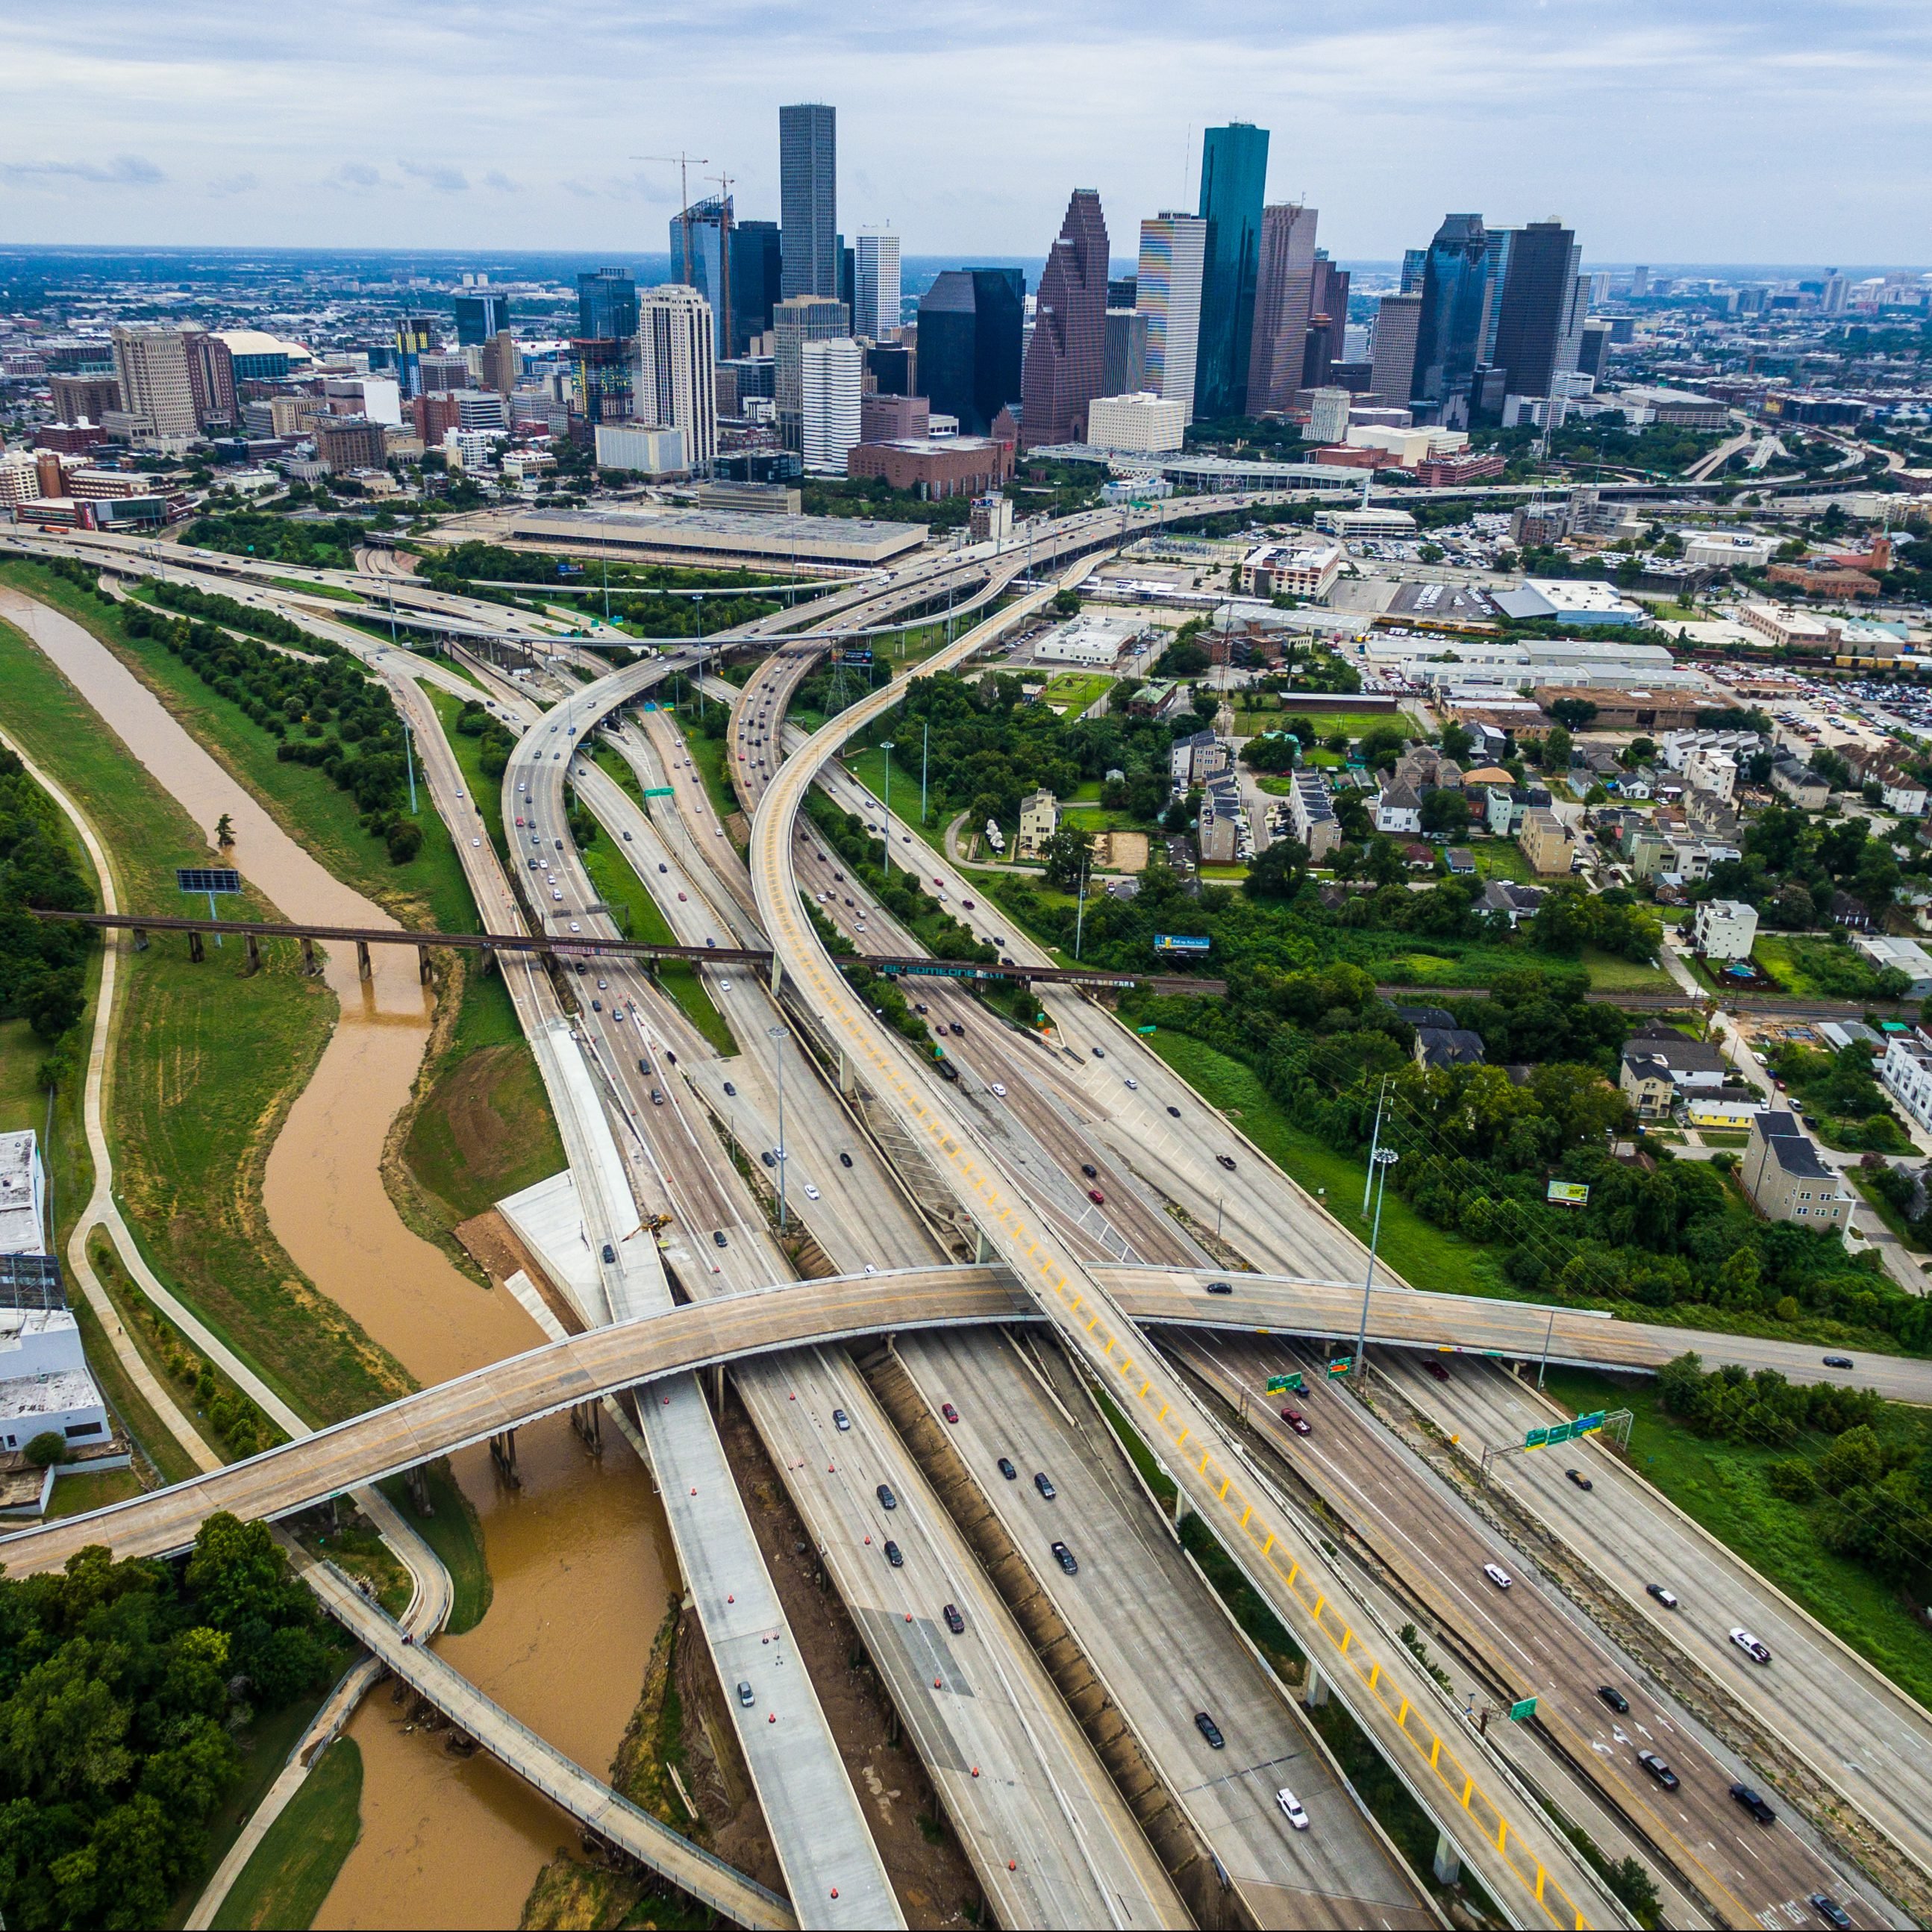
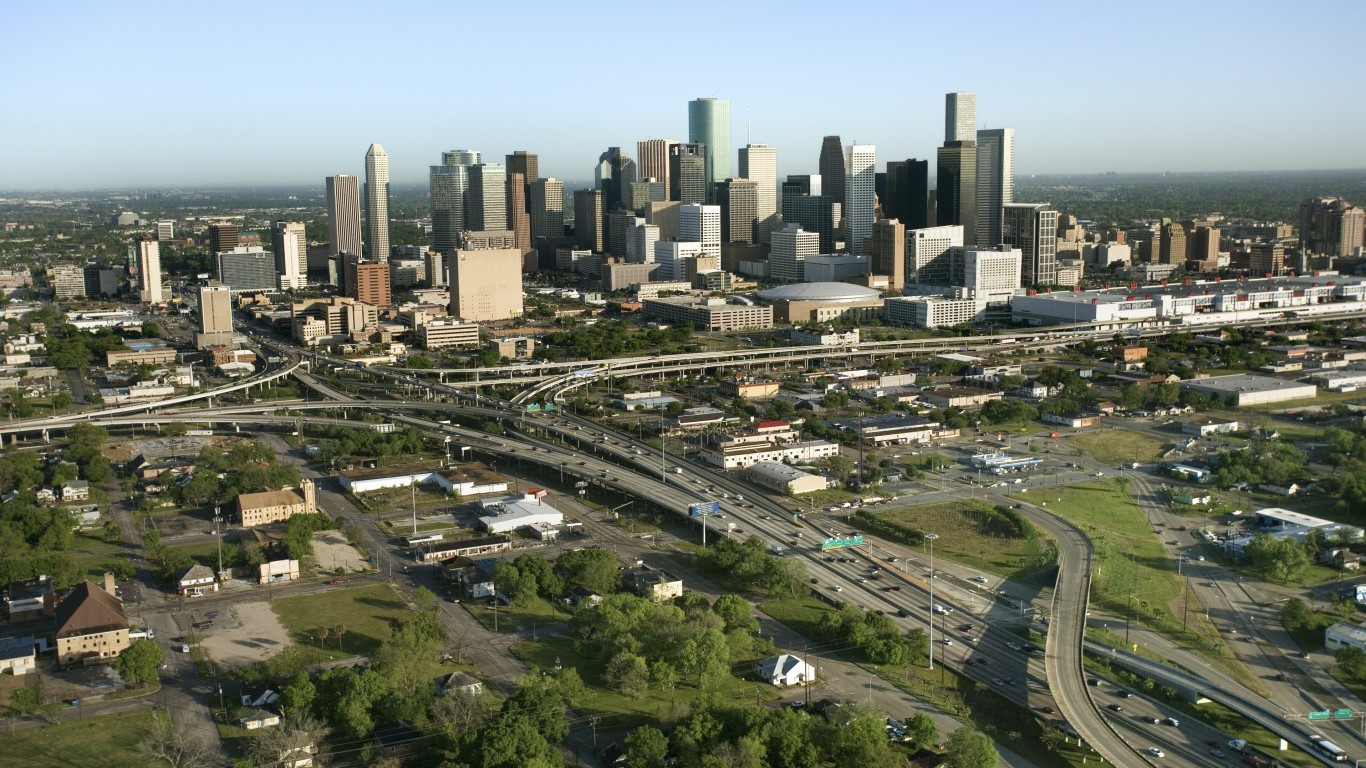
43. Texas: Houston-The Woodlands-Sugar Land
> Traffic fatalities: 10.4 per 100,000
> Texas traffic fatalities: 13.6 per 100,000
> Avg. commute: 30.0 minutes
> Texas avg. commute: 26.5 minutes
> Avg. gas price: $2.02

Source: Thinkstock
44. Utah: Ogden-Clearfield
> Traffic fatalities: 8.7 per 100,000
> Utah traffic fatalities: 9.2 per 100,000
> Avg. commute: 22.7 minutes
> Utah avg. commute: 21.6 minutes
> Avg. gas price: $2.15
[in-text-ad-2]
Source: Thinkstock
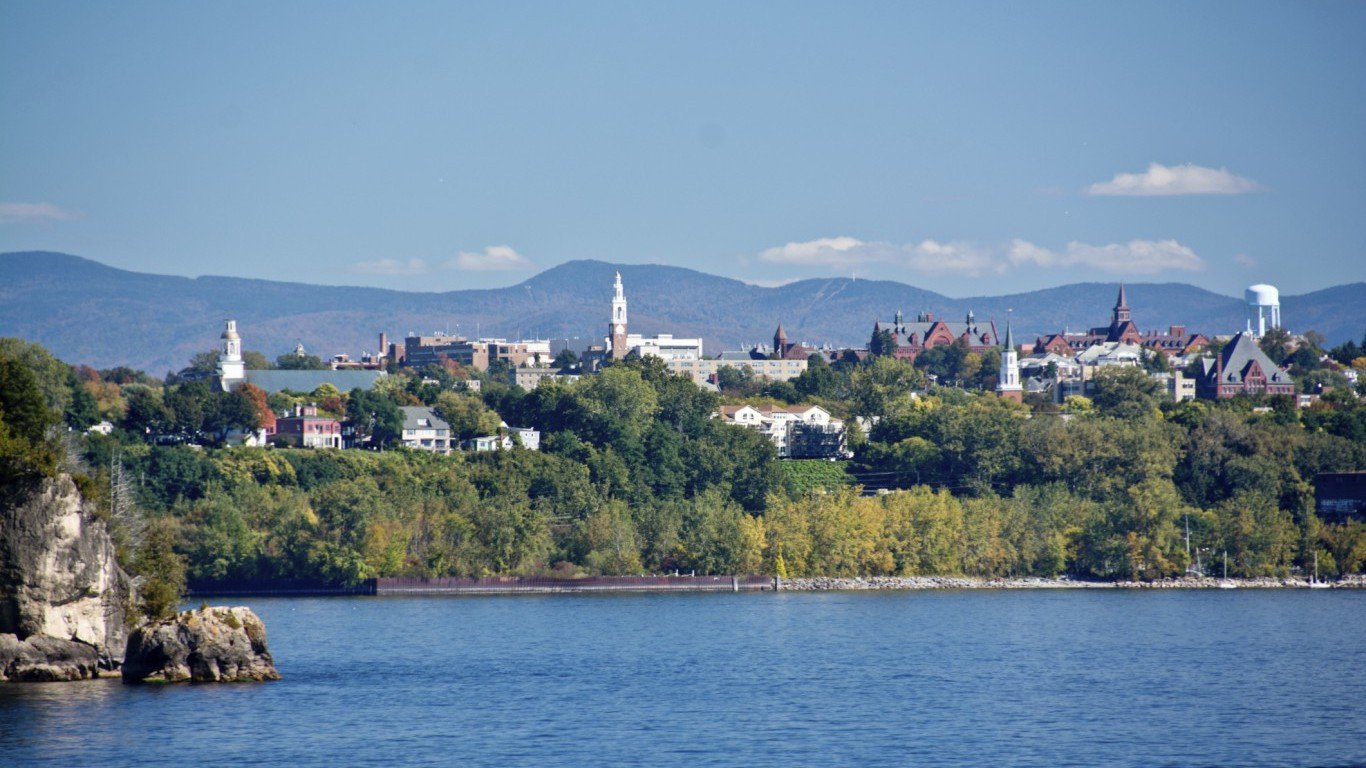
45. Vermont: Burlington-South Burlington
> Traffic fatalities: 6.4 per 100,000
> Vermont traffic fatalities: 9.9 per 100,000
> Avg. commute: 22.5 minutes
> Vermont avg. commute: 23.1 minutes
> Avg. gas price: $2.31
Source: Thinkstock
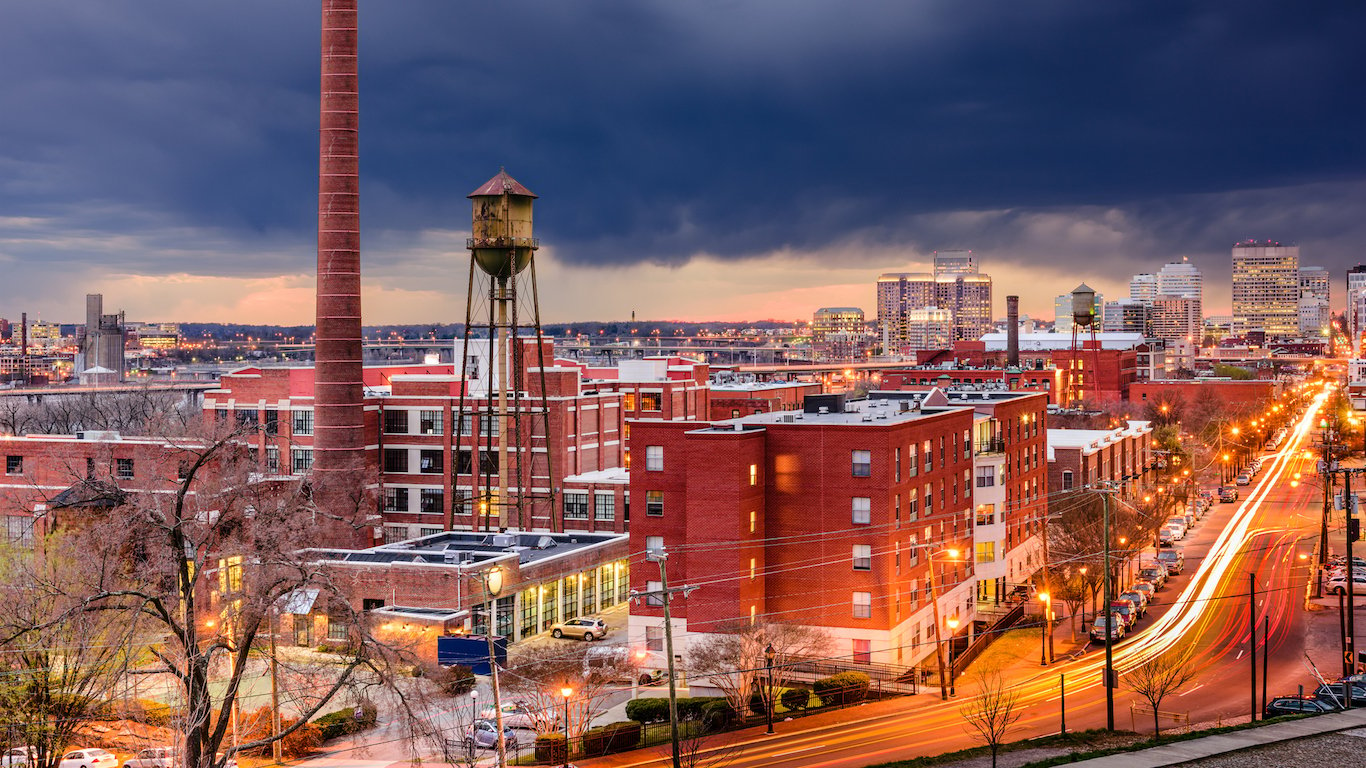
46. Virginia: Richmond
> Traffic fatalities: 10.4 per 100,000
> Virginia traffic fatalities: 9.0 per 100,000
> Avg. commute: 25.6 minutes
> Virginia avg. commute: 28.5 minutes
> Avg. gas price: $2.02
[in-text-ad]
Source: Thinkstock
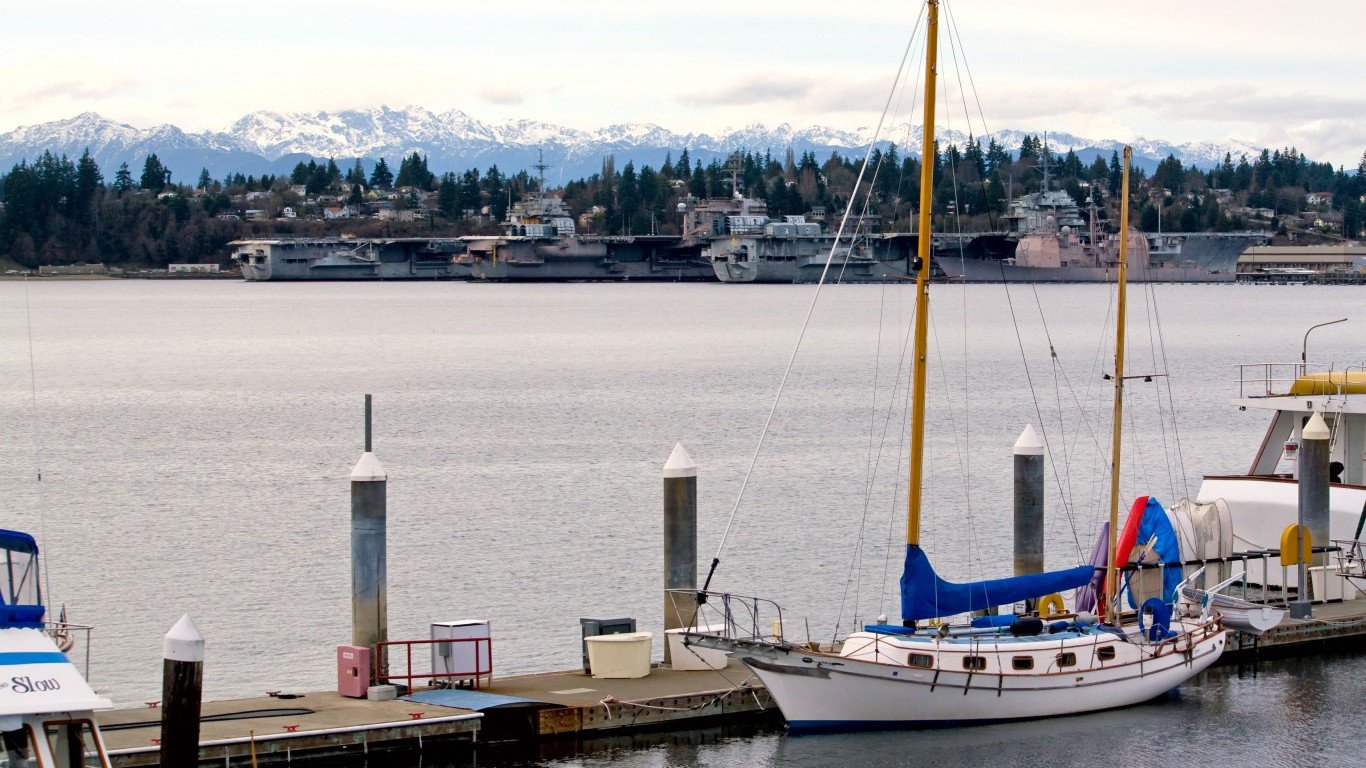
47. Washington: Bremerton-Silverdale
> Traffic fatalities: 7.9 per 100,000
> Washington traffic fatalities: 7.4 per 100,000
> Avg. commute: 30.8 minutes
> Washington avg. commute: 27.8 minutes
> Avg. gas price: N/A
 24/7 Wall St.
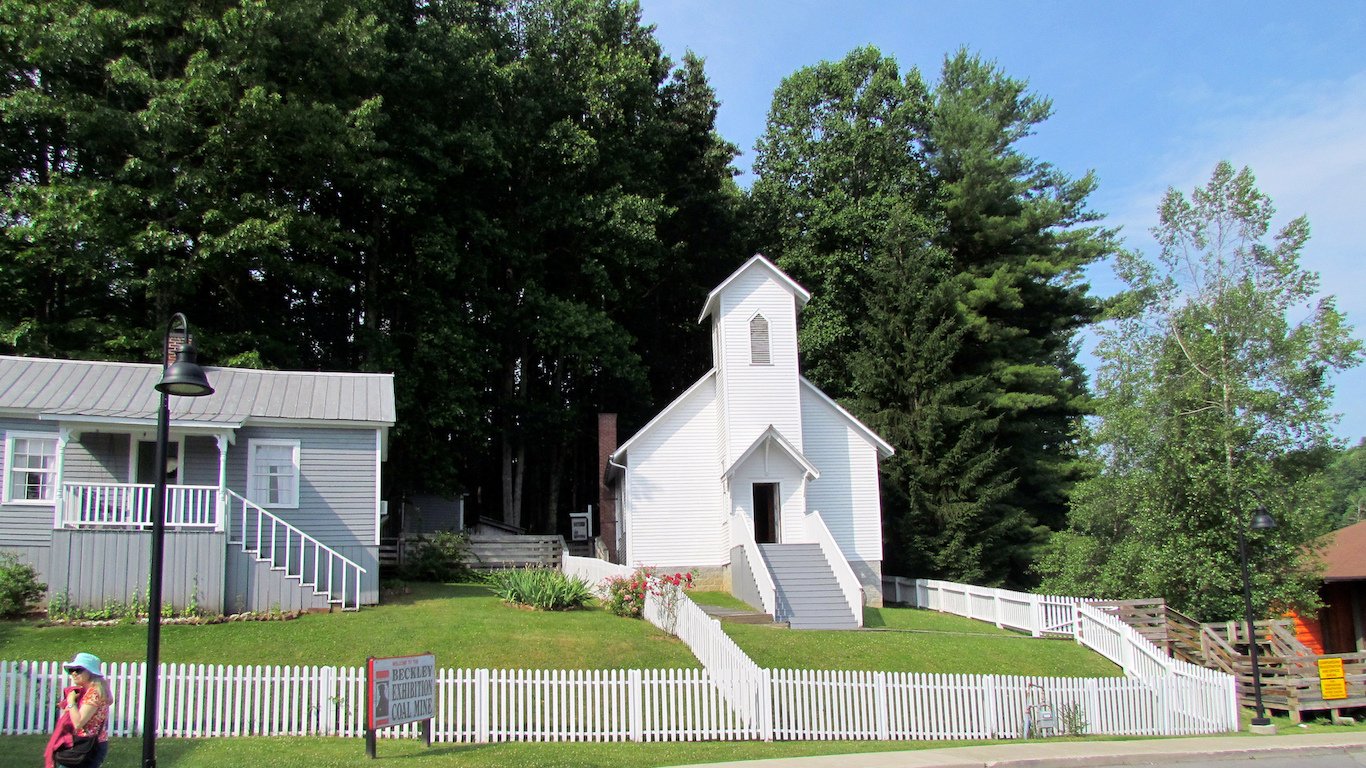
Source: bobistraveling / Flickr
48. West Virginia: Beckley
> Traffic fatalities: 14.9 per 100,000
> West Virginia traffic fatalities: 14.7 per 100,000
> Avg. commute: 24.9 minutes
> West Virginia avg. commute: 25.4 minutes
> Avg. gas price: N/A

Source: Thinkstock
49. Wisconsin: Milwaukee-Waukesha-West Allis
> Traffic fatalities: 7.5 per 100,000
> Wisconsin traffic fatalities: 10.5 per 100,000
> Avg. commute: 22.7 minutes
> Wisconsin avg. commute: 21.9 minutes
> Avg. gas price: $2.32
[in-text-ad-2]
Source: Thinkstock
50. Wyoming: Cheyenne
> Traffic fatalities: 15.3 per 100,000
> Wyoming traffic fatalities: 19.1 per 100,000
> Avg. commute: 15.7 minutes
> Wyoming avg. commute: 16.9 minutes
> Avg. gas price: N/A
Detailed Findings & Methodology
Each state has one metropolitan area that stands out as the worst place to drive, but conditions vary substantially from one state to the next. California’s San Francisco-Oakland-Hayward area is the worst place to drive in the state due to long commutes and high gas prices. Sioux Falls ranks as the worst city to drive in South Dakota, but it is much better for commuters than San Francisco. Commute times in Sioux Falls average 18.2 minutes, nearly half of San Francisco’s 33.6 minutes. Gas only averaged $2.15 in Sioux Falls in 2017, 82 cents less than it did in San Francisco.
In less populous states, even the worst places to drive often have much more pleasant commutes than the average drive in more populated states. In 9 of the 10 least populous states, the worst city to drive actually has better driving conditions than the majority of U.S. metro areas.
In contrast, California, Illinois, Florida, and Texas are four of the five most populous states. In each of those four states, at least one city ranks as one of the 11 worst places to drive in the entire country.
Different factors in each city contribute to a particularly aggravating drive for commuters. Albuquerque, New Mexico leads the nation in car theft, with 1,114.0 per 100,000 cars stolen a year. That is well over 10 times the national rate and far surpasses the next highest rate in the metro area of Pueblo, Colorado.
Gadsden ranks as the worst place to drive in Alabama, largely due to the high rate of traffic fatalities in the city. A reported 28.3 people are killed each year in traffic accidents per 100,000 residents in Gadsden, one of the highest rates in the country.
Alabama and the rest of the Southeastern U.S. are much more likely to have metro areas with high traffic fatality rates. Of the cities with more than 20 traffic fatalities per 100,000 people, the majority are in Southern states such as Arkansas, Louisiana, Texas, Alabama, Florida, Kentucky, and South Carolina.
While incidents like car theft and traffic accidents are devastating, they are also relatively rare. A much more common experience for drivers in cities on this list is a long, unpleasant commute. Congestion can be a relatively minor annoyance, but the minutes lost stuck in traffic each day can accumulate over the weeks and months. The average U.S. commuter spends close to two days a year stuck in traffic.
While traffic jams can happen in every city, the worst gridlocks are experienced by those commuters living in the Northeast and the West coast. There are 20 different cities in which the average commute lasts half an hour or longer. Nine of those cities are in Northeastern states like Pennsylvania, Maryland, and the notoriously congested Washington, D.C. area. Seven more of those cities are on the West Coast in either California or Washington state. The longest average commute is in East Stroudsburg, Pennsylvania, at an agonizing 39.4 minutes each commute.
Though the Midwest is often mocked as a collection of “flyover states,” they are much easier to drive through. Many of the quickest average commutes take place in North Dakota, Iowa, and Minnesota.
To identify the worst metro areas in which to drive, 24/7 Wall St. created an index that consists of road fatalities, average commute time, car theft rate, average annual gallons of gas wasted due to traffic, average annual hours wasted due to traffic, and the average cost of a gallon of gas. Data on average wasted fuel per driver and the hours of delay spent per auto commuter in traffic in 2014 came from the Texas A&M Transportation Institute and was aggregated from the urban area level to metropolitan statistical areas using geographic definitions from the Census Bureau. The average price of gasoline for the period from second quarter 2016 to second quarter 2017 came from the Council for Community and Economic Research, and was also aggregated from urban areas to MSAs using Census Bureau definitions. The car theft rate is measured per 100,000 metro area residents and came from the National Insurance Crime Bureau’s “Hot Spots Vehicle Theft Report” that covers the rate of car theft for 2016. Roadway fatalities per 100,000 residents came from the Fatality Analysis Reporting System provided by the National Highway Traffic Safety Administration and are for 2016.
Essential Tips for Investing: Sponsored
A financial advisor can help you understand the advantages and disadvantages of investment properties. Finding a qualified financial advisor doesn’t have to be hard. SmartAsset’s free tool matches you with up to three financial advisors who serve your area, and you can interview your advisor matches at no cost to decide which one is right for you. If you’re ready to find an advisor who can help you achieve your financial goals, get started now.
Investing in real estate can diversify your portfolio. But expanding your horizons may add additional costs. If you’re an investor looking to minimize expenses, consider checking out online brokerages. They often offer low investment fees, helping you maximize your profit.
Thank you for reading! Have some feedback for us?
Contact the 24/7 Wall St. editorial team.
Editors' Picks

