
The U.S. population grew from 309 million in 2010 to 325 million in 2017, a 5.3% increase. While the nation is in a period of relatively slow growth, some urban areas have experienced explosive growth over the same period.
24/7 Wall St. reviewed seven-year population change in the nation’s metropolitan areas to determine the fastest growing city in each state. Some of the fastest growing cities were in states like Florida, South Carolina, and Texas.
Rapid population growth relative to the state as a whole is not necessarily fast when compared to all cities nationwide. The fastest-growing city in states like New Jersey, Rhode Island, and New Hampshire grew by less than half the national growth rate over the seven-year period.
Of the 50 cities on this list, 10 did not keep pace with the nationwide growth rate. All but two of these 10 cities are in the Northeast or Midwest, parts of the country that have historically lost population to places with warmer climates and better economic opportunities. Specifically the Sun Belt and Western states.
24/7 Wall St. spoke to Dr. William Frey, a demographer with the Brookings Institution, about national migration trends. Frey explained that the ongoing movement to warmer climates is continuing in the United States, but has slowed somewhat recently. He added that as the economy continues to recover, long-struggling cities — Milwaukee, Detroit, Dayton, Minneapolis — have shown signs of life. “[These cities] are not growing a lot, but they are either declining less or growing more than they had been for the fast few years.”
Click here to see the fastest growing city in each state.
Click here to see our detailed findings and methodologies.
Correction: Due to a data error, the state population growth figures, both as a percentage increase and numerical increase, were incorrect for several states. That error has been corrected.

Source: Thinkstock
1. Alabama
> Fastest-growing metropolitan area: Daphne-Fairhope-Foley
> 2010-2017 pop. growth: +16.1% (+29,518)
> 2010-2017 pop. growth, Alabama: +1.9% (+89,168)
> Feb. 2018 unemployment: 3.3% (State: 3.7%)
> Largest driver of growth: Domestic migration
 24/7 Wall St.
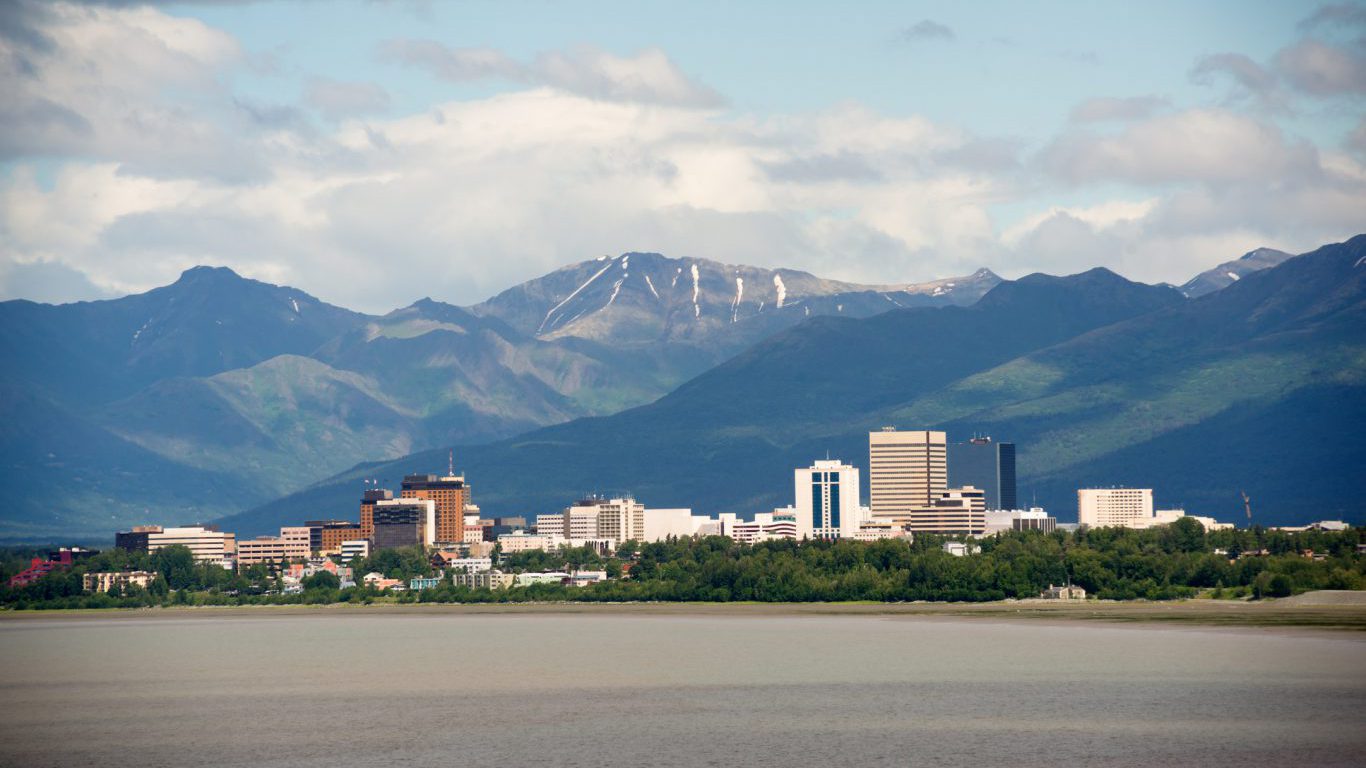
Source: Thinkstock
2. Alaska
> Fastest-growing metropolitan area: Anchorage
> 2010-2017 pop. growth: +4.6% (+17,780)
> 2010-2017 pop. growth, Alaska: +3.6% (+25,780)
> Feb. 2018 unemployment: 6.7% (State: 7.3%)
> Largest driver of growth: Births
[in-text-ad]

Source: Thinkstock
3. Arizona
> Fastest-growing metropolitan area: Phoenix-Mesa-Scottsdale
> 2010-2017 pop. growth: +12.7% (+533,122)
> 2010-2017 pop. growth, Arizona: +9.5% (+609,268)
> Feb. 2018 unemployment: 4.5% (State: 4.9%)
> Largest driver of growth: Domestic migration

Source: Thinkstock
4. Arkansas
> Fastest-growing metropolitan area: Fayetteville-Springdale-Rogers
> 2010-2017 pop. growth: +15.5% (+72,173)
> 2010-2017 pop. growth, Arkansas: +2.8% (+82,542)
> Feb. 2018 unemployment: 2.7% (State: 3.8%)
> Largest driver of growth: Domestic migration

Source: Thinkstock
5. California
> Fastest-growing metropolitan area: San Francisco-Oakland-Hayward
> 2010-2017 pop. growth: +8.8% (+382,547)
> 2010-2017 pop. growth, California: +5.9% (+2,208,963)
> Feb. 2018 unemployment: 2.8% (State: 4.3%)
> Largest driver of growth: International migration

Source: Thinkstock
6. Colorado
> Fastest-growing metropolitan area: Greeley
> 2010-2017 pop. growth: +19.8% (+50,451)
> 2010-2017 pop. growth, Colorado: +11.1% (+559,125)
> Feb. 2018 unemployment: 2.6% (State: 3.0%)
> Largest driver of growth: Domestic migration

Source: Thinkstock
7. Connecticut
> Fastest-growing metropolitan area: Bridgeport-Stamford-Norwalk
> 2010-2017 pop. growth: +3.3% (+30,172)
> 2010-2017 pop. growth, Connecticut: +0.2% (+8,013)
> Feb. 2018 unemployment: N/A (State: 4.6%)
> Largest driver of growth: International migration
[in-text-ad]

Source: Thinkstock
8. Delaware
> Fastest-growing metropolitan area: Dover
> 2010-2017 pop. growth: +8.5% (+13,851)
> 2010-2017 pop. growth, Delaware: +6.9% (+62,227)
> Feb. 2018 unemployment: 4.5% (State: 4.4%)
> Largest driver of growth: Domestic migration
Source: Thinkstock
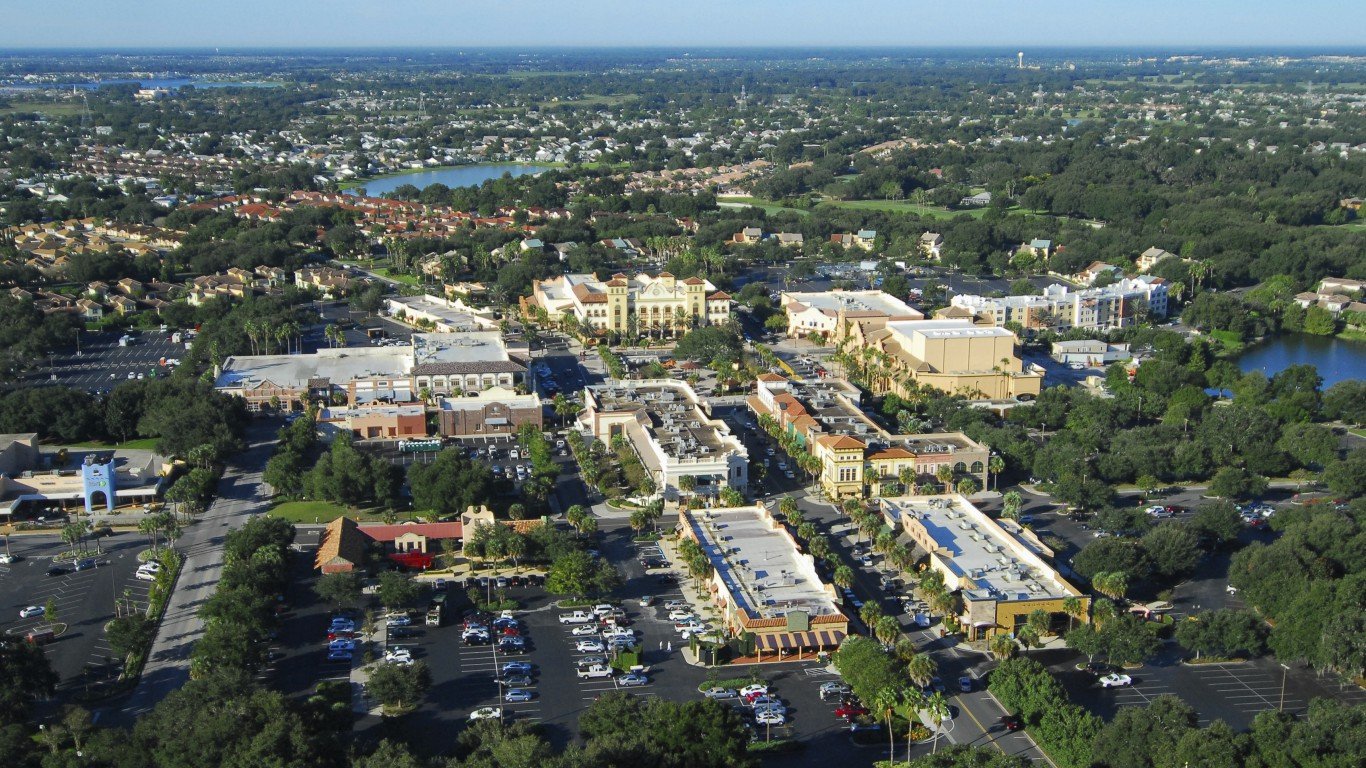
9. Florida
> Fastest-growing metropolitan area: The Villages
> 2010-2017 pop. growth: +32.8% (+30,886)
> 2010-2017 pop. growth, Florida: +11.3% (+2,137,939)
> Feb. 2018 unemployment: 5.5% (State: 3.9%)
> Largest driver of growth: Domestic migration

Source: Thinkstock
10. Georgia
> Fastest-growing metropolitan area: Savannah
> 2010-2017 pop. growth: +11.1% (+38,856)
> 2010-2017 pop. growth, Georgia: +7.4% (+716,683)
> Feb. 2018 unemployment: 4.1% (State: 4.5%)
> Largest driver of growth: Domestic migration
Source: Thinkstock
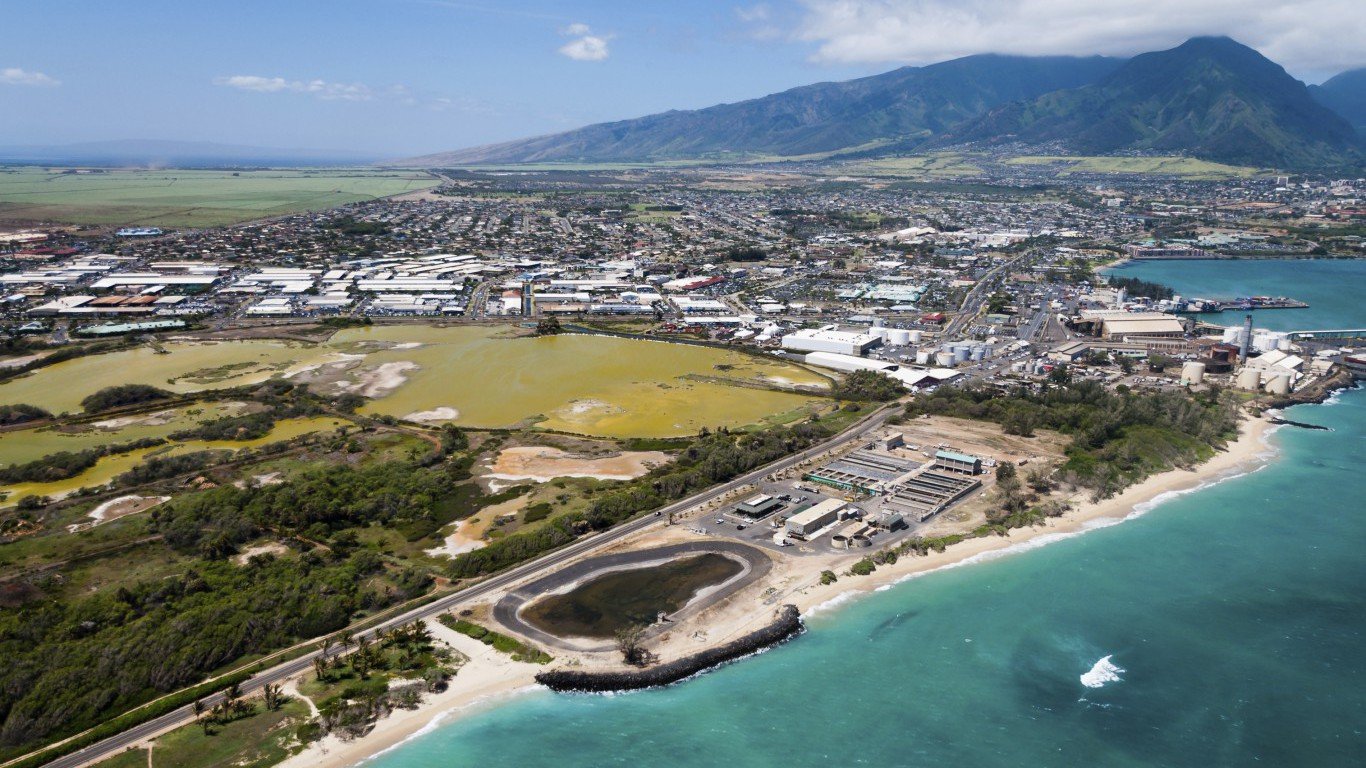
11. Hawaii
> Fastest-growing metropolitan area: Kahului-Wailuku-Lahaina
> 2010-2017 pop. growth: +7.3% (+11,270)
> 2010-2017 pop. growth, Hawaii: +4.7% (+63,721)
> Feb. 2018 unemployment: 2.0% (State: 2.1%)
> Largest driver of growth: Births

Source: Thinkstock
12. Idaho
> Fastest-growing metropolitan area: Boise City
> 2010-2017 pop. growth: +14.9% (+91,865)
> 2010-2017 pop. growth, Idaho: +9.3% (+146,031)
> Feb. 2018 unemployment: 2.7% (State: 3.0%)
> Largest driver of growth: Domestic migration
[in-text-ad]

Source: Thinkstock
13. Illinois
> Fastest-growing metropolitan area: Champaign-Urbana
> 2010-2017 pop. growth: +2.9% (+6,791)
> 2010-2017 pop. growth, Illinois: -0.3% (-39,173)
> Feb. 2018 unemployment: 3.5% (State: 4.7%)
> Largest driver of growth: International migration
Source: Thinkstock
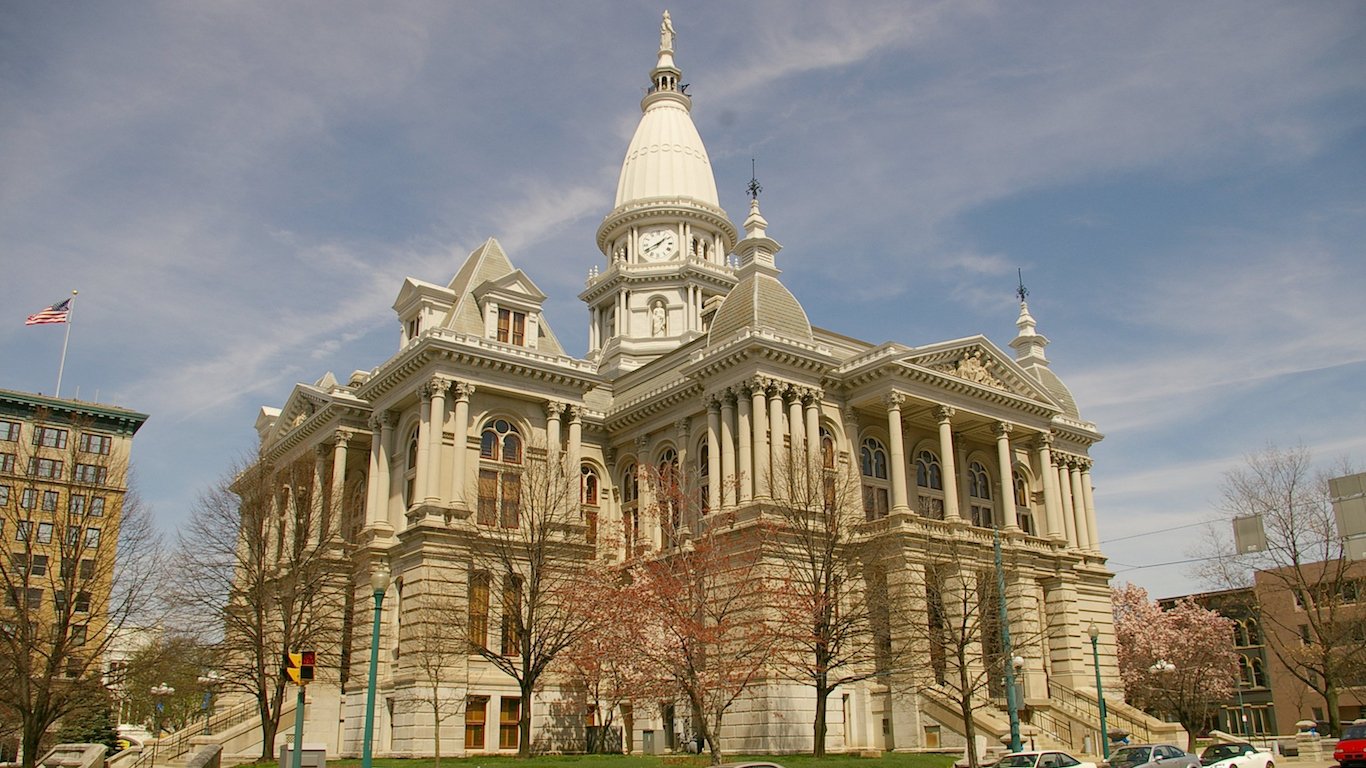
14. Indiana
> Fastest-growing metropolitan area: Lafayette-West Lafayette
> 2010-2017 pop. growth: +8.5% (+17,134)
> 2010-2017 pop. growth, Indiana: +2.7% (+176,789)
> Feb. 2018 unemployment: 3.1% (State: 3.2%)
> Largest driver of growth: International migration

Source: Thinkstock
15. Iowa
> Fastest-growing metropolitan area: Des Moines-West Des Moines
> 2010-2017 pop. growth: +12.9% (+73,944)
> 2010-2017 pop. growth, Iowa: +3.1% (+95,488)
> Feb. 2018 unemployment: 2.8% (State: 2.9%)
> Largest driver of growth: Births
Source: Jeff Zehnder / Shutterstock.com
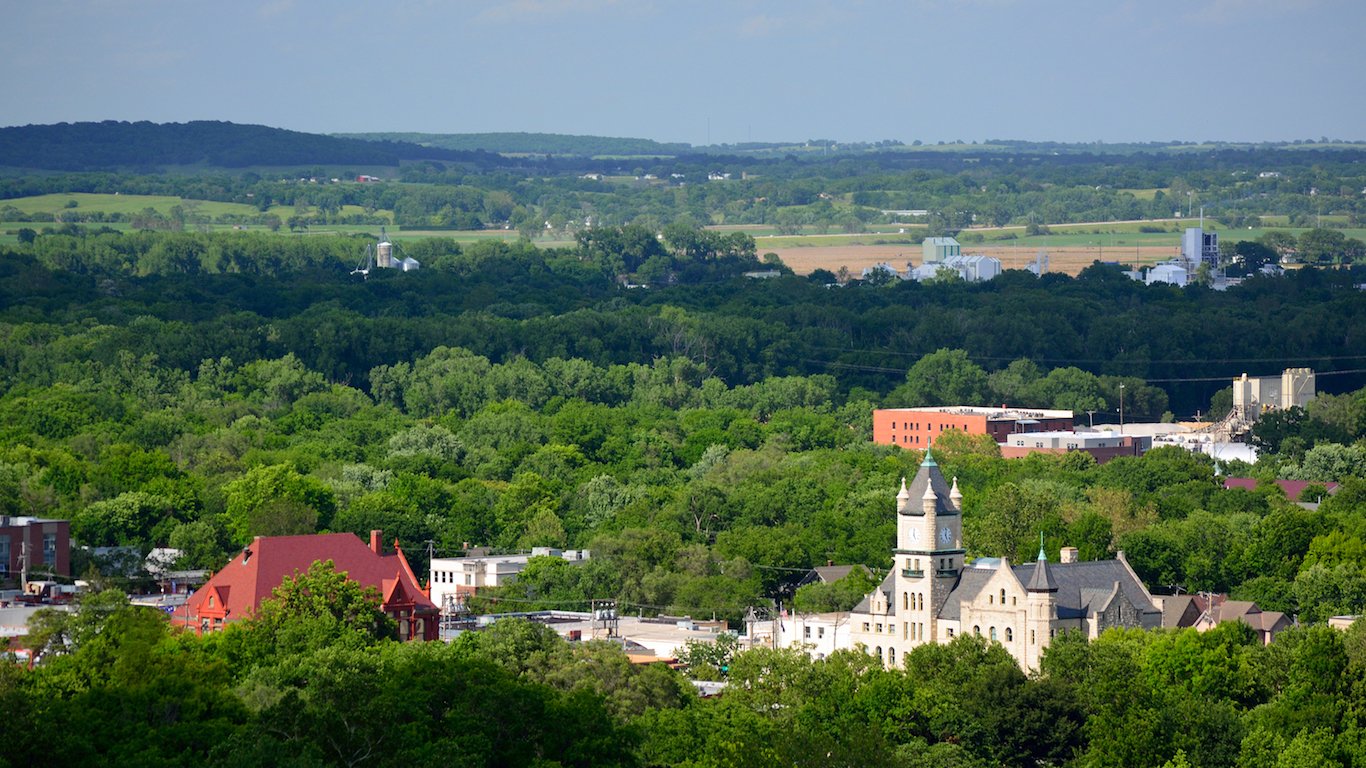
16. Kansas
> Fastest-growing metropolitan area: Lawrence
> 2010-2017 pop. growth: +8.6% (+9,569)
> 2010-2017 pop. growth, Kansas: +1.9% (+54,720)
> Feb. 2018 unemployment: 3.0% (State: 3.4%)
> Largest driver of growth: International migration
 24/7 Wall St.
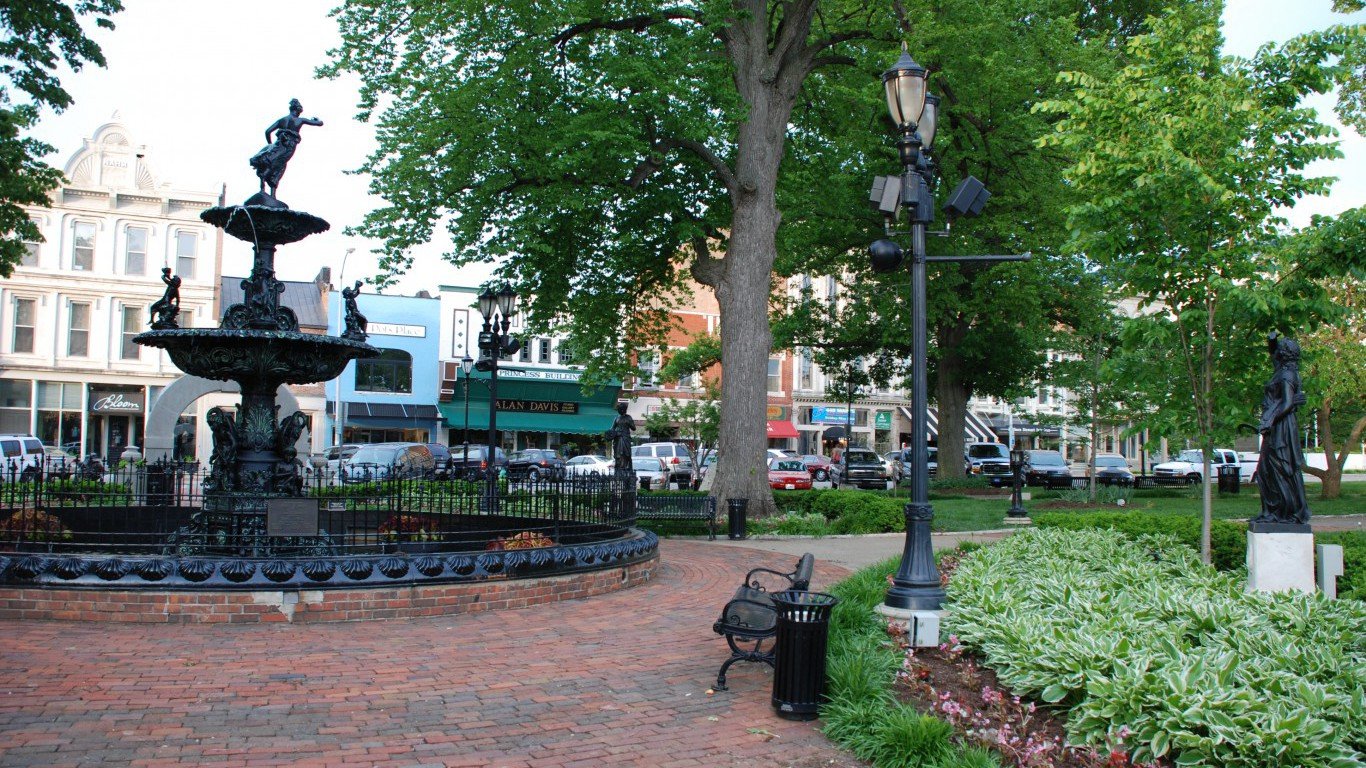
Source: https://www.flickr.com/photos/joeshlabotnik/
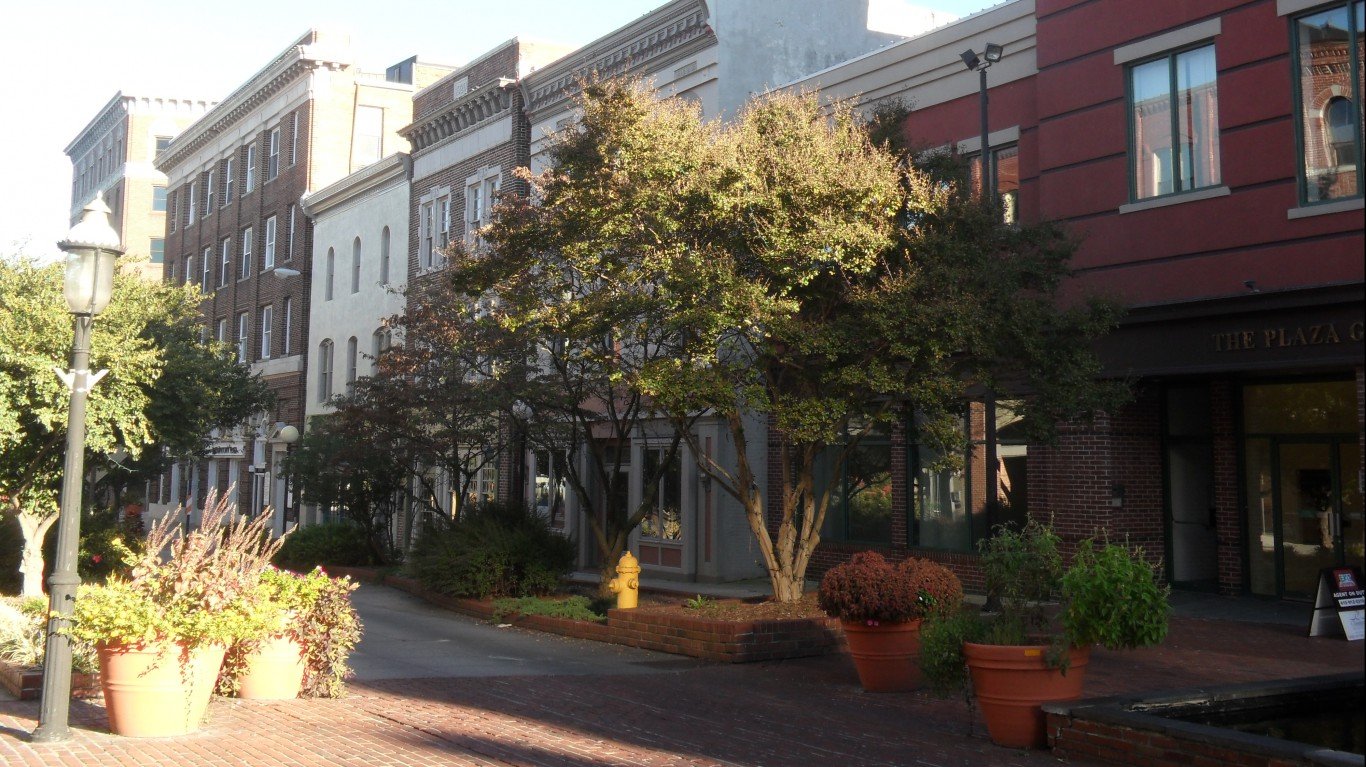
17. Kentucky
> Fastest-growing metropolitan area: Bowling Green
> 2010-2017 pop. growth: +9.7% (+15,526)
> 2010-2017 pop. growth, Kentucky: +2.4% (+106,241)
> Feb. 2018 unemployment: 3.6% (State: 4.1%)
> Largest driver of growth: Domestic migration
[in-text-ad]

Source: Richard David Ramsey / Wikimedia Commons
18. Louisiana
> Fastest-growing metropolitan area: Hammond
> 2010-2017 pop. growth: +9.1% (+11,012)
> 2010-2017 pop. growth, Louisiana: +3.1% (+139,462)
> Feb. 2018 unemployment: 4.6% (State: 4.5%)
> Largest driver of growth: Births

Source: Thinkstock
19. Maine
> Fastest-growing metropolitan area: Portland-South Portland
> 2010-2017 pop. growth: +3.5% (+18,204)
> 2010-2017 pop. growth, Maine: +0.6% (+8,339)
> Feb. 2018 unemployment: N/A (State: 2.9%)
> Largest driver of growth: Domestic migration
Source: Eric Fischer / Wikimedia Commons
20. Maryland
> Fastest-growing metropolitan area: Salisbury
> 2010-2017 pop. growth: +8.3% (+31,030)
> 2010-2017 pop. growth, Maryland: +4.6% (+264,078)
> Feb. 2018 unemployment: 5.4% (State: 4.2%)
> Largest driver of growth: Domestic migration

Source: Thinkstock
21. Massachusetts
> Fastest-growing metropolitan area: Boston-Cambridge-Newton
> 2010-2017 pop. growth: +5.9% (+271,311)
> 2010-2017 pop. growth, Massachusetts: +4.5% (+294,876)
> Feb. 2018 unemployment: N/A (State: 3.5%)
> Largest driver of growth: International migration
 24/7 Wall St.
Source: Thinkstock
22. Michigan
> Fastest-growing metropolitan area: Grand Rapids-Wyoming
> 2010-2017 pop. growth: +7.0% (+69,697)
> 2010-2017 pop. growth, Michigan: +0.9% (+85,580)
> Feb. 2018 unemployment: 3.7% (State: 4.8%)
> Largest driver of growth: Births
[in-text-ad]
Source: Thinkstock
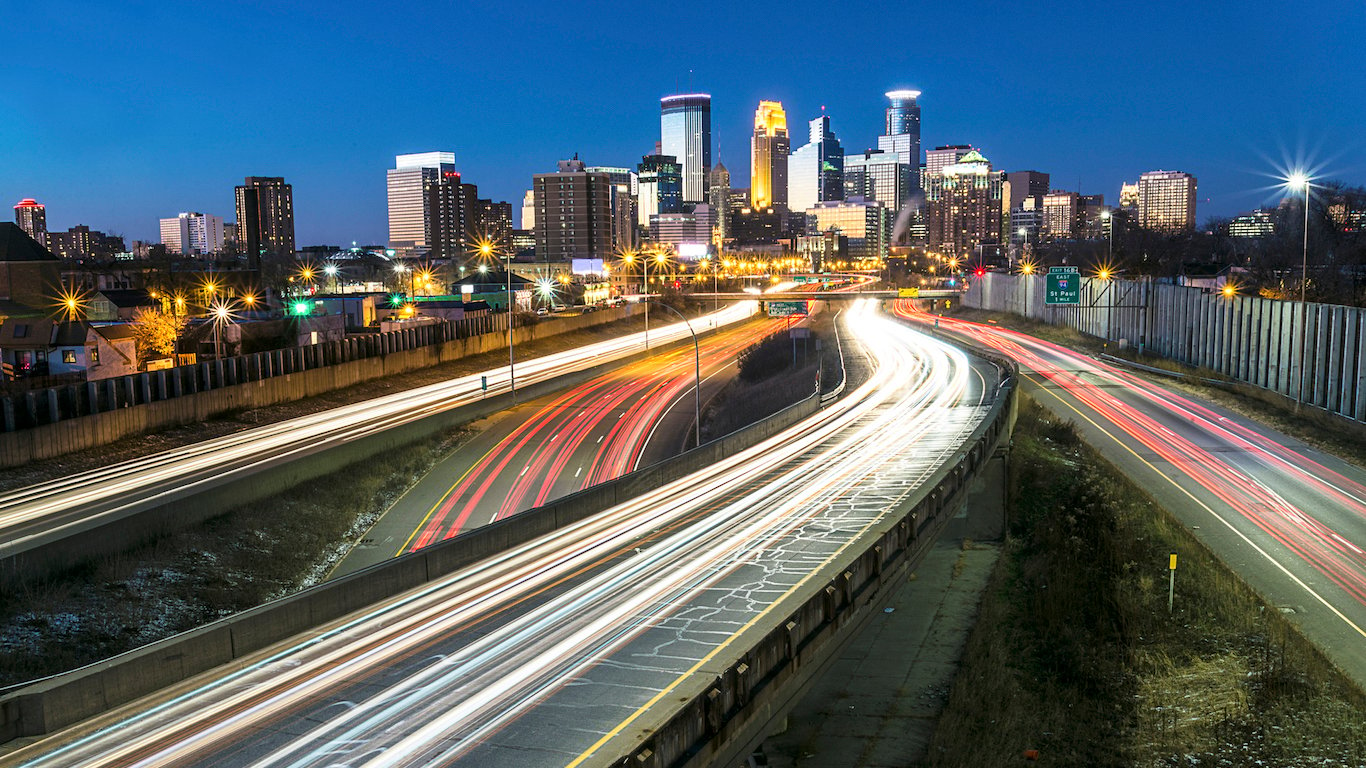
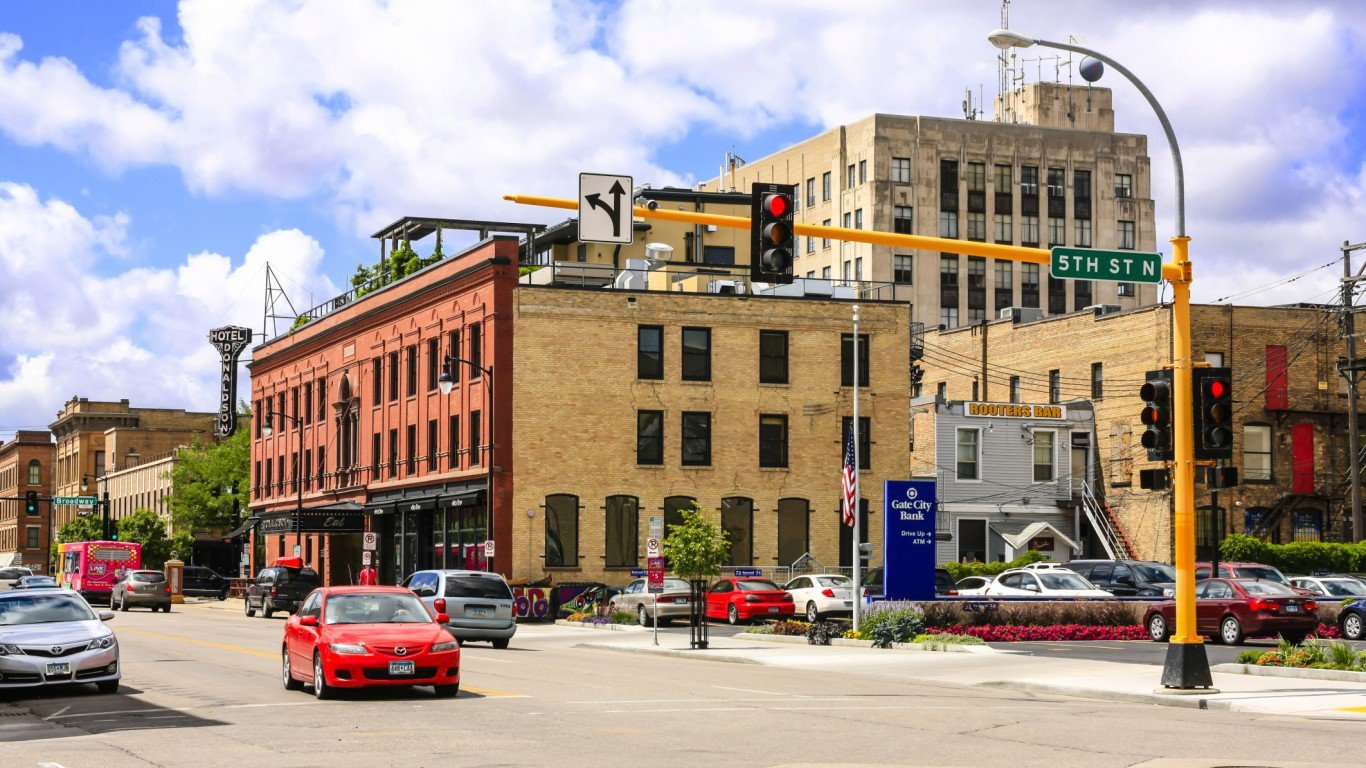
23. Minnesota
> Fastest-growing metropolitan area: Minneapolis-St. Paul-Bloomington
> 2010-2017 pop. growth: +7.3% (+245,422)
> 2010-2017 pop. growth, Minnesota: +5.0% (+265,895)
> Feb. 2018 unemployment: 2.9% (State: 3.2%)
> Largest driver of growth: Births
Source: Thinkstock
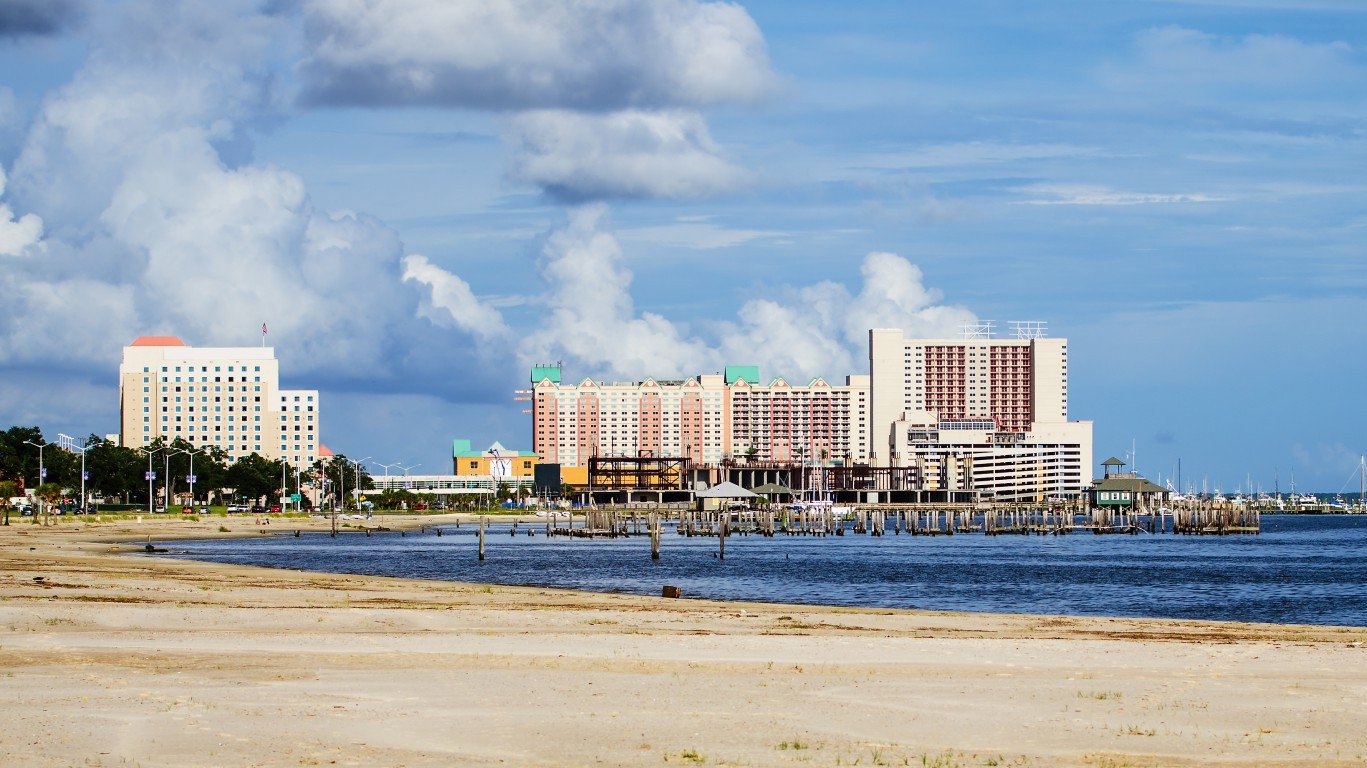
24. Mississippi
> Fastest-growing metropolitan area: Gulfport-Biloxi-Pascagoula
> 2010-2017 pop. growth: +6.2% (+22,865)
> 2010-2017 pop. growth, Mississippi: +0.5% (+13,663)
> Feb. 2018 unemployment: 4.6% (State: 4.5%)
> Largest driver of growth: Domestic migration

Source: Thinkstock
25. Missouri
> Fastest-growing metropolitan area: Columbia
> 2010-2017 pop. growth: +9.3% (+15,103)
> 2010-2017 pop. growth, Missouri: +2.0% (+117,851)
> Feb. 2018 unemployment: 2.4% (State: 3.7%)
> Largest driver of growth: Births

Source: Thinkstock
26. Montana
> Fastest-growing metropolitan area: Missoula
> 2010-2017 pop. growth: +7.3% (+8,009)
> 2010-2017 pop. growth, Montana: +6.1% (+59,986)
> Feb. 2018 unemployment: 3.9% (State: 4.1%)
> Largest driver of growth: Domestic migration
Source: Public Domain / Wikimedia Commons
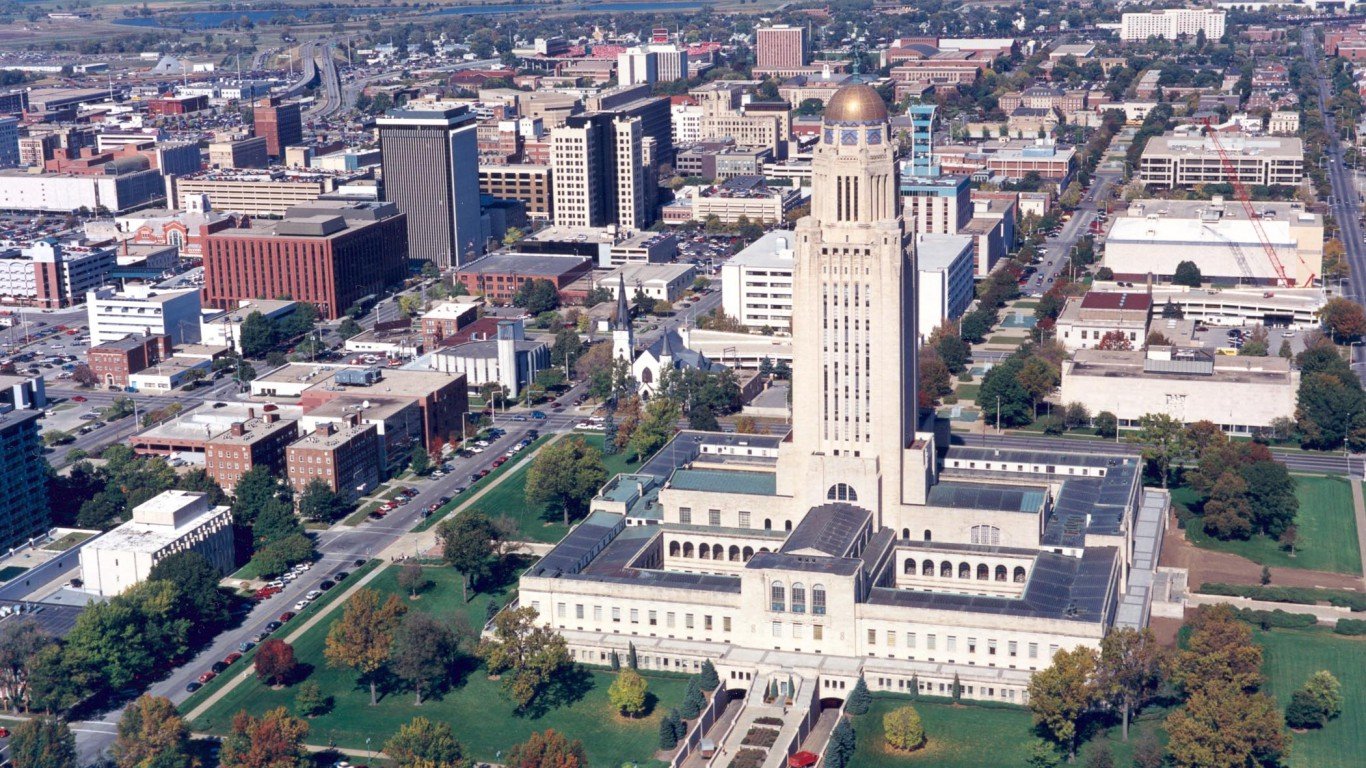
27. Nebraska
> Fastest-growing metropolitan area: Lincoln
> 2010-2017 pop. growth: +9.4% (+28,539)
> 2010-2017 pop. growth, Nebraska: +4.9% (+90,120)
> Feb. 2018 unemployment: 2.4% (State: 2.8%)
> Largest driver of growth: Births
[in-text-ad]

Source: Thinkstock
28. Nevada
> Fastest-growing metropolitan area: Las Vegas-Henderson-Paradise
> 2010-2017 pop. growth: +12.9% (+251,173)
> 2010-2017 pop. growth, Nevada: +10.9% (+295,242)
> Feb. 2018 unemployment: 5.2% (State: 4.9%)
> Largest driver of growth: Domestic migration

Source: Thinkstock
29. New Hampshire
> Fastest-growing metropolitan area: Manchester-Nashua
> 2010-2017 pop. growth: +2.2% (+8,659)
> 2010-2017 pop. growth, New Hampshire: +2.0% (+26,095)
> Feb. 2018 unemployment: N/A (State: 2.6%)
> Largest driver of growth: Births
Source: Thinkstock
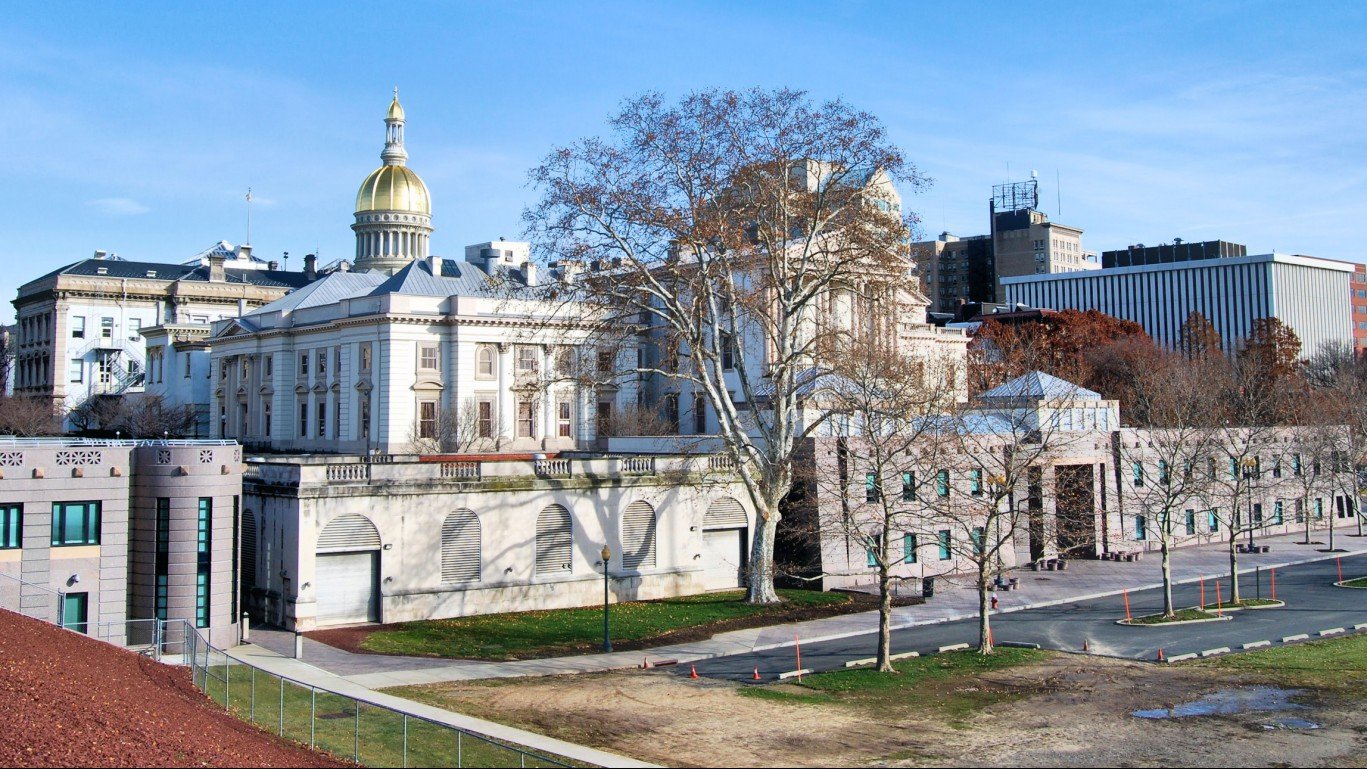
30. New Jersey
> Fastest-growing metropolitan area: Trenton
> 2010-2017 pop. growth: +1.8% (+6,803)
> 2010-2017 pop. growth, New Jersey: +2.3% (+201,936)
> Feb. 2018 unemployment: 3.9% (State: 4.6%)
> Largest driver of growth: International migration
Source: Thinkstock
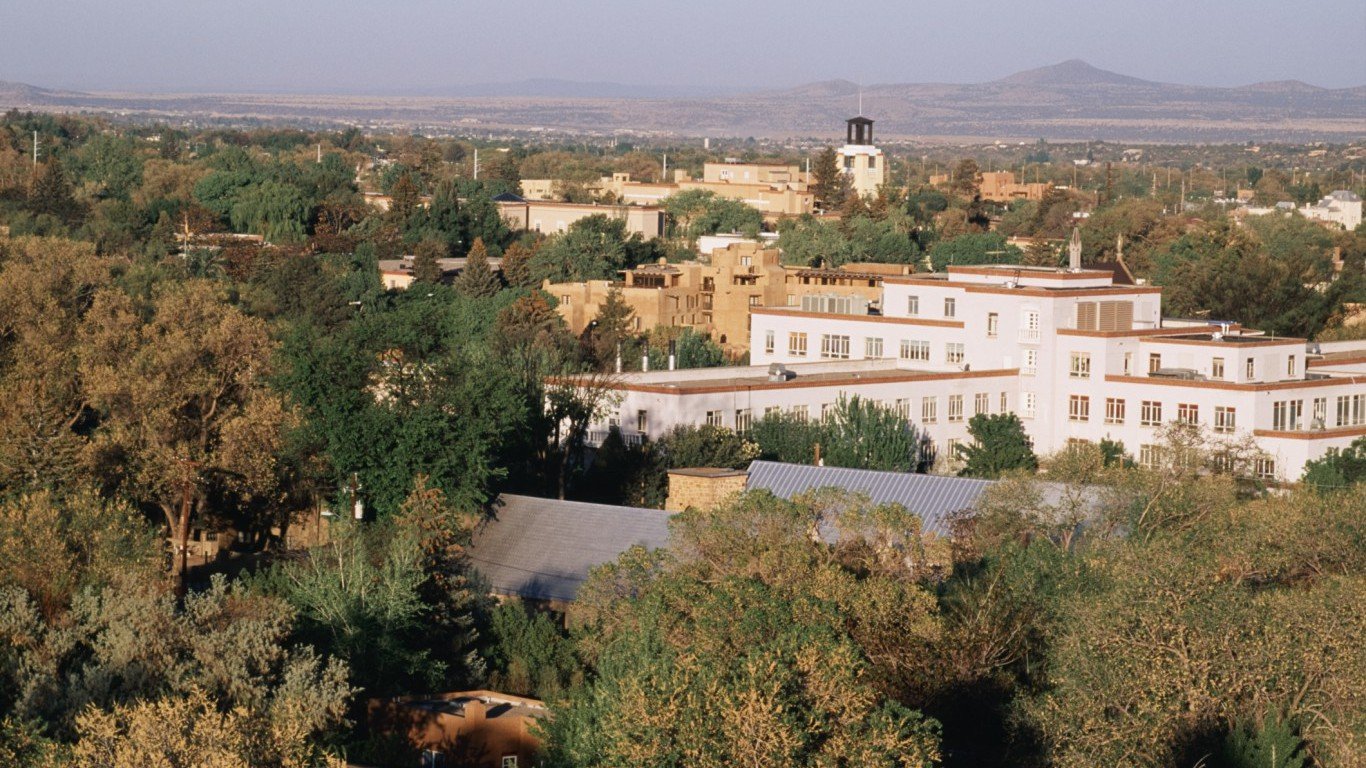
31. New Mexico
> Fastest-growing metropolitan area: Santa Fe
> 2010-2017 pop. growth: +2.9% (+4,227)
> 2010-2017 pop. growth, New Mexico: +1.1% (+23,463)
> Feb. 2018 unemployment: 4.5% (State: 5.8%)
> Largest driver of growth: Domestic migration

Source: Aurelien Guichard / Flickr
32. New York
> Fastest-growing metropolitan area: New York-Newark-Jersey City
> 2010-2017 pop. growth: +3.7% (+717,962)
> 2010-2017 pop. growth, New York: +2.3% (+444,214)
> Feb. 2018 unemployment: 4.2% (State: 4.6%)
> Largest driver of growth: International migration
[in-text-ad]
Source: Thinkstock
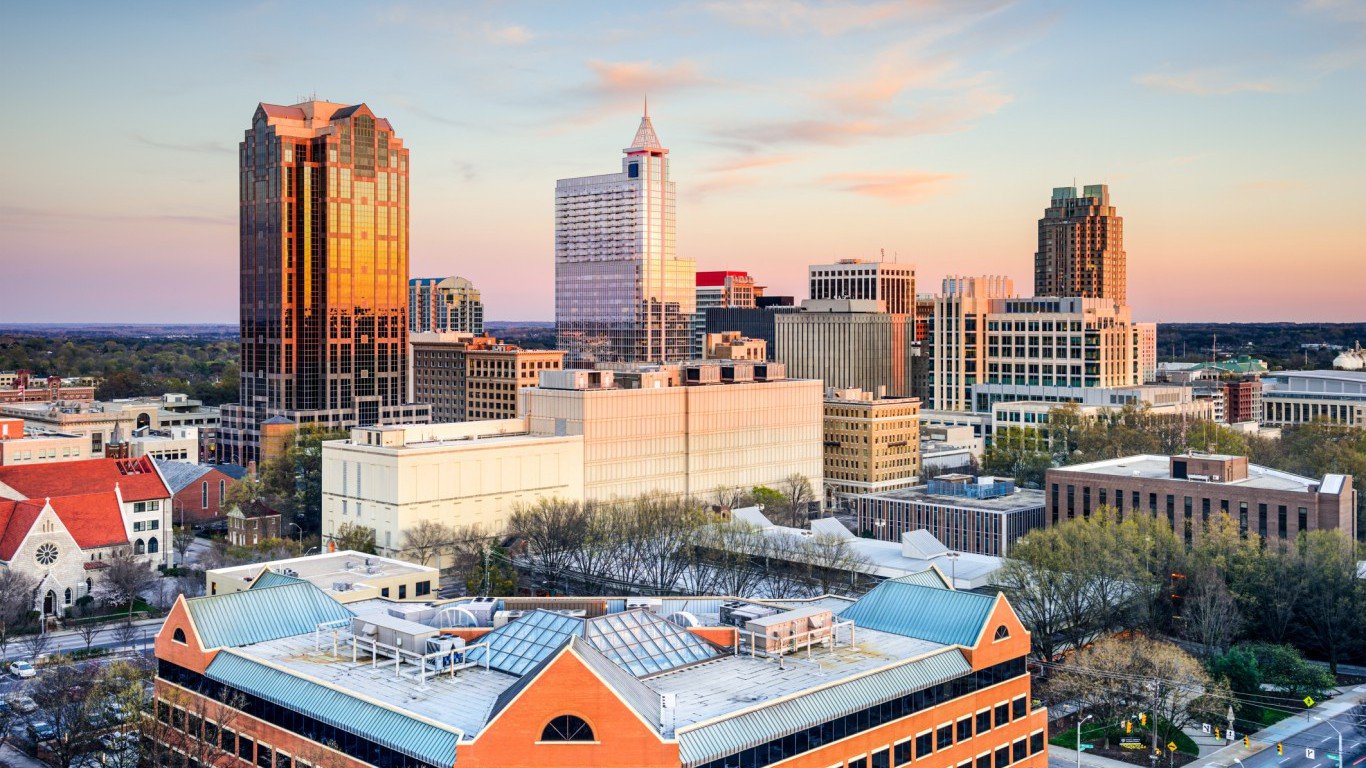
33. North Carolina
> Fastest-growing metropolitan area: Raleigh
> 2010-2017 pop. growth: +17.4% (+197,686)
> 2010-2017 pop. growth, North Carolina: +7.3% (+699,172)
> Feb. 2018 unemployment: 3.8% (State: 4.5%)
> Largest driver of growth: Domestic migration
Source: Thinkstock
34. North Dakota
> Fastest-growing metropolitan area: Fargo
> 2010-2017 pop. growth: +15.3% (+32,006)
> 2010-2017 pop. growth, North Dakota: +12.0% (+80,875)
> Feb. 2018 unemployment: 2.4% (State: 2.6%)
> Largest driver of growth: Domestic migration
Source: Thinkstock
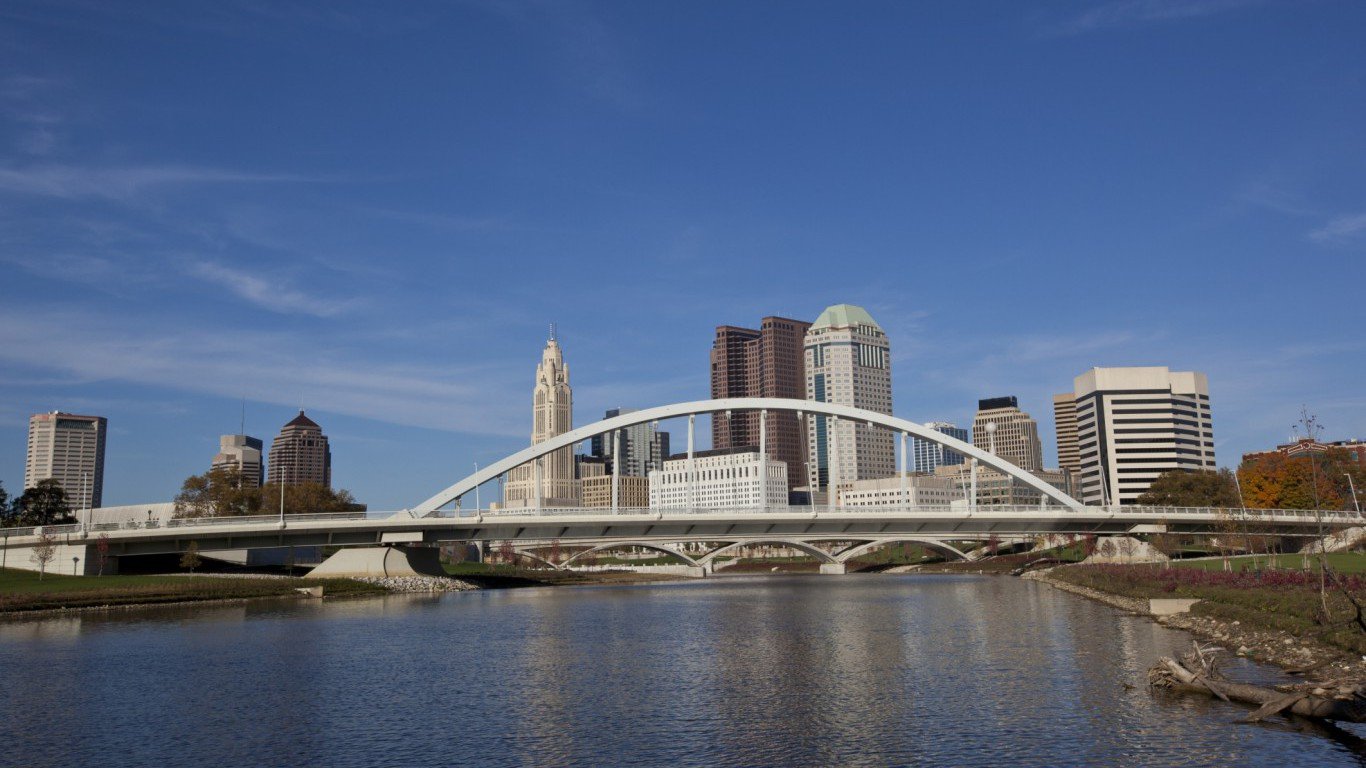
35. Ohio
> Fastest-growing metropolitan area: Columbus
> 2010-2017 pop. growth: +9.0% (+172,360)
> 2010-2017 pop. growth, Ohio: +1.0% (+119,327)
> Feb. 2018 unemployment: 3.4% (State: 4.5%)
> Largest driver of growth: Births
Source: Thinkstock
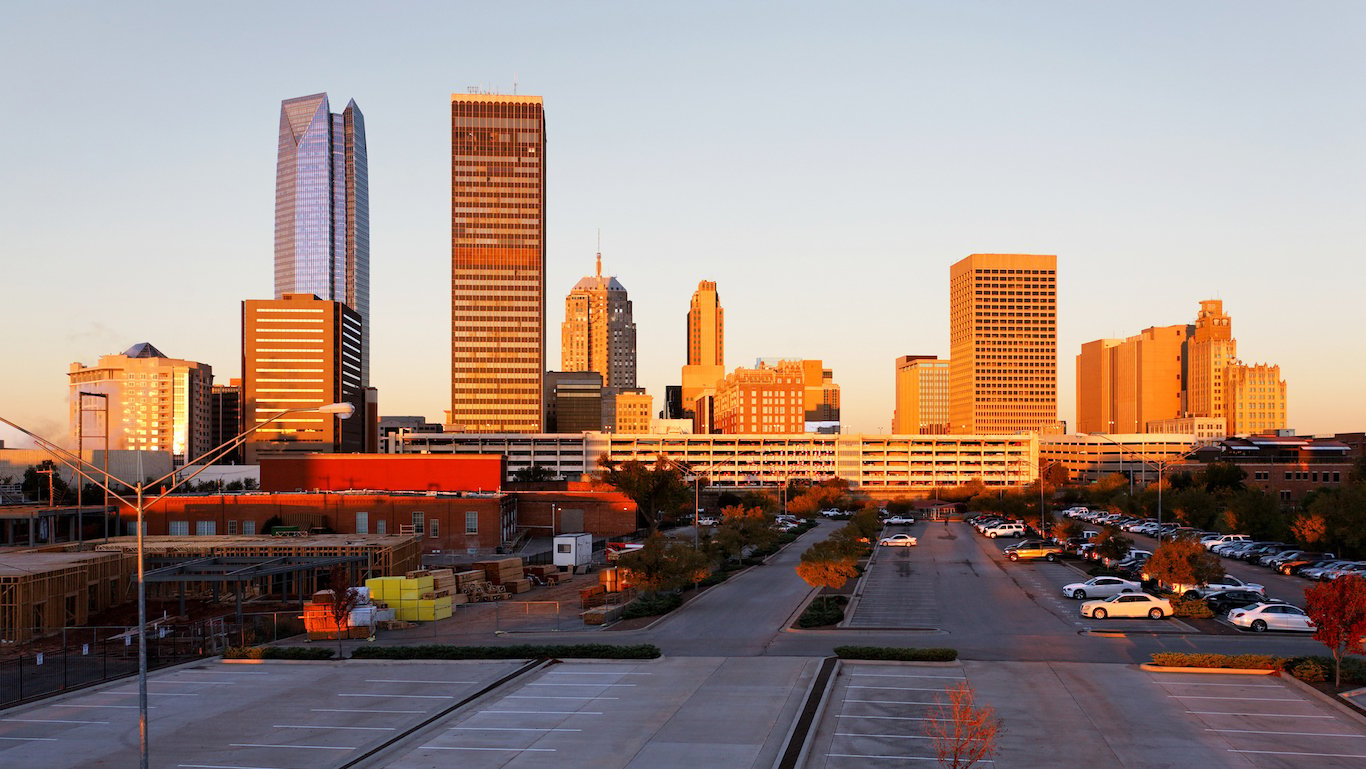
36. Oklahoma
> Fastest-growing metropolitan area: Oklahoma City
> 2010-2017 pop. growth: +10.0% (+125,994)
> 2010-2017 pop. growth, Oklahoma: +4.6% (+171,335)
> Feb. 2018 unemployment: 3.5% (State: 4.1%)
> Largest driver of growth: Births
Source: Thinkstock
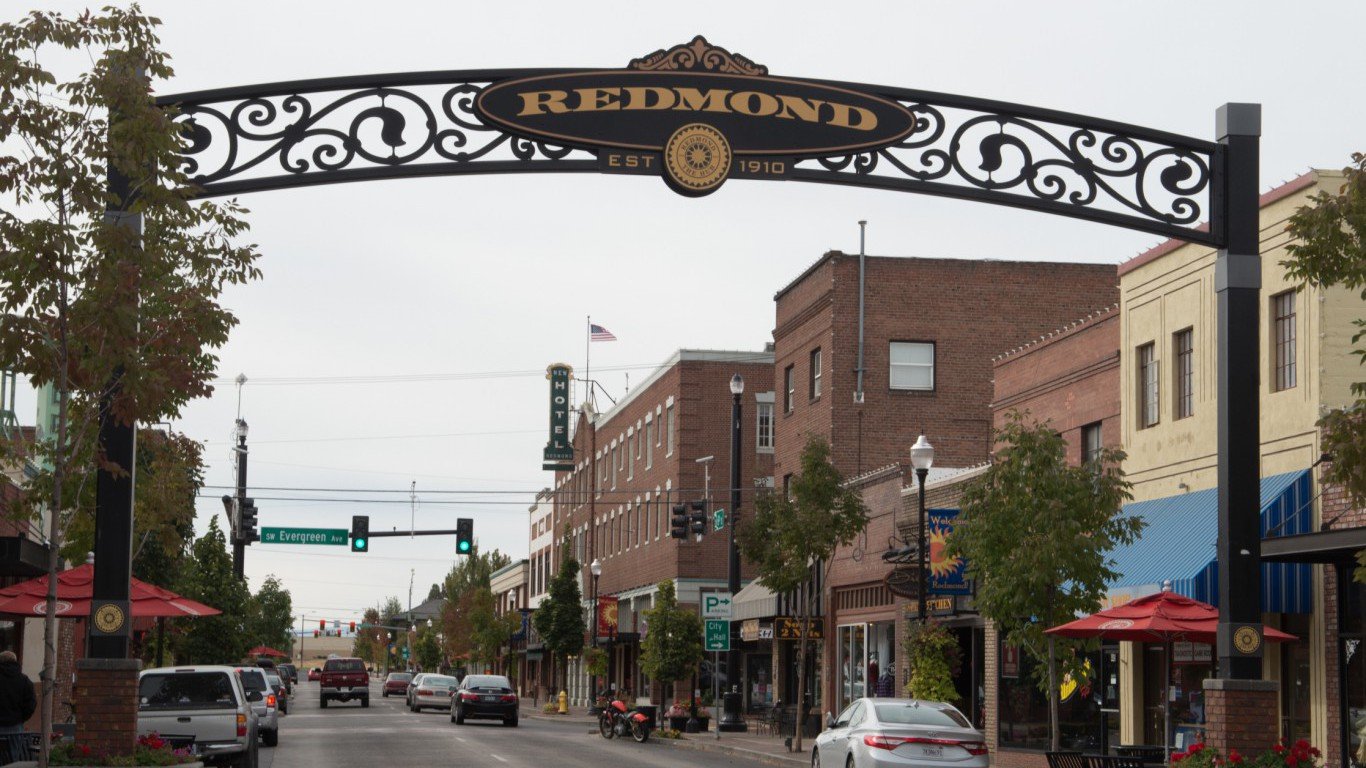
37. Oregon
> Fastest-growing metropolitan area: Bend-Redmond
> 2010-2017 pop. growth: +18.5% (+29,135)
> 2010-2017 pop. growth, Oregon: +8.0% (+305,703)
> Feb. 2018 unemployment: 4.3% (State: 4.1%)
> Largest driver of growth: Domestic migration
[in-text-ad]

Source: Thinkstock
38. Pennsylvania
> Fastest-growing metropolitan area: State College
> 2010-2017 pop. growth: +5.4% (+8,380)
> 2010-2017 pop. growth, Pennsylvania: +0.7% (+94,474)
> Feb. 2018 unemployment: 3.7% (State: 4.8%)
> Largest driver of growth: International migration

Source: Thinkstock
39. Rhode Island
> Fastest-growing metropolitan area: Providence-Warwick
> 2010-2017 pop. growth: +1.2% (+18,771)
> 2010-2017 pop. growth, Rhode Island: +0.6% (+6,470)
> Feb. 2018 unemployment: N/A (State: 4.5%)
> Largest driver of growth: International migration
Source: Thinkstock
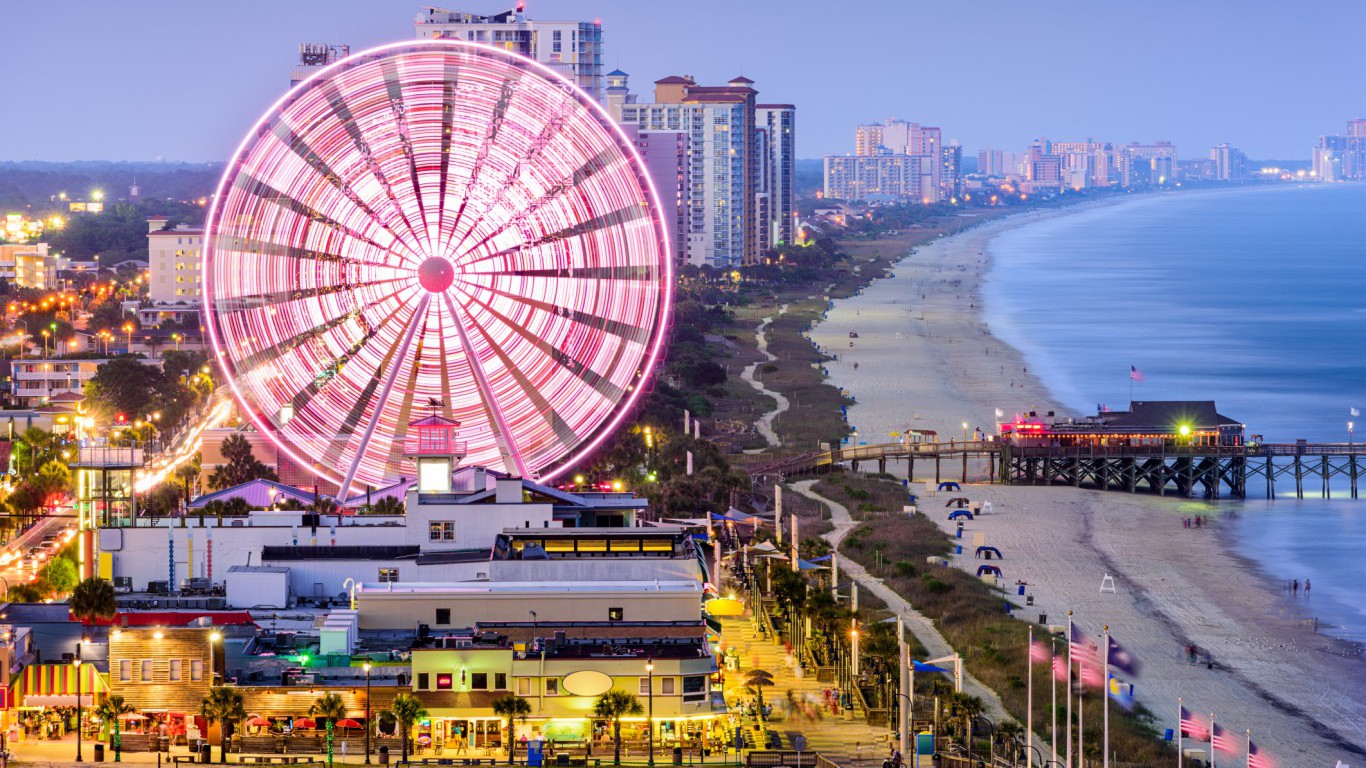
40. South Carolina
> Fastest-growing metropolitan area: Myrtle Beach-Conway-North Myrtle Beach
> 2010-2017 pop. growth: +22.6% (+85,659)
> 2010-2017 pop. growth, South Carolina: +8.4% (+388,535)
> Feb. 2018 unemployment: 5.1% (State: 4.4%)
> Largest driver of growth: Domestic migration

Source: Thinkstock
41. South Dakota
> Fastest-growing metropolitan area: Sioux Falls
> 2010-2017 pop. growth: +13.1% (+29,971)
> 2010-2017 pop. growth, South Dakota: +6.5% (+53,439)
> Feb. 2018 unemployment: 2.9% (State: 3.4%)
> Largest driver of growth: Births

Source: Thinkstock
42. Tennessee
> Fastest-growing metropolitan area: Nashville-Davidson–Murfreesboro–Franklin
> 2010-2017 pop. growth: +13.6% (+227,288)
> 2010-2017 pop. growth, Tennessee: +5.7% (+360,102)
> Feb. 2018 unemployment: 2.7% (State: 3.4%)
> Largest driver of growth: Domestic migration
[in-text-ad]
Source: Thinkstock
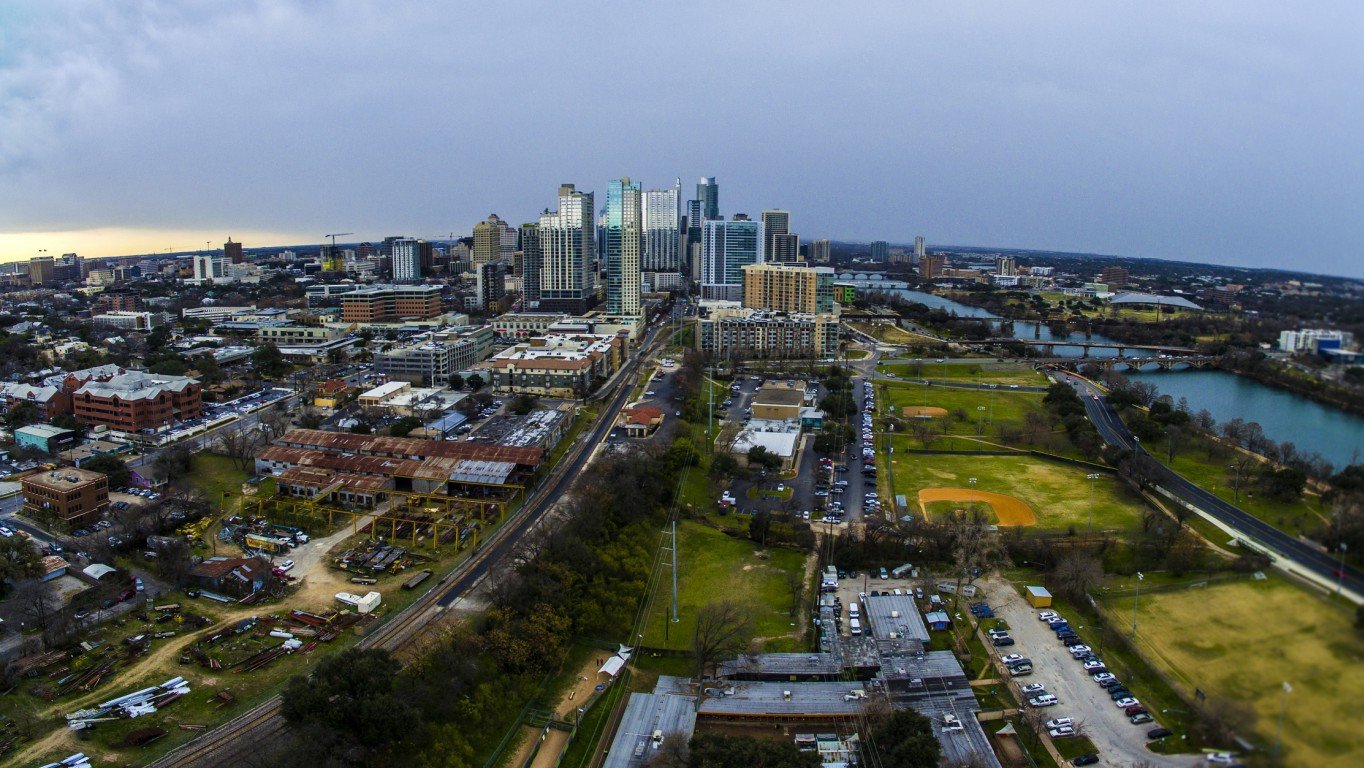
43. Texas
> Fastest-growing metropolitan area: Austin-Round Rock
> 2010-2017 pop. growth: +22.5% (+388,332)
> 2010-2017 pop. growth, Texas: +12.1% (+3,062,948)
> Feb. 2018 unemployment: 2.9% (State: 4.0%)
> Largest driver of growth: Domestic migration
Source: Thinkstock
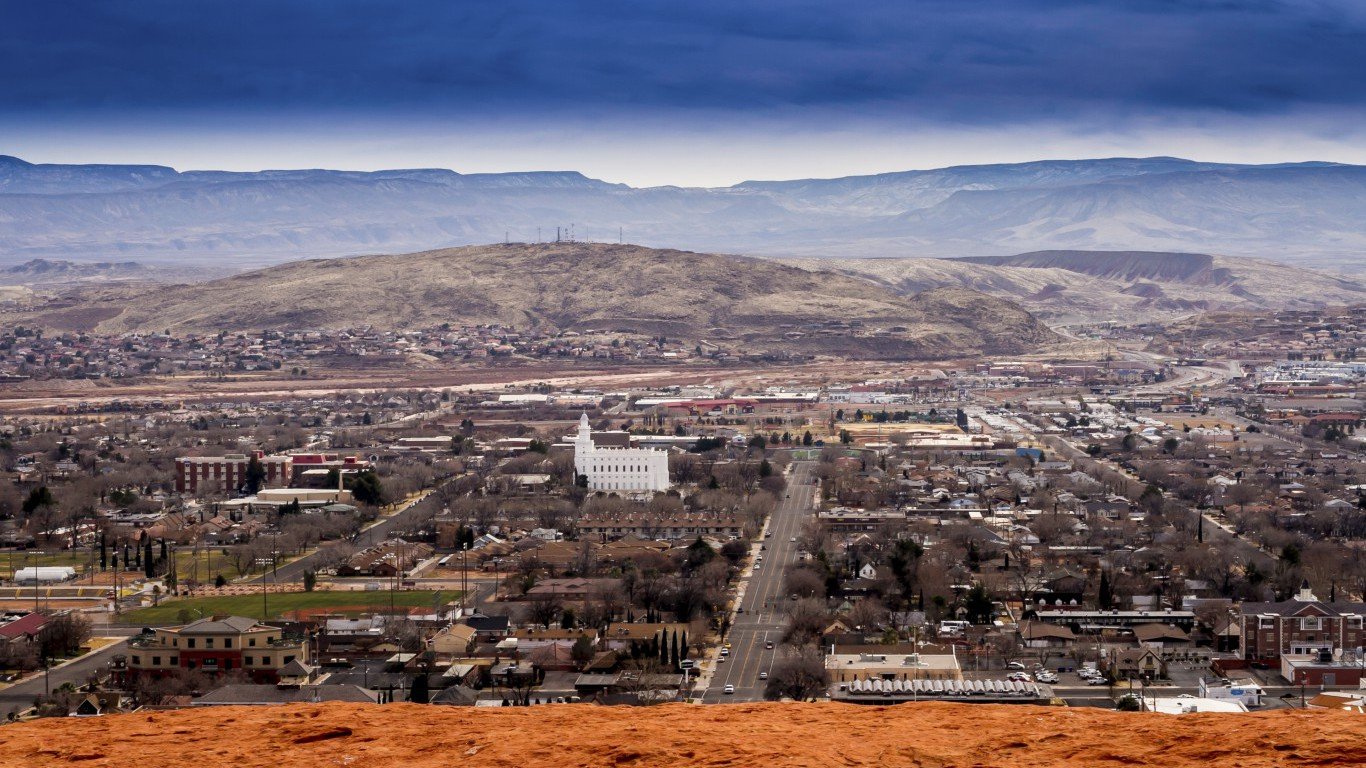
44. Utah
> Fastest-growing metropolitan area: St. George
> 2010-2017 pop. growth: +19.7% (+27,269)
> 2010-2017 pop. growth, Utah: +11.8% (+326,573)
> Feb. 2018 unemployment: 3.2% (State: 3.1%)
> Largest driver of growth: Domestic migration
Source: redjar / Flickr
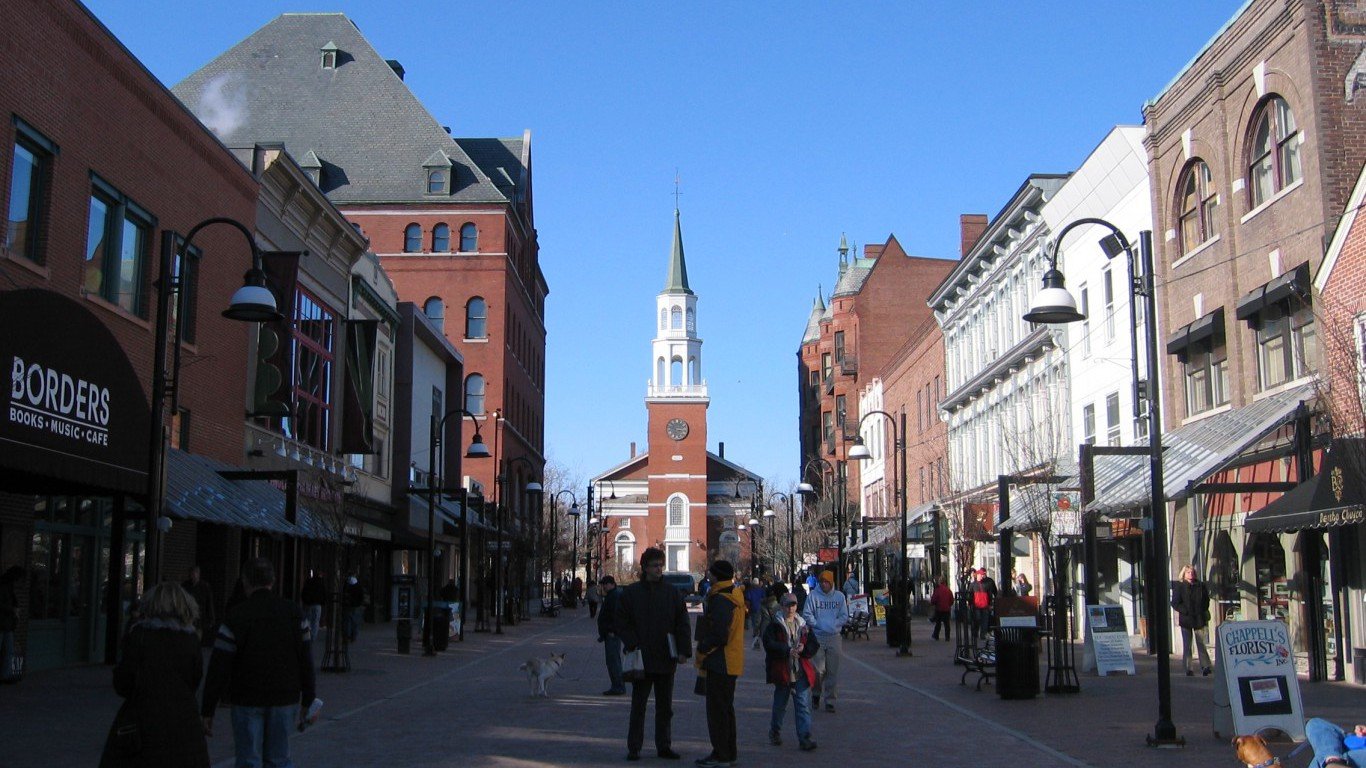
45. Vermont
> Fastest-growing metropolitan area: Burlington-South Burlington
> 2010-2017 pop. growth: +3.3% (+6,881)
> 2010-2017 pop. growth, Vermont: -0.3% (-2,185)
> Feb. 2018 unemployment: N/A (State: 2.8%)
> Largest driver of growth: Births
Source: Strawser / Wikimedia Commons
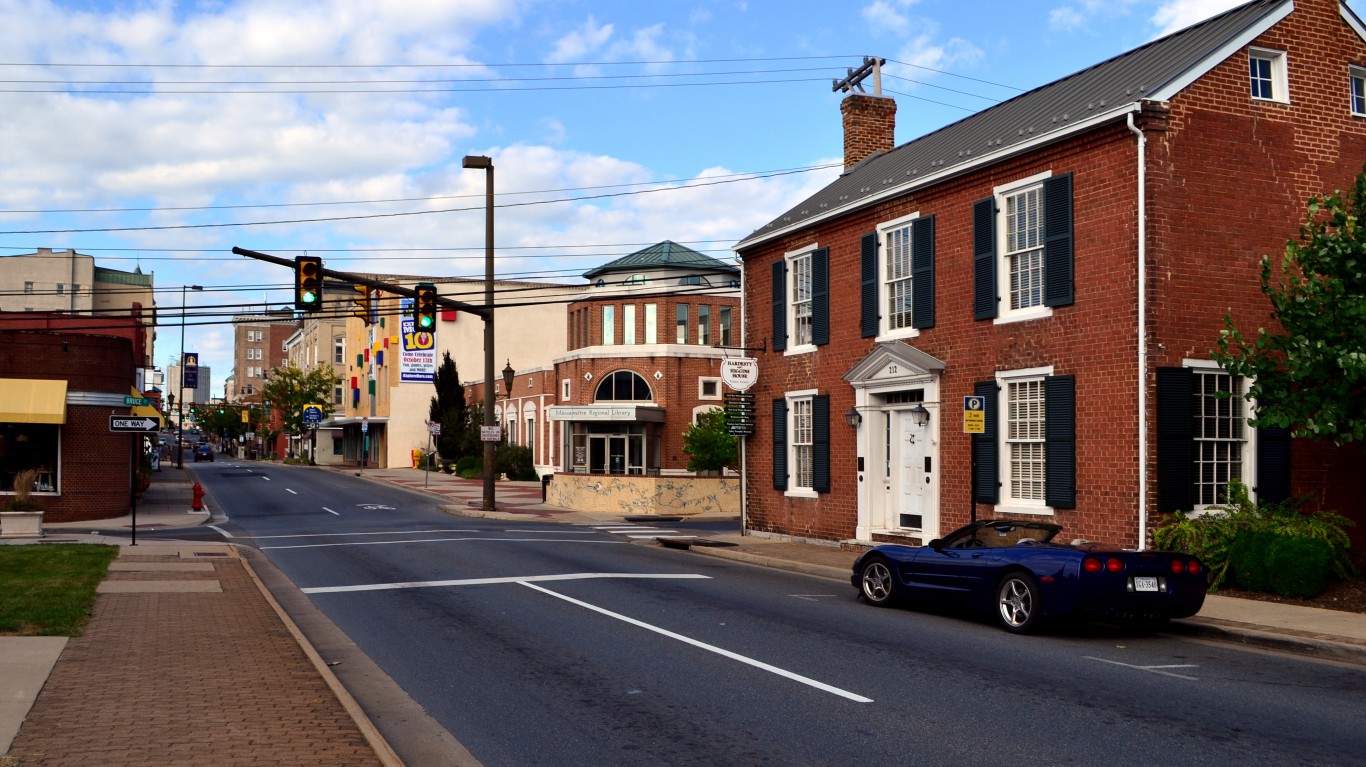
46. Virginia
> Fastest-growing metropolitan area: Harrisonburg
> 2010-2017 pop. growth: +7.2% (+9,026)
> 2010-2017 pop. growth, Virginia: +5.5% (+444,814)
> Feb. 2018 unemployment: 3.2% (State: 3.5%)
> Largest driver of growth: International migration
Source: Thinkstock
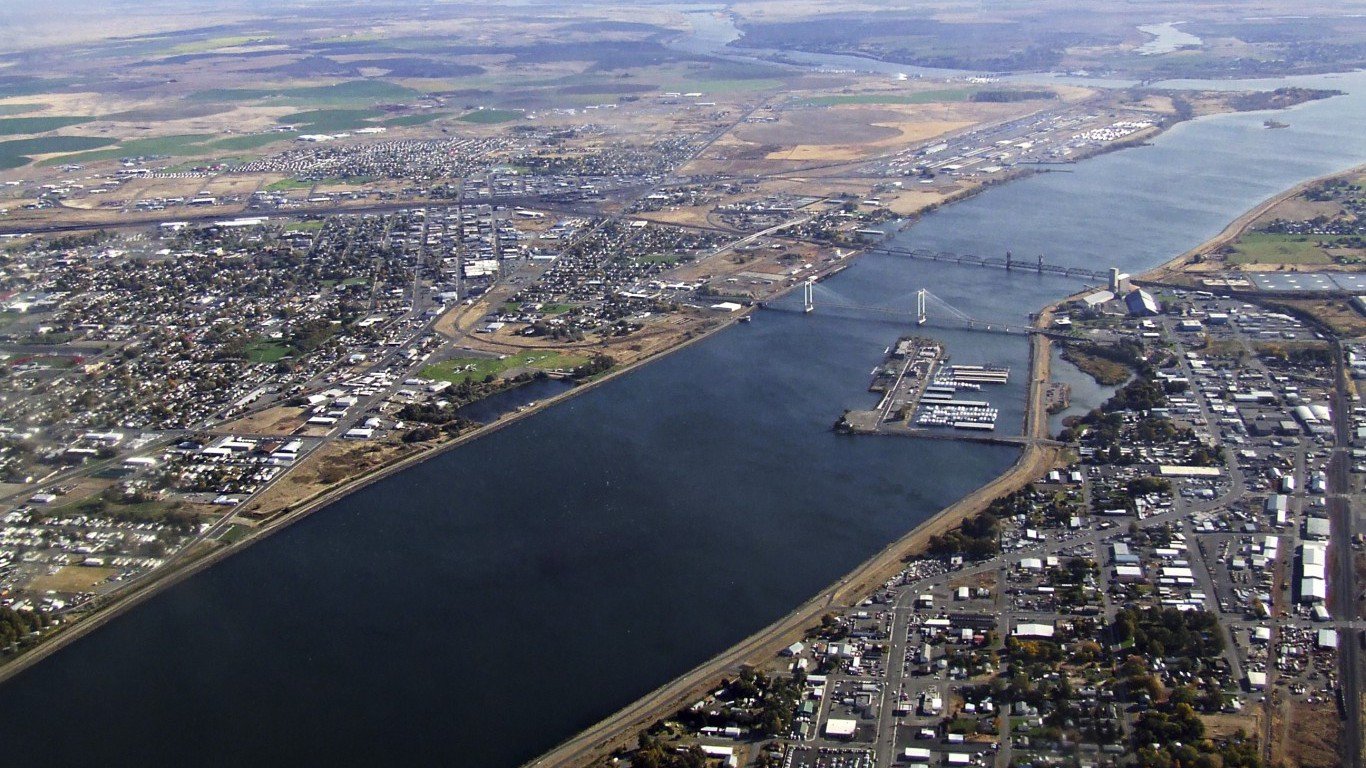
47. Washington
> Fastest-growing metropolitan area: Kennewick-Richland
> 2010-2017 pop. growth: +13.6% (+34,743)
> 2010-2017 pop. growth, Washington: +9.9% (+664,357)
> Feb. 2018 unemployment: 5.6% (State: 4.7%)
> Largest driver of growth: Births
[in-text-ad]
Source: Thinkstock
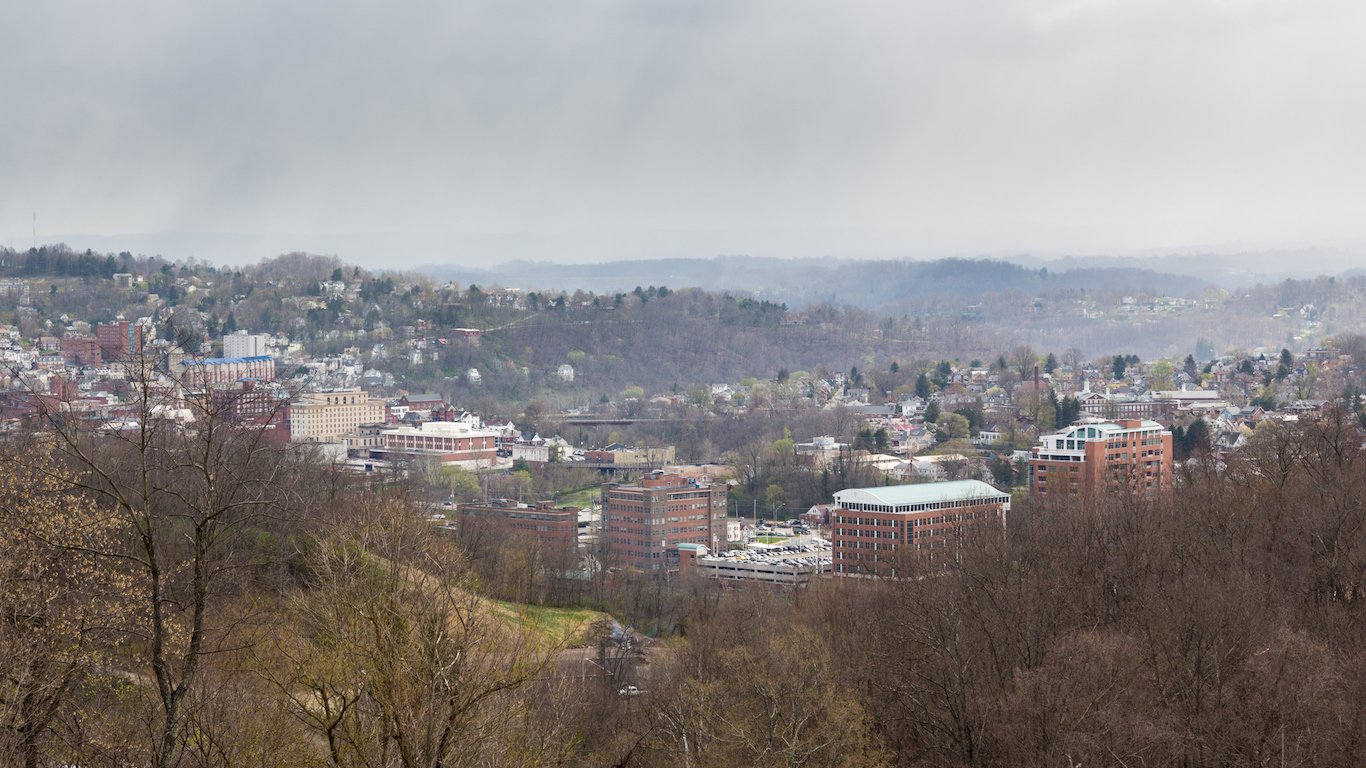
48. West Virginia
> Fastest-growing metropolitan area: Morgantown
> 2010-2017 pop. growth: +6.4% (+8,369)
> 2010-2017 pop. growth, West Virginia: -2.1% (-38,458)
> Feb. 2018 unemployment: 4.1% (State: 5.4%)
> Largest driver of growth: Domestic migration
Source: Thinkstock
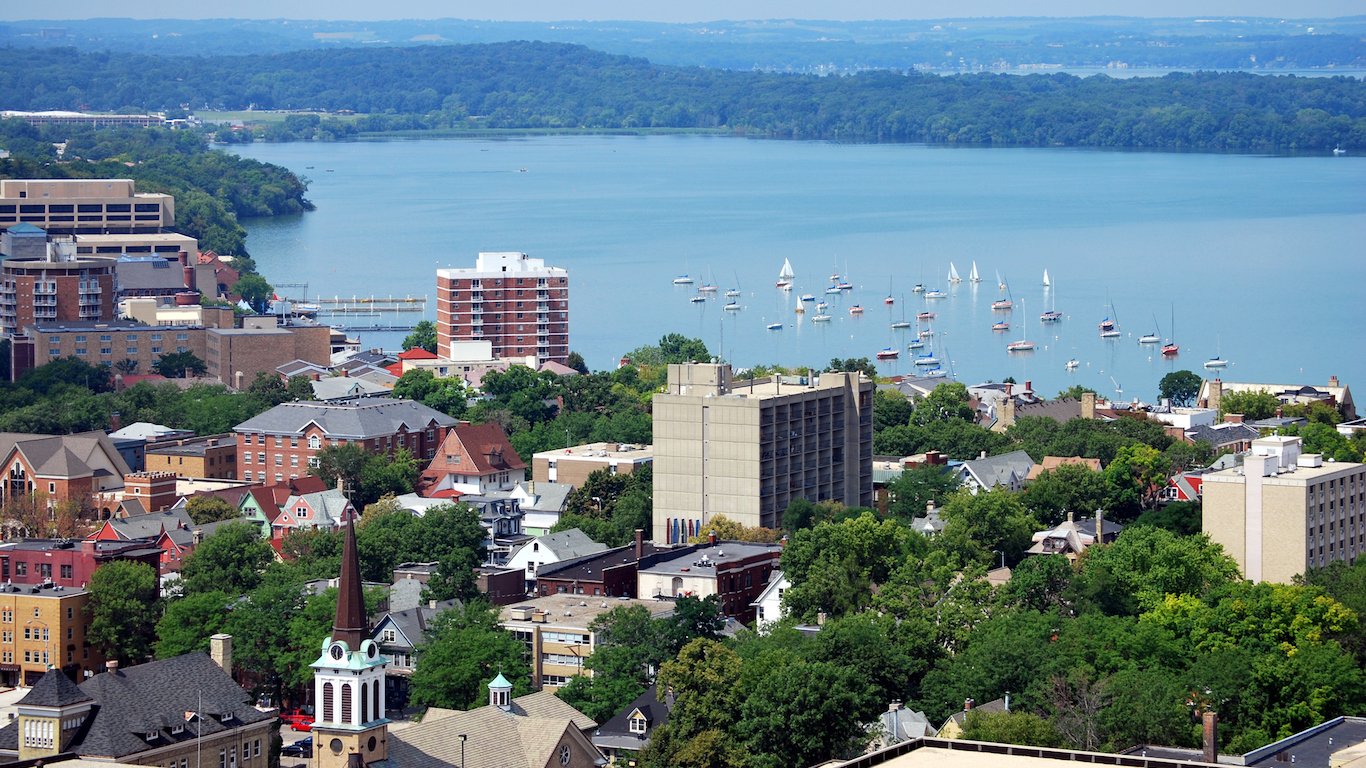
49. Wisconsin
> Fastest-growing metropolitan area: Madison
> 2010-2017 pop. growth: +7.9% (+47,652)
> 2010-2017 pop. growth, Wisconsin: +1.8% (+105,080)
> Feb. 2018 unemployment: 2.1% (State: 2.9%)
> Largest driver of growth: Births

Source: Thinkstock
50. Wyoming
> Fastest-growing metropolitan area: Cheyenne
> 2010-2017 pop. growth: +6.6% (+6,108)
> 2010-2017 pop. growth, Wyoming: +2.6% (+14,939)
> Feb. 2018 unemployment: 3.6% (State: 4.0%)
> Largest driver of growth: Births
Detailed Findings & Methodology
Domestic migration — Americans moving into the metropolitan area from other parts of the country — was the largest contributor to population growth 23 of the fastest growing cities in each state. Natural population growth — births minus deaths — was the driver in 16 cities, while international immigration contributed the most to growth in the remaining 11 cities. The metropolitan areas that grew the most tended to see the largest share of total growth come from domestic migrants.
While there are many reasons populations move to a given area, Frey noted that “…traditionally, jobs are the main reason places grow.” He added that amenities and the service sector can have an influence, it is jobs that tend to be the primary driver, citing the recent population surge in North Dakota that came as a result of the oil boom there.
Of the fast-growing cities on this list, only 10 have higher unemployment rates than the comparable statewide figures. Of those 50, 33 have seen employment increase by more than the national employment increase of 10% since 2010.
Finding a job is by no means the only reason for relocating to a new city. Americans may move to take care of a family member, move in with a new spouse, to find a more affordable housing market to buy their first home, or, like many of the residents in the fastest growing cities in America, to retire.
To determine the fastest growing city in each state, 24/7 Wall St. reviewed the population change between July 2010 and July 2017 in each state’s metro areas with data from the U.S. Census Bureau’s Population Estimates Program. The components of population growth — births, deaths, and international and domestic migration — were also from this report. Jobs added between 2010 and 2016 came from the Bureau of Labor Statistics’ Quarterly Census of Employment and Wages. February 2018 unemployment rates came from the Bureau of Labor Statistics’ Local Area Unemployment Statistics and are seasonally adjusted.
Take This Retirement Quiz To Get Matched With A Financial Advisor (Sponsored)
Take the quiz below to get matched with a financial advisor today.
Each advisor has been vetted by SmartAsset and is held to a fiduciary standard to act in your best interests.
Here’s how it works:
1. Answer SmartAsset advisor match quiz
2. Review your pre-screened matches at your leisure. Check out the
advisors’ profiles.
3. Speak with advisors at no cost to you. Have an introductory call on the phone or introduction in person and choose whom to work with in the future
Take the retirement quiz right here.
Thank you for reading! Have some feedback for us?
Contact the 24/7 Wall St. editorial team.
Editors' Picks

