Since the economic recovery began in 2010, the private sector has added 16 million jobs. At the same time, however, the number of public sector jobs has remained static. As a result, government employment as a share of total employment has declined from 17.3% to 15.2%, according to the latest Bureau of Labor Statistics figures.
Government employment across the country is far from evenly distributed. In some states, federal workers, as well as state and local government employees, account for anywhere between 12% and 25% of total employment.
While some might expect that high government spending would also entail substantial government employment, relative to the state’s workforce, the opposite tends to be true. Based on 2017 employment figures from the Bureau of Labor Statistics, 24/7 Wall St. ranked all 50 states based on federal, state, and local government employees as a share of total employment.
While states with government-friendly political environments, such as New York, Pennsylvania, and California, might spend more overall, they tend to have the fewest government jobs as a share of total state employment. Rather, sparsely-populated states, such as Wyoming, Alaska, and Montana, have relatively larger public sector workers.
Martin Kohli, chief regional economist at the Bureau of Labor Statistics, explained that the primary reason for this is that government services, particularly local government jobs, exist even in small towns. Such government services provide jobs even if there are no major sources of private sector jobs.
“Nationally, about one out of every 20 jobs in the country and about one out of every three government jobs is in local government education,” said Kohli. “If a small town in Wyoming wants to have a school, that school is going to be a significant share of local employment,” Kohli added.
Click here to see the states where the most people work for the government.
Click here to see our detailed findings and methodology.
Source: Thinkstock
50. Pennsylvania
> Gov’t. employees, 2017: 11.8% of workforce
> Gov’t. employment change, 2007-2017 -6.9% (754,800 to 703,000)
> State gov’t. spending per capita: $6,957 (24th most)
> Population density: 283.9 per sq. mi. (9th highest)
[in-text-ad]
Source: Thinkstock
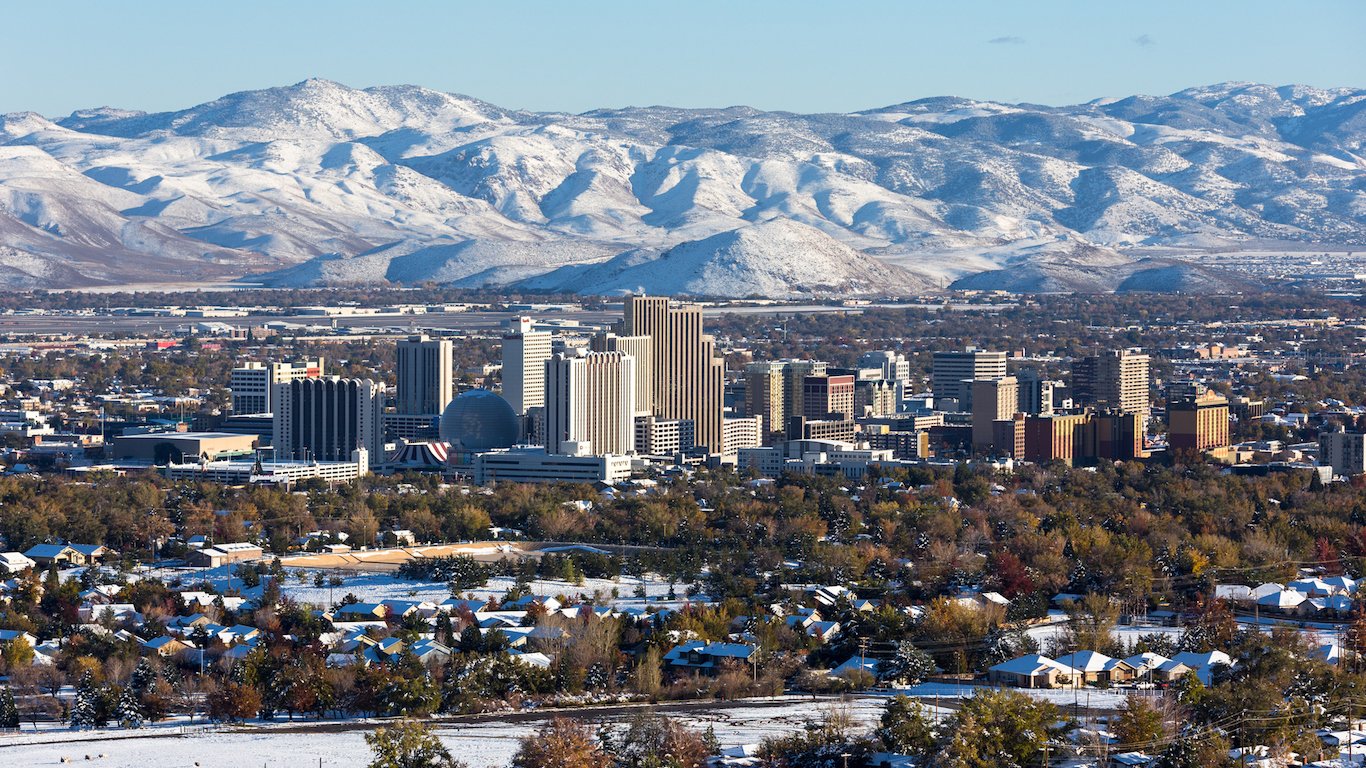
49. Nevada
> Gov’t. employees, 2017: 12.0% of workforce
> Gov’t. employment change, 2007-2017 +3.5% (156,000 to 161,400)
> State gov’t. spending per capita: $5,007 (5th least)
> Population density: 24.6 per sq. mi. (9th lowest)
Source: Thinkstock
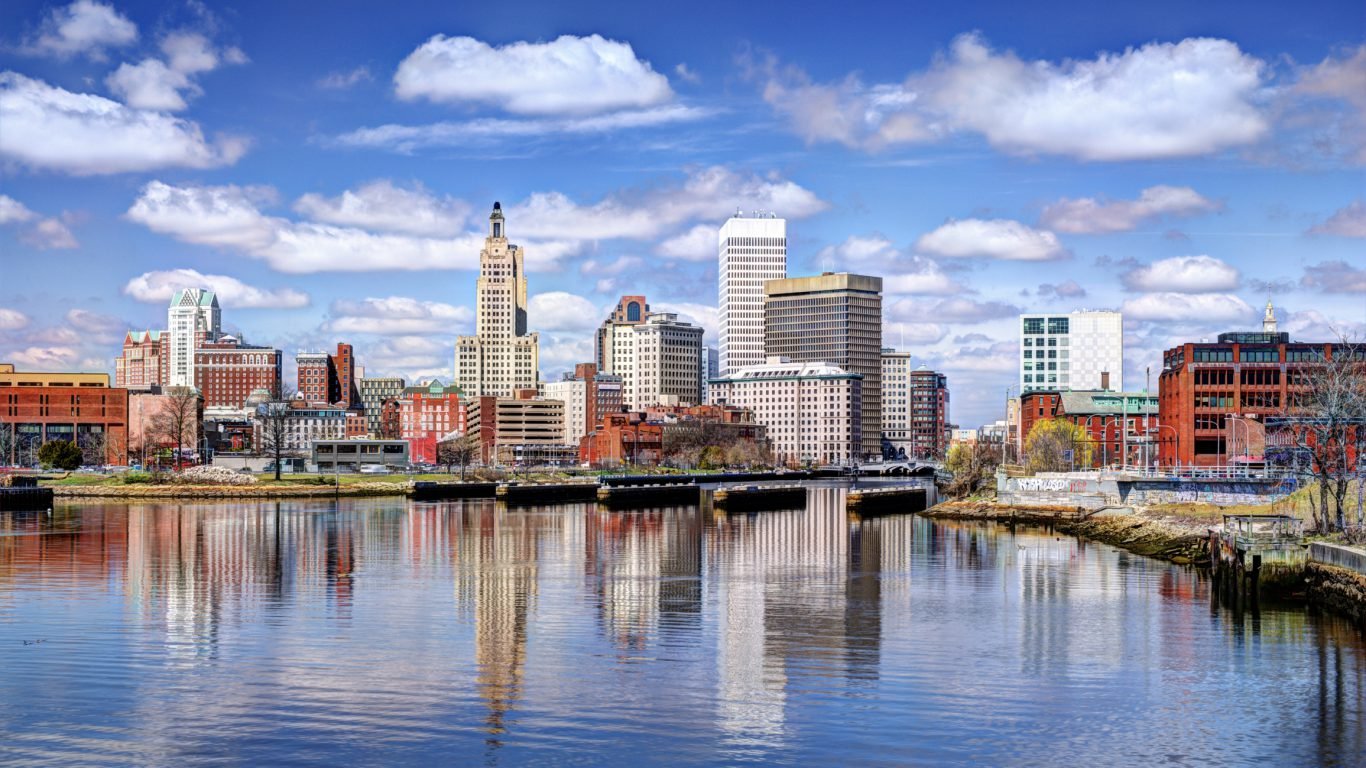
48. Rhode Island
> Gov’t. employees, 2017: 12.3% of workforce
> Gov’t. employment change, 2007-2017 -5.9% (64,400 to 60,600)
> State gov’t. spending per capita: $8,120 (12th most)
> Population density: 1018.1 per sq. mi. (2nd highest)
Source: Thinkstock
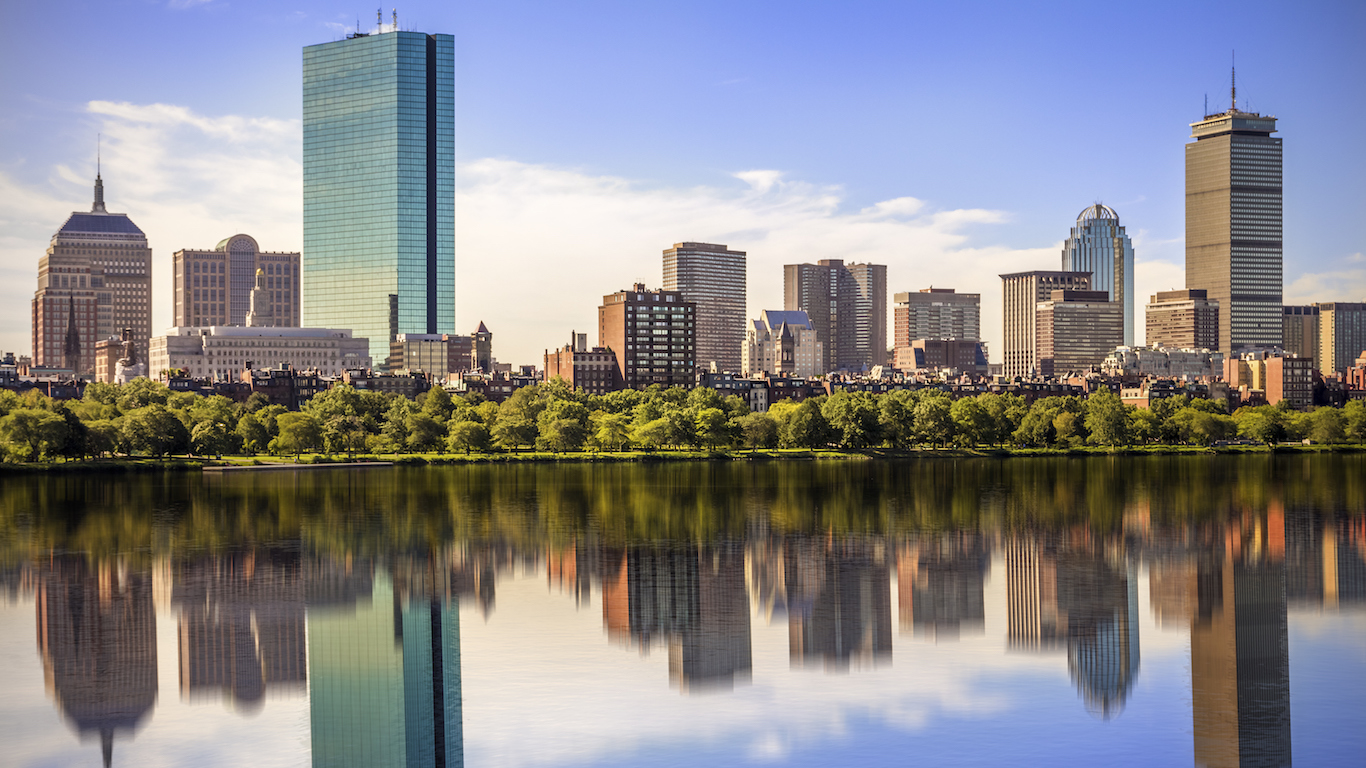
47. Massachusetts
> Gov’t. employees, 2017: 12.5% of workforce
> Gov’t. employment change, 2007-2017 +4.6% (432,700 to 452,600)
> State gov’t. spending per capita: $9,011 (8th most)
> Population density: 839.4 per sq. mi. (3rd highest)
[in-text-ad-2]
Source: Thinkstock
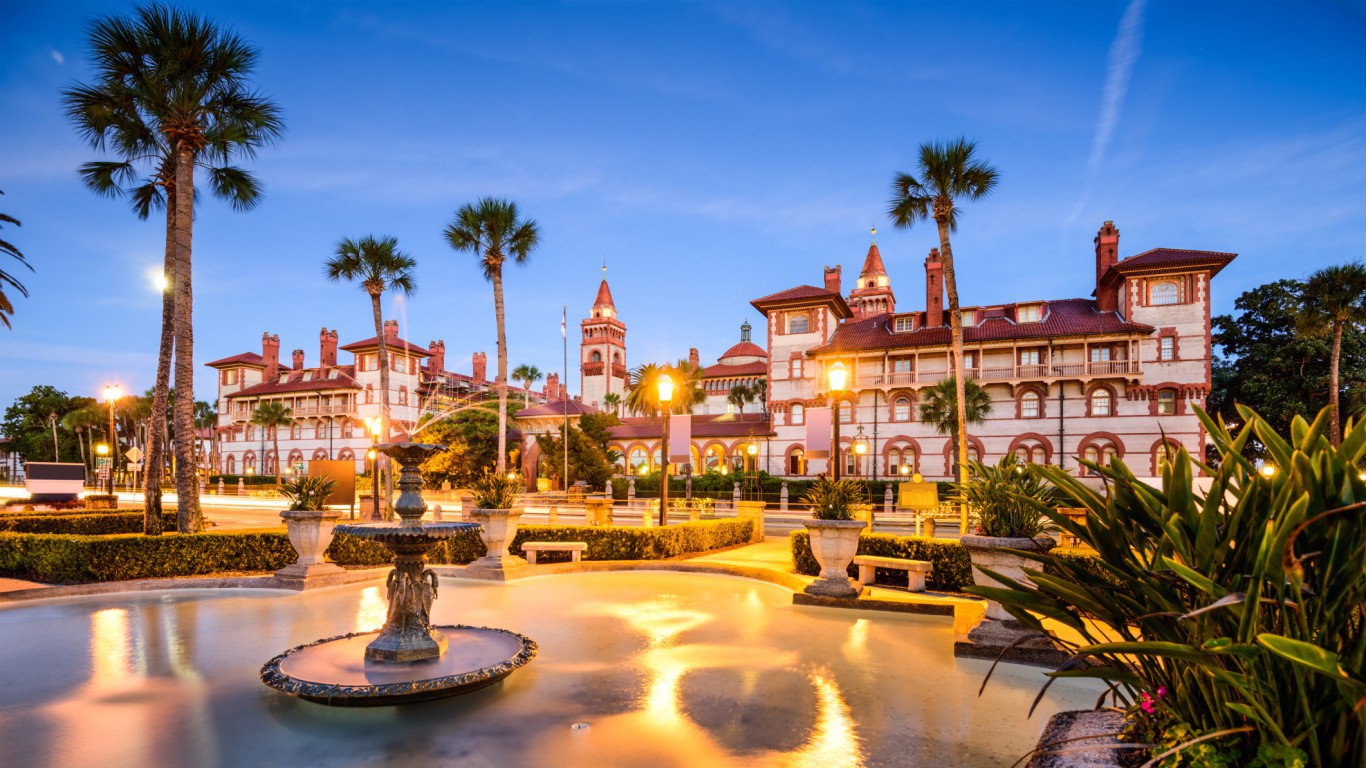
46. Florida
> Gov’t. employees, 2017: 12.9% of workforce
> Gov’t. employment change, 2007-2017 -1.4% (1,122,600 to 1,106,600)
> State gov’t. spending per capita: $4,186 (the least)
> Population density: 350.6 per sq. mi. (8th highest)
Source: Thinkstock
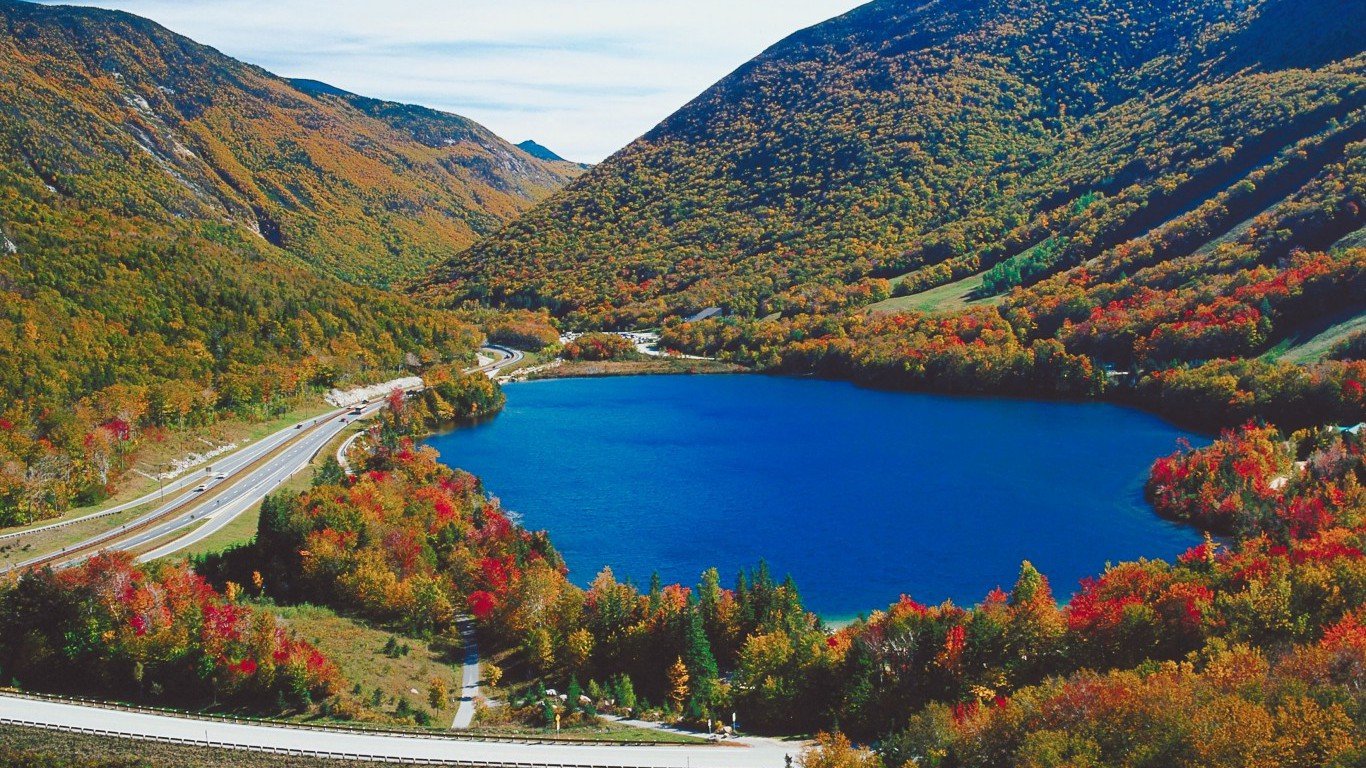
45. New Hampshire
> Gov’t. employees, 2017: 13.3% of workforce
> Gov’t. employment change, 2007-2017 -3.5% (93,300 to 90,000)
> State gov’t. spending per capita: $5,303 (10th least)
> Population density: 147.0 per sq. mi. (21st highest)
[in-text-ad]
Source: Thinkstock
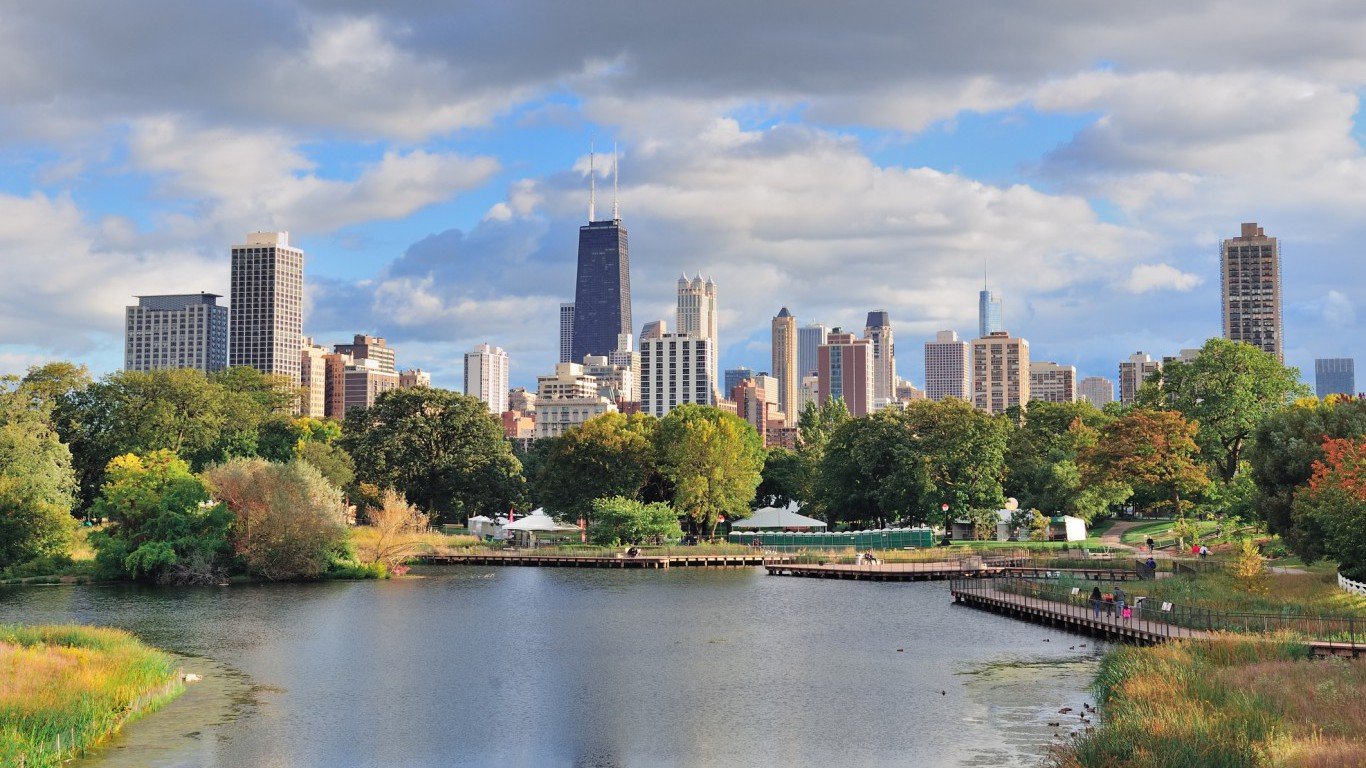
44. Illinois
> Gov’t. employees, 2017: 13.7% of workforce
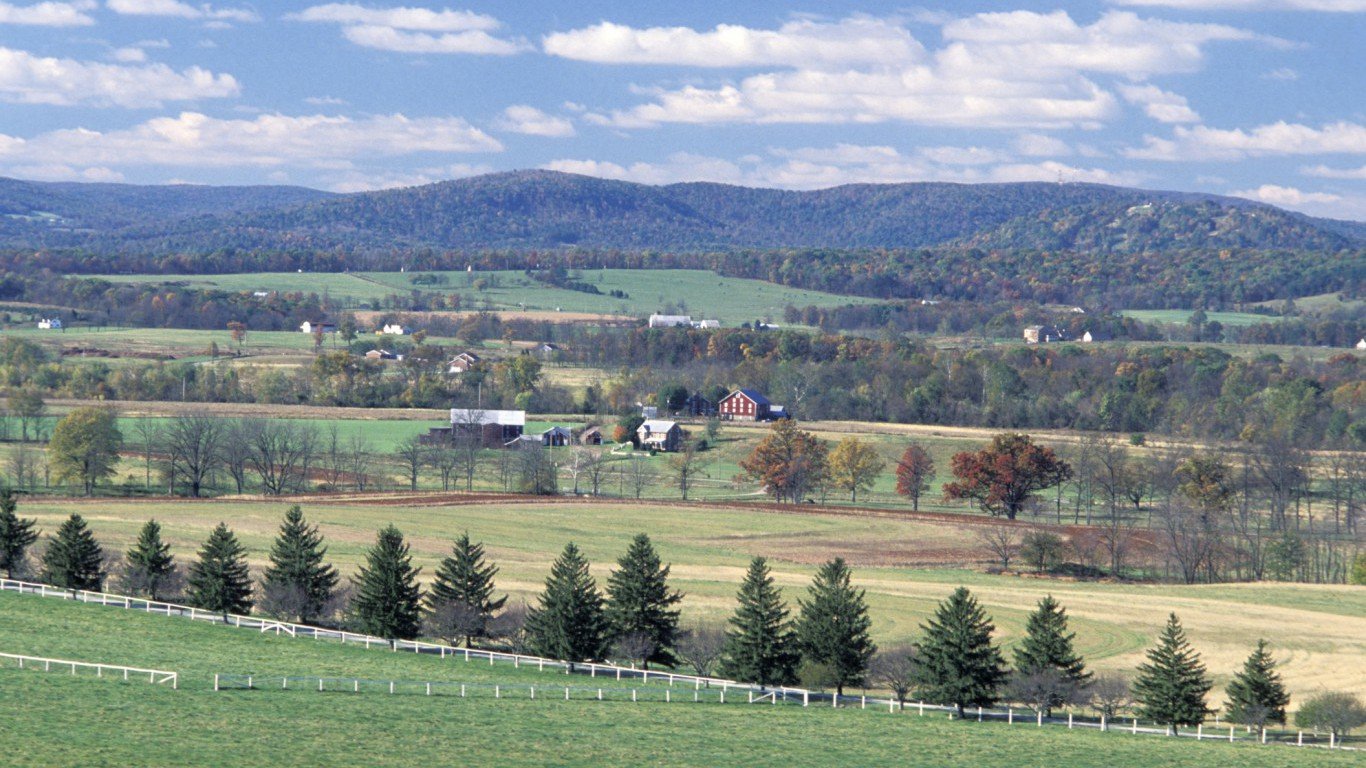
> Gov’t. employment change, 2007-2017 -2.1% (849,300 to 831,100)
> State gov’t. spending per capita: $6,429 (21st least)
> Population density: 231.1 per sq. mi. (12th highest)
 24/7 Wall St.
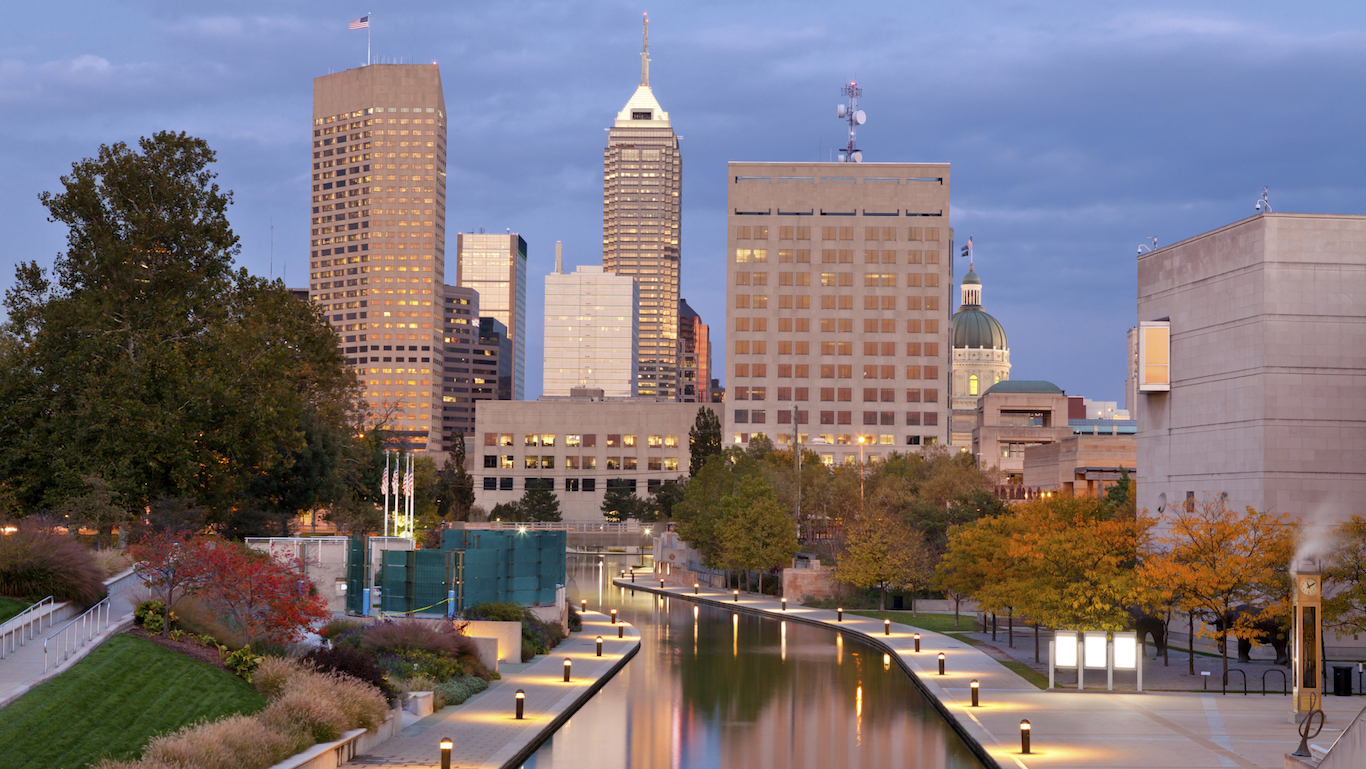
Source: Thinkstock
43. Indiana
> Gov’t. employees, 2017: 13.7% of workforce
> Gov’t. employment change, 2007-2017 -1.1% (431,100 to 426,500)
> State gov’t. spending per capita: $5,651 (13th least)
> Population density: 181.0 per sq. mi. (16th highest)
Source: TheCrimsonRibbon / iStock
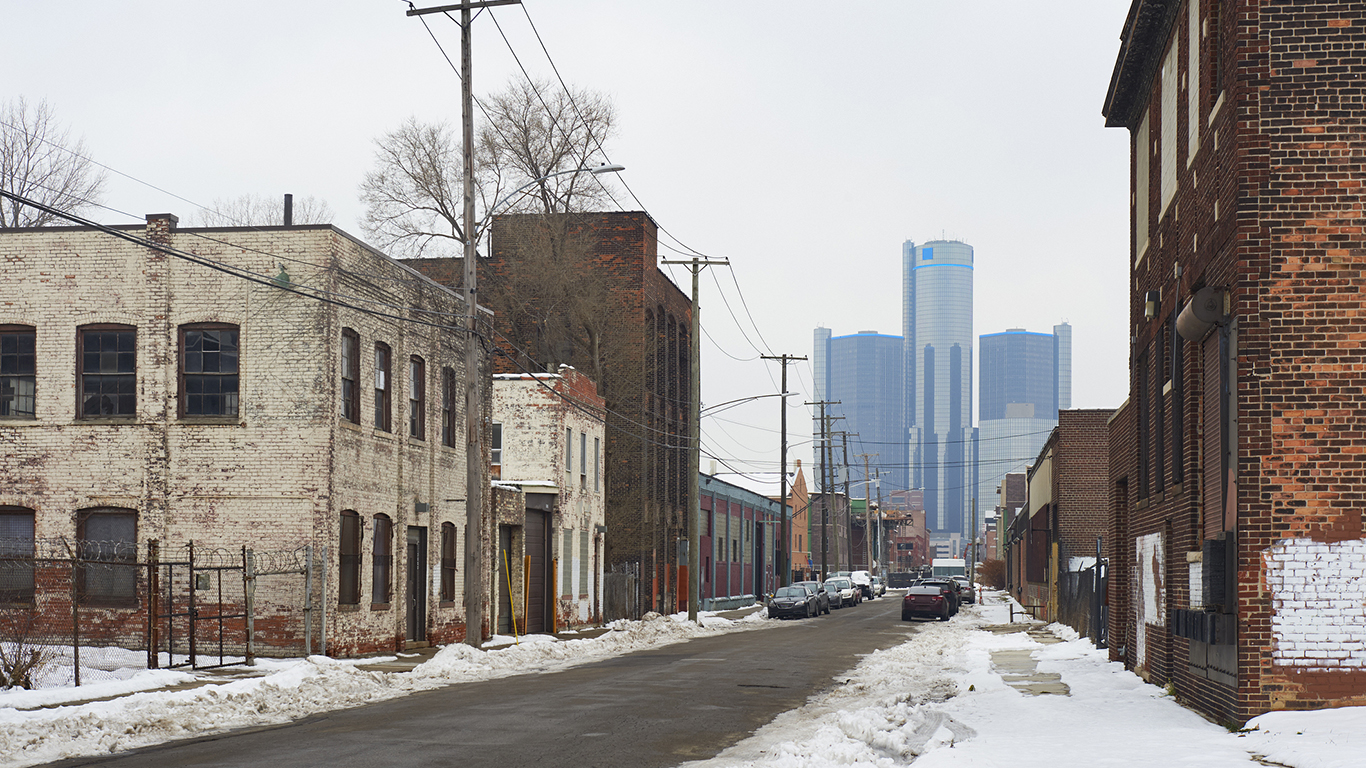
42. Michigan
> Gov’t. employees, 2017: 13.8% of workforce
> Gov’t. employment change, 2007-2017 -7.9% (655,700 to 604,000)
> State gov’t. spending per capita: $6,815 (25th least)
> Population density: 174.8 per sq. mi. (17th highest)
[in-text-ad-2]
Source: Thinkstock
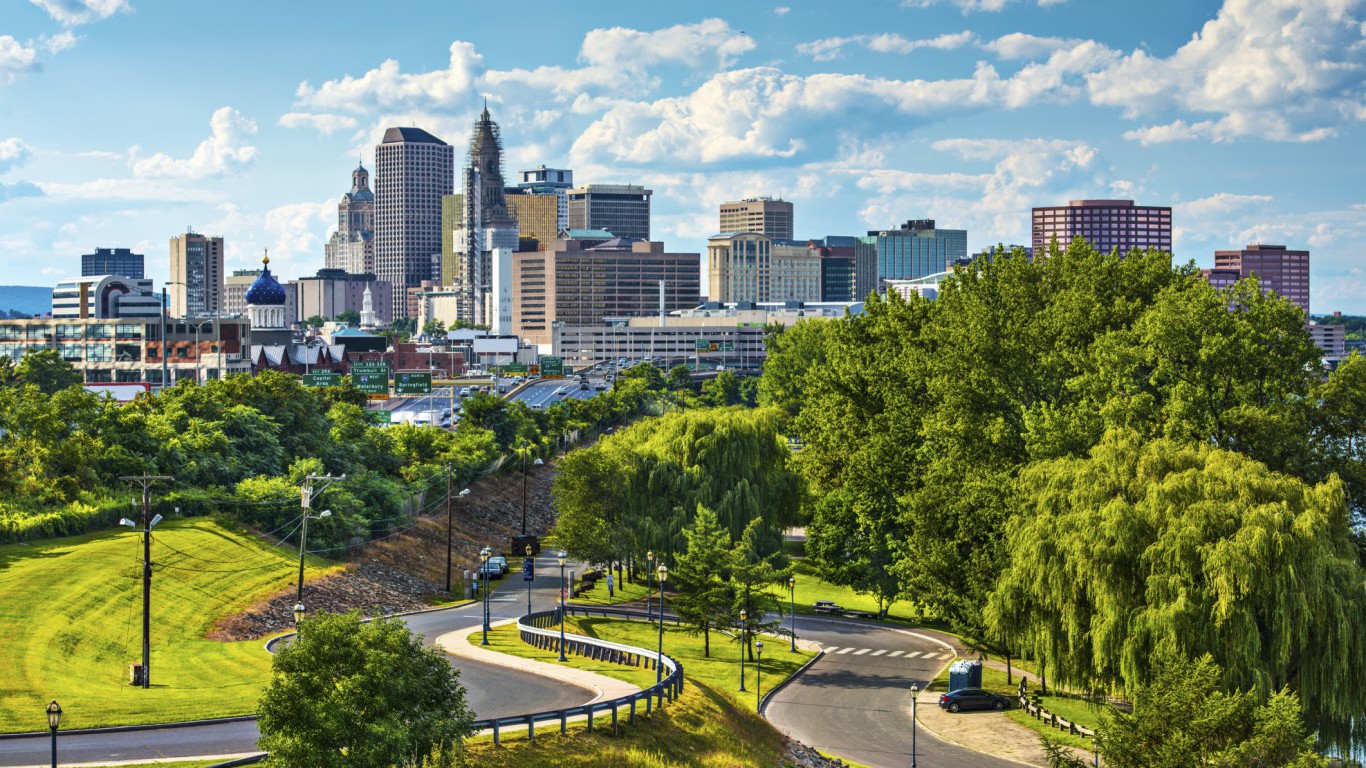
41. Connecticut
> Gov’t. employees, 2017: 13.8% of workforce
> Gov’t. employment change, 2007-2017 -7.6% (251,600 to 232,400)
> State gov’t. spending per capita: $8,637 (10th most)
> Population density: 738.1 per sq. mi. (4th highest)
Source: jongela19 / Flickr
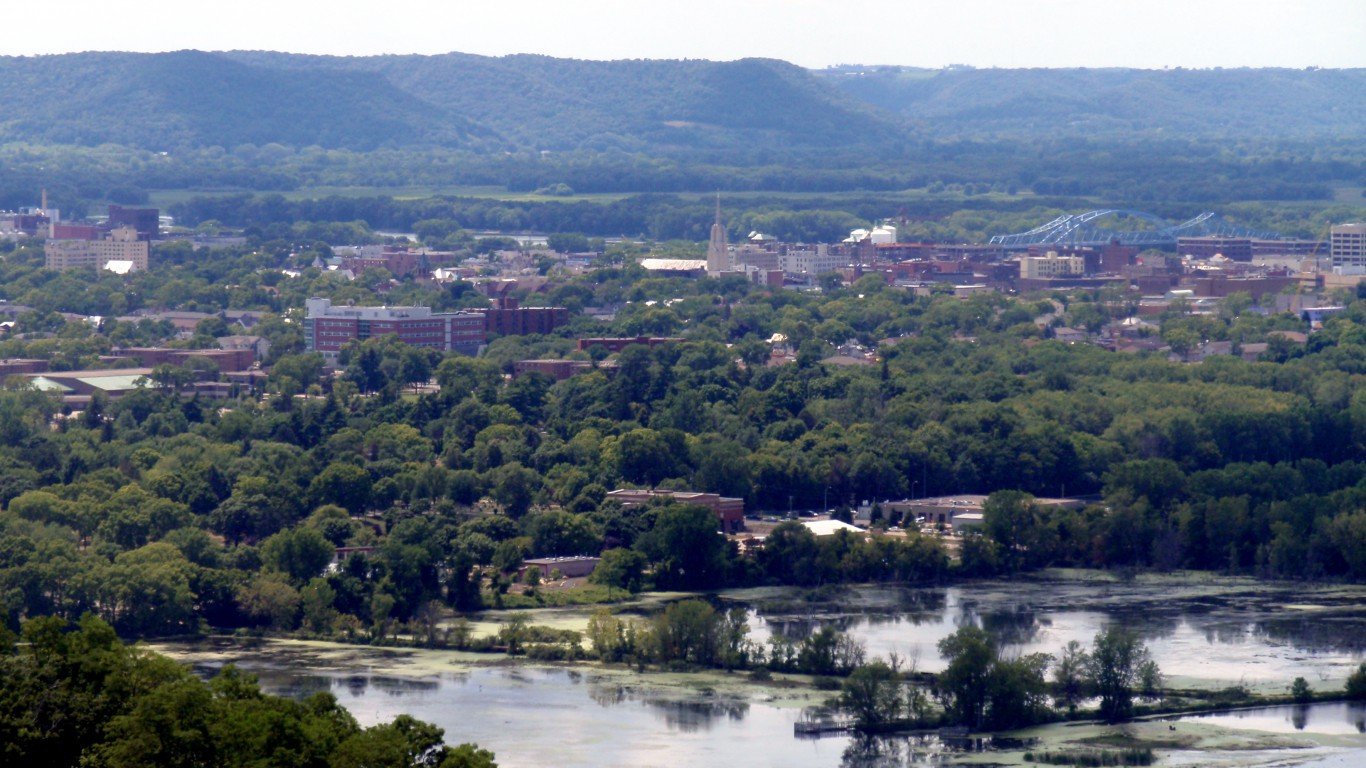
40. Wisconsin
> Gov’t. employees, 2017: 13.8% of workforce
> Gov’t. employment change, 2007-2017 -2.0% (416,000 to 407,600)
> State gov’t. spending per capita: $6,884 (25th most)
> Population density: 105.0 per sq. mi. (23rd highest)
[in-text-ad]
Source: Thinkstock
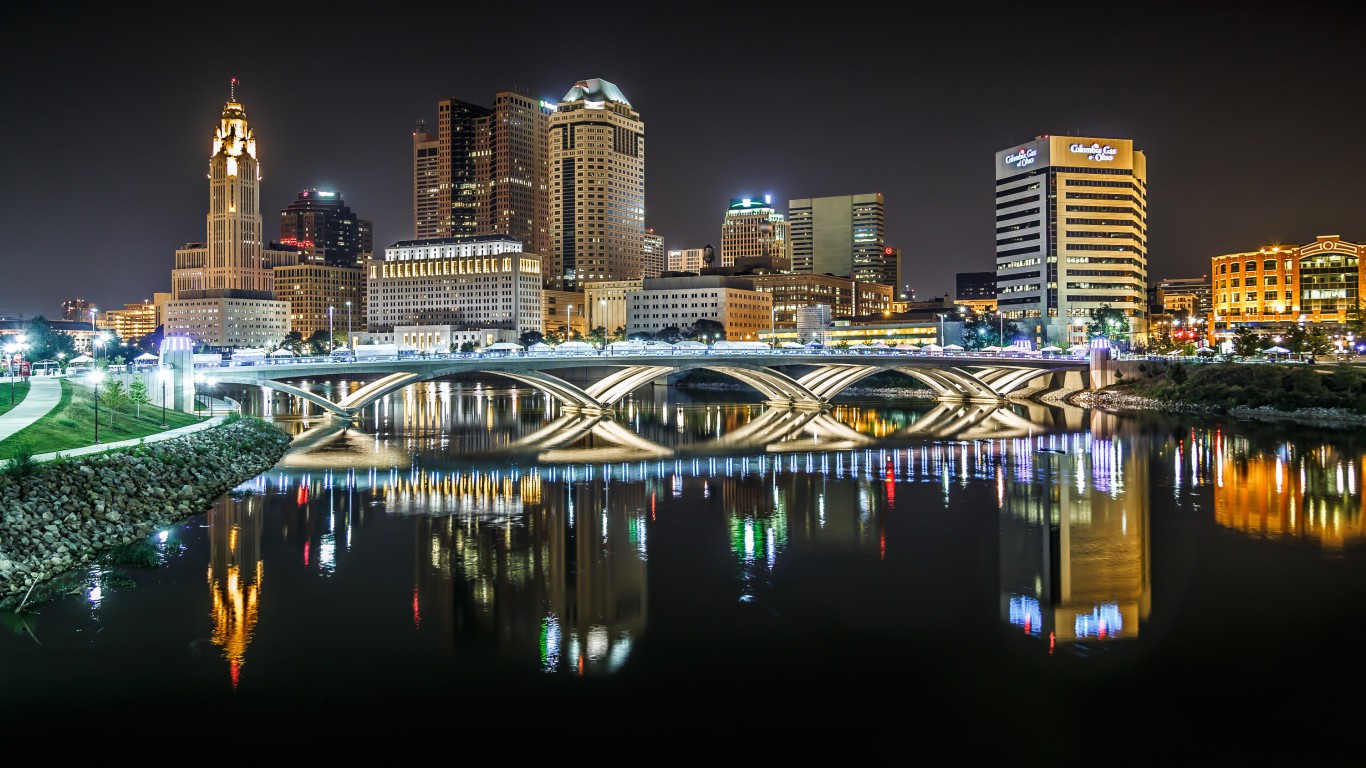
39. Ohio
> Gov’t. employees, 2017: 14.2% of workforce
> Gov’t. employment change, 2007-2017 -1.9% (797,700 to 782,200)
> State gov’t. spending per capita: $6,803 (24th least)
> Population density: 282.3 per sq. mi. (10th highest)
 24/7 Wall St.
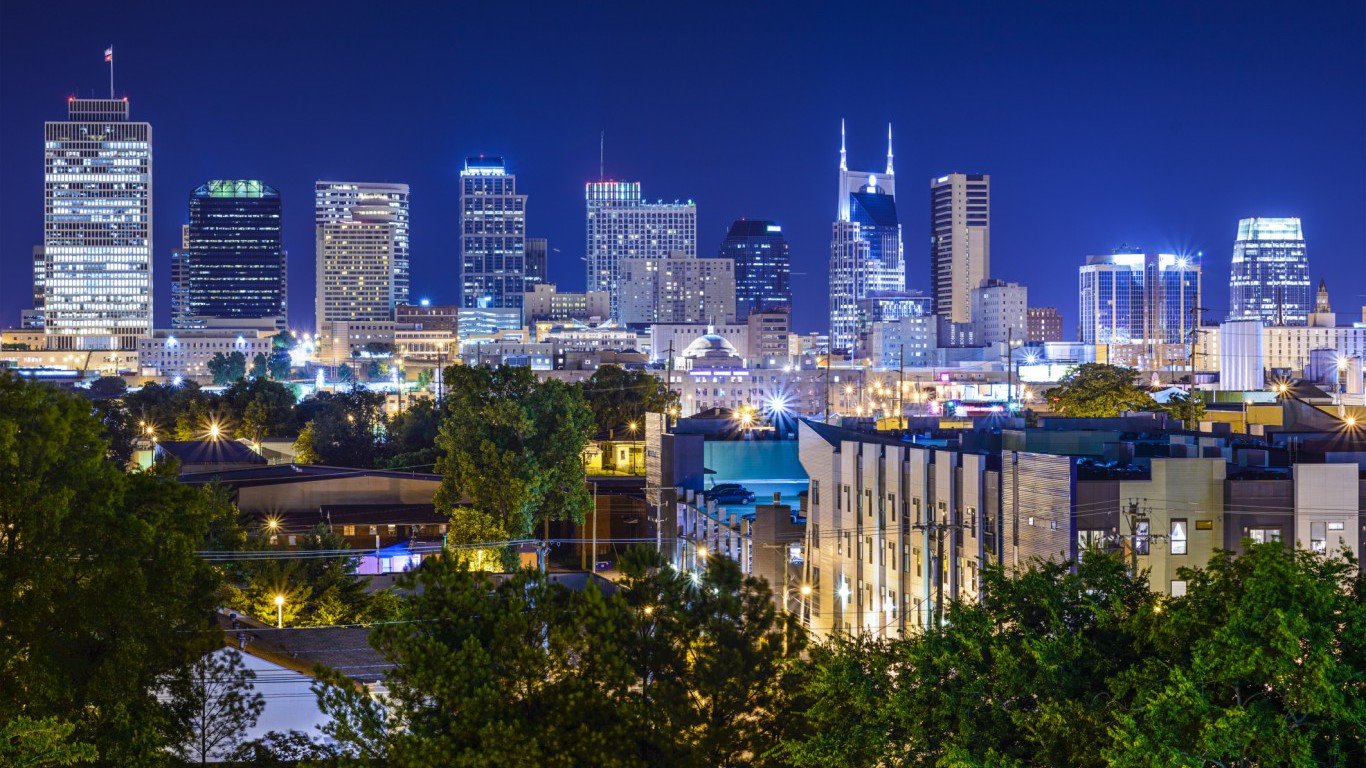
Source: Thinkstock
38. Tennessee
> Gov’t. employees, 2017: 14.3% of workforce
> Gov’t. employment change, 2007-2017 +2.8% (418,500 to 430,100)
> State gov’t. spending per capita: $4,703 (3rd least)
> Population density: 153.9 per sq. mi. (19th highest)
Source: Thinkstock
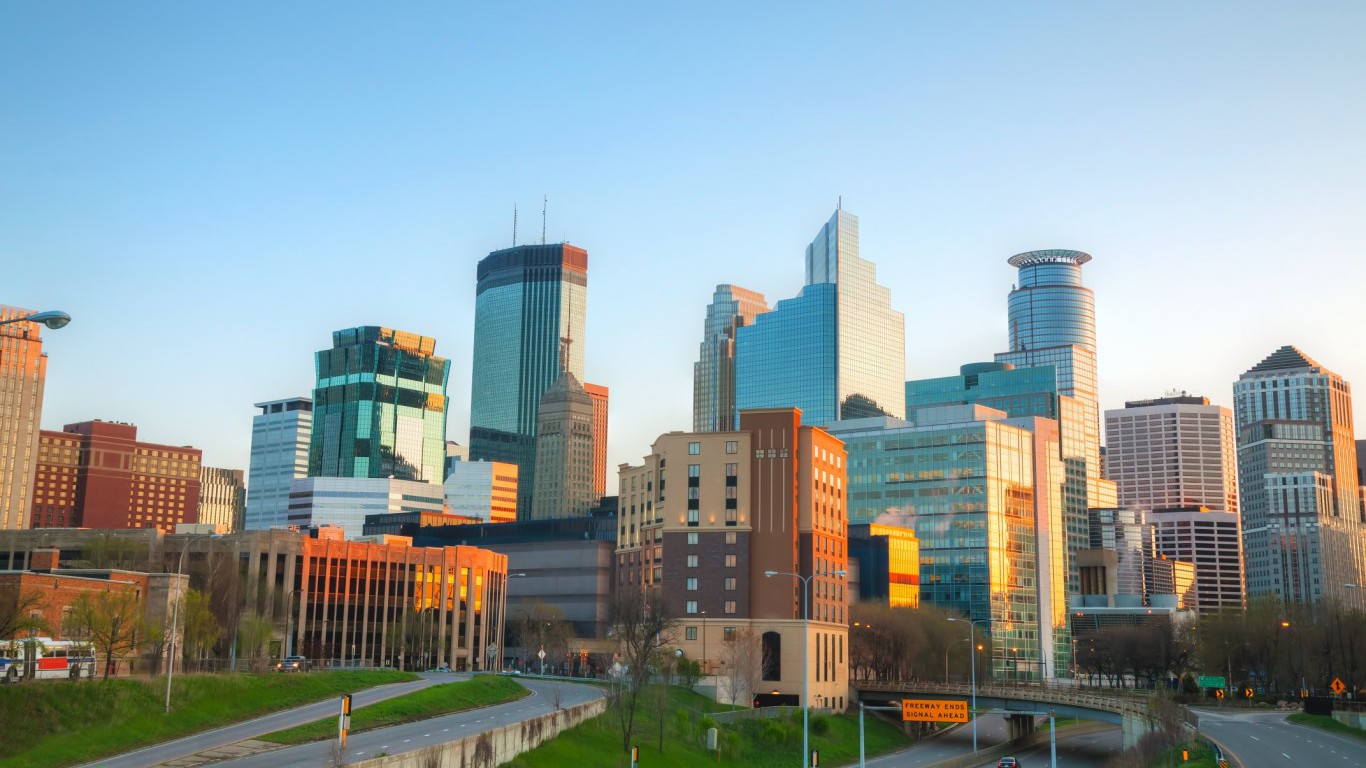
37. Minnesota
> Gov’t. employees, 2017: 14.5% of workforce
> Gov’t. employment change, 2007-2017 +2.3% (414,600 to 424,200)
> State gov’t. spending per capita: $7,832 (14th most)
> Population density: 66.6 per sq. mi. (20th lowest)
[in-text-ad-2]
Source: Thinkstock
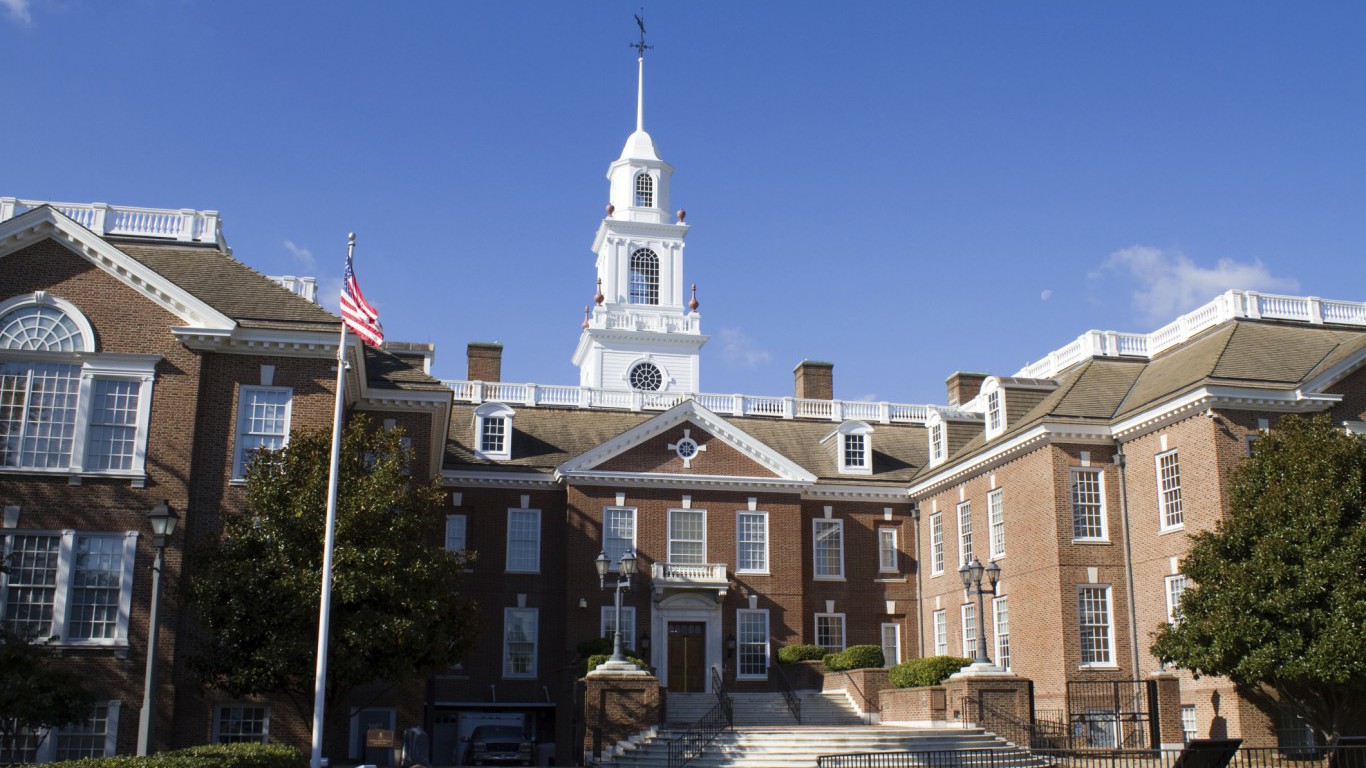
36. Delaware
> Gov’t. employees, 2017: 14.5% of workforce
> Gov’t. employment change, 2007-2017 +6.8% (62,000 to 66,200)
> State gov’t. spending per capita: $9,448 (6th most)
> Population density: 460.8 per sq. mi. (6th highest)
Source: Thinkstock
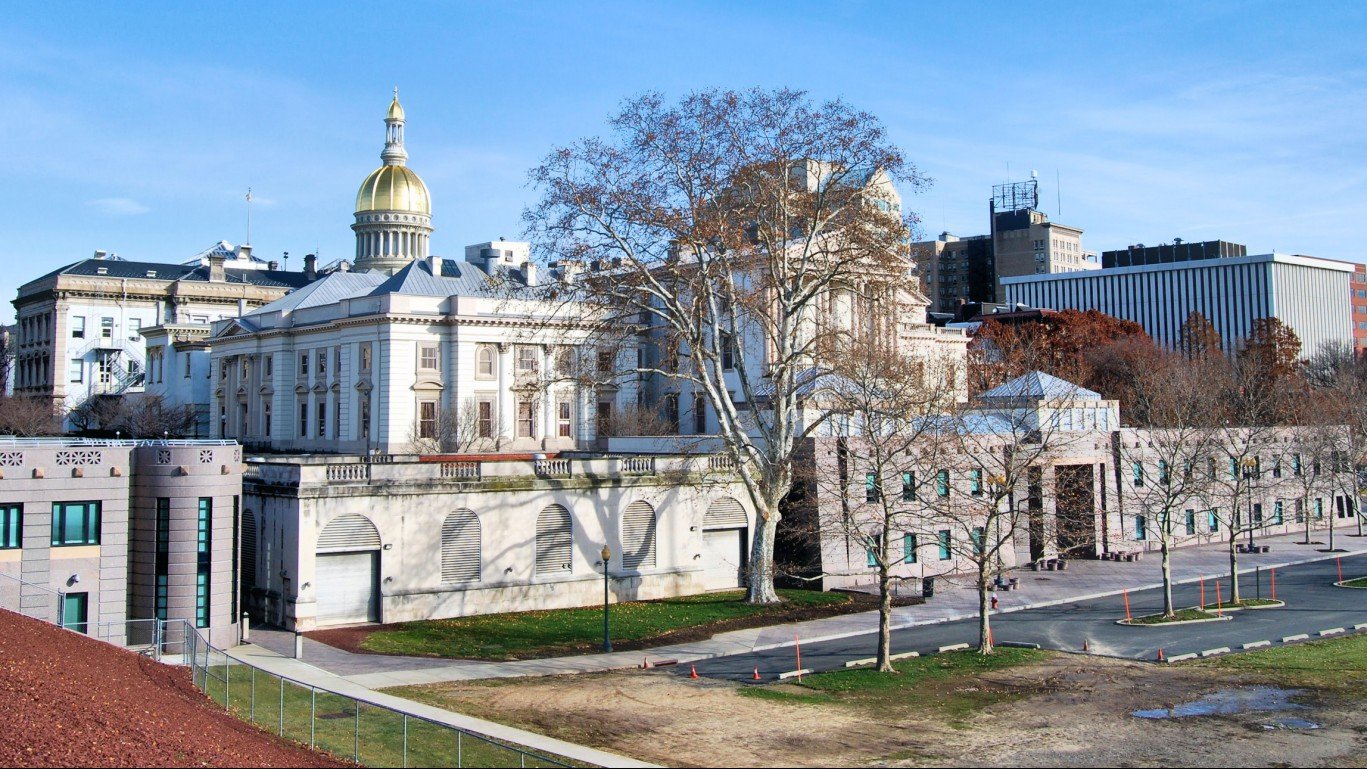
35. New Jersey
> Gov’t. employees, 2017: 14.9% of workforce
> Gov’t. employment change, 2007-2017 -5.4% (650,100 to 614,900)
> State gov’t. spending per capita: $7,986 (13th most)
> Population density: 1195.5 per sq. mi. (the highest)
[in-text-ad]
Source: Thinkstock
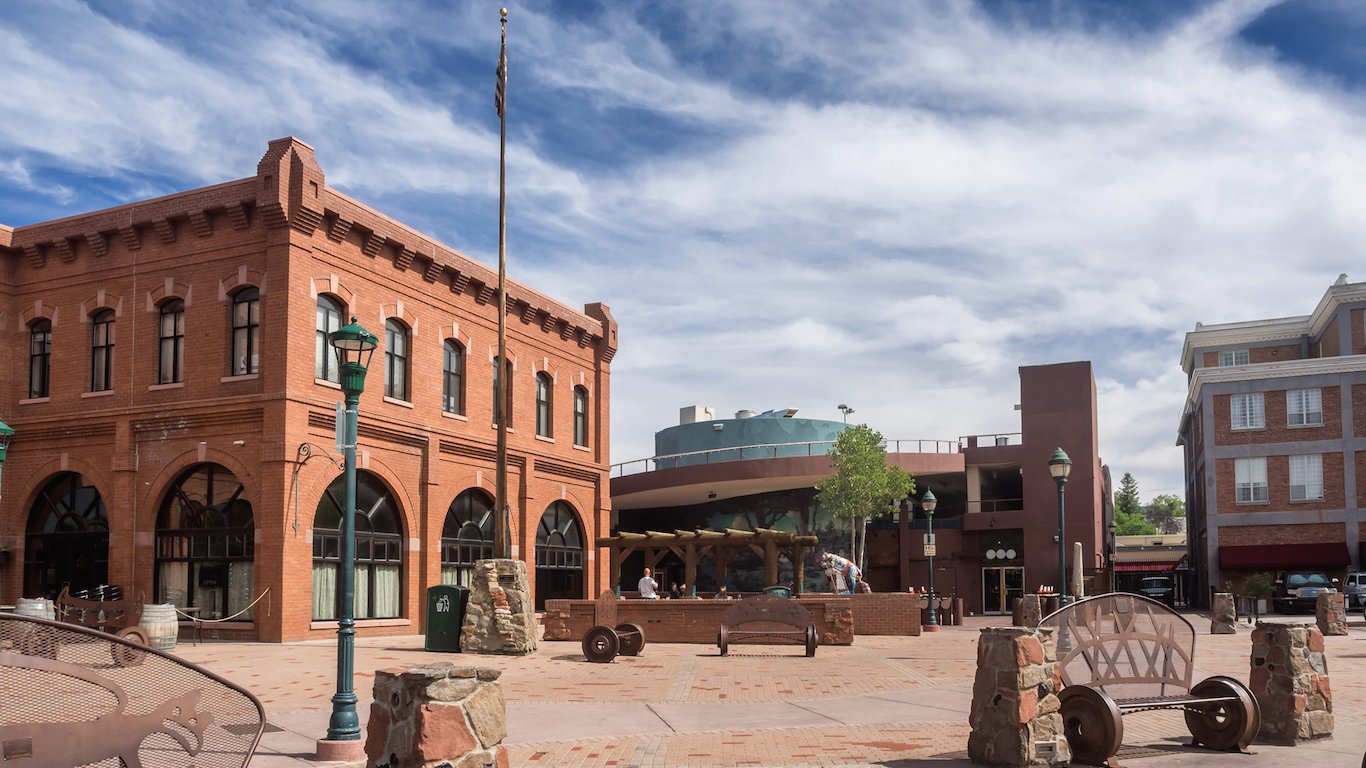
34. Arizona
> Gov’t. employees, 2017: 14.9% of workforce
> Gov’t. employment change, 2007-2017 -1.8% (421,000 to 413,300)
> State gov’t. spending per capita: $5,098 (6th least)
> Population density: 56.3 per sq. mi. (18th lowest)
Source: Thinkstock
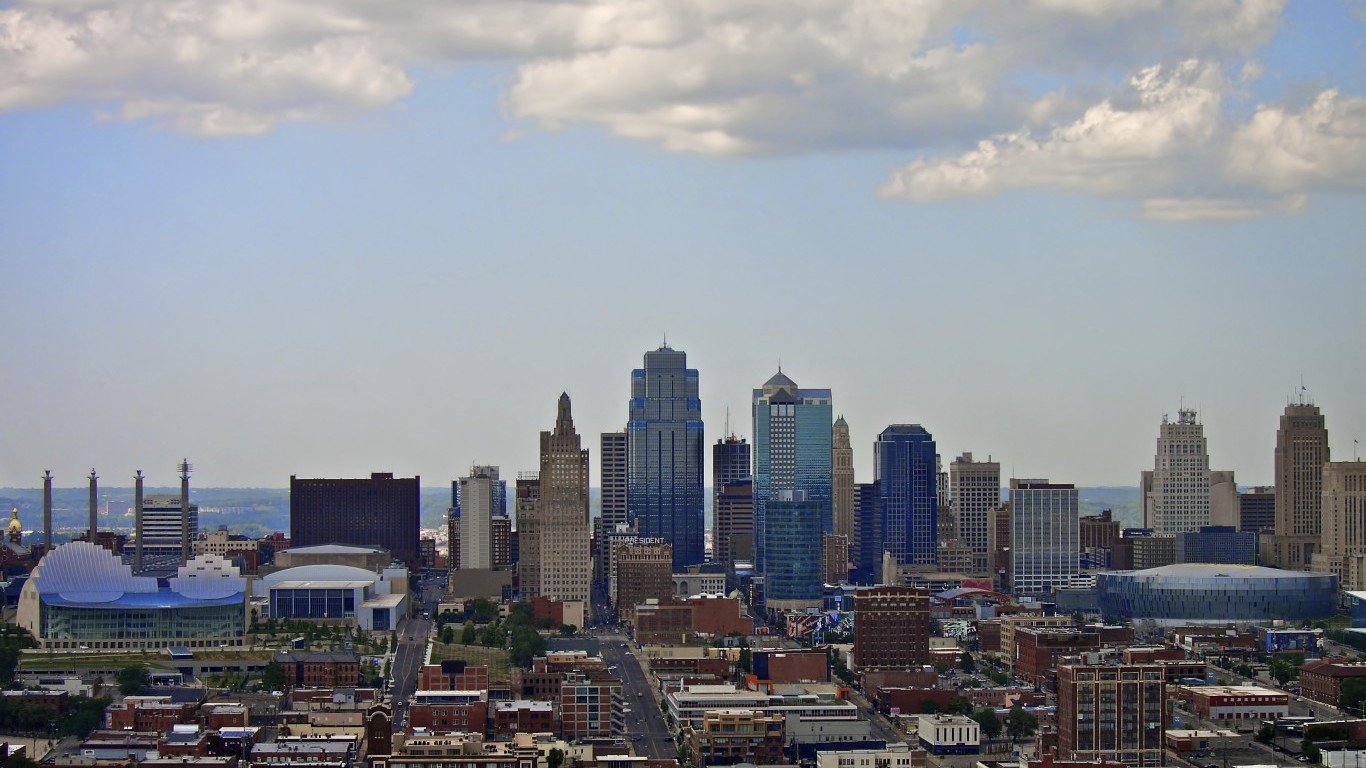
33. Missouri
> Gov’t. employees, 2017: 15.2% of workforce
> Gov’t. employment change, 2007-2017 -1.2% (439,800 to 434,700)
> State gov’t. spending per capita: $5,215 (8th least)
> Population density: 87.1 per sq. mi. (23rd lowest)
Source: Thinkstock
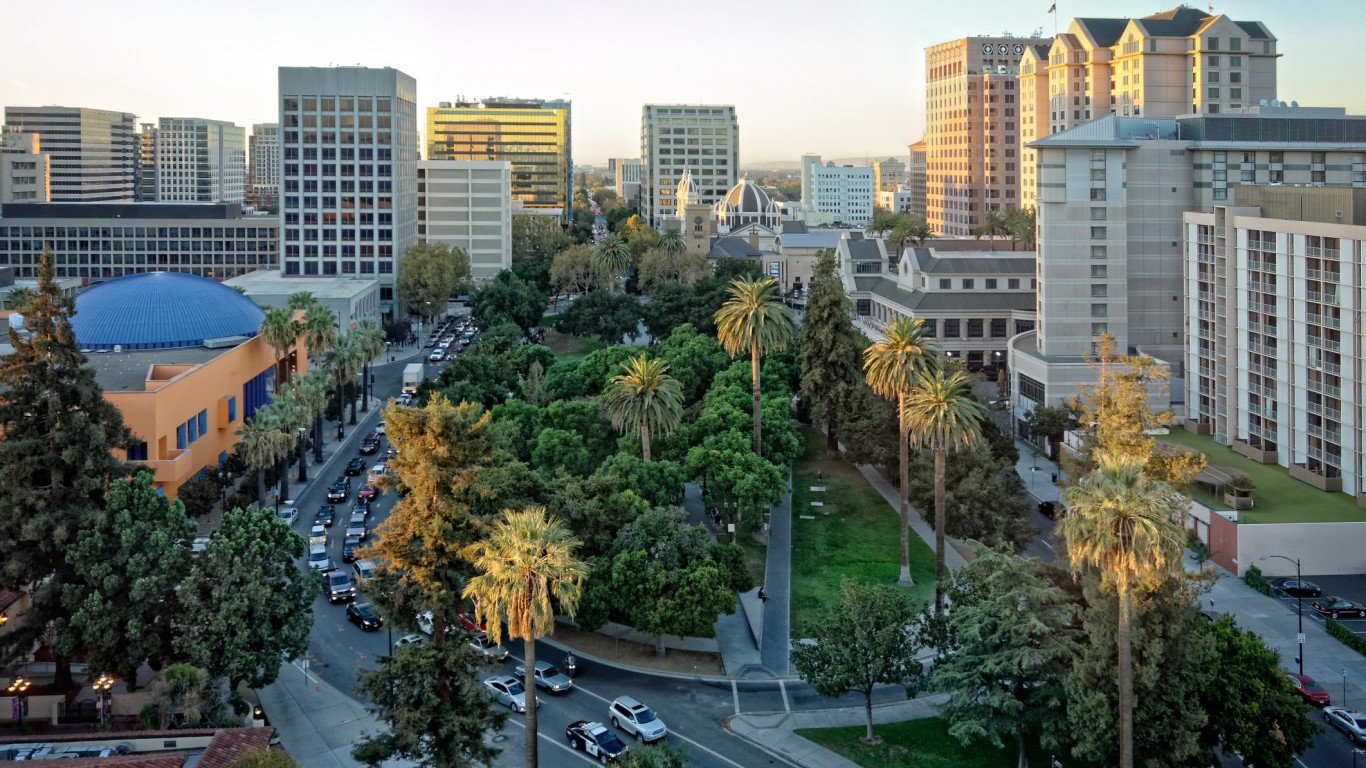
32. California
> Gov’t. employees, 2017: 15.2% of workforce
> Gov’t. employment change, 2007-2017 +2.4% (2,494,600 to 2,553,500)
> State gov’t. spending per capita: $8,168 (11th most)
> Population density: 239.1 per sq. mi. (11th highest)
[in-text-ad-2]
Source: Thinkstock
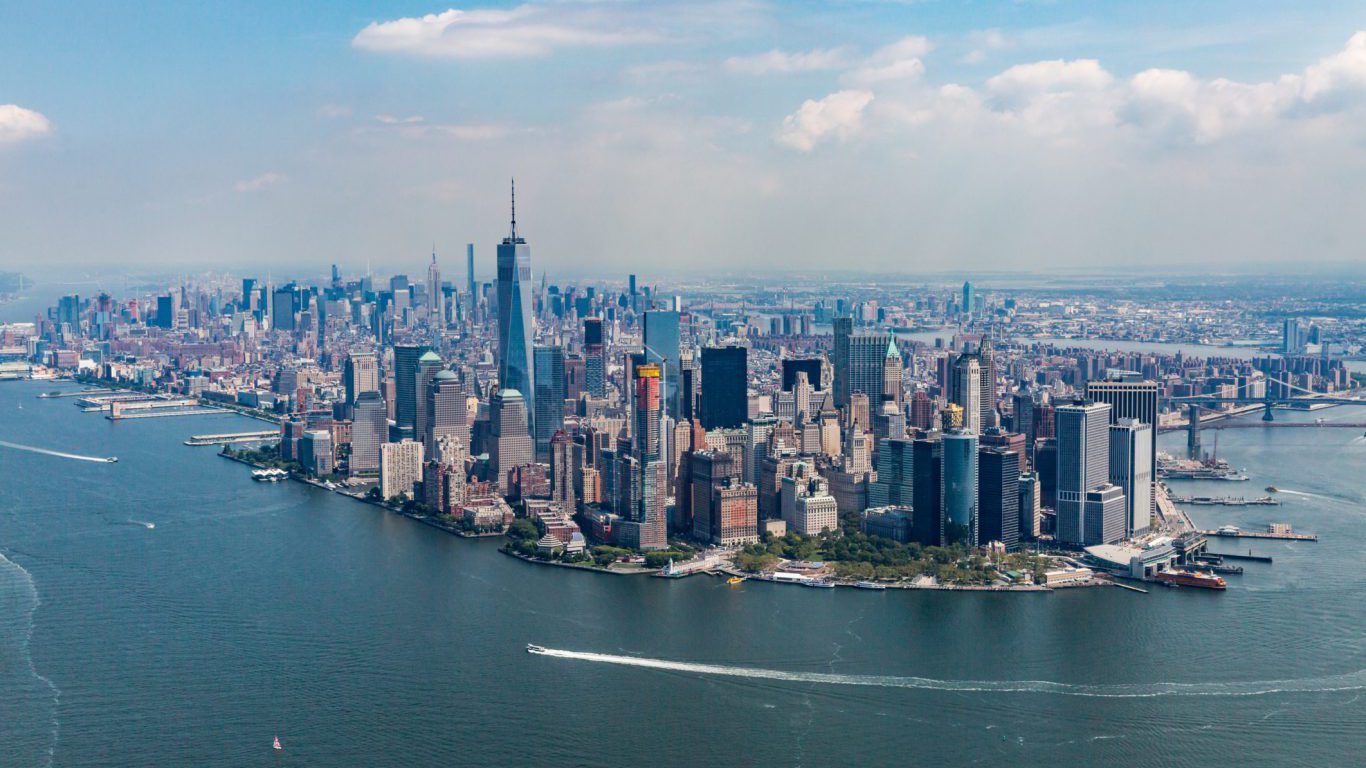
31. New York
> Gov’t. employees, 2017: 15.2% of workforce
> Gov’t. employment change, 2007-2017 -3.5% (1,501,000 to 1,449,200)
> State gov’t. spending per capita: $9,400 (7th most)
> Population density: 411.2 per sq. mi. (7th highest)
Source: Thinkstock
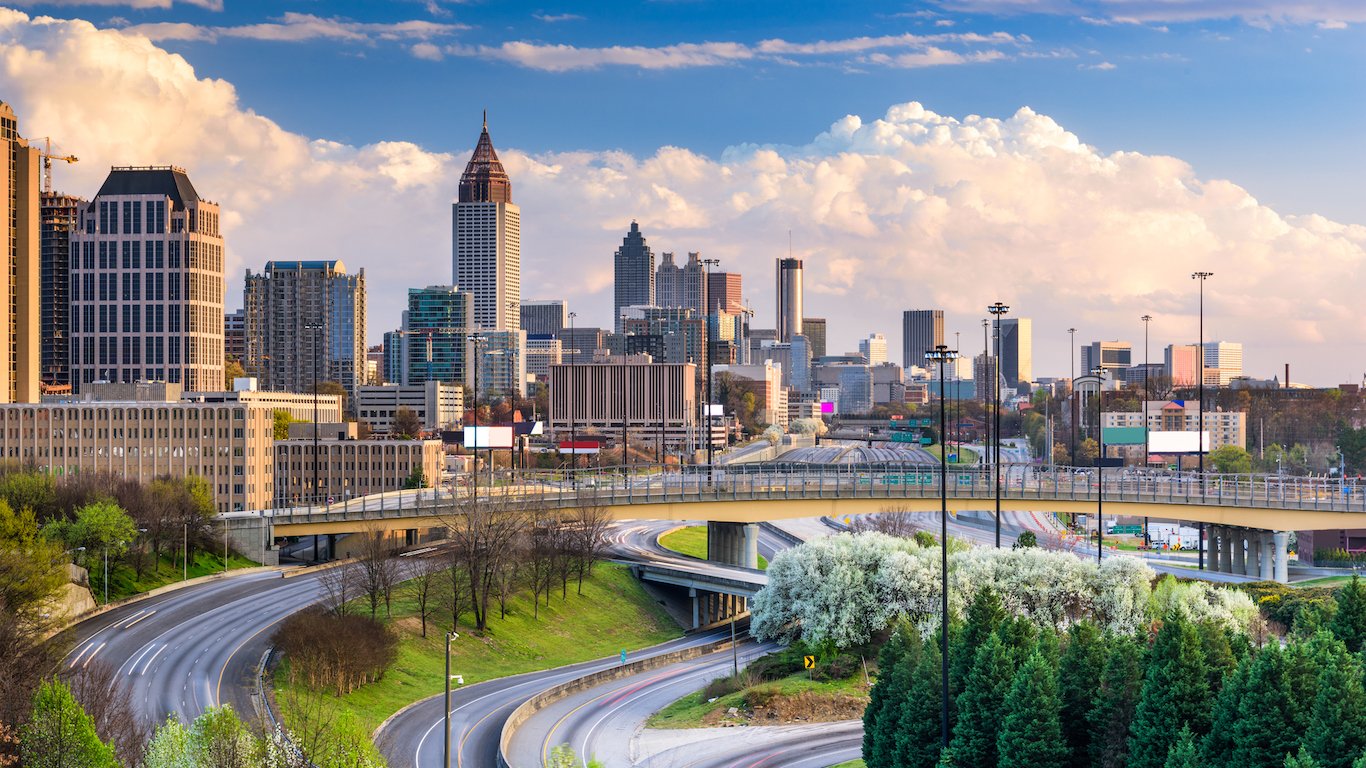
30. Georgia
> Gov’t. employees, 2017: 15.4% of workforce
> Gov’t. employment change, 2007-2017 -0.8% (692,800 to 687,300)
> State gov’t. spending per capita: $4,512 (2nd least)
> Population density: 168.4 per sq. mi. (18th highest)
[in-text-ad]
Source: Thinkstock
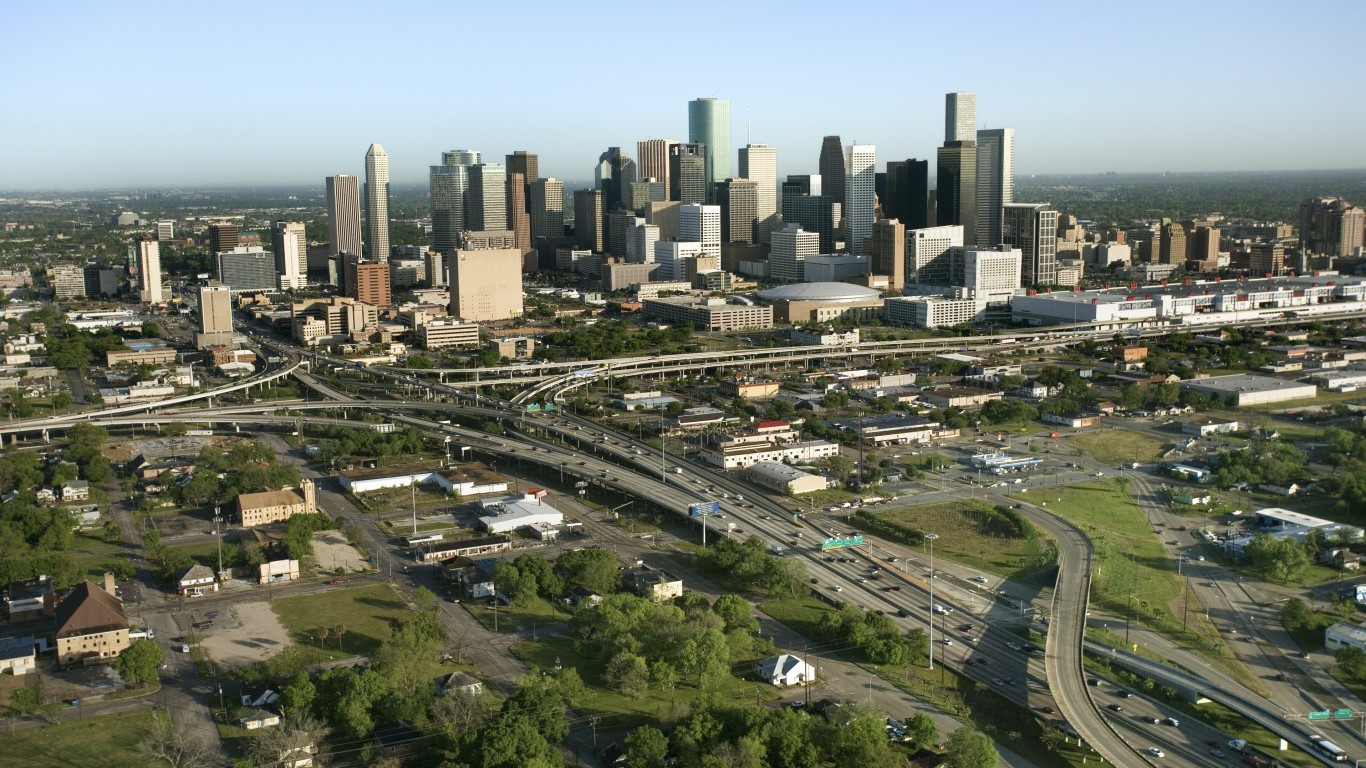
29. Texas
> Gov’t. employees, 2017: 15.9% of workforce
> Gov’t. employment change, 2007-2017 +10.0% (1,763,700 to 1,939,400)
> State gov’t. spending per capita: $4,914 (4th least)
> Population density: 96.3 per sq. mi. (25th lowest)
 24/7 Wall St.
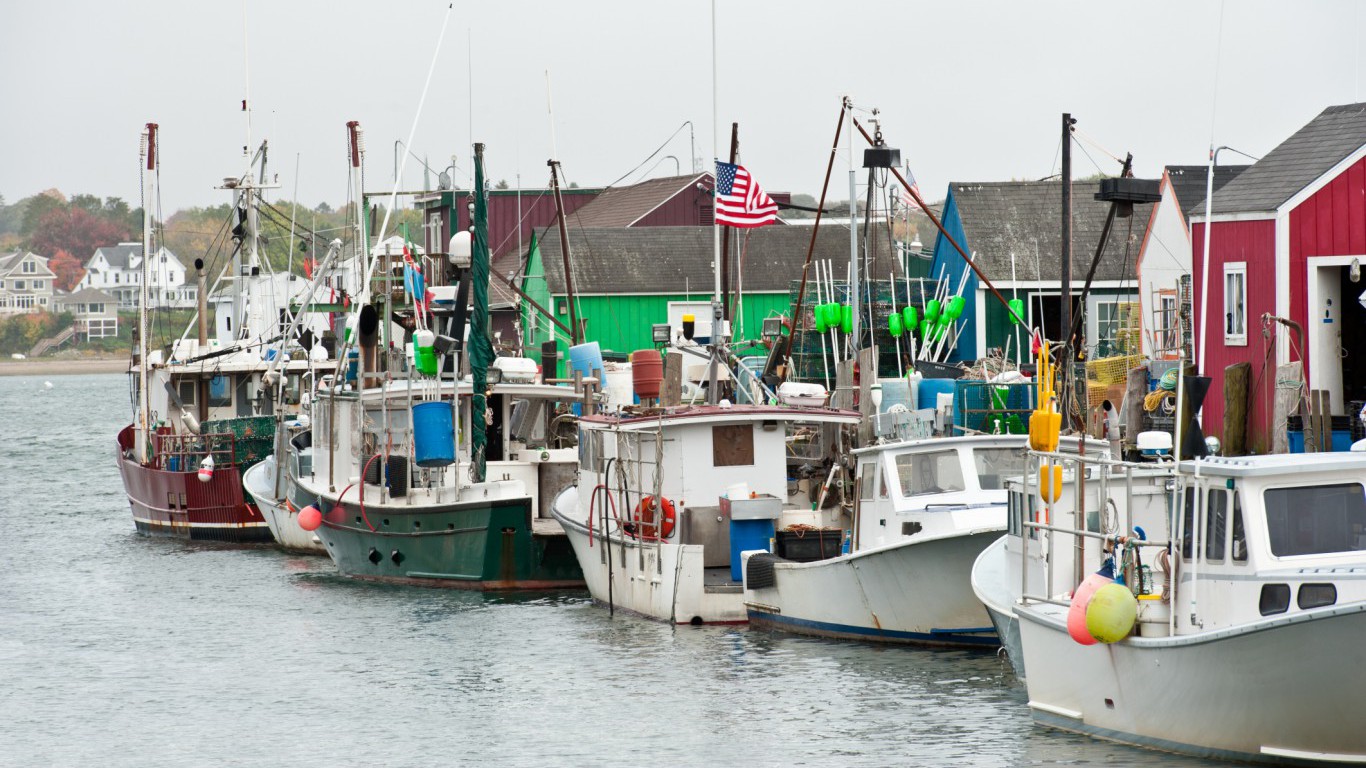
Source: Thinkstock
28. Maine
> Gov’t. employees, 2017: 16.1% of workforce
> Gov’t. employment change, 2007-2017 -3.9% (104,200 to 100,100)
> State gov’t. spending per capita: $6,641 (23rd least)
> Population density: 43.1 per sq. mi. (13th lowest)
Source: Thinkstock
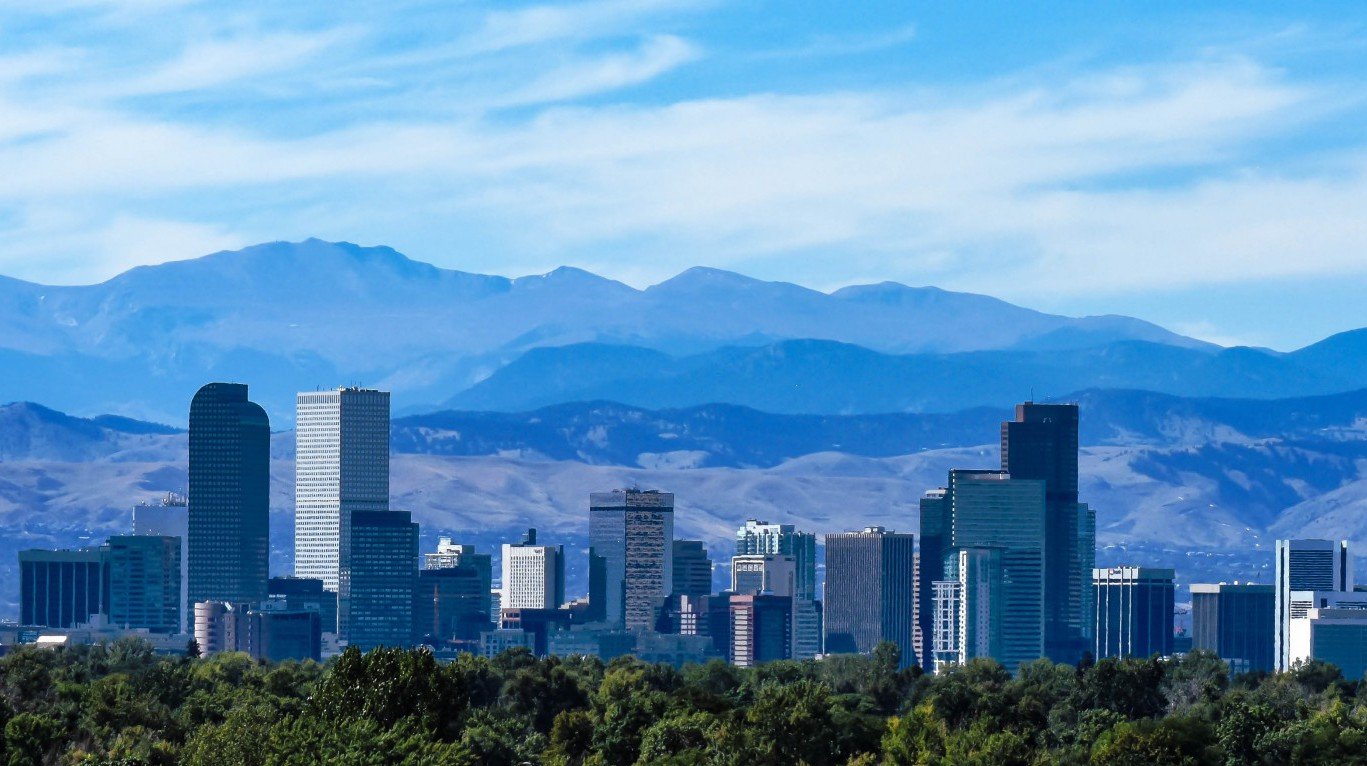
27. Colorado
> Gov’t. employees, 2017: 16.4% of workforce
> Gov’t. employment change, 2007-2017 +16.6% (374,700 to 436,900)
> State gov’t. spending per capita: $6,215 (20th least)
> Population density: 48.5 per sq. mi. (14th lowest)
[in-text-ad-2]
Source: Thinkstock
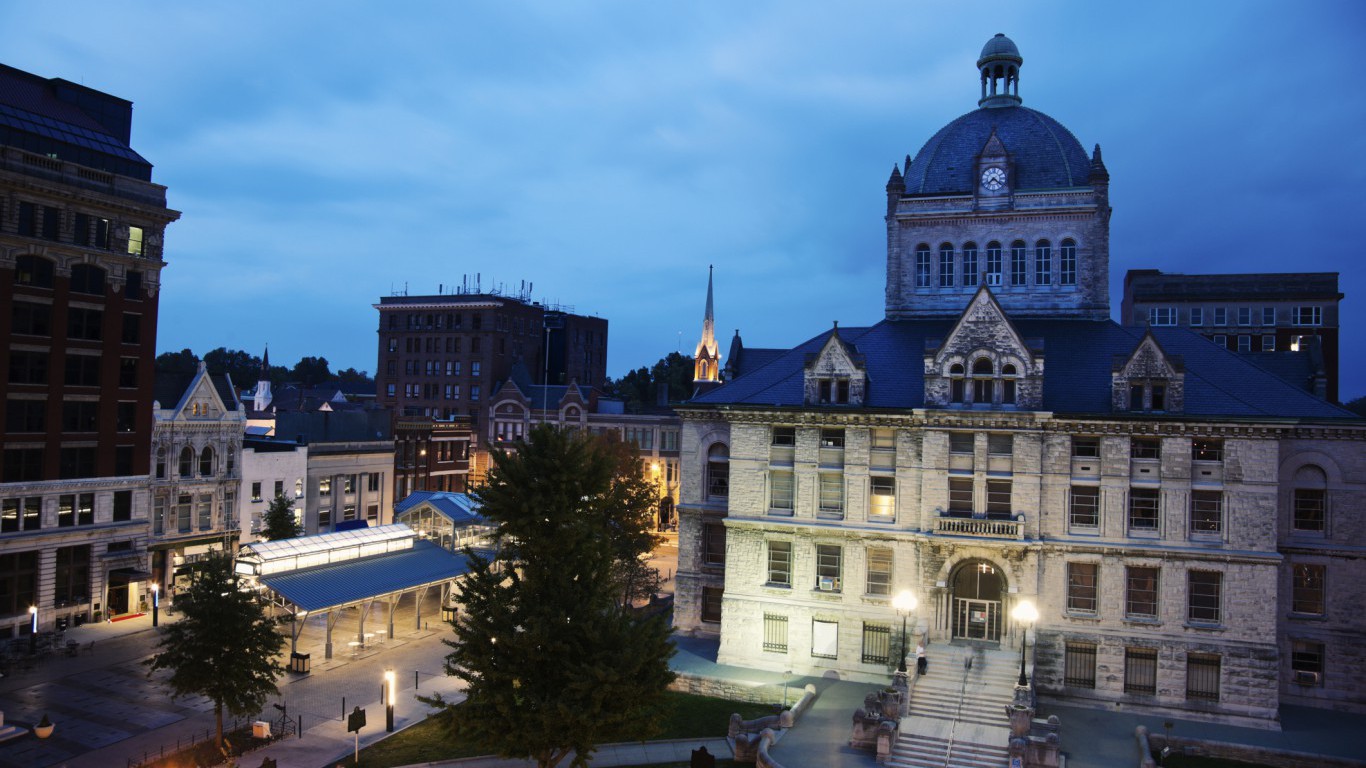
26. Kentucky
> Gov’t. employees, 2017: 16.4% of workforce
> Gov’t. employment change, 2007-2017 +1.8% (310,100 to 315,800)
> State gov’t. spending per capita: $7,509 (16th most)
> Population density: 109.9 per sq. mi. (22nd highest)
Source: Thinkstock
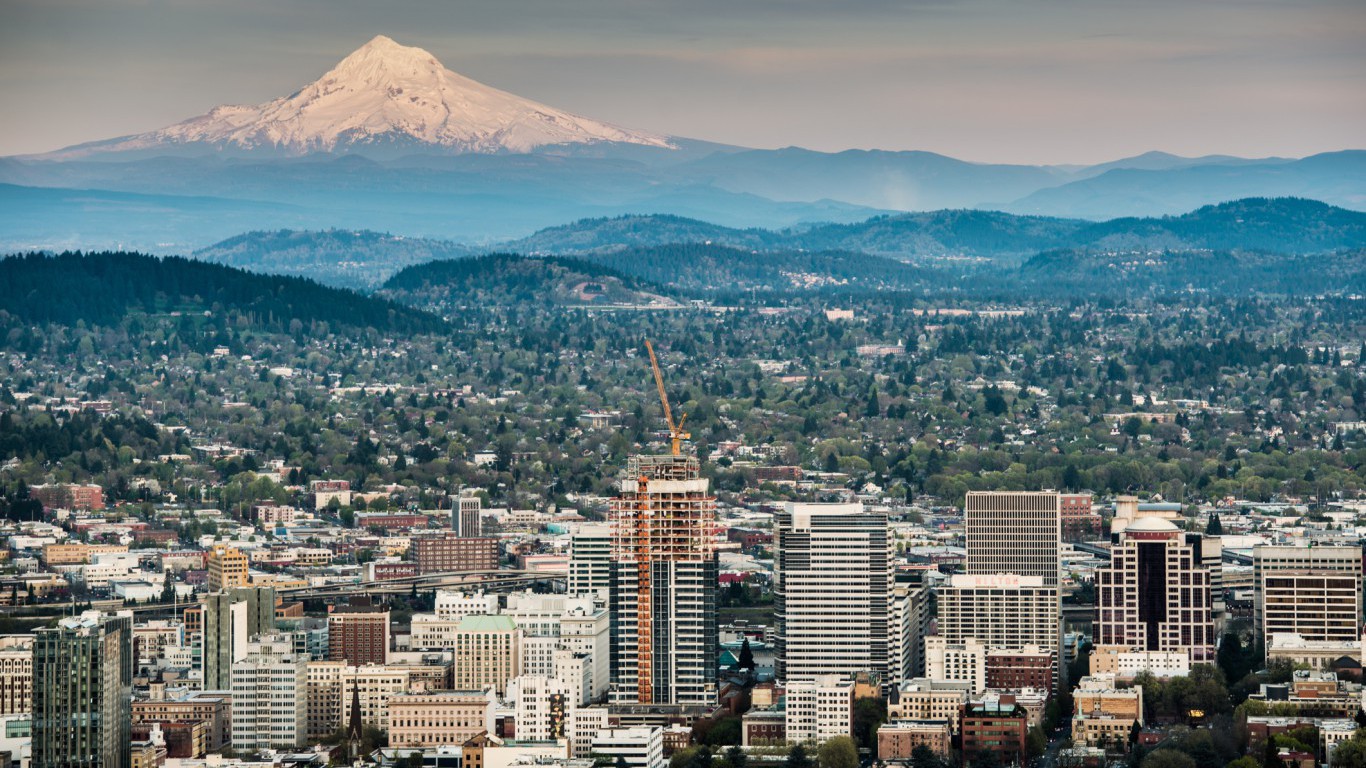
25. Oregon
> Gov’t. employees, 2017: 16.5% of workforce
> Gov’t. employment change, 2007-2017 +6.6% (289,800 to 309,000)
> State gov’t. spending per capita: $7,832 (15th most)
> Population density: 39.9 per sq. mi. (12th lowest)
[in-text-ad]
Source: Thinkstock
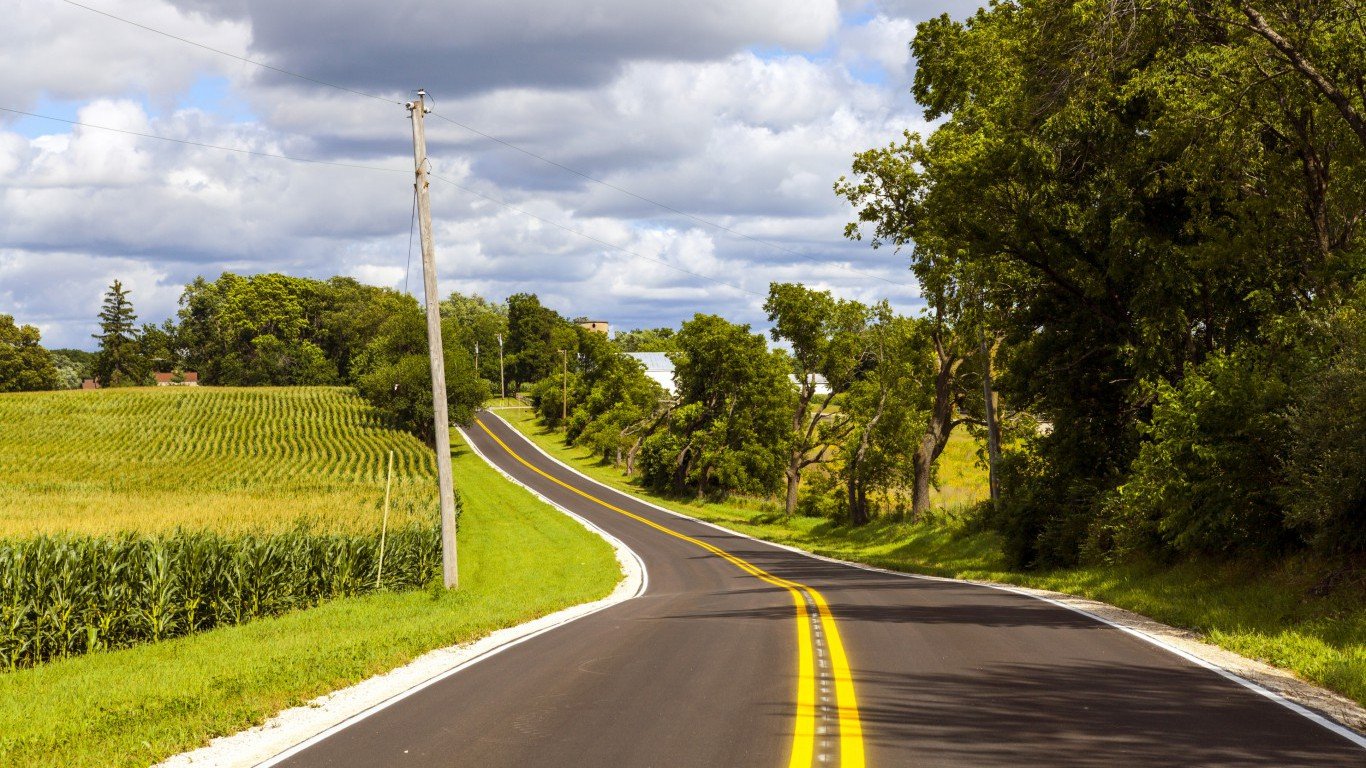
24. Iowa
> Gov’t. employees, 2017: 16.6% of workforce
> Gov’t. employment change, 2007-2017 +4.2% (249,900 to 260,300)
> State gov’t. spending per capita: $7,262 (18th most)
> Population density: 54.5 per sq. mi. (15th lowest)
 24/7 Wall St.
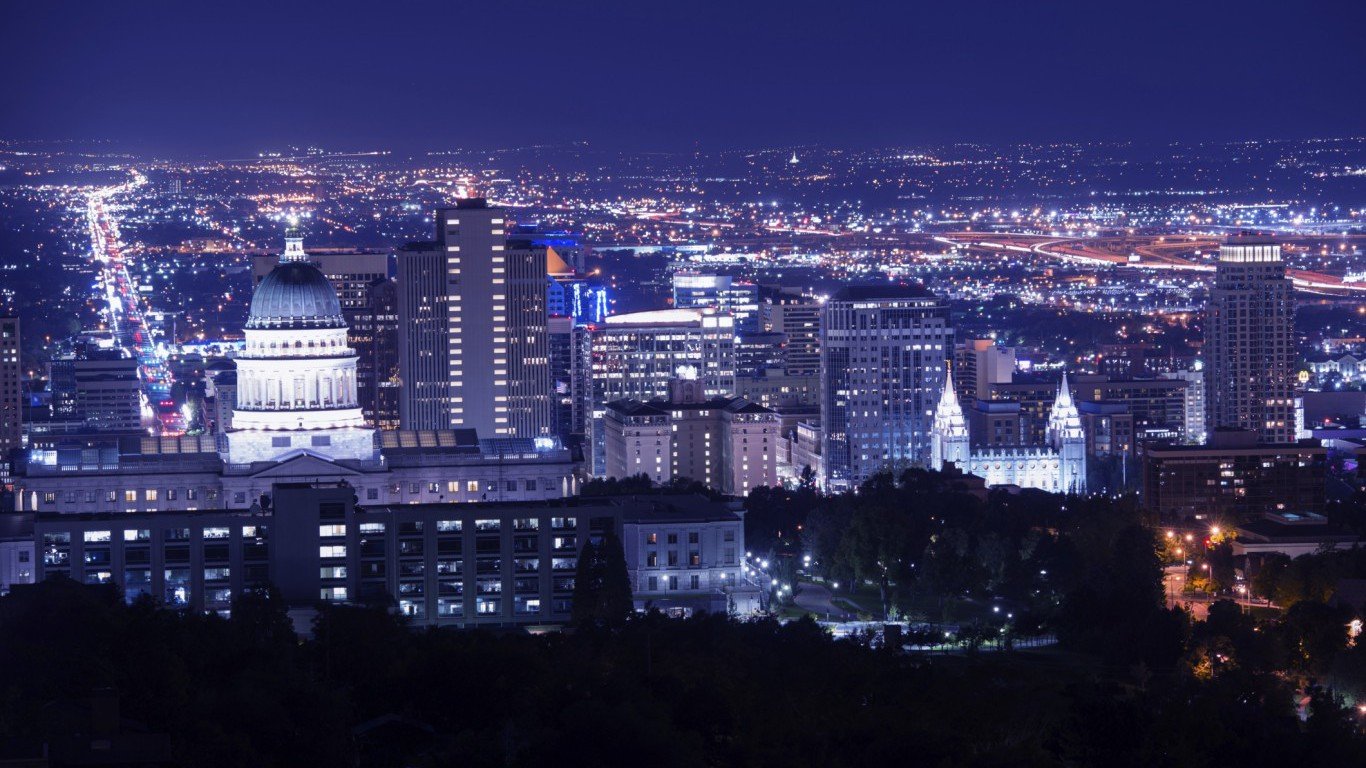
Source: Thinkstock
23. Utah
> Gov’t. employees, 2017: 16.6% of workforce
> Gov’t. employment change, 2007-2017 +17.6% (206,900 to 243,400)
> State gov’t. spending per capita: $5,869 (14th least)
> Population density: 33.6 per sq. mi. (10th lowest)
Source: Thinkstock
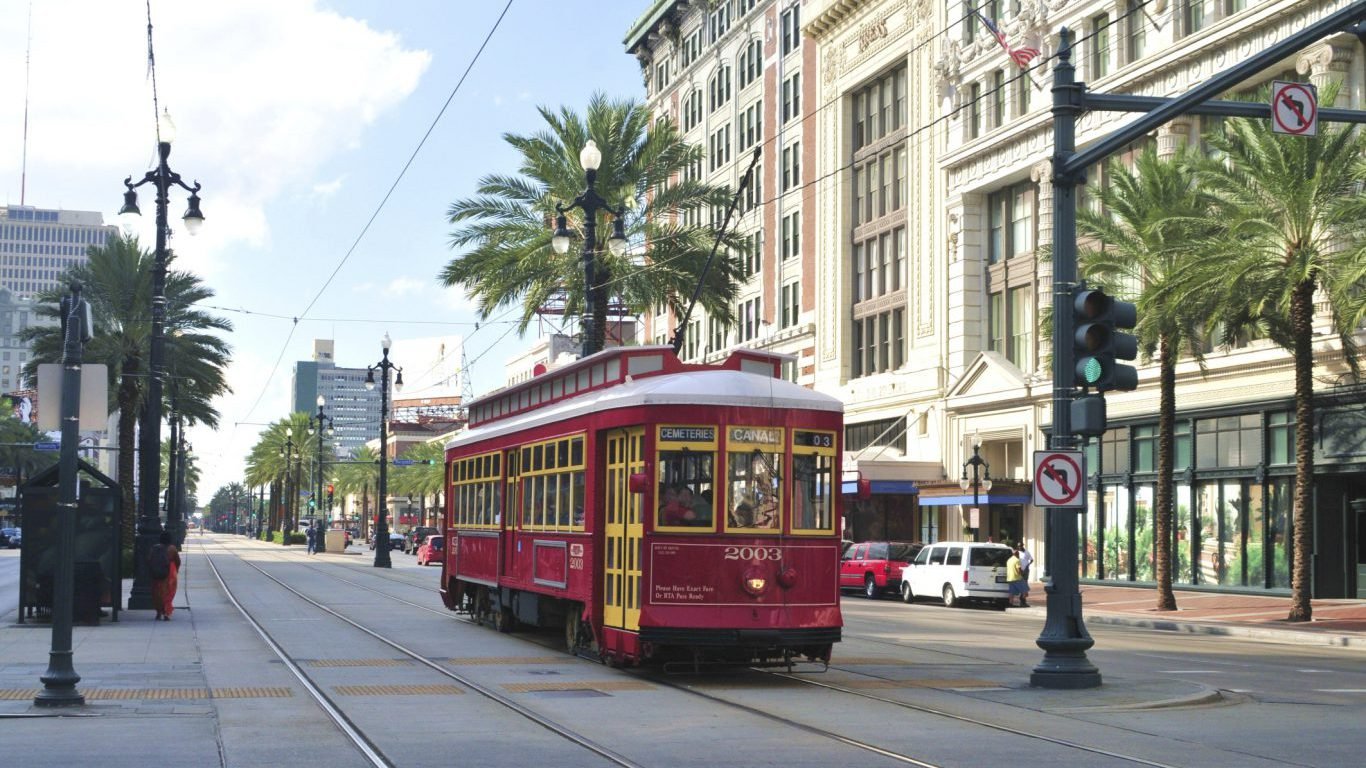
22. Louisiana
> Gov’t. employees, 2017: 16.6% of workforce
> Gov’t. employment change, 2007-2017 -8.0% (355,500 to 327,200)
> State gov’t. spending per capita: $6,619 (22nd least)
> Population density: 104.9 per sq. mi. (24th highest)
[in-text-ad-2]

Source: Thinkstock
21. North Carolina
> Gov’t. employees, 2017: 16.6% of workforce
> Gov’t. employment change, 2007-2017 +4.3% (702,800 to 733,000)
> State gov’t. spending per capita: $5,194 (7th least)
> Population density: 196.1 per sq. mi. (15th highest)
Source: Thinkstock
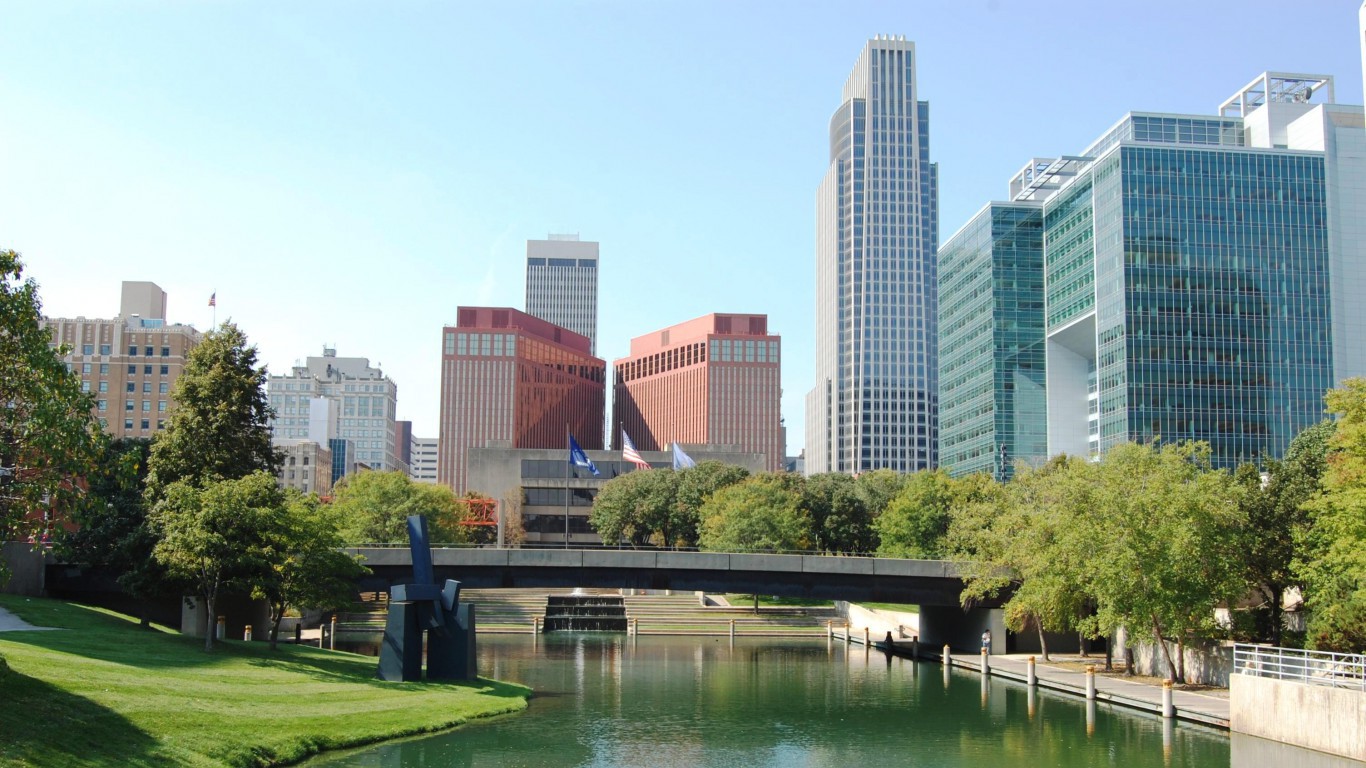
20. Nebraska
> Gov’t. employees, 2017: 17.0% of workforce
> Gov’t. employment change, 2007-2017 +6.3% (162,400 to 172,700)
> State gov’t. spending per capita: $5,479 (12th least)
> Population density: 23.8 per sq. mi. (8th lowest)
[in-text-ad]
Source: Thinkstock
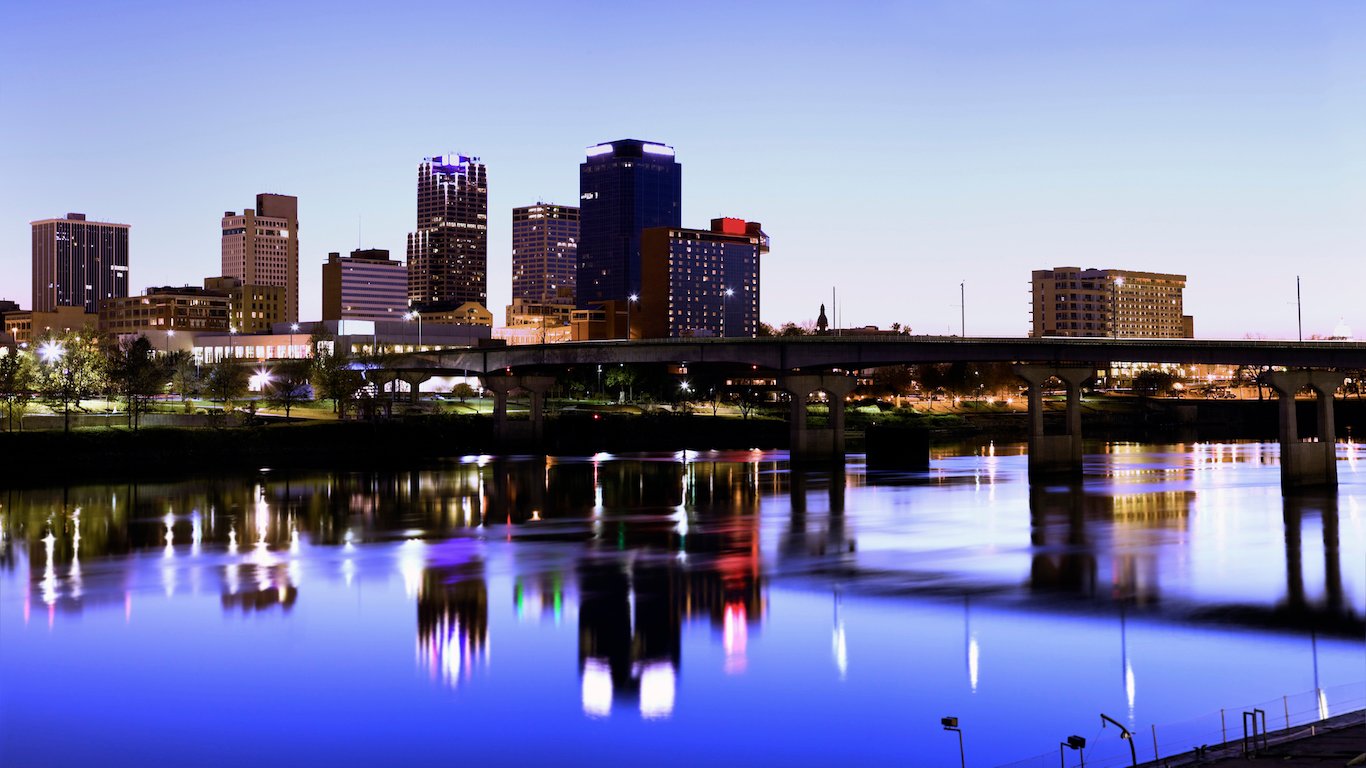
19. Arkansas
> Gov’t. employees, 2017: 17.1% of workforce
> Gov’t. employment change, 2007-2017 +0.2% (210,800 to 211,300)
> State gov’t. spending per capita: $7,151 (20th most)
> Population density: 56.0 per sq. mi. (17th lowest)
 24/7 Wall St.
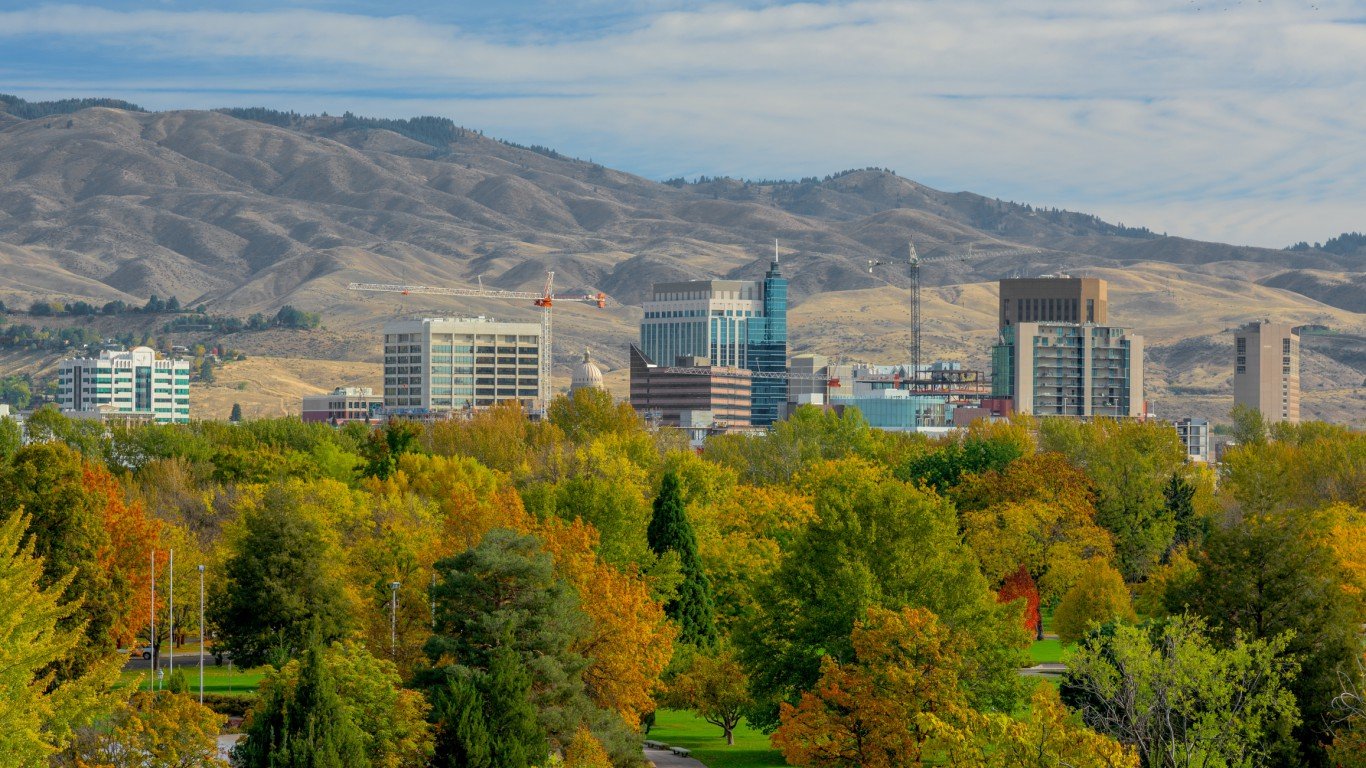
Source: Thinkstock
18. Idaho
> Gov’t. employees, 2017: 17.2% of workforce
> Gov’t. employment change, 2007-2017 +5.6% (116,800 to 123,300)
> State gov’t. spending per capita: $5,271 (9th least)
> Population density: 19.0 per sq. mi. (7th lowest)

Source: Thinkstock
17. South Carolina
> Gov’t. employees, 2017: 17.5% of workforce
> Gov’t. employment change, 2007-2017 +5.7% (346,400 to 366,000)
> State gov’t. spending per capita: $6,161 (18th least)
> Population density: 153.9 per sq. mi. (19th highest)
[in-text-ad-2]
Source: Thinkstock
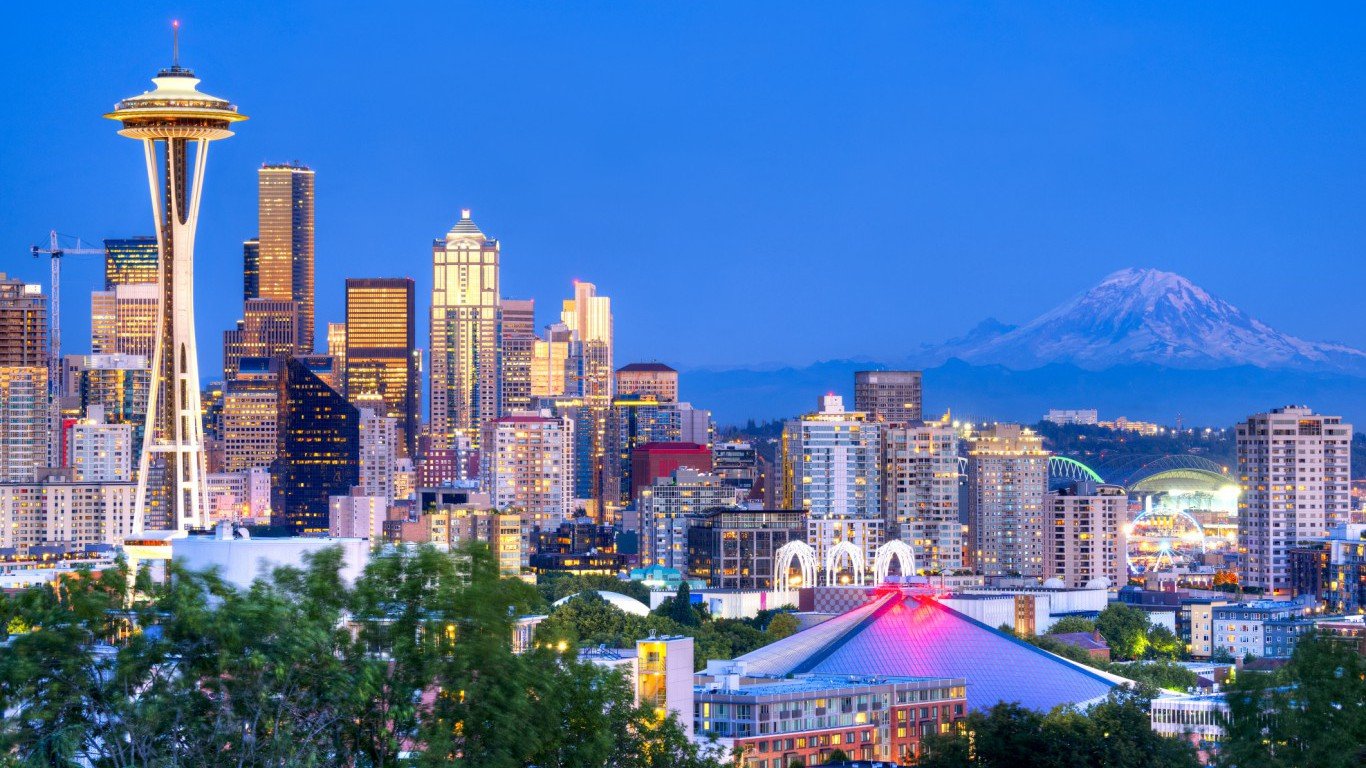
16. Washington
> Gov’t. employees, 2017: 17.6% of workforce
> Gov’t. employment change, 2007-2017 +9.9% (533,800 to 586,600)
> State gov’t. spending per capita: $6,979 (23rd most)
> Population density: 101.2 per sq. mi. (25th highest)
Source: Thinkstock
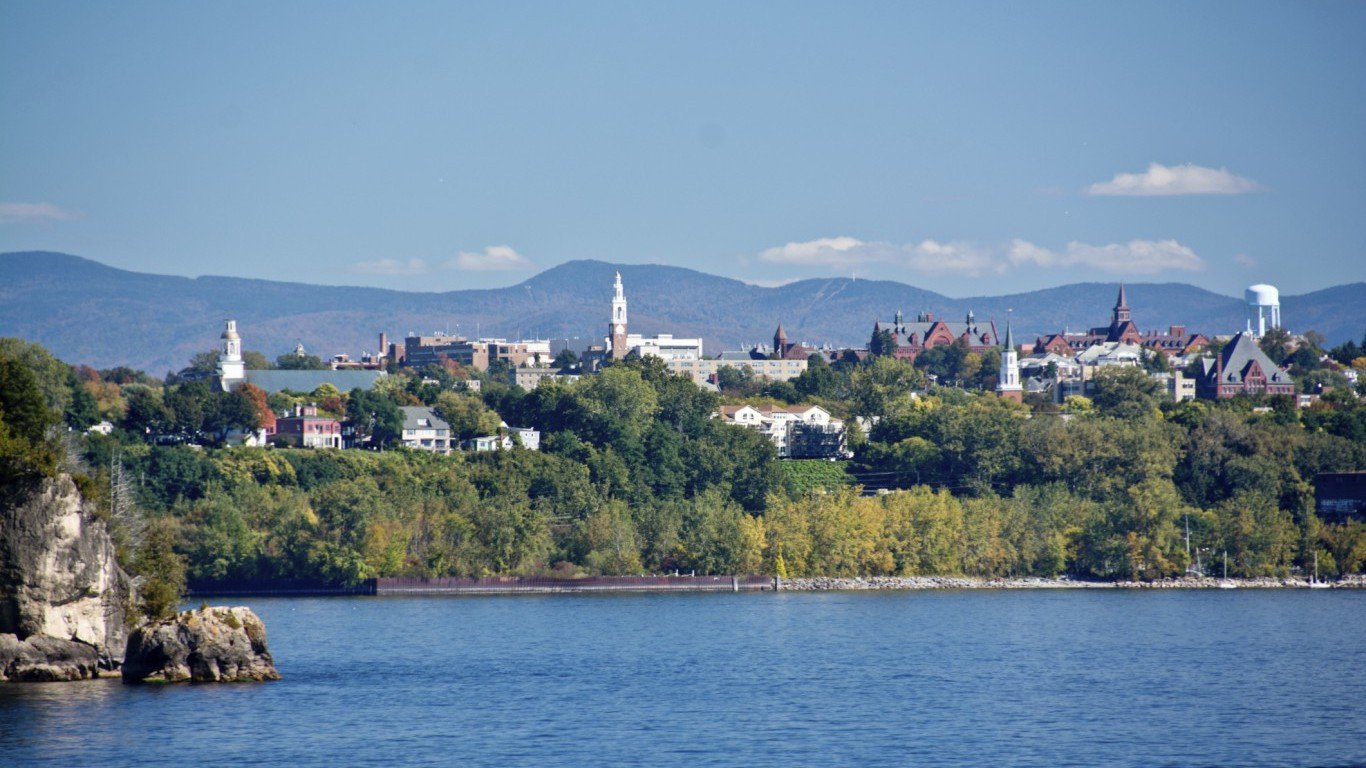
15. Vermont
> Gov’t. employees, 2017: 17.7% of workforce
> Gov’t. employment change, 2007-2017 +3.3% (53,900 to 55,700)
> State gov’t. spending per capita: $10,335 (4th most)
> Population density: 67.9 per sq. mi. (21st lowest)
[in-text-ad]
Source: Thinkstock
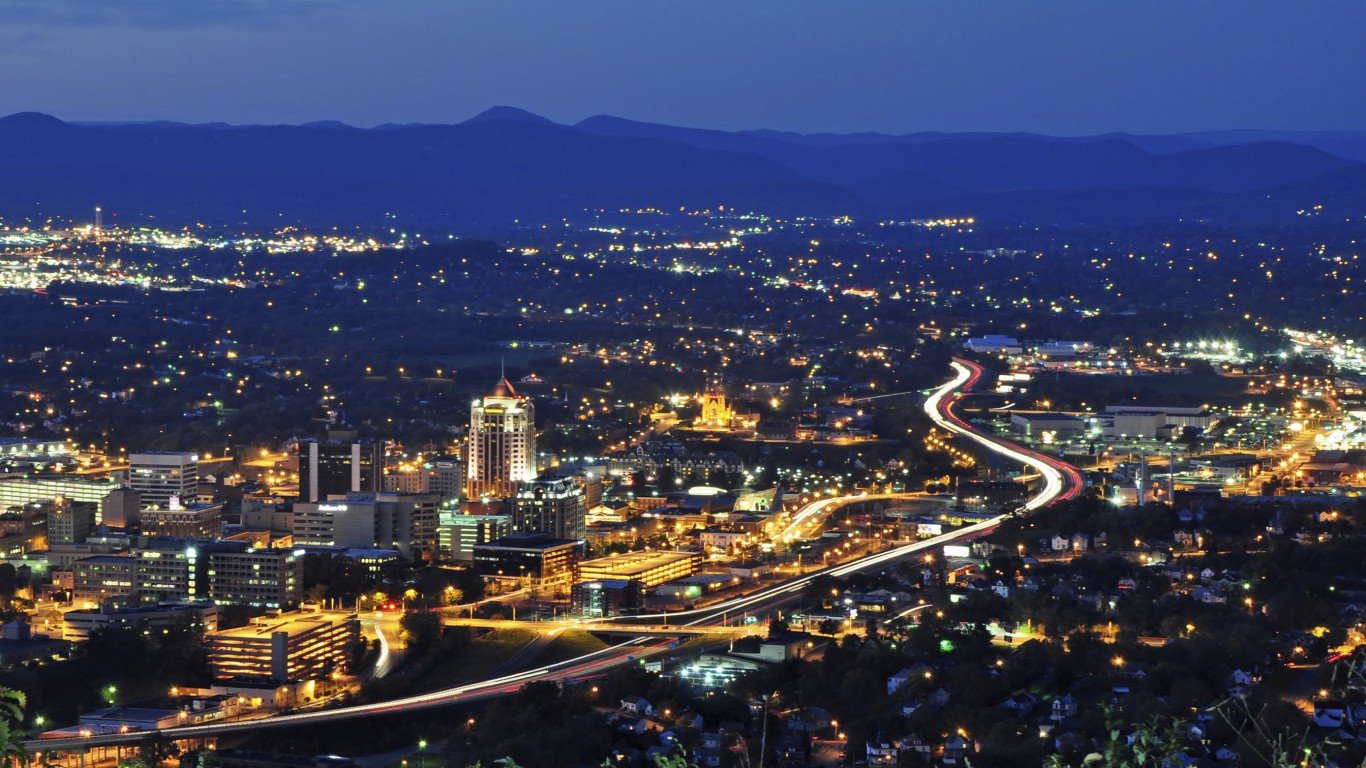
14. Virginia
> Gov’t. employees, 2017: 18.1% of workforce
> Gov’t. employment change, 2007-2017 +4.9% (683,400 to 716,900)
> State gov’t. spending per capita: $6,065 (16th least)
> Population density: 202.6 per sq. mi. (14th highest)
 24/7 Wall St.
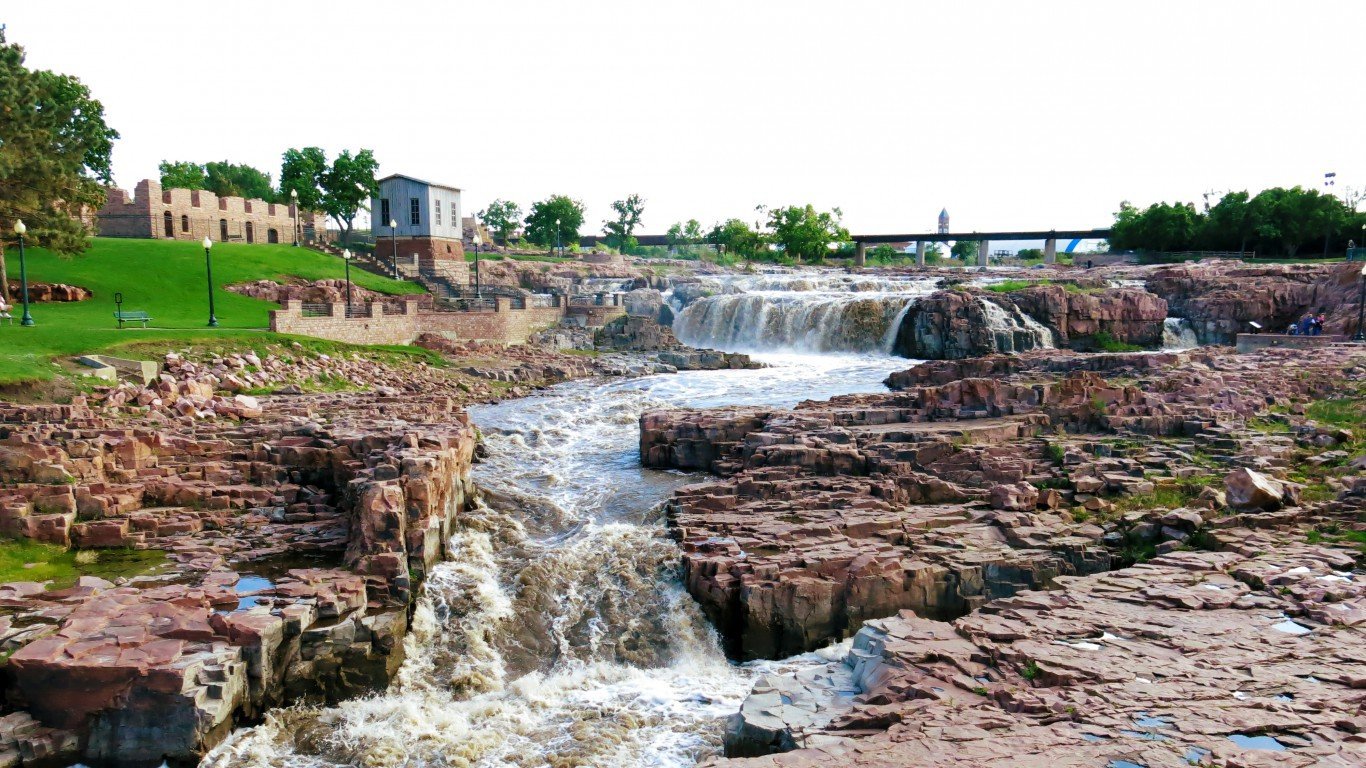
Source: Thinkstock
13. South Dakota
> Gov’t. employees, 2017: 18.3% of workforce
> Gov’t. employment change, 2007-2017 +5.0% (75,500 to 79,300)
> State gov’t. spending per capita: $5,404 (11th least)
> Population density: 10.7 per sq. mi. (5th lowest)
Source: Thinkstock
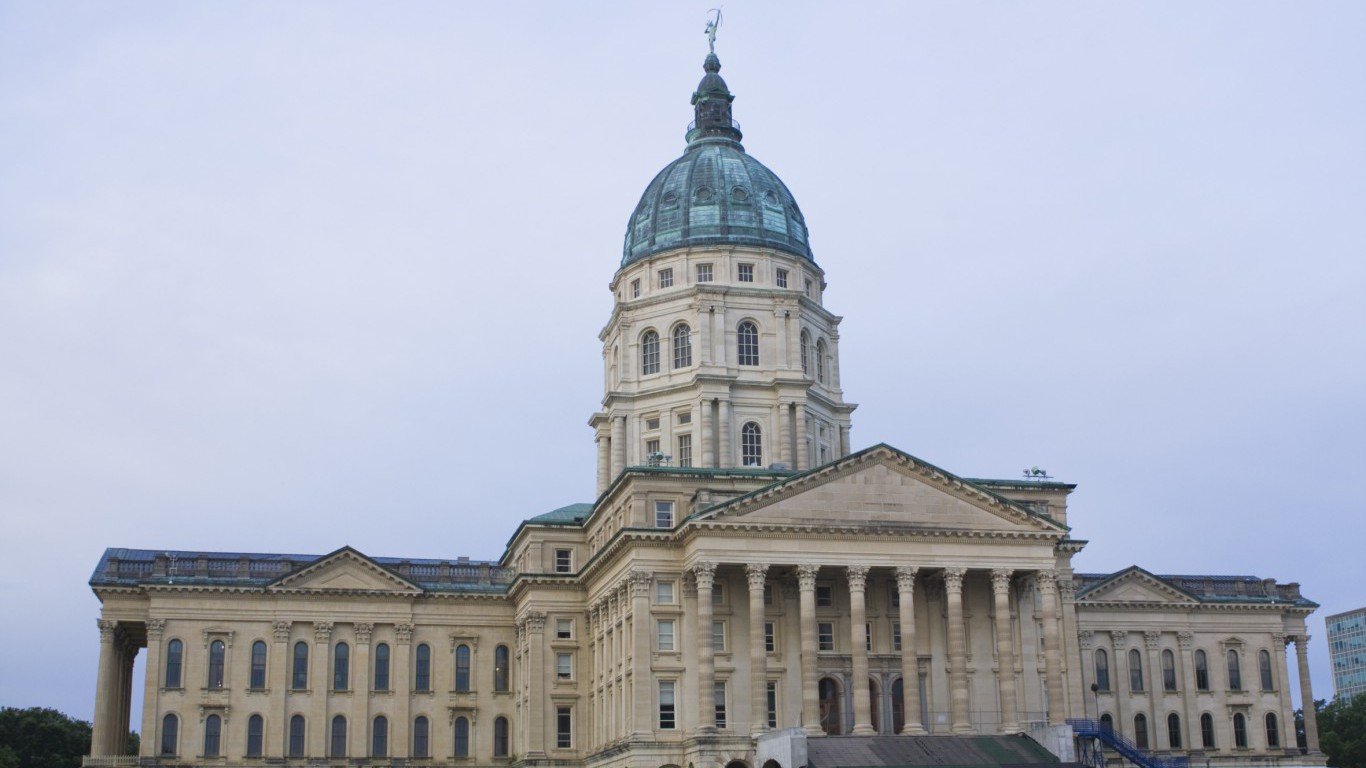
12. Kansas
> Gov’t. employees, 2017: 18.3% of workforce
> Gov’t. employment change, 2007-2017 -0.7% (258,200 to 256,300)
> State gov’t. spending per capita: $6,167 (19th least)
> Population density: 34.9 per sq. mi. (11th lowest)
[in-text-ad-2]

Source: Thinkstock
11. Maryland
> Gov’t. employees, 2017: 18.5% of workforce
> Gov’t. employment change, 2007-2017 +5.1% (479,600 to 504,100)
> State gov’t. spending per capita: $7,178 (19th most)
> Population density: 594.8 per sq. mi. (5th highest)
Source: AuburnPilot / Wikimedia Commons
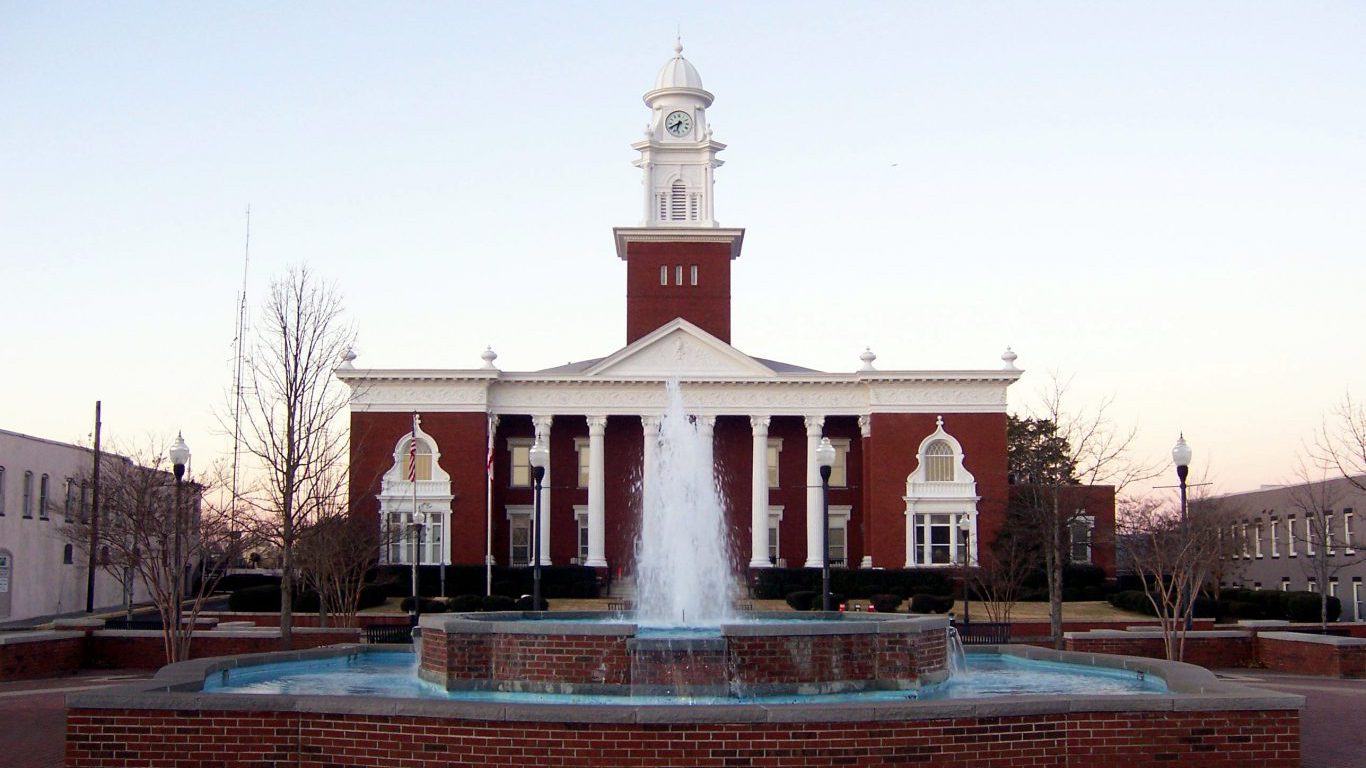
10. Alabama
> Gov’t. employees, 2017: 19.1% of workforce
> Gov’t. employment change, 2007-2017 +1.3% (380,300 to 385,100)
> State gov’t. spending per capita: $6,002 (15th least)
> Population density: 94.4 per sq. mi. (24th lowest)
[in-text-ad]
Source: Thinkstock
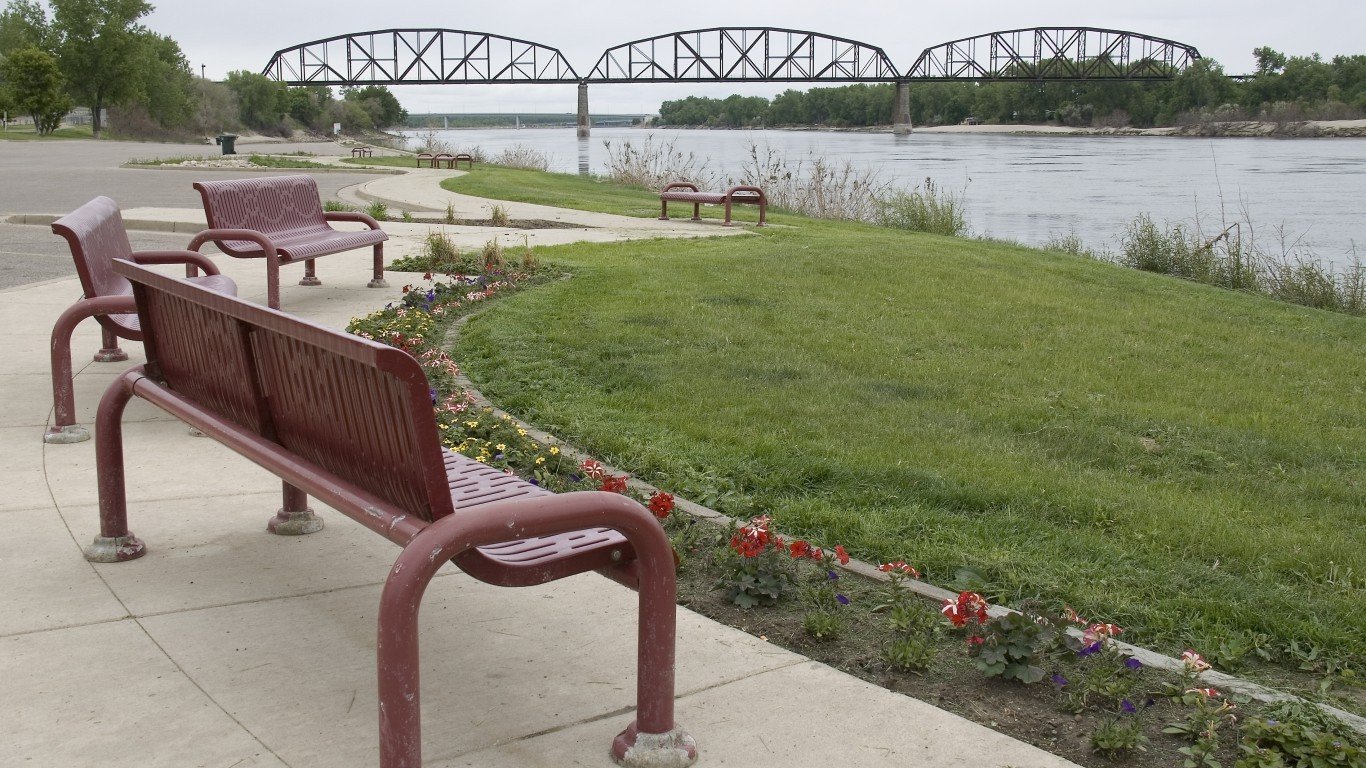
9. North Dakota
> Gov’t. employees, 2017: 19.1% of workforce
> Gov’t. employment change, 2007-2017 +8.9% (75,700 to 82,400)
> State gov’t. spending per capita: $10,850 (3rd most)
> Population density: 9.7 per sq. mi. (4th lowest)
 24/7 Wall St.
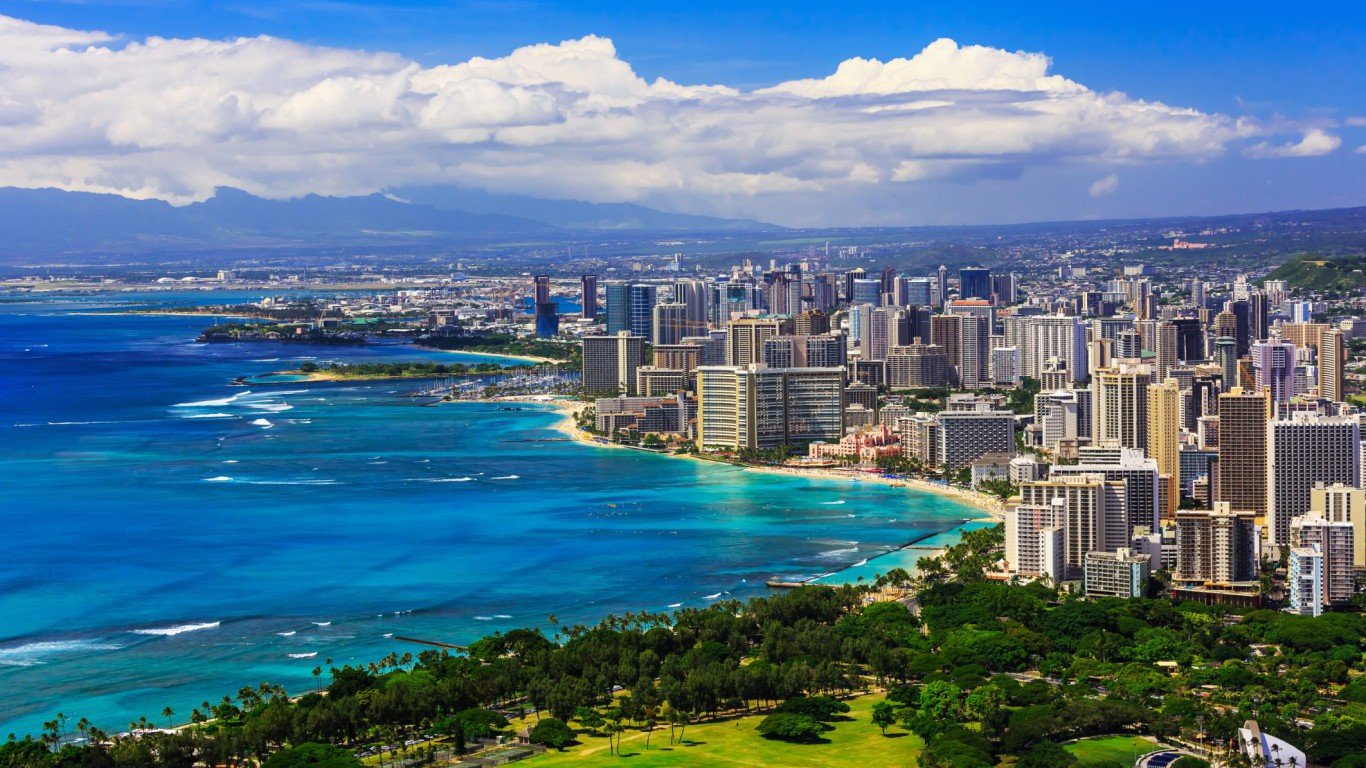
Source: Thinkstock
8. Hawaii
> Gov’t. employees, 2017: 19.2% of workforce
> Gov’t. employment change, 2007-2017 +2.9% (122,100 to 125,600)
> State gov’t. spending per capita: $8,691 (9th most)
> Population density: 211.8 per sq. mi. (13th highest)
Source: Thinkstock
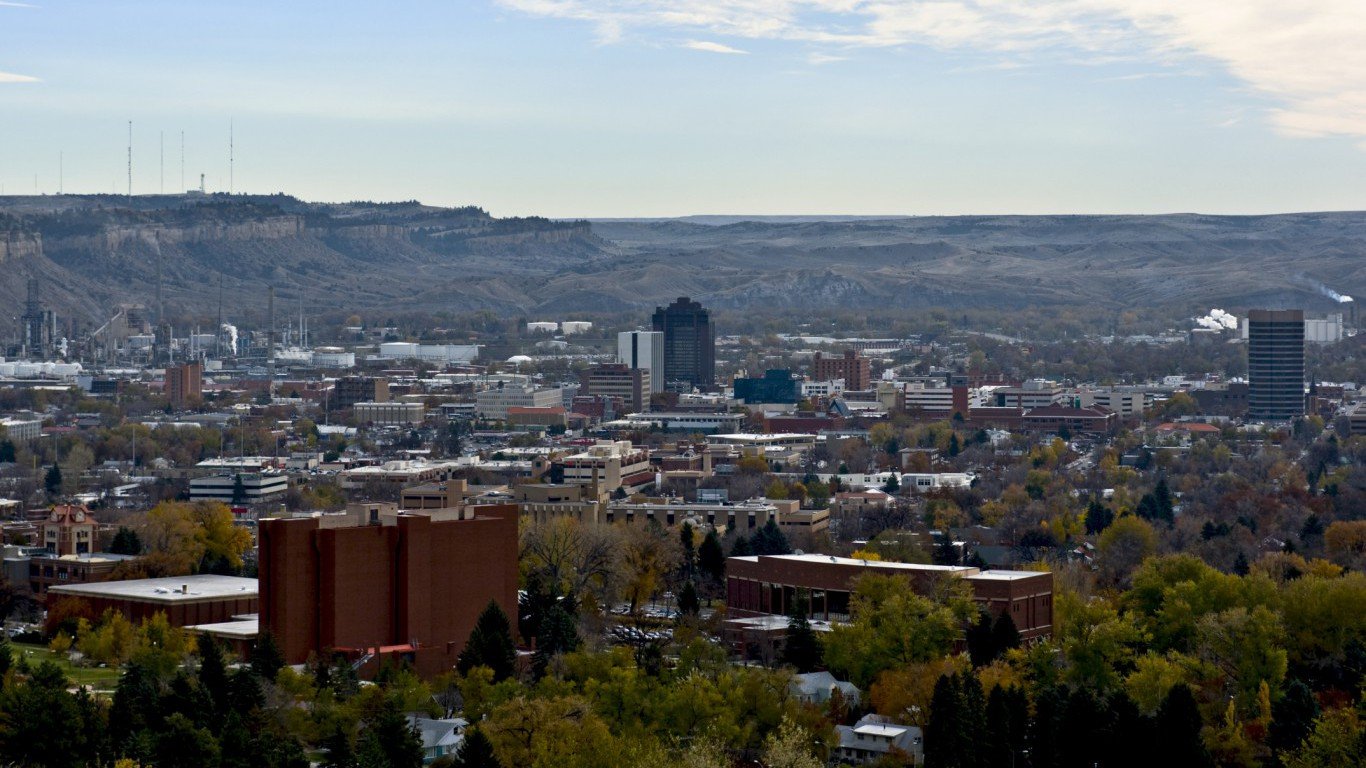
7. Montana
> Gov’t. employees, 2017: 19.3% of workforce
> Gov’t. employment change, 2007-2017 +4.5% (87,300 to 91,200)
> State gov’t. spending per capita: $7,144 (21st most)
> Population density: 6.8 per sq. mi. (3rd lowest)
[in-text-ad-2]
Source: Thinkstock
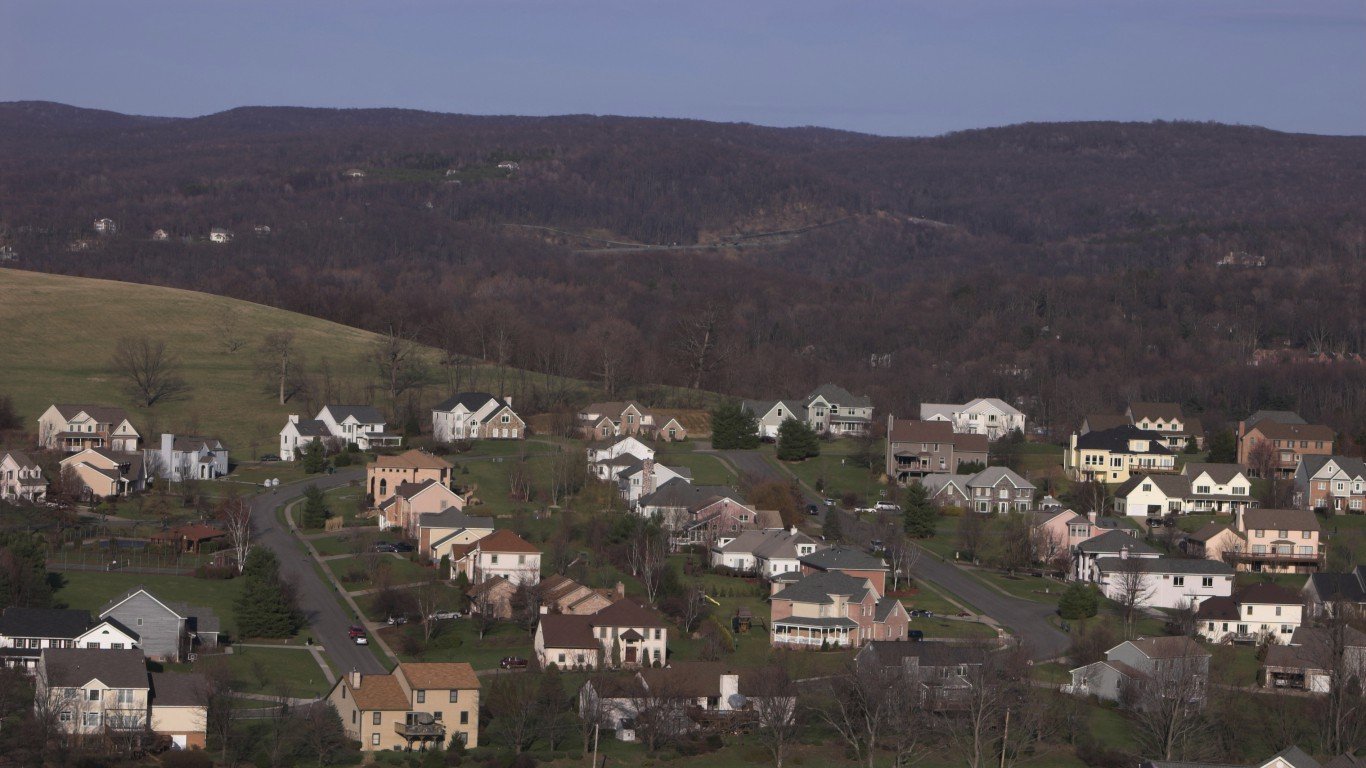
6. West Virginia
> Gov’t. employees, 2017: 20.6% of workforce
> Gov’t. employment change, 2007-2017 +6.1% (144,900 to 153,800)
> State gov’t. spending per capita: $7,367 (17th most)
> Population density: 77.1 per sq. mi. (22nd lowest)
Source: Thinkstock
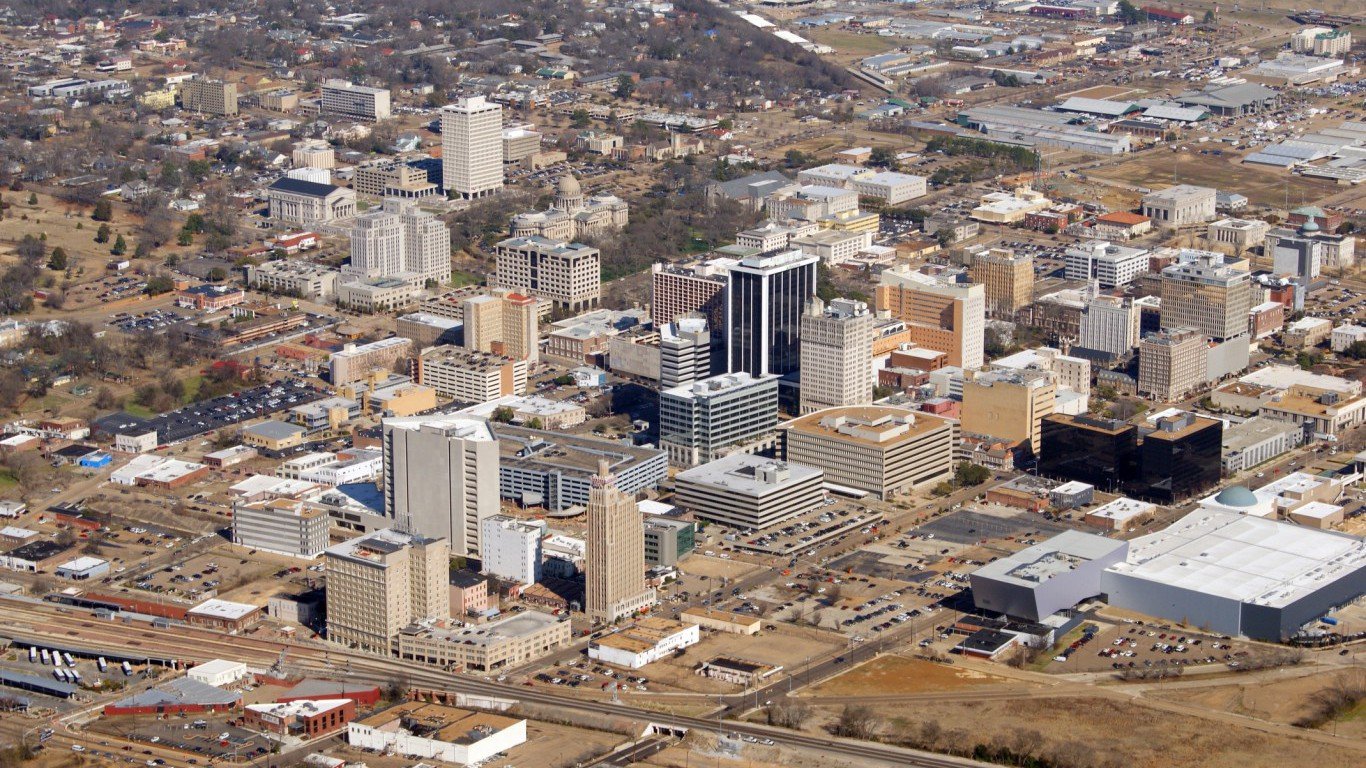
5. Mississippi
> Gov’t. employees, 2017: 21.1% of workforce
> Gov’t. employment change, 2007-2017 -0.6% (244,000 to 242,600)
> State gov’t. spending per capita: $7,063 (22nd most)
> Population density: 63.2 per sq. mi. (19th lowest)
[in-text-ad]
Source: Thinkstock
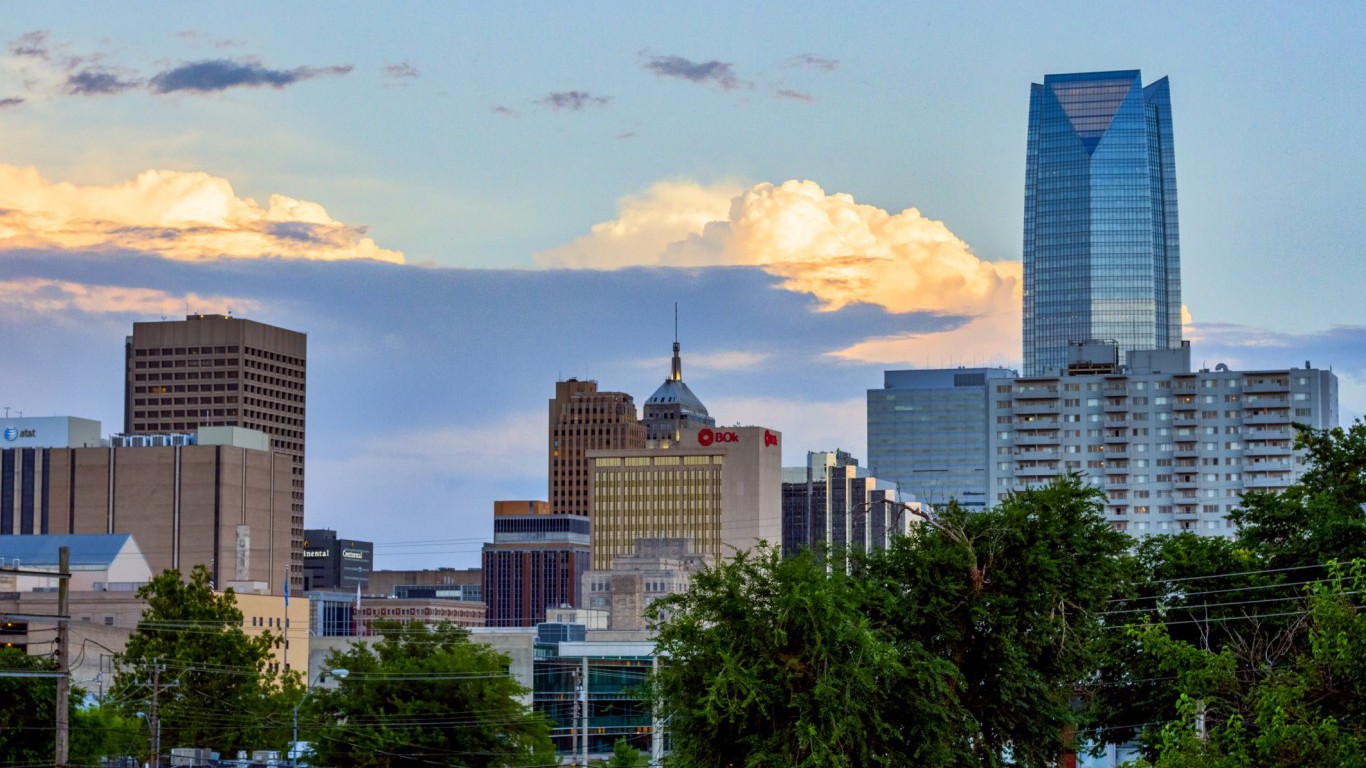
4. Oklahoma
> Gov’t. employees, 2017: 21.1% of workforce
> Gov’t. employment change, 2007-2017 +4.9% (333,900 to 350,100)
> State gov’t. spending per capita: $6,113 (17th least)
> Population density: 54.7 per sq. mi. (16th lowest)
Source: Thinkstock
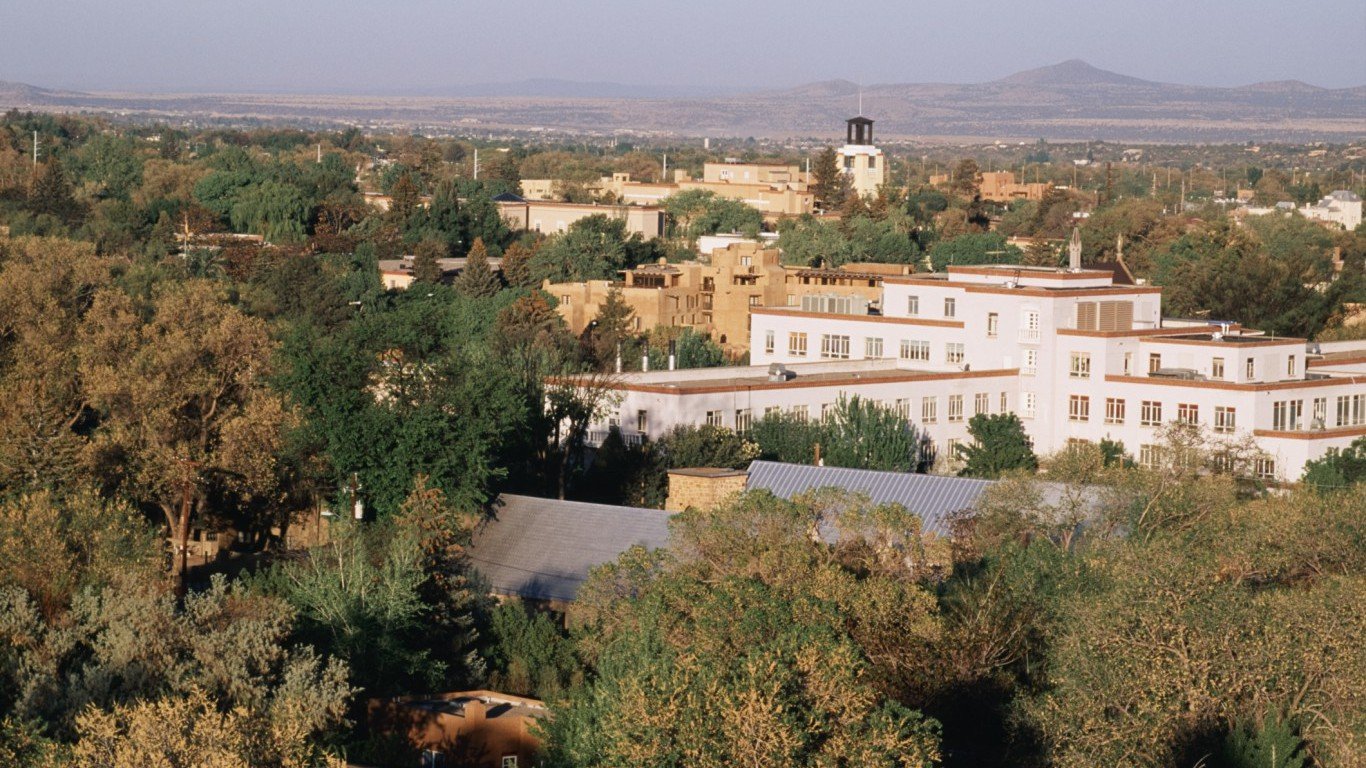
3. New Mexico
> Gov’t. employees, 2017: 22.5% of workforce
> Gov’t. employment change, 2007-2017 -4.3% (194,800 to 186,500)
> State gov’t. spending per capita: $9,632 (5th most)
> Population density: 17.0 per sq. mi. (6th lowest)
Source: Thinkstock
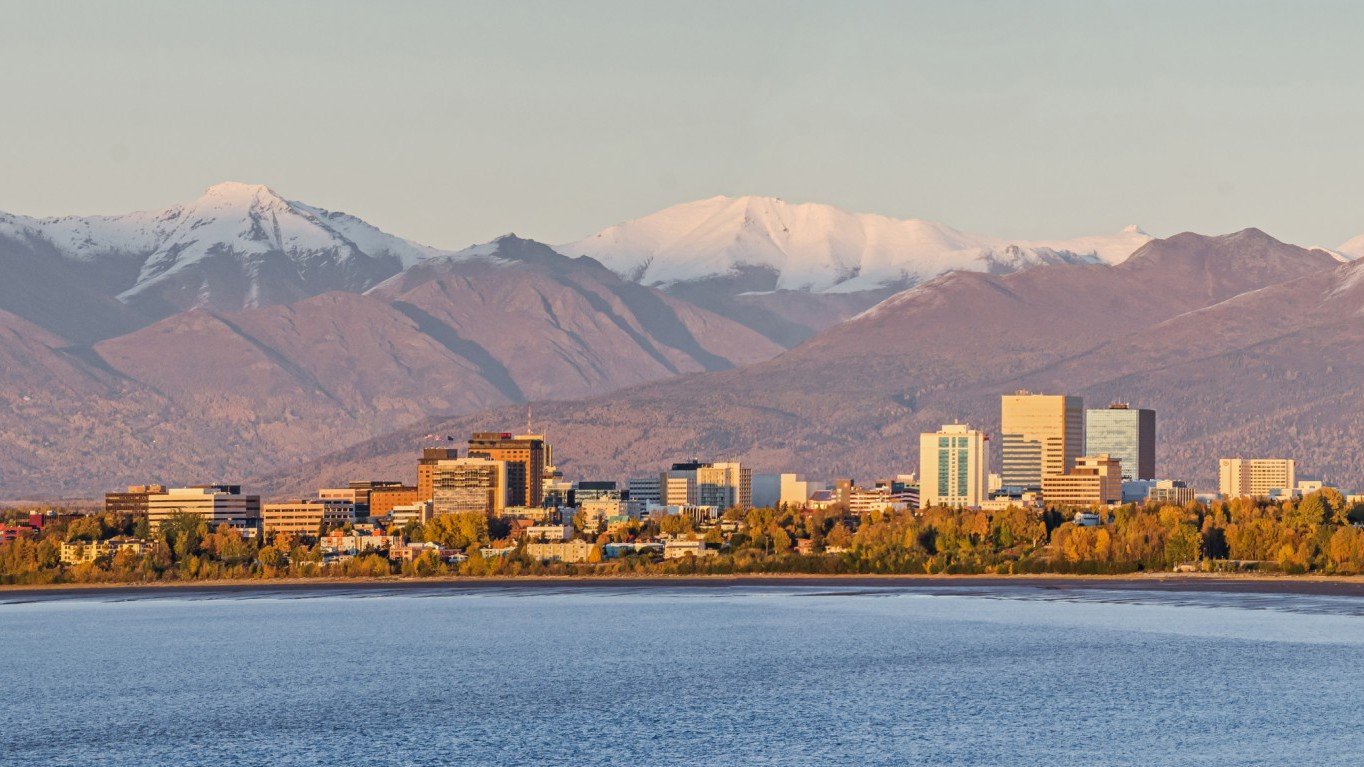
2. Alaska
> Gov’t. employees, 2017: 24.6% of workforce
> Gov’t. employment change, 2007-2017 -0.1% (81,100 to 81,000)
> State gov’t. spending per capita: $17,532 (the most)
> Population density: 1.2 per sq. mi. (the lowest)
[in-text-ad-2]
Source: aoldman / iStock
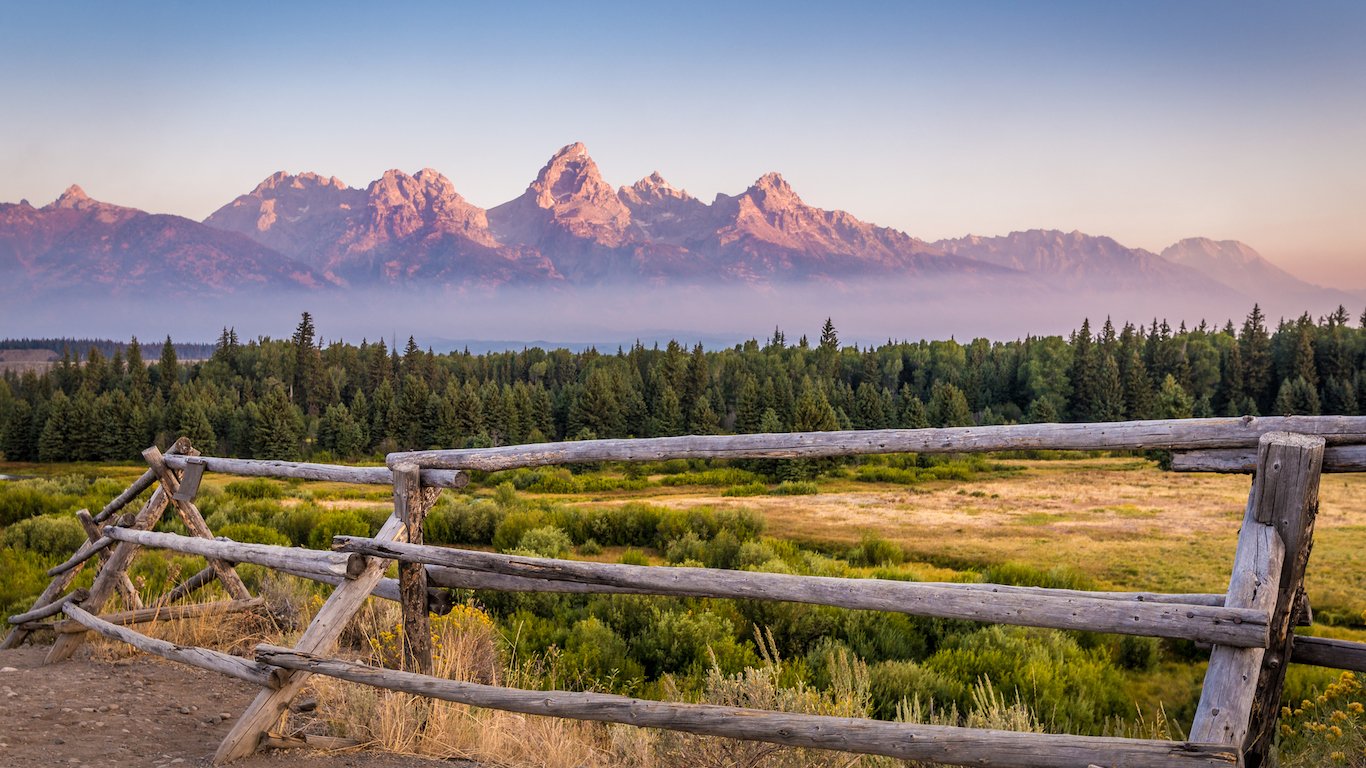
1. Wyoming
> Gov’t. employees, 2017: 24.9% of workforce
> Gov’t. employment change, 2007-2017 +4.5% (67,100 to 70,100)
> State gov’t. spending per capita: $10,942 (2nd most)
> Population density: 5.8 per sq. mi. (2nd lowest)
Detailed Findings & Methodology
The vast majority of government employees — 64.4% — actually work at the local level. In comparison, only 12.6% of government jobs nationwide are at the federal level, and 23.1% are at the state level.
Local government jobs include those employed in the administrative organization and management of cities, counties, and districts, as well as workers who help maintain public services such as education and waste management.
States with a low share of government jobs tend to be “more diversified economies,” Kohli explained. “The fact that there’s a lot of other economic activity means that government will be a smaller share of employment, because there’s so much other employment.”
While population density appears to be a significant factor in the share of government employees, the states with relatively smaller public sectors have shed state, federal, and local government jobs in the past few years. Meanwhile, the states with high government employment have added more public sector employees. In eight of the 10 states where government jobs represent the smallest percentage of total employment, government employment fell. Among the 10 states with the relatively largest public sectors, total government employment increased in all but three.
To determine government employment at the state, local, and federal level as a share of total employment in each state, 24/7 Wall St. used employment data from the Bureau of Labor Statistics for 2017. State employment-to-population ratios are also from the BLS. Population density is from the U.S. Census Bureau’s 2016 American Community Survey. Total state government spending figures come from Census Bureau’s State and Local Government Finances Snapshot for 2015. Our per capita adjustment is based on population figures from the U.S. Census Bureau’s Population Estimates Program and are for 2015.
Sponsored: Want to Retire Early? Here’s a Great First Step
Want retirement to come a few years earlier than you’d planned? Or are you ready to retire now, but want an extra set of eyes on your finances?
Now you can speak with up to 3 financial experts in your area for FREE. By simply clicking here you can begin to match with financial professionals who can help you build your plan to retire early. And the best part? The first conversation with them is free.
Click here to match with up to 3 financial pros who would be excited to help you make financial decisions.
Thank you for reading! Have some feedback for us?
Contact the 24/7 Wall St. editorial team.
Editors' Picks

