Income inequality is a growing issue in the United States, garnering increasing political attention as the middle class continues to shrink and the gap between the rich and the poor grows. Still, income inequality is not a uniquely American issue. In countries across Africa, Asia, Europe, and the Americas, income inequality is almost as bad — or often worse — as it is in the United States.
In cities around the world, where ostentatious wealth exists alongside abject poverty, the stark gap between rich and poor is easy to spot. However, it is more difficult to assess the extent of income inequality on a national scale.
Income inequality across a population is quantified using a measure known as the Gini coefficient. On the Gini scale, inequality is measured from 0 to 1 — where 0 represents a perfectly equal society, and 1 represents extreme inequality where a single individual controls all the wealth.
24/7 Wall St. reviewed the Gini coefficient of 42 countries from the Organization for Economic Cooperation and Development to identify the countries with the widest gaps between the rich and the poor. Both OECD member states and affiliated states were considered.
Click here to see the countries with the widest gaps between rich and poor.
Click here to see our methodology and detailed findings.

Source: KavalenkavaVolha / iStock
15. Latvia
> Gini coefficient: 0.35 (pre-tax+transfers: 0.48)
> Unemployment: 9.6%
> GDP per capita: $25,180
> Poverty: 14.0%
> Population: 2.0 million
Latvia has the 15th highest income inequality among OECD member states and partner states, narrowly edging out another European country, Spain. More progressive tax policies can help narrow the income gap, and most OECD countries have been better able to use those policies to reduce the gap between their rich and poor than Latvia. The Baltic country’s Gini coefficient improves just 27.6% after taxes and transfers, a smaller improvement than in the majority of countries considered.
Some 9.6% of the Latvian labor force are unemployed, which is one of the higher rates among OECD nations and partner states. A weak job market can exacerbate income inequality considerably.
[in-text-ad]

Source: stefaniedesign / iStock
14. New Zealand
> Gini coefficient: 0.35 (pre-tax+transfers: 0.46)
> Unemployment: 5.1%
> GDP per capita: $35,463
> Poverty: 10.9%
> Population: 4.7 million
New Zealand has a greater degree of income inequality than all but 13 other OECD countries and partner states. Income inequality persists in New Zealand despite the country’s relatively healthy labor market. Not only is the country’s 5.1% unemployment rate lower than that of most countries considered, but also New Zealand’s labor force participation rate is far higher than typical. Some 69.3% of New Zealanders age 15 years and older are in the workforce, the third largest participation rate among OECD member and partner states.
While a high labor force participation rate and low unemployment can help minimize income inequality, tax policy also makes a difference — and New Zealand’s does not appear to be especially effective. The country’s Gini coefficient improves by only 25% after taxes and transfers, a smaller change than in the majority of OECD affiliated countries.

Source: Leonid Andronov / iStock
13. United Kingdom
> Gini coefficient: 0.36 (pre-tax+transfers: 0.52)
> Unemployment: 4.8%
> GDP per capita: $40,185
> Poverty: 10.4%
> Population: 65.6 million
One of the wealthiest countries in the world, the U.K.’s GDP per capita of $40,185 is higher than the GDP per capita of the vast majority of countries. However, as is often the case in high income areas, wealth is unevenly distributed in the country. Geographically, wealth is generally concentrated in London — one of the financial capitals of the world — and other parts of Southeast England. Meanwhile, the more northern regions of the country tend to be lower income — often benefiting from government social spending. Indeed, the high degree of income inequality in the U.K. is not the result of a regressive tax policy. The country allocates one-quarter of its annual GDP to social spending programs, more than in most OECD countries and affiliates.

Source: Thinkstock
12. Israel
> Gini coefficient: 0.36 (pre-tax+transfers: 0.44)
> Unemployment: 4.8%
> GDP per capita: $33,101
> Poverty: 18.6%
> Population: 8.5 million
Israel’s GDP per capita of $33,101 is closer to the middle of all OECD countries and partner states. Despite having a somewhat average GDP per capita, relative to OECD nations, 18.6% of the country’s population lives below the poverty line, the fourth highest poverty rate of all countries considered. The relatively high degree of income inequality in Israel is due in part to relatively low labor force participation, particularly among men in their prime working age. Just 76.0% of Israeli men between the ages of 15 and 64 are working or actively looking for work, a smaller share than in most OECD countries and affiliates.
Income inequality would also likely be reduced if the Middle Eastern nation put greater emphasis on social spending. Israel spends the equivalent of 16.8% of its GDP on social programs such as benefits for the unemployed or low income households, one of the smallest shares among the countries considered.
[in-text-ad-2]

Source: VladimirSklyarov / iStock
11. Lithuania
> Gini coefficient: 0.37 (pre-tax+transfers: 0.52)
> Unemployment: 7.9%
> GDP per capita: $29,420
> Poverty: 12.4%
> Population: 2.9 million
Lithuania has higher income inequality than all but 10 OECD nations and affiliates. Despite the high level of inequality, the country is fairly average among the countries considered in many key economic indicators. Some 60.5% of Lithuanians age 15 and up are either employed or looking for a job, and taxes and transfers improve the country’s Gini coefficient by 27.8%.
No OECD nation’s population is shrinking as fast as Lithuania’s. The Baltic country’s population declined by 1.3% in 2016, a time when most of those countries grew. A shrinking workforce could make it difficult for Lithuania’s economy to grow in the future. Nobel Prize-winning economist Simon Smith Kuznets theorized that a declining population could be detrimental to a nation’s economy, which may exacerbate problems related to income inequality.

Source: Thinkstock
10. Russian Federation
> Gini coefficient: 0.38 (pre-tax+transfers: 0.49)
> Unemployment: 5.5%
> GDP per capita: $25,353
> Poverty: N/A
> Population: 144.3 million
The Russian Federation has the 10th-largest income gap among OECD countries and affiliates. Russia has the world’s sixth highest GDP at more than $3.5 trillion, but much of that wealth is disproportionately concentrated in the hands of a few.
Corruption may be a causal factor for the large income gap in the Russian Federation. The Russian government holds tight control over business within the country. Oligarchs with close ties to the Kremlin are able to leverage those relationships into lucrative business deals. This system continually funnels money into the pockets of the rich and leaves little for working class citizens. Russia is tied with Mexico as the most corrupt country in the OECD — and one of the most corrupt countries in the world — according to the Corruption Perception Index.
[in-text-ad]

Source: frankpeters / iStock
9. United States
> Gini coefficient: 0.39 (pre-tax+transfers: 0.51)
> Unemployment: 4.9%
> GDP per capita: $54,198
> Poverty: 17.2%
> Population: 323.1 million
The United States’ economic indicators generally point to a robust economy. The U.S.’s GDP per capita of over $54,000 is among the highest in the world, and the unemployment rate is relatively low at 4.9%. Also, the U.S. GDP at purchasing power parity is the world’s second largest at $17.3 trillion. However, the benefits of a strong economy are not evenly felt among the population. The U.S. poverty rate of 17.2% is one of the highest among OECD countries.
U.S. taxes and transfers reduce the Gini coefficient by just 22.9%, a lower percentage than most nations considered. Income inequality persists in the United States despite high social spending. The United States spends 28.8% of its annual GDP on social programs that aid financially struggling Americans, the second largest share among countries considered, trailing only France.
 24/7 Wall St.
Source: Thinkstock
8. Turkey
> Gini coefficient: 0.40 (pre-tax+transfers: 0.43)
> Unemployment: 10.8%
> GDP per capita: $24,496
> Poverty: 17.1%
> Population: 79.5 million
Turkey has a wide gap between its richest and poorest citizens, and its tax code is doing little to shrink the divide. Turkey’s Gini coefficient decreases by only 5.8% after taxes and transfers. For context, factoring in taxes and transfers reduces the Gini coefficient by at least 20% in 32 of the 42 countries considered.
Turkey’s job market is struggling, as just 51.8% of Turks 15 and older are either employed or seeking a job. This labor participation rate is the second lowest of all countries considered, trailing only Italy. The country’s unemployment rate of 10.8% and poverty rate of 17.1% are among the highest for OECD nations or affiliates. Higher labor force participation and employment rates can help shrink the divide between rich and poor.

Source: Individuo from Santiago, Chile / Wikimedia Commons
7. Chile
> Gini coefficient: 0.45 (pre-tax+transfers: 0.49)
> Unemployment: 6.7%
> GDP per capita: $22,350
> Poverty: 16.8%
> Population: 17.9 million
Chile’s income inequality is high, and the nation’s tax structure does little to close the gap between the rich and the poor. Taxes and transfers shrink Chile’s Gini coefficient by 6.6%, one of the lowest decreases among OECD countries. Chile spends 12.0% of its GDP on social programs to aid financially struggling citizens, one of the lowest percentages among OECD nations. Programs to encourage increased labor force participation among women would likely help reduce income inequality in the South American nation. Only about half of women 15 and older in Chile are either working or looking for a job, a smaller than typical share.
Chile, like many of the other OECD nations with the highest income inequality, also has a relatively low GDP per capita at $22,350.
[in-text-ad-2]

Source: Thinkstock
6. Mexico
> Gini coefficient: 0.46 (pre-tax+transfers: 0.48)
> Unemployment: 3.9%
> GDP per capita: $18,129
> Poverty: 16.7%
> Population: 127.5 million
Income inequality is a bigger problem in Mexico than in all but five other OECD countries and partner states. One reason for the high level of inequality is the country’s large share of low income workers. Some 24.7 million workers in Mexico hold minimum wage jobs, and Mexico’s minimum wage is the lowest among OECD nations.
Corruption in Mexico likely exacerbates income inequality. Based on citizens’ perceptions of government and institutional corruption, Mexico is tied with Russia as the most corrupt country of those considered, and one of the most corrupt in the world. Likely due in part to government fraud, waste, and abuse, income inequality in Mexico improves by only 4% after taxes and transfers, a smaller improvement than in all but two other OECD nations or partners.

Source: Thinkstock
5. Brazil
> Gini coefficient: 0.47 (pre-tax+transfers: 0.58)
> Unemployment: 11.6%
> GDP per capita: $14,212
> Poverty: 20.0%
> Population: 207.7 million
Many Brazilians blame government corruption for the wide wealth gap between the country’s rich and poor. Brazil has faced economic turmoil over the past few years stemming from scandals involving Petrobras, a majority state-owned oil company. Business leaders and government officials reportedly inflated Petrobras contract prices and embezzled over $2 billion, which they used for personal and political gain.
Though Brazil’s GDP at purchasing power parity is nearly $3 trillion and one of the highest in the world, its GDP per capita is just $14,212, lower than in all but two other considered nations. Brazil’s unemployment rate spiked in the wake of the Petrobras scandal, as well as numerous other corruption allegations. The political landscape is so unstable, Brazil could lapse back into another recession. Once at 6.5%, Brazil’s unemployment rate now sits at 11.6%.
[in-text-ad]
Source: Wikipedro / Wikimedia Commons
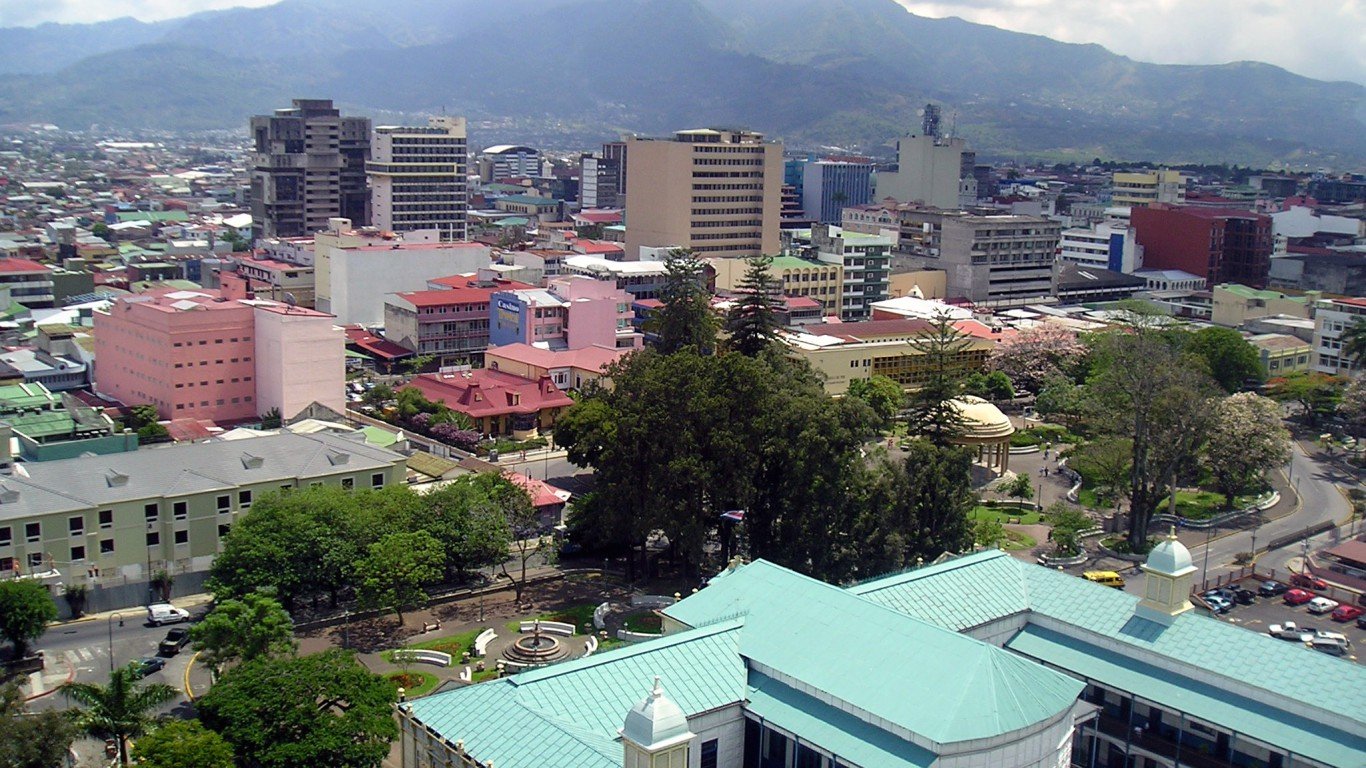
4. Costa Rica
> Gini coefficient: 0.48 (pre-tax+transfers: 0.48)
> Unemployment: 9.0%
> GDP per capita: $15,373
> Poverty: 21.0%
> Population: 4.9 million
Costa Rica has the worst income inequality of any North American country considered. Some 21% of Costa Ricans live in poverty, the second highest poverty rate of any OECD member or affiliate. Income inequality in Costa Rica would likely be reduced with a more progressive tax policy — which could help reduce poverty rates. Costa Rica is the only country considered in which income inequality is effectively unchanged after taxes and transfers.
A higher minimum wage and programs to encourage female workforce participation would also likely reduce inequality. Currently, Costa Rica has one of the lowest minimum wages of any OECD nation or affiliate, and only about 45% of women age 15 and older in Costa Rica are either employed or looking for a job, also one of the smallest shares of any country considered.
 24/7 Wall St.
Source: Thinkstock
3. India
> Gini coefficient: 0.50 (pre-tax+transfers: 0.51)
> Unemployment: 3.5%
> GDP per capita: $6,543
> Poverty: N/A
> Population: 1.3 billion
Though India’s unemployment rate of 3.5% is one of the lowest of any OECD country or affiliate, it has one of the largest divides between rich and poor. A strong job market alone does not alleviate income inequality. This could be partially due to the fact that just 56.2% of India’s working age population participates in the labor force, the lowest rate among considered countries. High labor force participation can help boost a country’s economy and decrease inequality.
In a country of 1.3 billion people, the tax structure does not redistribute the wealth to the extent that it does in the majority of OECD countries and affiliates. India’s Gini coefficient changes by less than 3.0% after taxes and transfers. Only Costa Rica has a smaller decline in its Gini coefficient after taxes and transfers.

Source: Thinkstock
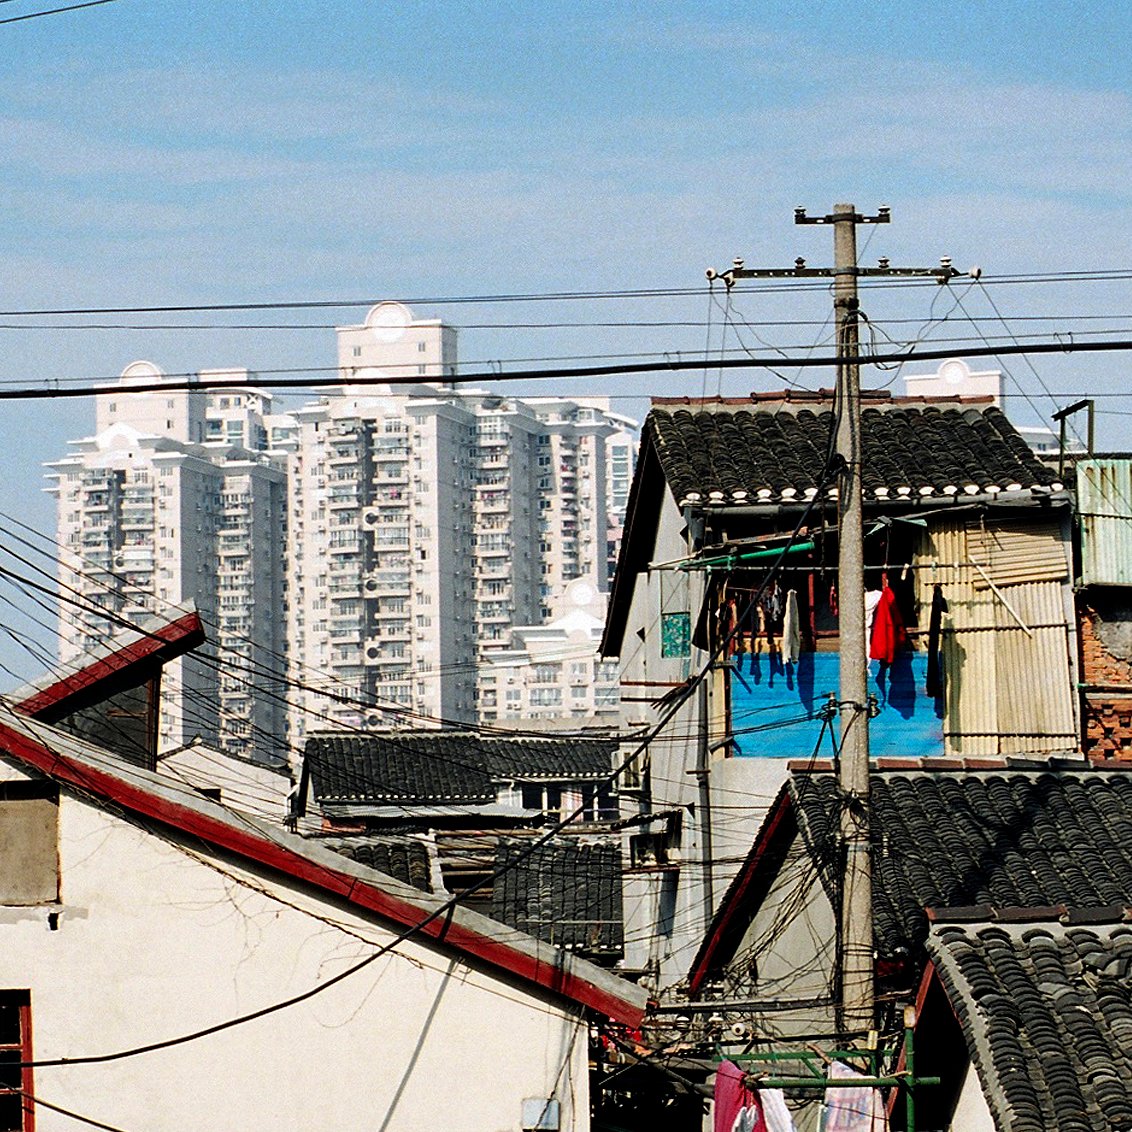
2. China
> Gini coefficient: 0.51 (pre-tax+transfers: 0.55)
> Unemployment: 4.6%
> GDP per capita: $15,175
> Poverty: N/A
> Population: 1.4 billion
Some 69.4% of Chinese citizens 15 and older participate in the labor force, the second highest participation rate among nations considered, behind only Iceland. Despite the high participation rate and relatively low unemployment rate of 4.7% there is a large income gap between China’s rich and poor citizens.
China’s GDP per capita of $15,175 is one of the lowest among OECD countries and partner states. But with a population of nearly 1.4 billion, China’s GDP at purchasing power parity is nearly $19.9 trillion, 18.2% of the world’s GDP at PPP — a higher share than any other country.
[in-text-ad-2]

Source: Thinkstock
1. South Africa
> Gini coefficient: 0.62 (pre-tax+transfers: 0.72)
> Unemployment: 26.5%
> GDP per capita: $12,337
> Poverty: 26.6%
> Population: 56.0 million
Income inequality in South Africa is the worst among OECD countries and affiliates. The African nation’s Gini coefficient of 0.62 is considerably higher than all other countries considered. The nation’s Gini coefficient drops by just 13.3% after taxes and transfers — a small improvement relative to the majority of countries considered.
Countries with high income inequality often struggle with a lagging economy, and South Africa is a prime example. The country’s GDP per capita of $12,337 is the second lowest in the OECD and its partners. Some 26.5% of the labor force is unemployed, and 26.6% of the population live in poverty — the highest unemployment and poverty rates among OECD nations and partners.
Corruption issues have also plagued South Africa. Former President Jacob Zuma was ousted after a no-confidence vote in April 2018 and had been charged with fraud and racketeering in connection with an arms deal from 1999. Zuma denies the charges.
Detailed Findings & Methodology:
Among OECD countries, income inequality ranges from Iceland’s Gini coefficient of 0.25 to South Africa’s score of 0.62. The United States’ Gini coefficient of 0.39 is the ninth highest — the ninth worst income inequality — among the 42 OECD members and affiliates.
The countries with the worst income inequality are also often poor. The eight countries with the highest Gini coefficients also have the eight lowest GDPs per capita among the OECD member and affiliate states considered.
However, a high degree of income inequality is not exclusively an attribute of poor countries. The United States is one of the wealthiest countries in the world with a GDP per capita of $54,198 and an economy that accounts for over 15% of global output. Still, the United States ranks among the 10 countries with the worst income inequality.
The causes of income inequality extend beyond just salaries and wages. Often, governments will invest in social programs that provide assistance to citizens who are struggling financially — effectively redistributing resources. How much a given government invests in such programs also can have a meaningful impact on income inequality.
The countries on this list are ranked by their Gini coefficient after taxes and transfers. In almost every OECD member and partner state, the Gini coefficient is considerably lower after government taxes and transfers are factored in. However, in the countries with the highest income inequality, tax policy is often less progressive, meaning changes in income inequality after taxes are often less drastic.
For example, Costa Rica’s pre-tax Gini coefficient of 0.48 falls close to the middle of OECD member states and partners. After taxes and transfers, the country’s Gini coefficient improves negligibly. As a result, Costa Rica has the fourth worst income inequality of any country considered.
Because government policy can have a considerable impact on income inequality, government corruption can too. Waste, fraud, and abuse among institutions and policymakers can be common in nations with high income inequality. Some countries with high Gini coefficients, like Mexico and Russia, are also among the most corrupt in the world, based on the perceptions of their citizens.
Distributing tax dollars to needy citizens and thereby reducing income inequality is predicated upon having a strong tax base, and many countries struggling with high income inequality also have high unemployment and low labor force participation rates, leaving governments with little in the way of resources for social spending.
Three countries on this list — including South Africa, the country with the worst income inequality — have double digit unemployment rates. Many also have low labor force participation. in four countries on this list, less than 60% of the population 15 and older is either employed or looking for a job.
To determine the countries with the most uneven distribution of income, 24/7 Wall St. reviewed post-tax and transfer Gini coefficients published by the Organization for Economic Cooperation and Development. We also considered data on GDP at purchasing power parity, poverty rate, unemployment, GDP per capita, as well as social spending (which the OECD defines as “cash benefits, direct in-kind provision of goods and services, and tax breaks with social purposes”), all from the OECD. All figures are for the most recently available year. All ranks are out of the OECD member and affiliated states with data available.
Take This Retirement Quiz To Get Matched With An Advisor Now (Sponsored)
Are you ready for retirement? Planning for retirement can be overwhelming, that’s why it could be a good idea to speak to a fiduciary financial advisor about your goals today.
Start by taking this retirement quiz right here from SmartAsset that will match you with up to 3 financial advisors that serve your area and beyond in 5 minutes. Smart Asset is now matching over 50,000 people a month.
Click here now to get started.
Thank you for reading! Have some feedback for us?
Contact the 24/7 Wall St. editorial team.
Editors' Picks

