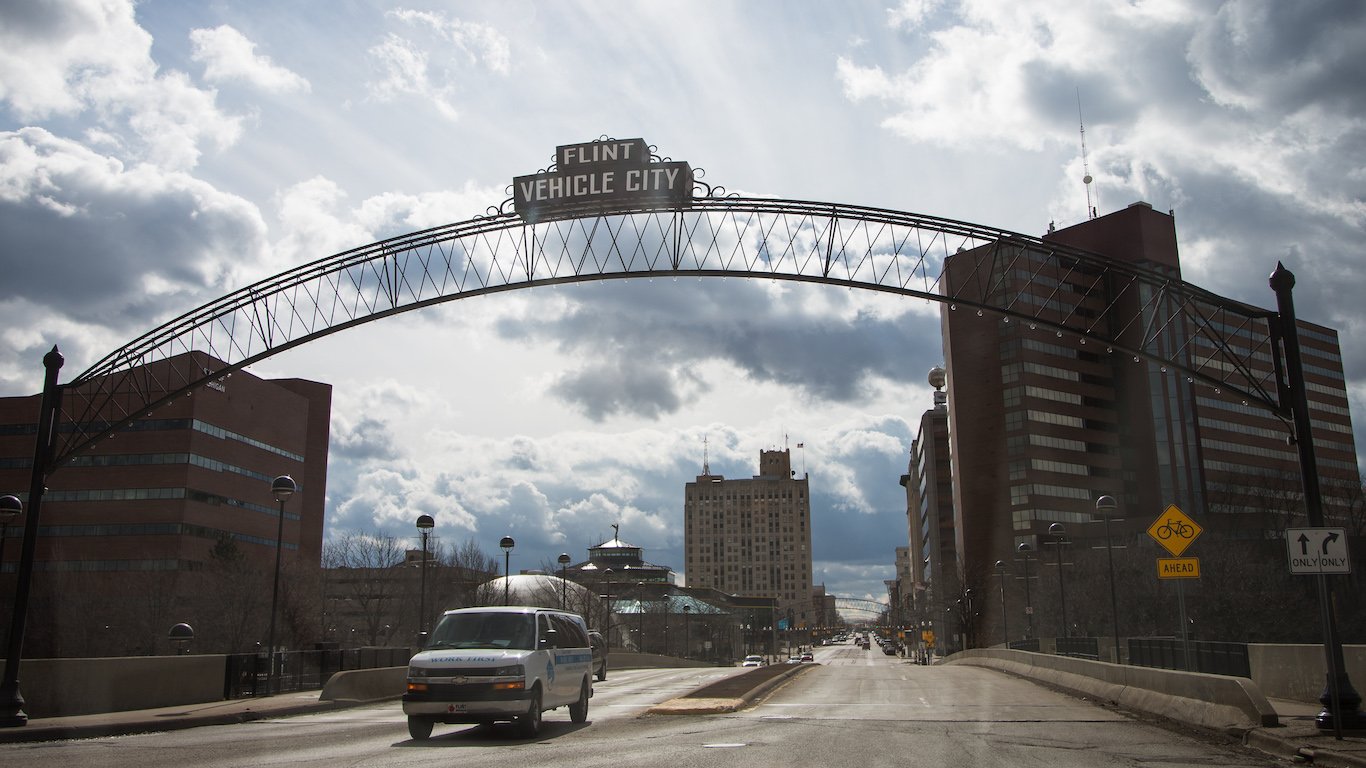
With the world’s largest economy and a high standard of living, the United States is the most popular destination for international migrants by a wide margin. Recent estimates from the United Nations put the number of immigrants living in the U.S. at nearly 51 million in 2020, more than triple the number residing in Germany, the country with the second largest immigrant population. (Here is a look at the best city to live in every state.)
However, many parts of the country fail to live up to America’s reputation as “the land of opportunity.” In cities and towns across the United States, quality of life is diminished by widespread poverty, high crime rates, weak job markets, and limited access to essential services, among other factors.
Using data from the Census Bureau, the FBI, and the Centers for Disease Control and Prevention, 24/7 Wall St. created a weighted index of 22 measures to identify the 50 worst U.S. cities to live in. The measures used in the index fall into one of three broad categories: economy, community, and overall quality of life. We considered all places in the U.S. with sufficient data and populations of at least 8,000. Our list includes cities, towns, villages, boroughs, and unincorporated communities. To avoid geographic clustering, we only considered the lowest-ranking place in a given county.
Many of the communities on this list are among the poorest places in the country. Nearly all of them have poverty rates that exceed the 12.6% national rate (based on 2022 American Community Survey data), and in the vast majority, the typical household earns between $30,000 and $45,000 less annually than the typical American household earns. Many of the places on the list have been hit hard by the ongoing opioid epidemic, with fatal overdose rates as much as 350% higher than the national average of 28.5 overdose deaths per 100,000 people a year.
Though the 50 cities and towns on this list span the country, they are largely clustered in the South, including five in both Louisiana and North Carolina. Just six of the worst places to live are in the Midwest, while four are in the West, and only three are in the Northeast.
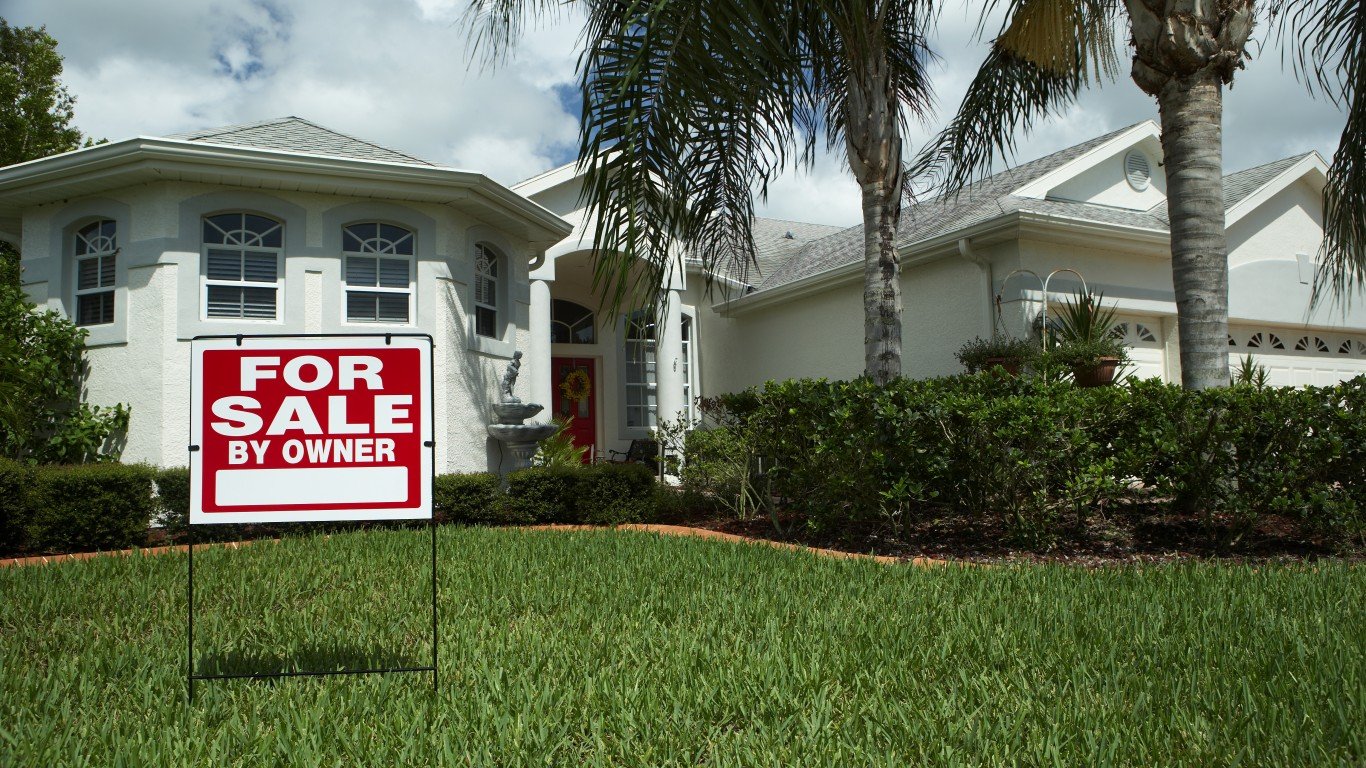
In many of these places, the state of the housing market may be a reflection of the low overall quality of life. Home prices tend to fall when demand declines, and in every city and town on this list, the typical home is worth at least $53,000 less than the $244,900 national median home value, based on the latest census estimates. And in nearly half of these places, most homes are worth less than $100,000. (Here is a look at the cheapest city to buy a home in your state.)
Click here to see the worst cities to live.
Click here to read our detailed methodology.

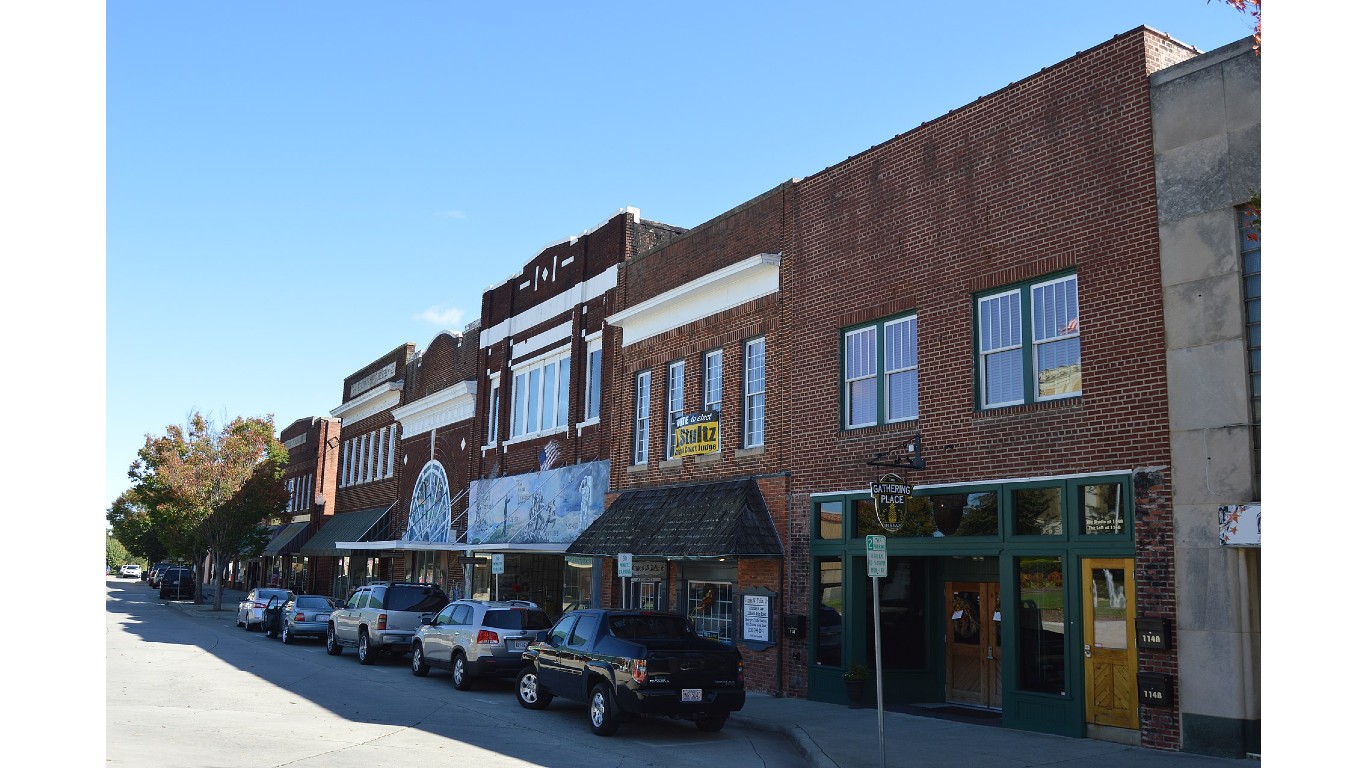
50. Dunn, North Carolina
> Poverty rate: 23.2%
> Median home value: $142,900
> Median household income: $37,409
> Drug-induced mortality: 37.9 deaths per 100,000
> Total population: 8,616
[in-text-ad]

49. Laurinburg, North Carolina
> Poverty rate: 33.2%
> Median home value: $108,600
> Median household income: $35,776
> Drug-induced mortality: 40.5 deaths per 100,000
> Total population: 15,242

Source: Patrick Baehl de Lescure / iStock via Getty Images
48. Palatka, Florida
> Poverty rate: 33.2%
> Median home value: $82,400
> Median household income: $28,082
> Drug-induced mortality: 35.3 deaths per 100,000
> Total population: 10,399

Source: Roberto Galan / iStock Editorial via Getty Images
47. Fitzgerald, Georgia
> Poverty rate: 24.0%
> Median home value: $85,100
> Median household income: $30,268
> Drug-induced mortality: N/A
> Total population: 9,028
[in-text-ad-2]

46. Crowley, Louisiana
> Poverty rate: 42.3%
> Median home value: $130,400
> Median household income: $28,775
> Drug-induced mortality: 36.4 deaths per 100,000
> Total population: 11,916

45. Cordele, Georgia
> Poverty rate: 39.5%
> Median home value: $77,700
> Median household income: $27,922
> Drug-induced mortality: N/A
> Total population: 10,316
[in-text-ad]

Source: Lana2011 / iStock via Getty Images
44. Muskegon Heights, Michigan
> Poverty rate: 33.7%
> Median home value: $45,500
> Median household income: $34,281
> Drug-induced mortality: 34.2 deaths per 100,000
> Total population: 10,058

Source: Bobak Ha'Eri / Wikimedia Commons
43. Orange Cove, California
> Poverty rate: 48.7%
> Median home value: $191,300
> Median household income: $28,626
> Drug-induced mortality: 18.6 deaths per 100,000
> Total population: 9,680

42. Beckley, West Virginia
> Poverty rate: 22.9%
> Median home value: $110,600
> Median household income: $39,845
> Drug-induced mortality: 129.1 deaths per 100,000
> Total population: 17,261
[in-text-ad-2]

41. Lancaster, South Carolina
> Poverty rate: 35.5%
> Median home value: $163,400
> Median household income: $29,738
> Drug-induced mortality: 51.1 deaths per 100,000
> Total population: 8,489

40. Cahokia, Illinois
> Poverty rate: 35.4%
> Median home value: $40,900
> Median household income: $30,556
> Drug-induced mortality: 36.5 deaths per 100,000
> Total population: 12,440
[in-text-ad]

39. Carneys Point, New Jersey
> Poverty rate: 10.5%
> Median home value: $147,200
> Median household income: $64,589
> Drug-induced mortality: 57.4 deaths per 100,000
> Total population: 8,091

Source: Roberto Galan / iStock Editorial via Getty Images
38. Mayfield, Kentucky
> Poverty rate: 29.9%
> Median home value: $107,400
> Median household income: $37,212
> Drug-induced mortality: N/A
> Total population: 10,041

37. Oak Hill, West Virginia
> Poverty rate: 19.5%
> Median home value: $103,800
> Median household income: $45,460
> Drug-induced mortality: 87.6 deaths per 100,000
> Total population: 8,228
[in-text-ad-2]
Source: jgareri / E+ via Getty Images
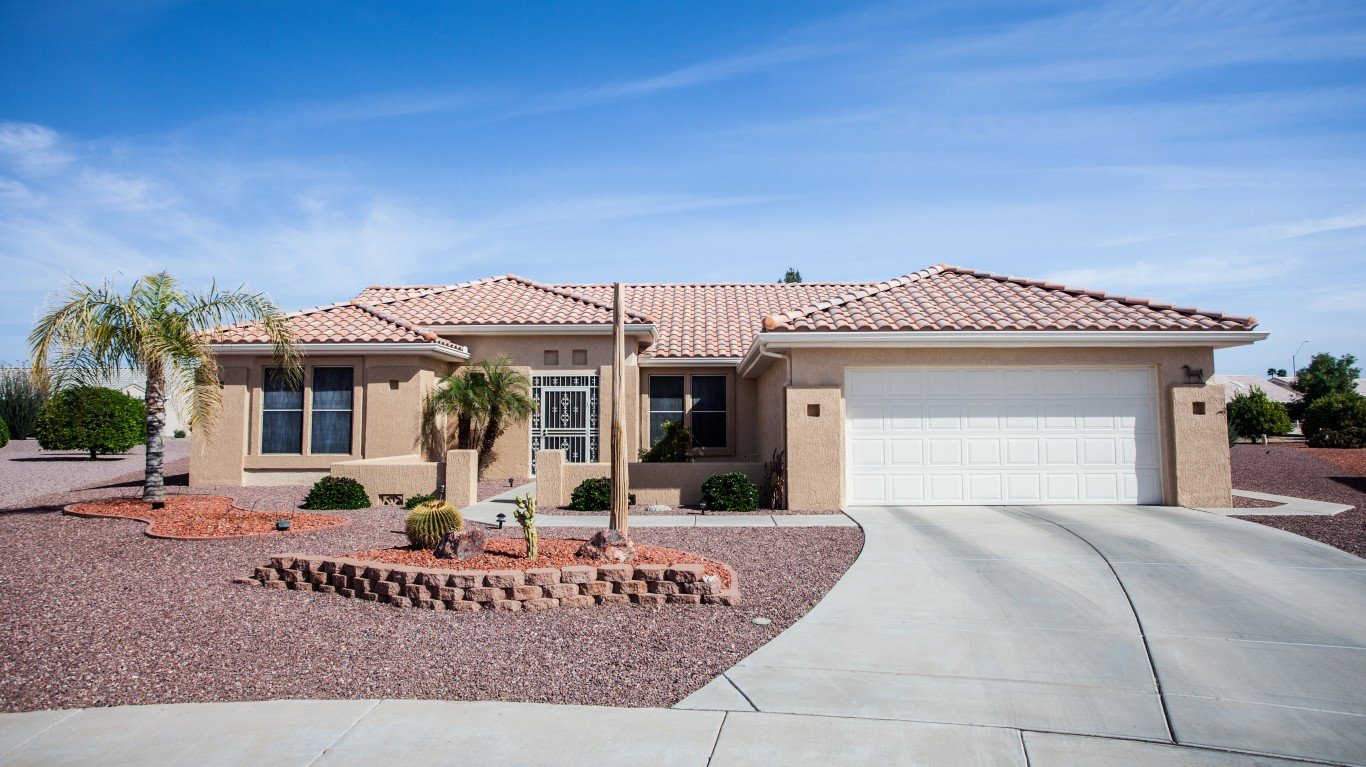
36. New Kingman-Butler, Arizona
> Poverty rate: 23.3%
> Median home value: $79,300
> Median household income: $39,139
> Drug-induced mortality: 27.8 deaths per 100,000
> Total population: 12,858
Source: BOB WESTON / Getty Images
35. DeRidder, Louisiana
> Poverty rate: 19.0%
> Median home value: $137,200
> Median household income: $50,889
> Drug-induced mortality: 20.5 deaths per 100,000
> Total population: 10,060
[in-text-ad]

34. Española, New Mexico
> Poverty rate: 19.9%
> Median home value: $165,600
> Median household income: $42,611
> Drug-induced mortality: 100.3 deaths per 100,000
> Total population: 10,492
 24/7 Wall St.
Source: ehrlif / iStock Editorial via Getty Images
33. Saginaw, Michigan
> Poverty rate: 35.6%
> Median home value: $43,900
> Median household income: $32,241
> Drug-induced mortality: 30.9 deaths per 100,000
> Total population: 44,796

32. Poteau, Oklahoma
> Poverty rate: 22.5%
> Median home value: $120,100
> Median household income: $40,711
> Drug-induced mortality: 18.9 deaths per 100,000
> Total population: 8,741
[in-text-ad-2]

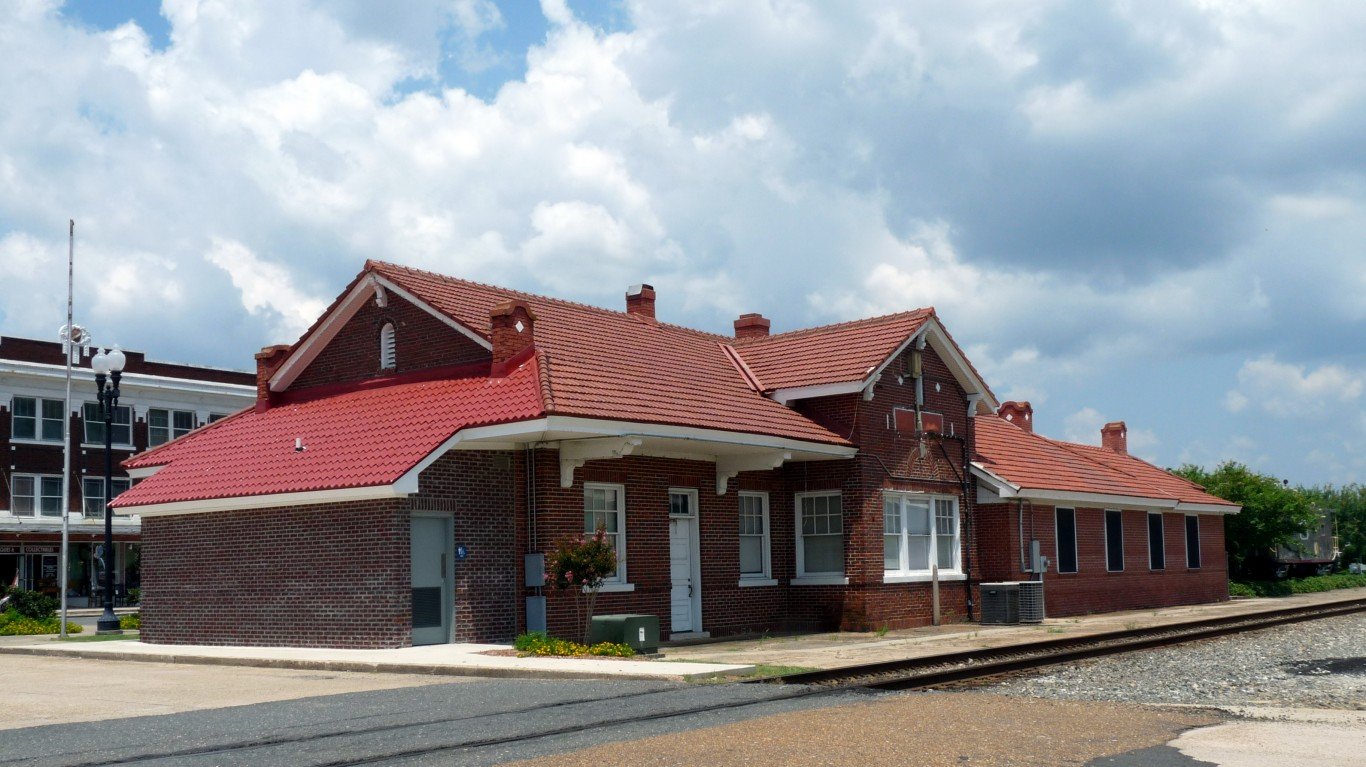
Source: JENNIFER E. WOLF / iStock Editorial via Getty Images
31. Monroe, Georgia
> Poverty rate: 33.7%
> Median home value: $161,400
> Median household income: $39,015
> Drug-induced mortality: 25.1 deaths per 100,000
> Total population: 14,675
")
30. Fort Valley, Georgia
> Poverty rate: 33.5%
> Median home value: $89,500
> Median household income: $30,574
> Drug-induced mortality: N/A
> Total population: 8,829
[in-text-ad]
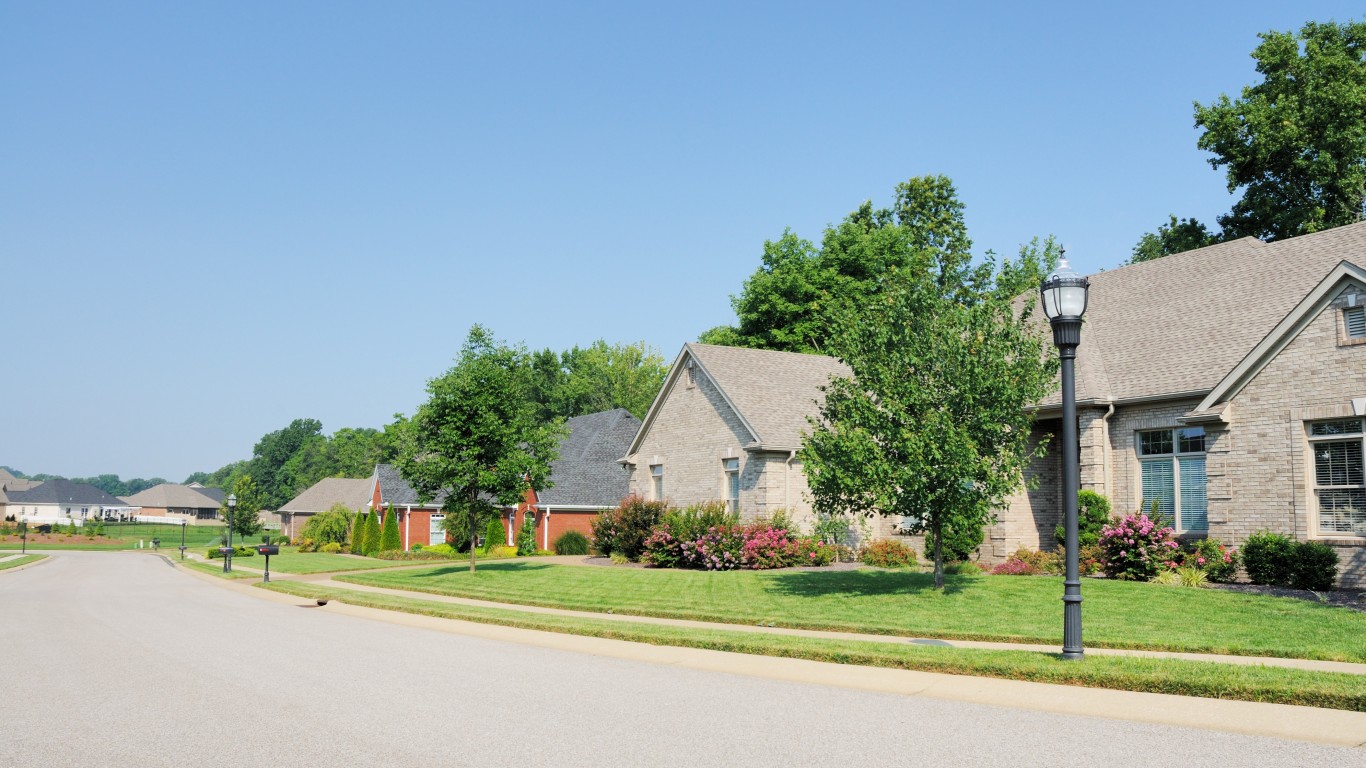
Source: Purdue9394 / iStock via Getty Images
29. Bloomingdale, Tennessee
> Poverty rate: 20.9%
> Median home value: $115,400
> Median household income: $45,726
> Drug-induced mortality: 37.2 deaths per 100,000
> Total population: 8,759

Source: Public Domain / Wikimedia Commons
28. Moody, Alabama
> Poverty rate: 11.8%
> Median home value: $177,500
> Median household income: $69,846
> Drug-induced mortality: 37.0 deaths per 100,000
> Total population: 13,100

27. Inkster, Michigan
> Poverty rate: 37.8%
> Median home value: $59,900
> Median household income: $34,122
> Drug-induced mortality: 48.5 deaths per 100,000
> Total population: 25,849
[in-text-ad-2]
Source: Public Domain / Wikimedia Commons
26. Roxboro, North Carolina
> Poverty rate: 40.3%
> Median home value: $84,900
> Median household income: $33,883
> Drug-induced mortality: 27.8 deaths per 100,000
> Total population: 8,097

Source: JerryGrugin / iStock Editorial via Getty Images
25. Somerset, Kentucky
> Poverty rate: 30.6%
> Median home value: $117,000
> Median household income: $30,107
> Drug-induced mortality: 42.4 deaths per 100,000
> Total population: 11,696
[in-text-ad]
Source: halbergman / iStock via Getty Images
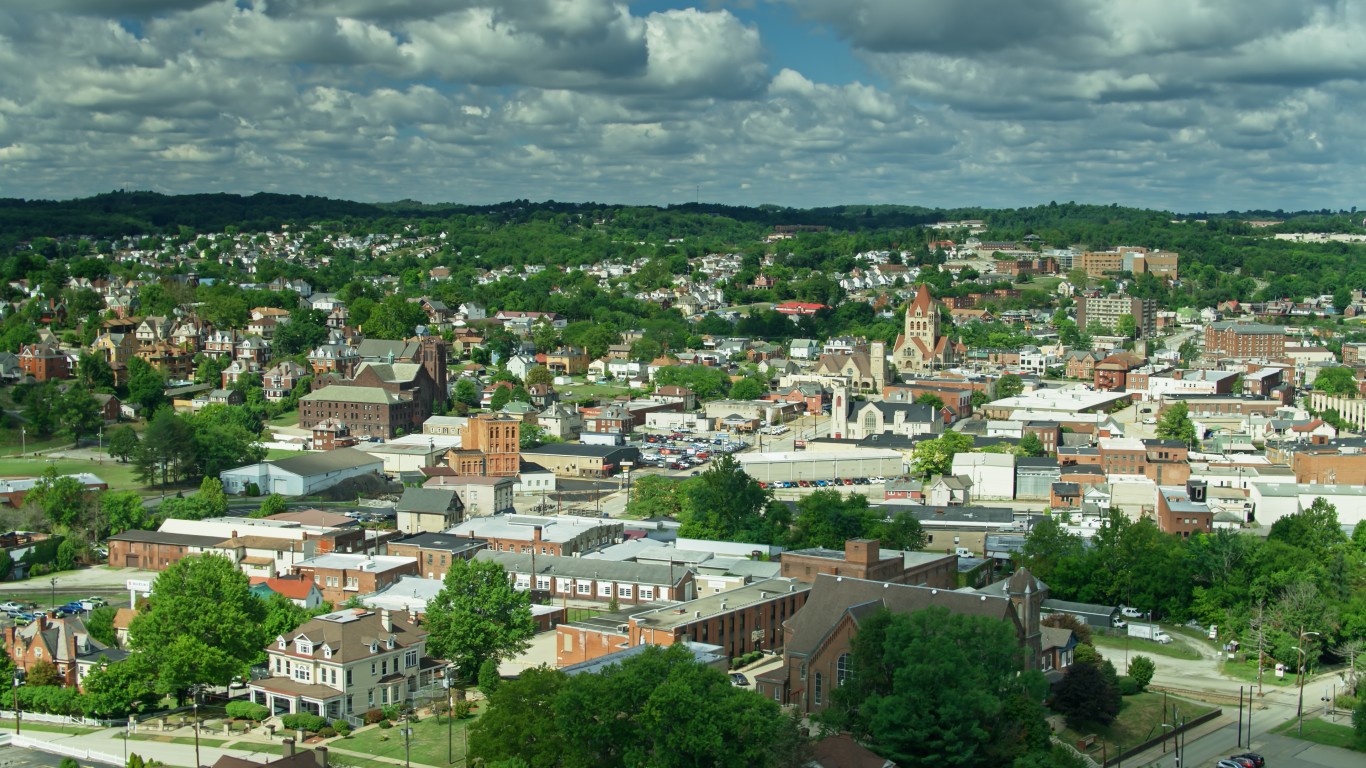
24. Uniontown, Pennsylvania
> Poverty rate: 24.8%
> Median home value: $81,700
> Median household income: $32,016
> Drug-induced mortality: 55.4 deaths per 100,000
> Total population: 9,988
 24/7 Wall St.
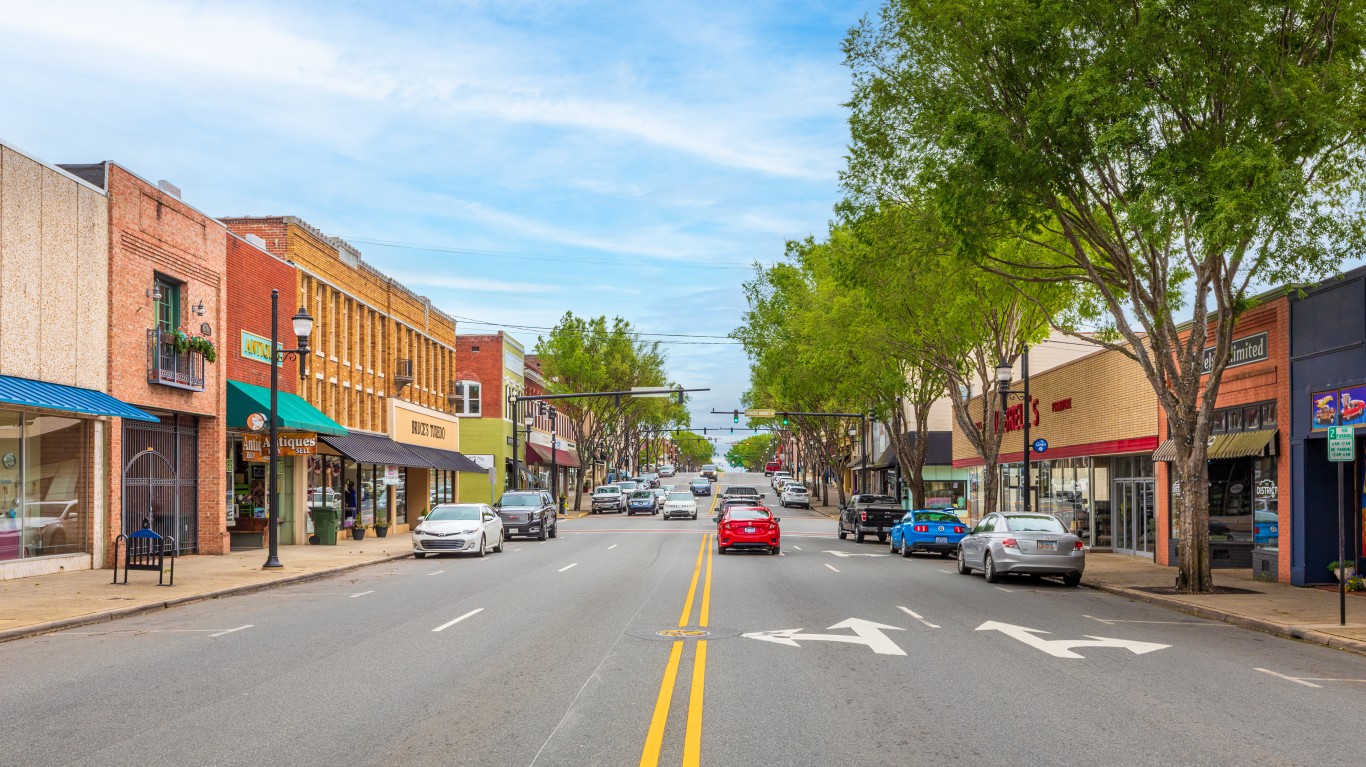
Source: J. Michael Jones / iStock Editorial via Getty Images
23. Lexington, North Carolina
> Poverty rate: 24.9%
> Median home value: $117,100
> Median household income: $32,698
> Drug-induced mortality: 50.6 deaths per 100,000
> Total population: 19,347

Source: BOB WESTON / iStock via Getty Images
22. Indianola, Mississippi
> Poverty rate: 30.8%
> Median home value: $100,300
> Median household income: $32,043
> Drug-induced mortality: N/A
> Total population: 9,679
[in-text-ad-2]

Source: thinkreaction / iStock via Getty Images
21. Silver Springs Shores, Florida
> Poverty rate: 16.9%
> Median home value: $138,000
> Median household income: $47,658
> Drug-induced mortality: 46.1 deaths per 100,000
> Total population: 25,363
Source: Wirestock / iStock Editorial via Getty Images
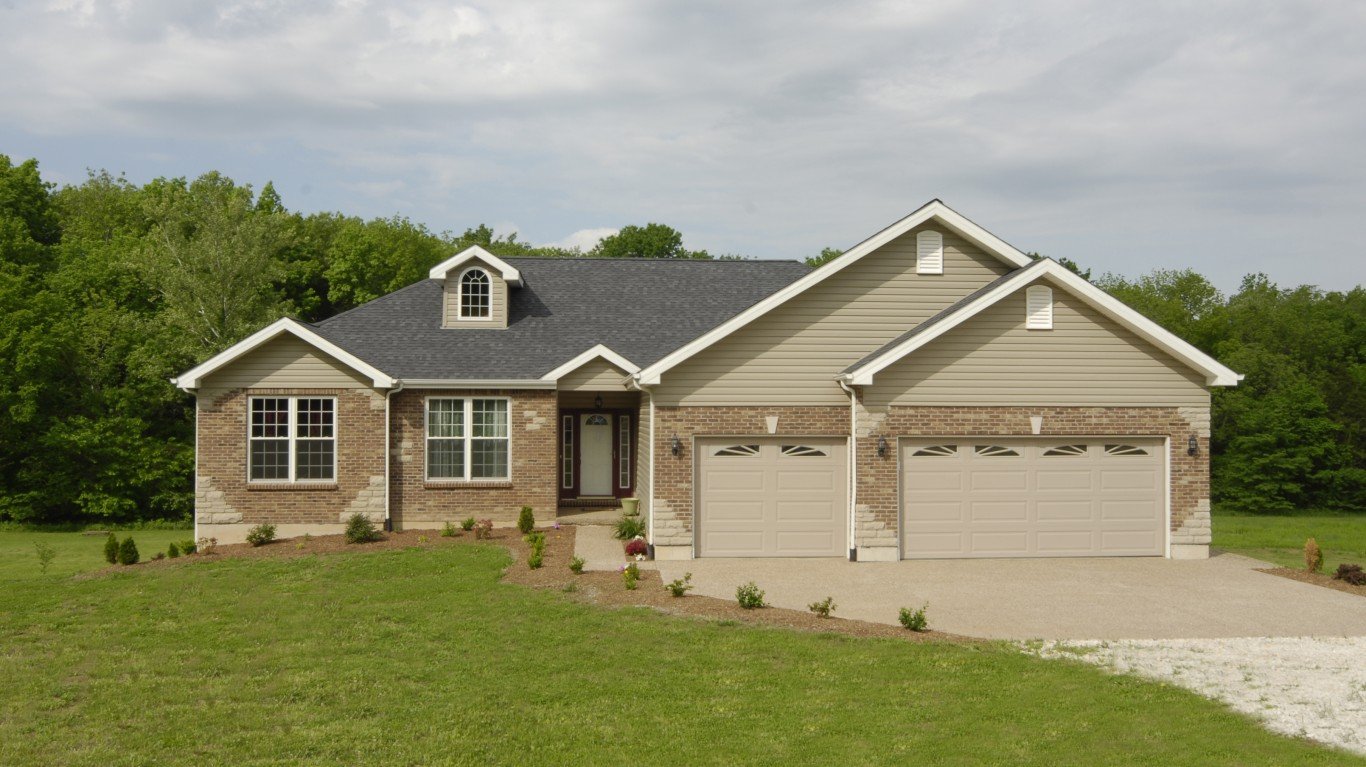
20. Troy, Missouri
> Poverty rate: 10.8%
> Median home value: $160,600
> Median household income: $73,406
> Drug-induced mortality: 34.9 deaths per 100,000
> Total population: 12,463
[in-text-ad]

19. Forrest City, Arkansas
> Poverty rate: 33.0%
> Median home value: $68,700
> Median household income: $33,229
> Drug-induced mortality: N/A
> Total population: 13,372

Source: BOB WESTON / iStock / Getty Images Plus
18. Malvern, Arkansas
> Poverty rate: 26.2%
> Median home value: $89,100
> Median household income: $34,880
> Drug-induced mortality: N/A
> Total population: 10,626

17. Opelousas, Louisiana
> Poverty rate: 37.2%
> Median home value: $105,700
> Median household income: $33,272
> Drug-induced mortality: 36.2 deaths per 100,000
> Total population: 15,884
[in-text-ad-2]
Source: ALAN SCHMIERER / Wikimedia Commons
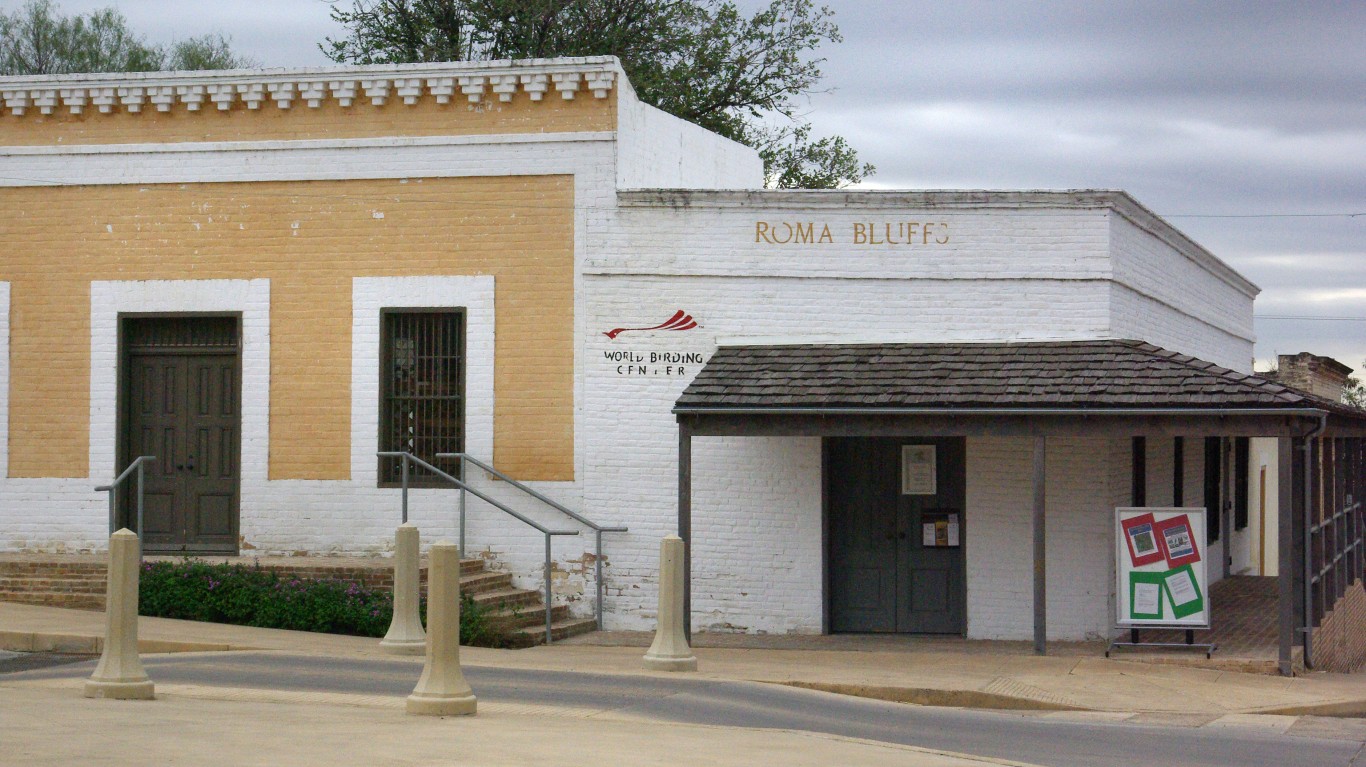
16. Roma, Texas
> Poverty rate: 34.9%
> Median home value: $72,800
> Median household income: $25,933
> Drug-induced mortality: N/A
> Total population: 11,451

Source: sshepard / iStock Unreleased via Getty Images
15. Bluefield, West Virginia
> Poverty rate: 20.6%
> Median home value: $78,100
> Median household income: $39,677
> Drug-induced mortality: 109.0 deaths per 100,000
> Total population: 9,699
[in-text-ad]

Source: BOB WESTON / Getty Images
14. Bonham, Texas
> Poverty rate: 18.1%
> Median home value: $103,200
> Median household income: $43,736
> Drug-induced mortality: N/A
> Total population: 10,295

Source: Public Domain / Wikimedia Commons
13. Helena-West Helena, Arkansas
> Poverty rate: 43.0%
> Median home value: $70,700
> Median household income: $25,735
> Drug-induced mortality: N/A
> Total population: 9,707
 by Aaron Manning")
12. Bogalusa, Louisiana
> Poverty rate: 32.3%
> Median home value: $96,500
> Median household income: $32,613
> Drug-induced mortality: 90.4 deaths per 100,000
> Total population: 10,921
[in-text-ad-2]

11. Prichard, Alabama
> Poverty rate: 30.1%
> Median home value: $69,300
> Median household income: $32,900
> Drug-induced mortality: 22.8 deaths per 100,000
> Total population: 19,645

Source: RoschetzkyIstockPhoto / Getty Images
10. East Bakersfield, California
> Poverty rate: 44.8%
> Median home value: $118,200
> Median household income: $30,091
> Drug-induced mortality: 42.4 deaths per 100,000
> Total population: 11,025
[in-text-ad]
Source: nycshooter / iStock via Getty Images
9. Beverly Hills, Florida
> Poverty rate: 27.6%
> Median home value: $107,800
> Median household income: $37,728
> Drug-induced mortality: 47.5 deaths per 100,000
> Total population: 10,236

8. Bastrop, Louisiana
> Poverty rate: 44.0%
> Median home value: $82,000
> Median household income: $23,955
> Drug-induced mortality: 43.2 deaths per 100,000
> Total population: 9,879

7. Bridgeton, New Jersey
> Poverty rate: 35.1%
> Median home value: $109,800
> Median household income: $39,995
> Drug-induced mortality: 53.3 deaths per 100,000
> Total population: 26,643
[in-text-ad-2]

6. Yazoo City, Mississippi
> Poverty rate: 39.1%
> Median home value: $66,400
> Median household income: $30,092
> Drug-induced mortality: N/A
> Total population: 10,887

5. Oxford, North Carolina
> Poverty rate: 24.0%
> Median home value: $143,800
> Median household income: $39,399
> Drug-induced mortality: 27.9 deaths per 100,000
> Total population: 8,658
[in-text-ad]

4. Atmore, Alabama
> Poverty rate: 36.9%
> Median home value: $98,600
> Median household income: $29,104
> Drug-induced mortality: 52.0 deaths per 100,000
> Total population: 8,734
 24/7 Wall St.
3. Beecher, Michigan
> Poverty rate: 32.4%
> Median home value: $33,700
> Median household income: $33,105
> Drug-induced mortality: 47.7 deaths per 100,000
> Total population: 9,171

Source: John Moore / Getty Images
2. La Homa, Texas
> Poverty rate: 35.7%
> Median home value: $76,500
> Median household income: $29,546
> Drug-induced mortality: 6.2 deaths per 100,000
> Total population: 11,924
[in-text-ad-2]

1. Eidson Road, Texas
> Poverty rate: 34.8%
> Median home value: $68,900
> Median household income: $30,464
> Drug-induced mortality: N/A
> Total population: 9,743
Methodology
To identify the worst cities to live in, 24/7 Wall St. created a weighted index of 22 measures across three categories: economy, quality of life, and community.
The economy category consists of seven measures:
- Employment growth from 2016 to 2021, included at full weight
- Annual unemployment rate, included at full weight
- Median household income, included at full weight
- Poverty rate, included at full weight
- Percentage of the population 25 years and over with bachelor’s degree or higher, included at full weight
- Median home value, included at full weight
- Median real estate taxes as percentage of median home value, included at full weight
The quality of life category consists of 11 measures:
- Percentage of commuting workers 16 and over took public transportation, walked, or took other means to work, included at full weight
- Percentage of workers 16 years and over who worked in their place of residence, included at full weight
- Mean travel time to work, included at half-weight
- Average hospital 30-day readmission rate, included at half-weight
- Average hospital mortality rate for heart attack, CABG surgery, COPD, heart failure, neumonia, and stroke, included at half-weight
- Distance to nearest hospital, included at half-weight
- Percentage of the population in urban census tracts at least 1 mile from a grocery store and in rural census tracts at least 10 miles from a grocery store, included at half-weight
- Annual crude drug-induced mortality rate per 100,000 residents, included at half-weight
- Rate of hospital stays for ambulatory-care sensitive conditions per 100,000 Medicare enrollees, included at half-weight
- Violent crimes per 100,000 residents, included at full weight
- Property crimes per 100,000 residents, included at full weight
The community category consists of four measures:
- Population with access to exercise opportunities, included at full weight
- Motion picture theaters (except drive-ins), libraries and archives, theater companies and dinner theaters, sports teams and clubs, museums, zoos and botanical gardens, nature parks and other similar institutions, golf courses and country clubs, and marinas per 10,000 establishments, included at full weight
- Drinking places (alcoholic beverages) per 10,000 establishments, included at full weight
- Restaurants and other eating places per 10,000 establishments, included at full weight
Data on population, employment, unemployment, median home value, median household income, median property taxes paid, commuter characteristics, average travel time to work, and poverty came from the U.S. Census Bureau’s American Community Survey and are five-year estimates for the period 2017 to 2021. Employment data used to calculate five-year employment growth are five-year estimates for the years 2012 to 2016.
Data on the share of the population in urban census tracts or areas at least 1 mile from a grocery store and in rural census tracts at least 10 miles from a grocery store, a measure of poor food access, came from the U.S. Department of Agriculture’s 2021 update to the Food Access Research Atlas and is at the county level.
Data on hospital locations came from the Centers for Medicare & Medicaid Services. Data on 30-day readmission rates and 30-day mortality rates also came from the CMS and are for the period July 2019 to June 2022. Data was aggregated to the city level for cities with at least one hospital, and was aggregated to the county level for cities with no hospitals. Data on the number of drug-related deaths per 100,000 residents per year for the period 2019 to 2021 is from the Centers for Disease Control and Prevention and is at the county level. Data on preventable hospitalizations per 1,000 Medicare enrollees and the percentage of the population with access to exercise opportunities came from the 2023 County Health Rankings and Roadmaps program, a collaboration between the Robert Wood Johnson Foundation and University of Wisconsin Population Health Institute, and is at the county level.
Data on the number of violent crimes and property crimes reported per 100,000 residents came from the FBI’s Uniform Crime Reporting Program and are for the year 2020.
Data on the number of motion picture theaters (except drive-ins), libraries and archives, theater companies and dinner theaters, sports teams and clubs, museums, zoos and botanical gardens, nature parks and other similar institutions, golf courses and country clubs, marinas, drinking places, and restaurants came from the Census Bureau’s 2021 County Business Patterns series and is at the county level.
To avoid geographic clustering, we only took the worst-ranking city in a given county. Our list includes cities, towns, villages, boroughs, and census-designated places. We did not include places with fewer than 8,000 residents in our analysis. Cities must also have had data available for 15 of the 22 measures considered.
Take This Retirement Quiz To Get Matched With A Financial Advisor (Sponsored)
Take the quiz below to get matched with a financial advisor today.
Each advisor has been vetted by SmartAsset and is held to a fiduciary standard to act in your best interests.
Here’s how it works:
1. Answer SmartAsset advisor match quiz
2. Review your pre-screened matches at your leisure. Check out the
advisors’ profiles.
3. Speak with advisors at no cost to you. Have an introductory call on the phone or introduction in person and choose whom to work with in the future
Take the retirement quiz right here.
Thank you for reading! Have some feedback for us?
Contact the 24/7 Wall St. editorial team.
Editors' Picks