
Each year, roughly 40 million Americans, or about 14% of the U.S. population, move at least once. Much of that movement includes younger people relocating within cities, but it is trends of Americans moving to warmer climates, more affordable areas, and better job opportunities that have largely determined migration patterns in recent decades.
Because of those long-term patterns, as well as the recent period of economic recovery, cities in some parts of the country have enjoyed a net influx of tens- if not hundreds of thousands of new residents.
To find the 50 U.S. metropolitan areas that have had the largest net increase in population as a result of migration between 2010 and 2017, 24/7 Wall St. reviewed population figures from the U.S. Census Bureau’s Population Estimates Program.
The 50 cities where the most people are moving to can primarily be found in the Sun Belt, particularly in states like Florida, Texas, and Arizona. Among the fastest growing cities are places like Dallas, Miami, and Phoenix.
William Frey, demographer at the Brookings Institution, a nonprofit public policy research group, explained that these cities adding several hundred thousand new residents due to migration are part of the long-term trend of movement from the Northeast and the Midwest to warmer climates, a trend that has increased in recent years.
“The story of the broader migration pattern in the U.S. is from Snow Belt to Sun Belt,” Frey said. “That migration has slowed a little bit in the early part of the decade, when we were still dealing with the aftermath of the recession, but it’s coming back.”
Click here to see the cities Americans are flocking to.
Click here to see the cities Americans are abandoning.
Click here to see our detailed findings and methodology.
Source: Thinkstock
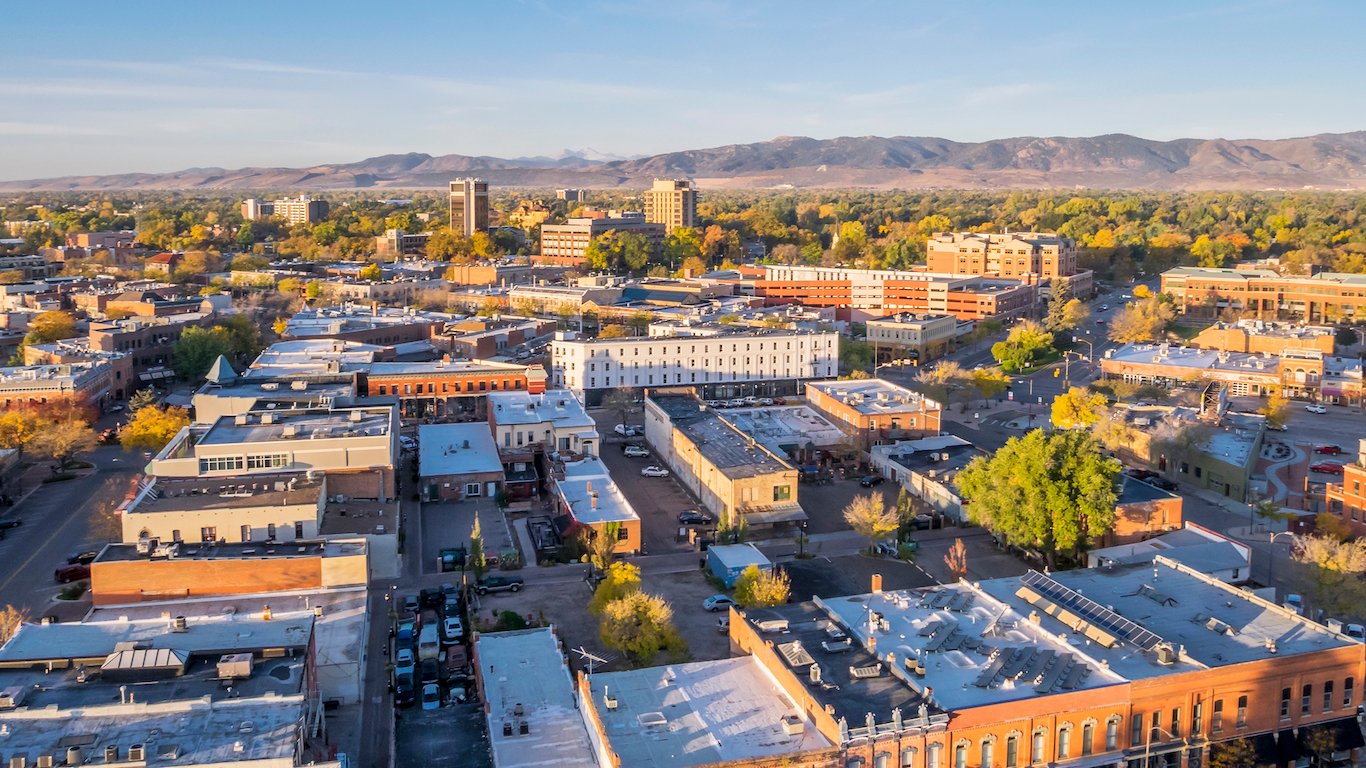
50. Fort Collins, CO
> Population increase due to migration, 2010-2017: 33,905
> Population change, 2010-2017: +14.8% (299,628 to 343,976)
> Natural growth, 2010-2017: 24,843 births, 14,873 deaths
> Median home value: $339,900
[in-text-ad]
Source: David Shankbone / Wikimedia Commons
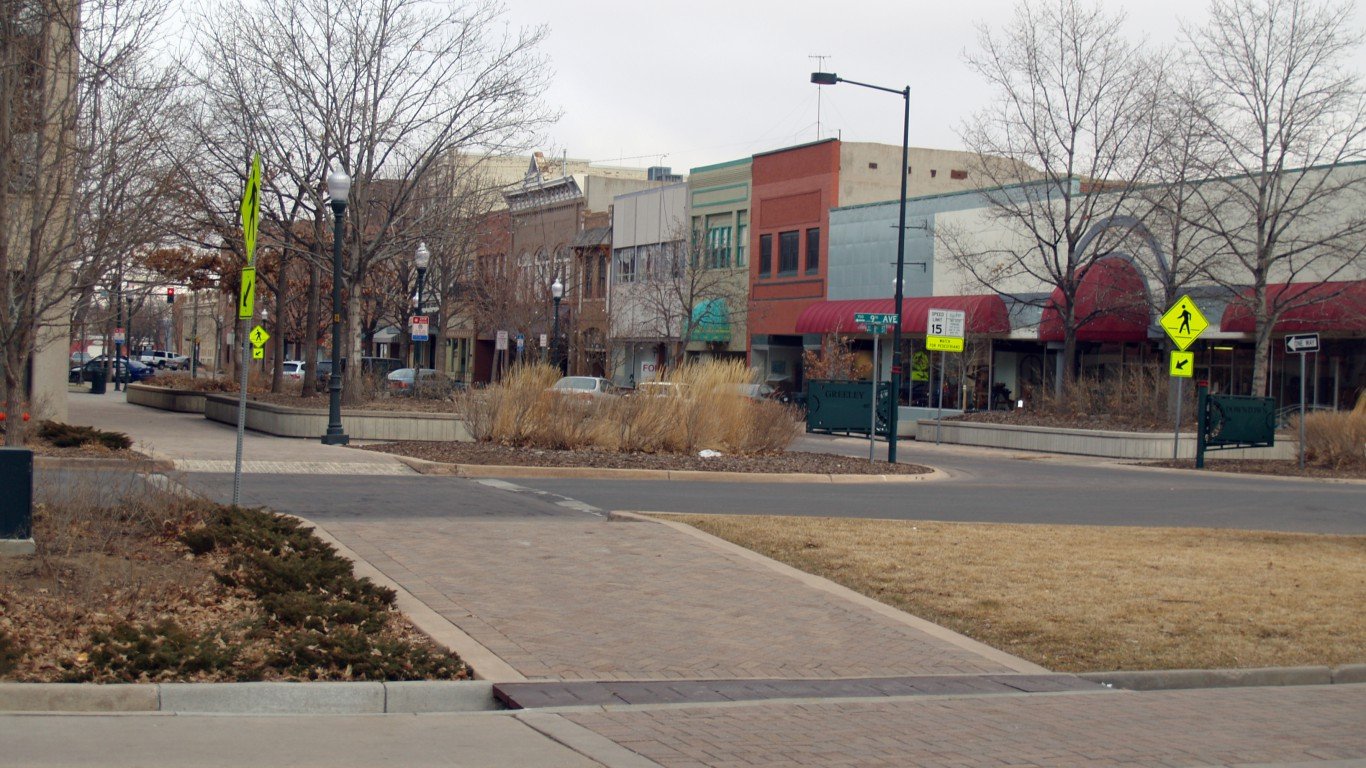
49. Greeley, CO
> Population increase due to migration, 2010-2017: 33,972
> Population change, 2010-2017: +20.5% (252,839 to 304,633)
> Natural growth, 2010-2017: 29,146 births, 11,697 deaths
> Median home value: $274,200
 24/7 Wall St.
Source: Klinhphotog KLinh Evelyn Grace Photography / Wikimedia Commons
48. Columbia, SC
> Population increase due to migration, 2010-2017: 36,318
> Population change, 2010-2017: +7.5% (767,476 to 825,033)
> Natural growth, 2010-2017: 68,585 births, 47,169 deaths
> Median home value: $146,800

Source: SeanPavonePhoto / Getty Images
47. Knoxville, TN
> Population increase due to migration, 2010-2017: 36,696
> Population change, 2010-2017: +4.7% (837,675 to 877,104)
> Natural growth, 2010-2017: 68,023 births, 65,085 deaths
> Median home value: $163,900
[in-text-ad-2]
Source: Thinkstock
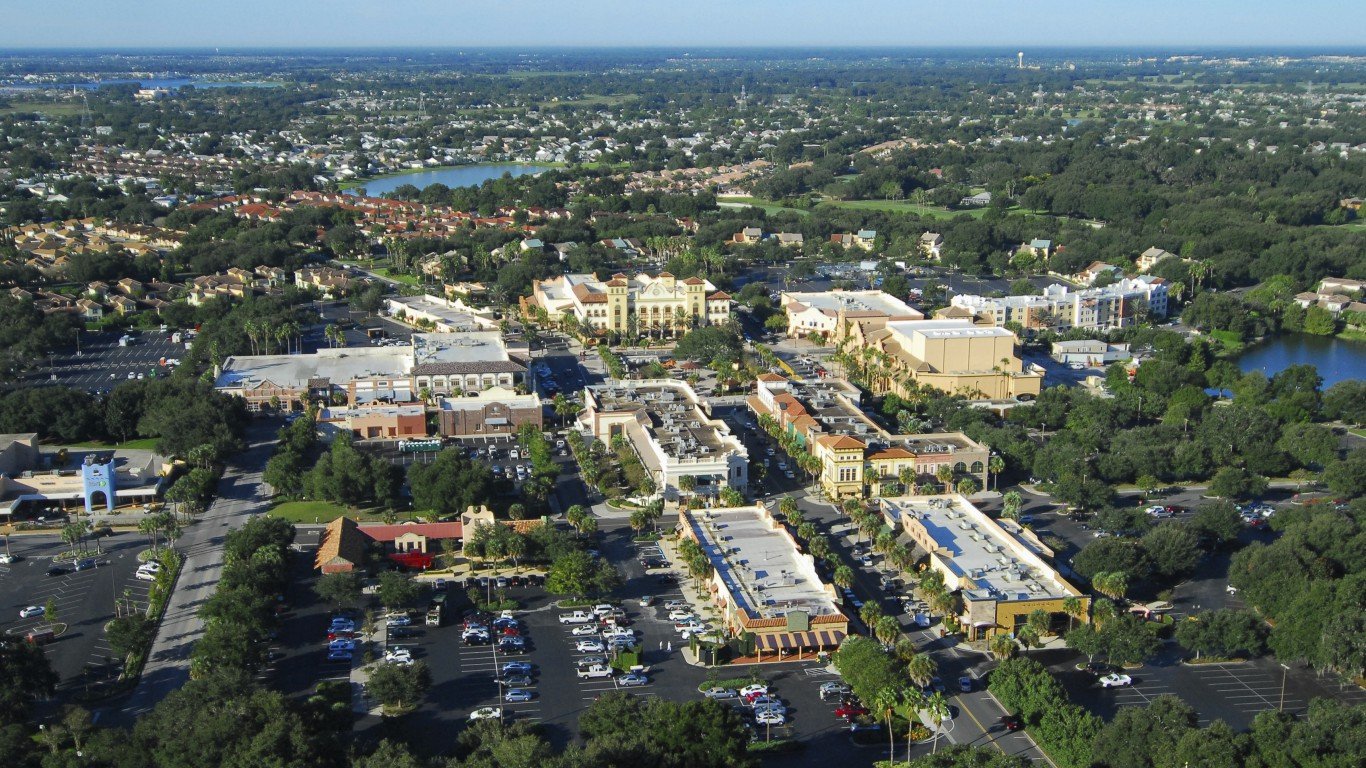
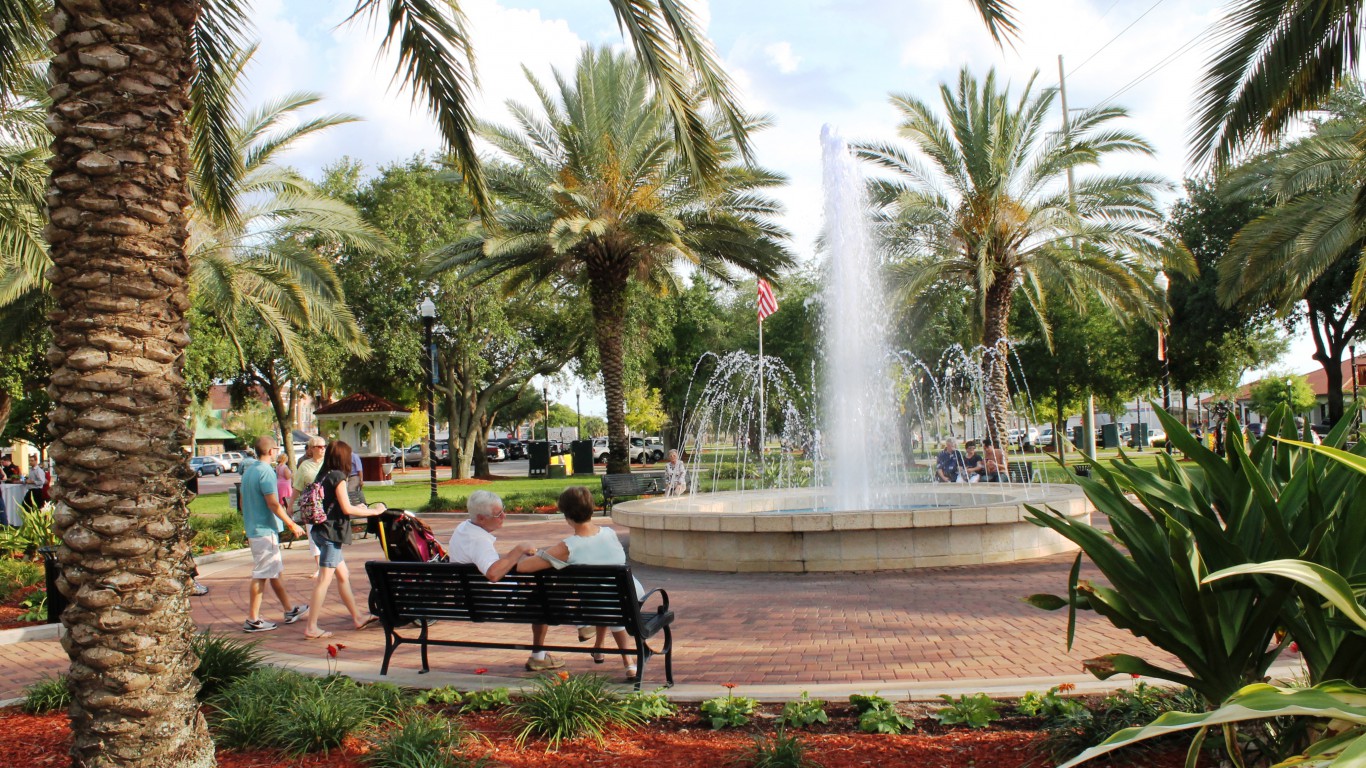
46. The Villages, FL
> Population increase due to migration, 2010-2017: 38,549
> Population change, 2010-2017: +34.0% (93,420 to 125,165)
> Natural growth, 2010-2017: 3,402 births, 10,899 deaths
> Median home value: $249,500
45. Durham-Chapel Hill, NC
> Population increase due to migration, 2010-2017: 39,686
> Population change, 2010-2017: +12.0% (506,623 to 567,428)
> Natural growth, 2010-2017: 47,638 births, 26,874 deaths
> Median home value: $222,200
[in-text-ad]

Source: RudyBalasko / Getty Images
44. Kansas City, MO-KS
> Population increase due to migration, 2010-2017: 39,900
> Population change, 2010-2017: +6.0% (2,009,338 to 2,128,912)
> Natural growth, 2010-2017: 200,535 births, 119,748 deaths
> Median home value: $173,900

Source: oneillbro / Getty Images
43. Colorado Springs, CO
> Population increase due to migration, 2010-2017: 39,951
> Population change, 2010-2017: +12.1% (645,615 to 723,878)
> Natural growth, 2010-2017: 68,968 births, 30,704 deaths
> Median home value: $249,400
Source: Ron Reiring / Wikimedia Commons
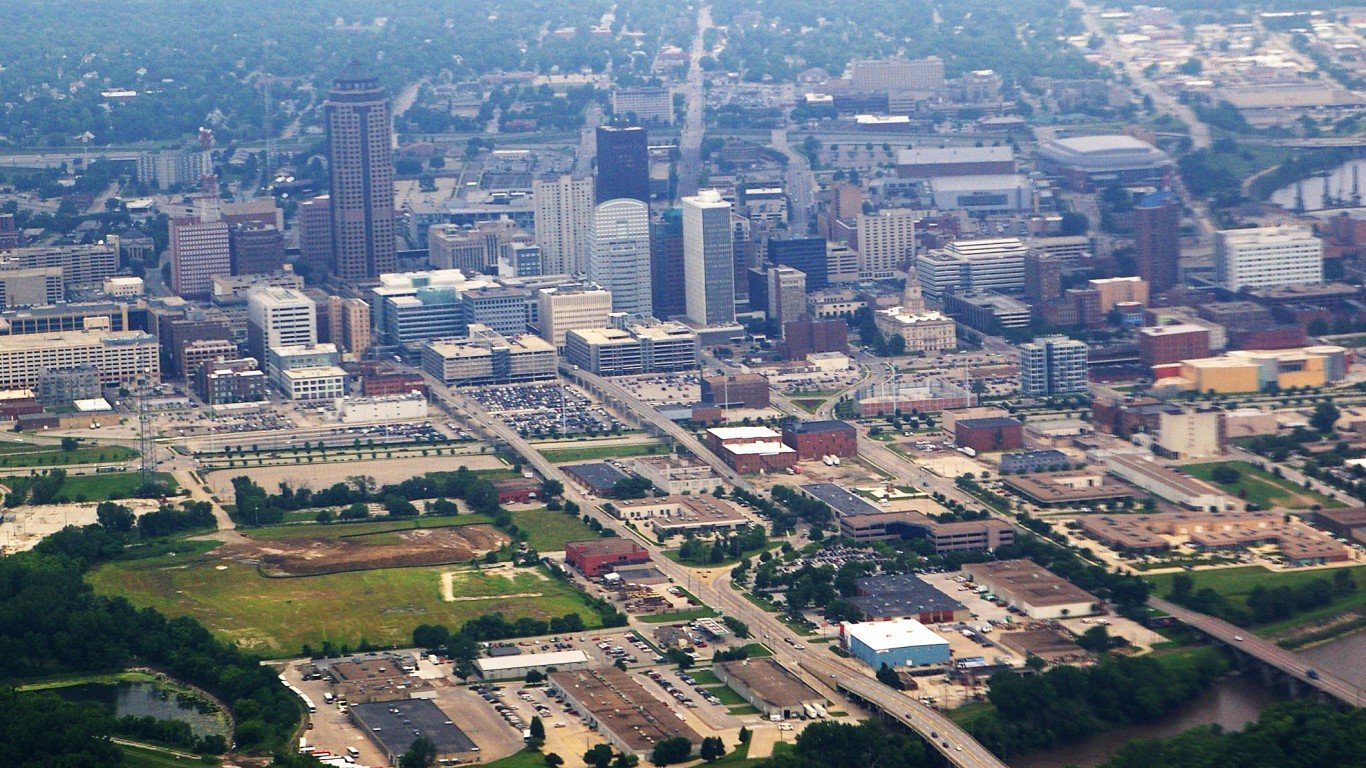
42. Des Moines-West Des Moines, IA
> Population increase due to migration, 2010-2017: 43,634
> Population change, 2010-2017: +13.4% (569,633 to 645,911)
> Natural growth, 2010-2017: 63,958 births, 31,563 deaths
> Median home value: $175,300
[in-text-ad-2]

Source: Thinkstock
41. Fayetteville-Springdale-Rogers, AR-MO
> Population increase due to migration, 2010-2017: 47,115
> Population change, 2010-2017: +16.0% (463,210 to 537,463)
> Natural growth, 2010-2017: 52,151 births, 25,493 deaths
> Median home value: $166,600
Source: PhotogMetairie / Wikimedia Commons
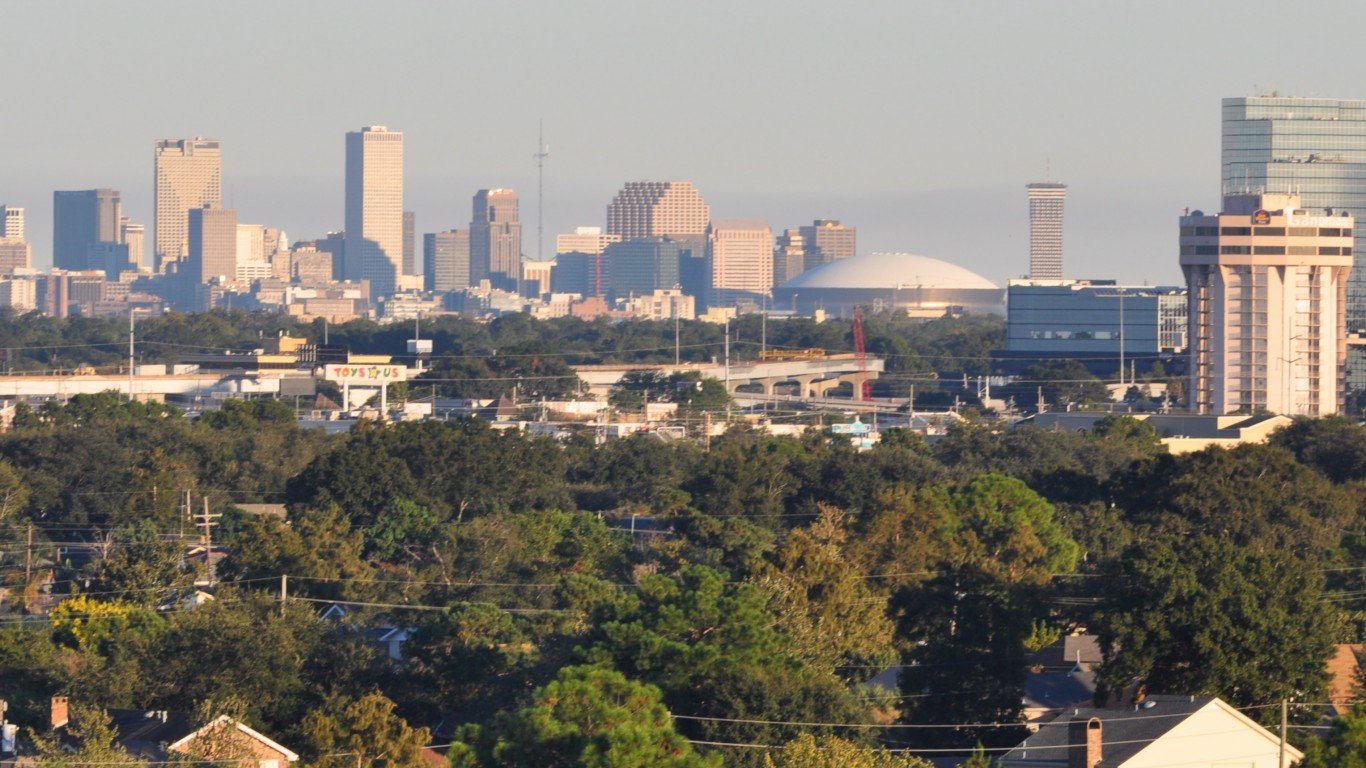
40. New Orleans-Metairie, LA
> Population increase due to migration, 2010-2017: 47,744
> Population change, 2010-2017: +7.2% (1,189,859 to 1,275,762)
> Natural growth, 2010-2017: 115,671 births, 78,774 deaths
> Median home value: $188,100
[in-text-ad]
Source: pisaphotography / Shutterstock.com
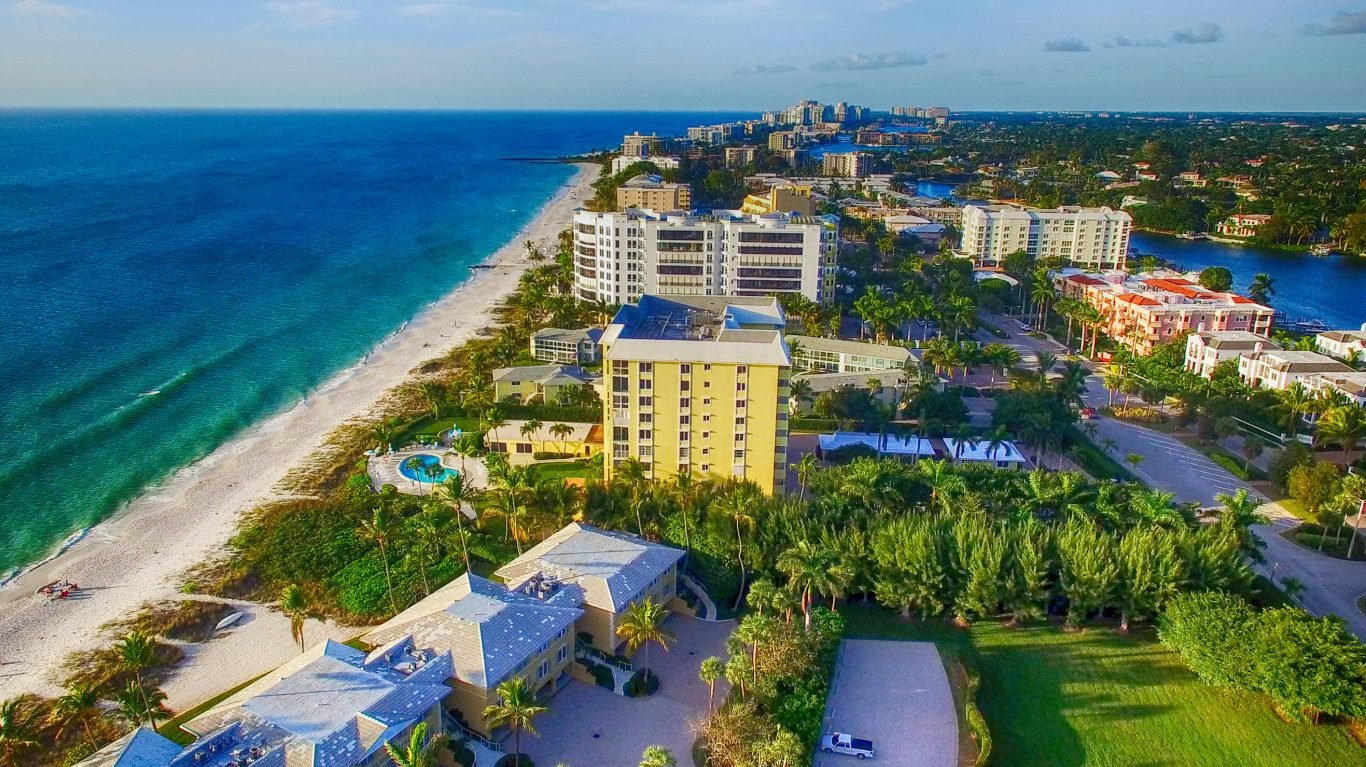
39. Naples-Immokalee-Marco Island, FL
> Population increase due to migration, 2010-2017: 50,154
> Population change, 2010-2017: +16.0% (321,520 to 372,880)
> Natural growth, 2010-2017: 23,497 births, 22,522 deaths
> Median home value: $357,300

Source: Jim / Wikimedia Commons
38. Richmond, VA
> Population increase due to migration, 2010-2017: 52,143
> Population change, 2010-2017: +7.1% (1,208,087 to 1,294,204)
> Natural growth, 2010-2017: 108,313 births, 74,255 deaths
> Median home value: $227,200

Source: Thinkstock
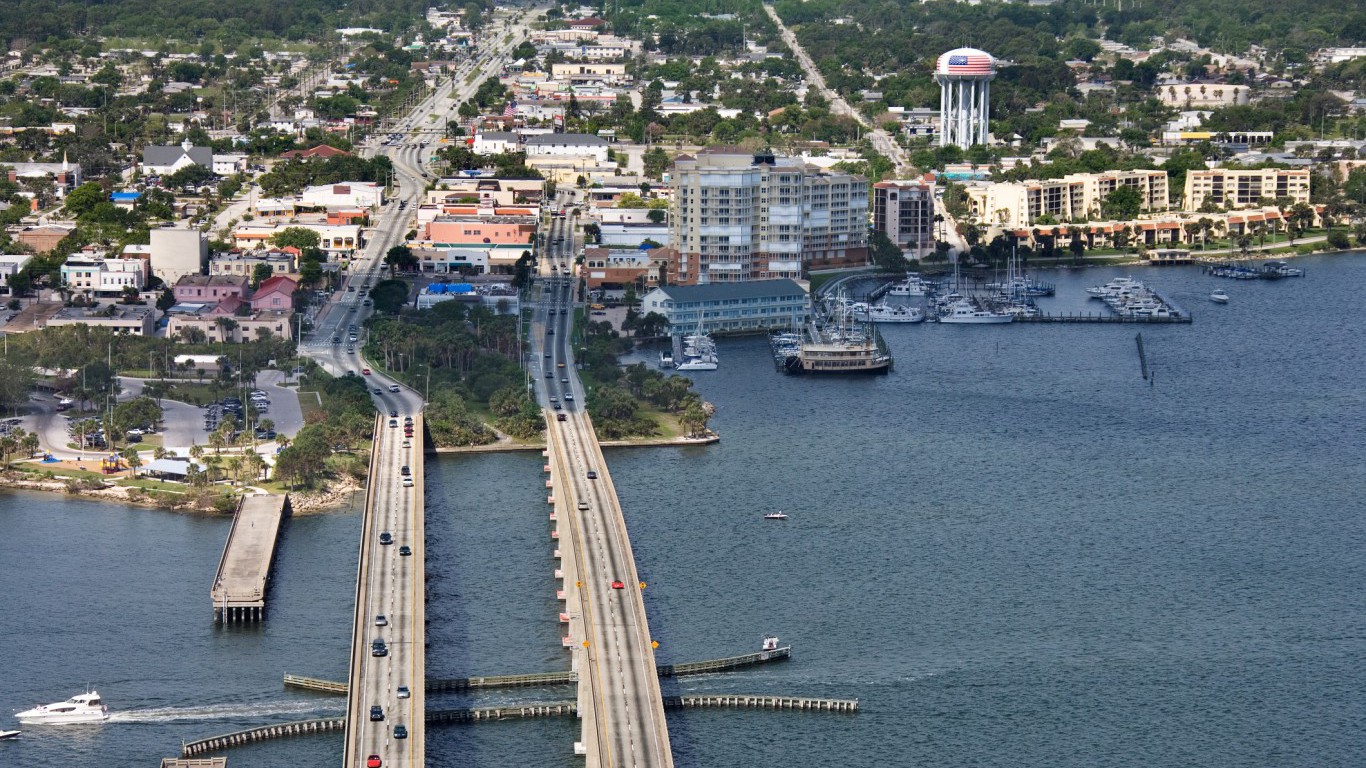
37. Port St. Lucie, FL
> Population increase due to migration, 2010-2017: 53,232
> Population change, 2010-2017: +11.6% (424,107 to 473,429)
> Natural growth, 2010-2017: 30,774 births, 34,957 deaths
> Median home value: $183,000
[in-text-ad-2]

Source: SeanPavonePhoto / iStock
36. Greenville-Anderson-Mauldin, SC
> Population increase due to migration, 2010-2017: 53,414
> Population change, 2010-2017: +8.7% (824,109 to 895,923)
> Natural growth, 2010-2017: 76,015 births, 57,736 deaths
> Median home value: $157,000
Source: Thinkstock
35. Palm Bay-Melbourne-Titusville, FL
> Population increase due to migration, 2010-2017: 56,706
> Population change, 2010-2017: +8.4% (543,378 to 589,162)
> Natural growth, 2010-2017: 37,369 births, 48,286 deaths
> Median home value: $175,600
[in-text-ad]

Source: Thinkstock
34. San Jose-Sunnyvale-Santa Clara, CA
> Population increase due to migration, 2010-2017: 59,912
> Population change, 2010-2017: +8.8% (1,836,940 to 1,998,463)
> Natural growth, 2010-2017: 176,224 births, 73,507 deaths
> Median home value: $911,900

Source: Thinkstock
33. Indianapolis-Carmel-Anderson, IN
> Population increase due to migration, 2010-2017: 61,101
> Population change, 2010-2017: +7.4% (1,888,090 to 2,028,614)
> Natural growth, 2010-2017: 193,599 births, 113,742 deaths
> Median home value: $153,500

Source: knowlesgallery / Getty Images
32. Boise City, ID
> Population increase due to migration, 2010-2017: 62,059
> Population change, 2010-2017: +15.1% (616,568 to 709,845)
> Natural growth, 2010-2017: 62,574 births, 31,726 deaths
> Median home value: $207,600
[in-text-ad-2]
Source: Public Domain / Wikimedia Commons
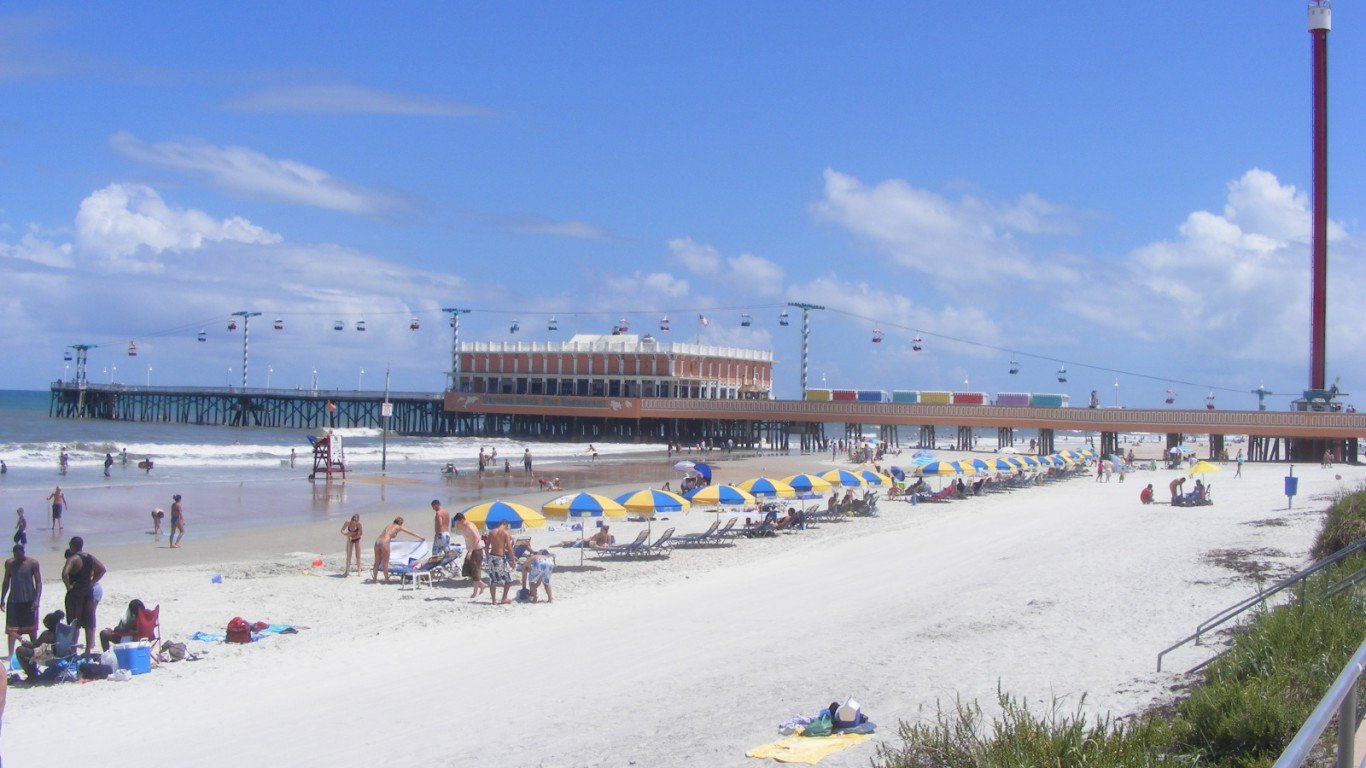
31. Deltona-Daytona Beach-Ormond Beach, FL
> Population increase due to migration, 2010-2017: 74,152
> Population change, 2010-2017: +10.0% (590,294 to 649,202)
> Natural growth, 2010-2017: 40,643 births, 56,277 deaths
> Median home value: $171,900

Source: Urbanative / Wikimedia Commons
30. Oklahoma City, OK
> Population increase due to migration, 2010-2017: 74,818
> Population change, 2010-2017: +10.4% (1,252,991 to 1,383,737)
> Natural growth, 2010-2017: 137,709 births, 82,231 deaths
> Median home value: $154,200
[in-text-ad]
Source: Ultrahip / Wikimedia Commons
29. Lakeland-Winter Haven, FL
> Population increase due to migration, 2010-2017: 76,000
> Population change, 2010-2017: +14.0% (602,095 to 686,483)
> Natural growth, 2010-2017: 53,892 births, 45,696 deaths
> Median home value: $135,300

Source: Lucky-photographer / Shutterstock.com
28. San Diego-Carlsbad, CA
> Population increase due to migration, 2010-2017: 76,282
> Population change, 2010-2017: +7.8% (3,095,342 to 3,337,685)
> Natural growth, 2010-2017: 319,062 births, 150,472 deaths
> Median home value: $527,600
Source: Thinkstock
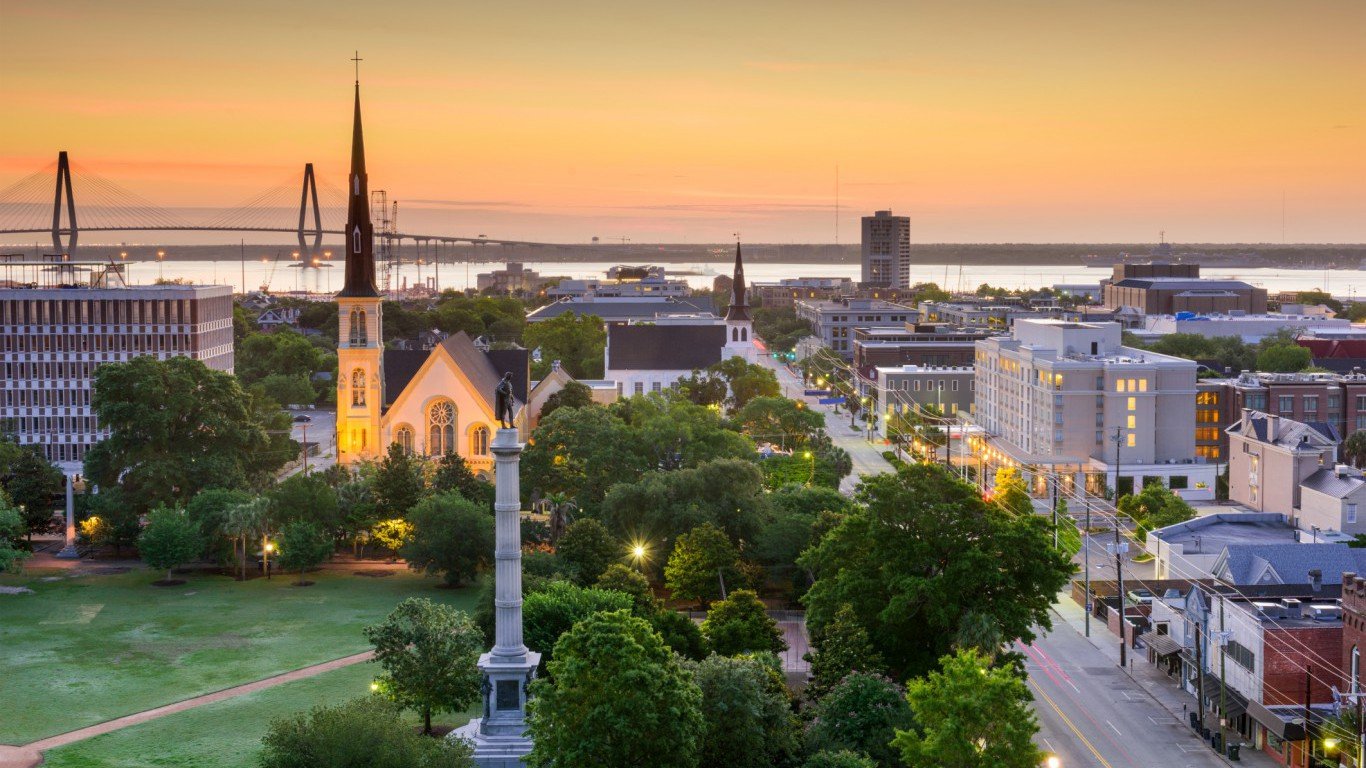
27. Charleston-North Charleston, SC
> Population increase due to migration, 2010-2017: 81,055
> Population change, 2010-2017: +16.7% (664,644 to 775,831)
> Natural growth, 2010-2017: 67,679 births, 38,851 deaths
> Median home value: $213,200
[in-text-ad-2]

Source: Thinkstock
26. Minneapolis-St. Paul-Bloomington, MN-WI
> Population increase due to migration, 2010-2017: 83,984
> Population change, 2010-2017: +7.5% (3,348,858 to 3,600,618)
> Natural growth, 2010-2017: 331,430 births, 161,913 deaths
> Median home value: $240,500

Source: Loadmaster (David R. Tribble)
This image was made by Loadmaster (David R. Tribble)
Email the author: David R. Tribble
Also see my personal gallery at Google Photos
/ Wikimedia Commons
25. Myrtle Beach-Conway-North Myrtle Beach, SC-NC
> Population increase due to migration, 2010-2017: 87,194
> Population change, 2010-2017: +23.2% (376,722 to 464,165)
> Natural growth, 2010-2017: 30,012 births, 31,223 deaths
> Median home value: $183,600
[in-text-ad]

Source: Thinkstock
24. Columbus, OH
> Population increase due to migration, 2010-2017: 88,676
> Population change, 2010-2017: +9.3% (1,902,001 to 2,078,725)
> Natural growth, 2010-2017: 197,185 births, 108,704 deaths
> Median home value: $172,200

Source: Thinkstock
23. Sacramento–Roseville–Arden-Arcade, CA
> Population increase due to migration, 2010-2017: 98,822
> Population change, 2010-2017: +8.2% (2,149,144 to 2,324,884)
> Natural growth, 2010-2017: 198,466 births, 120,429 deaths
> Median home value: $363,300

Source: Thinkstock
22. Jacksonville, FL
> Population increase due to migration, 2010-2017: 115,633
> Population change, 2010-2017: +11.8% (1,345,598 to 1,504,980)
> Natural growth, 2010-2017: 130,339 births, 86,920 deaths
> Median home value: $187,600
[in-text-ad-2]
Source: Thinkstock
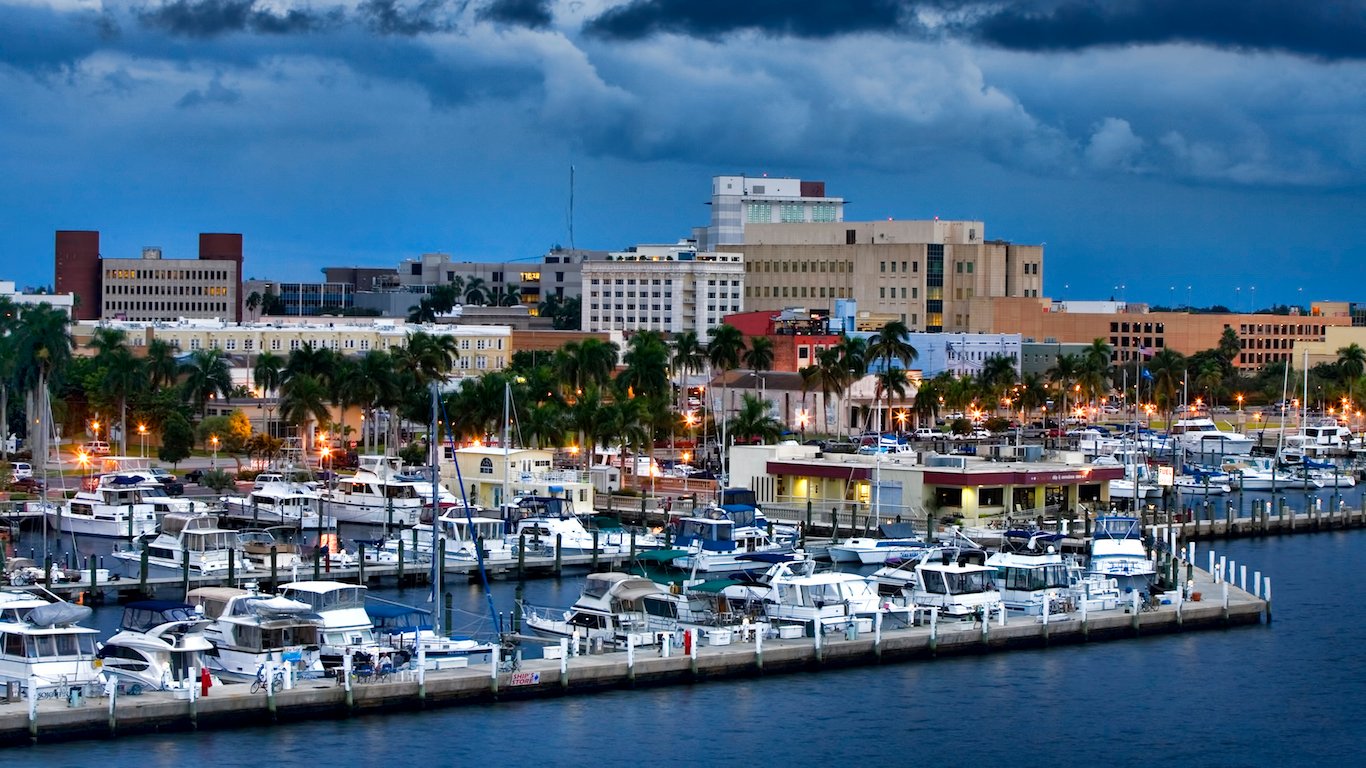
21. Cape Coral-Fort Myers, FL
> Population increase due to migration, 2010-2017: 119,306
> Population change, 2010-2017: +19.5% (618,754 to 739,224)
> Natural growth, 2010-2017: 47,191 births, 47,340 deaths
> Median home value: $210,900
Source: Thinkstock
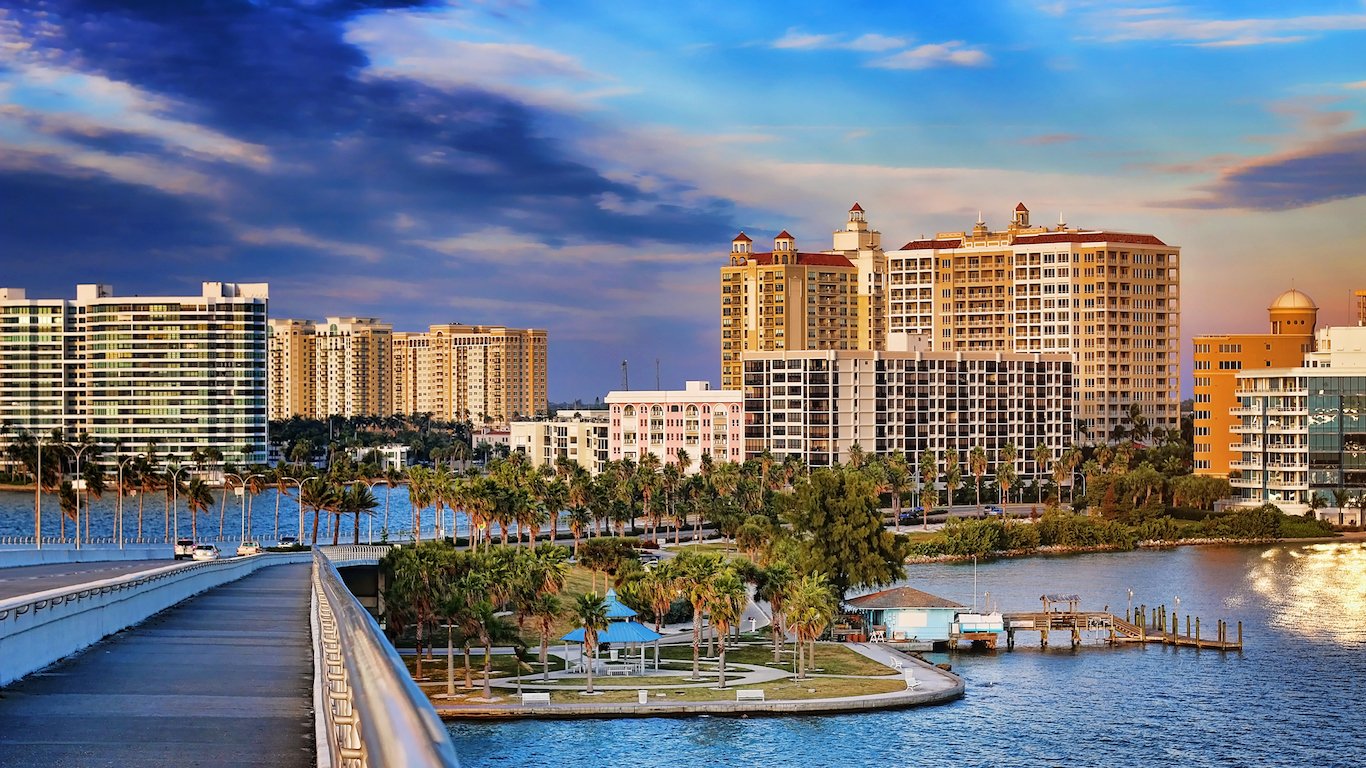
20. North Port-Sarasota-Bradenton, FL
> Population increase due to migration, 2010-2017: 120,534
> Population change, 2010-2017: +14.6% (702,313 to 804,690)
> Natural growth, 2010-2017: 45,888 births, 65,249 deaths
> Median home value: $227,500
[in-text-ad]

Source: Thinkstock
19. Riverside-San Bernardino-Ontario, CA
> Population increase due to migration, 2010-2017: 122,184
> Population change, 2010-2017: +8.4% (4,224,965 to 4,580,670)
> Natural growth, 2010-2017: 442,295 births, 207,470 deaths
> Median home value: $318,900
 24/7 Wall St.
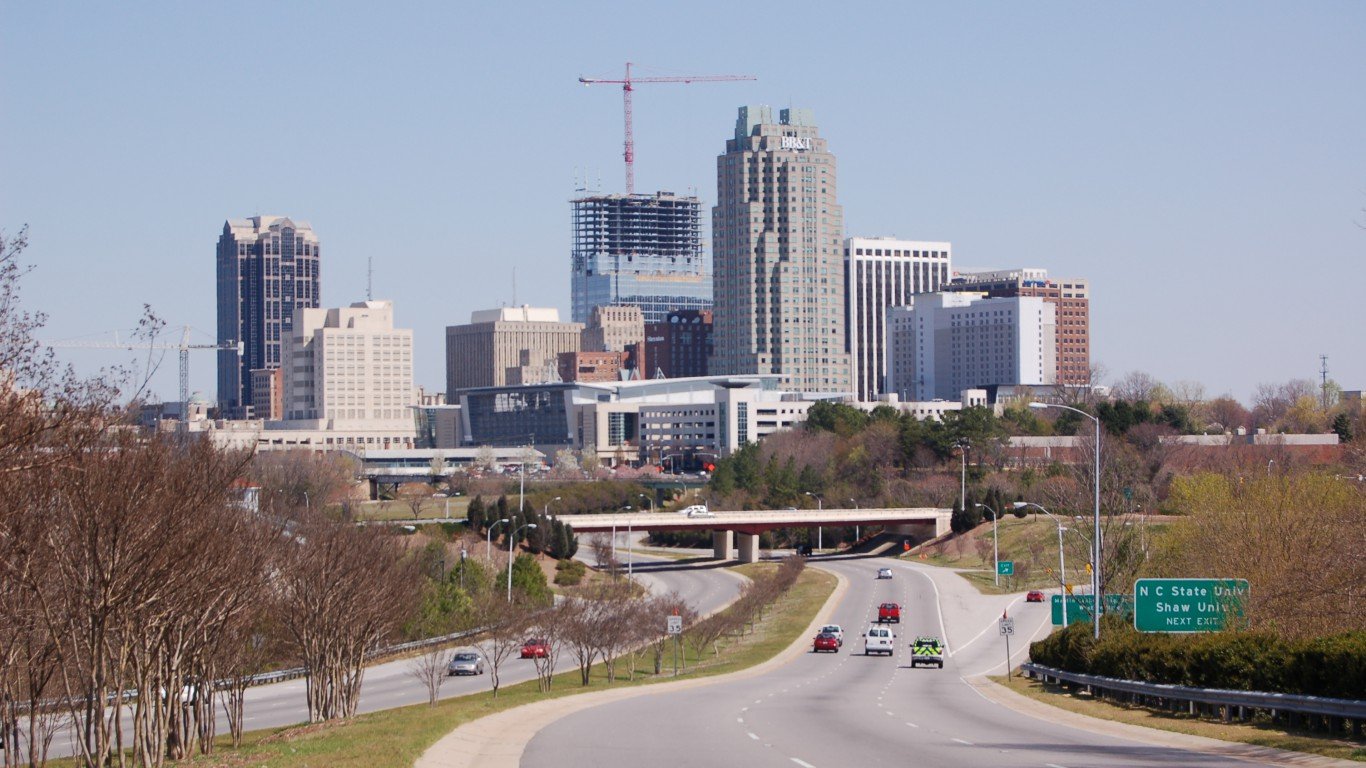
Source: Public Domain / Wikimedia Commons
18. Raleigh, NC
> Population increase due to migration, 2010-2017: 139,611
> Population change, 2010-2017: +18.1% (1,130,489 to 1,335,079)
> Natural growth, 2010-2017: 113,109 births, 49,531 deaths
> Median home value: $237,700

Source: Thinkstock
17. Portland-Vancouver-Hillsboro, OR-WA
> Population increase due to migration, 2010-2017: 145,381
> Population change, 2010-2017: +10.2% (2,226,001 to 2,453,168)
> Natural growth, 2010-2017: 201,872 births, 120,590 deaths
> Median home value: $345,000
[in-text-ad-2]

Source: Thinkstock
16. Nashville-Davidson–Murfreesboro–Franklin, TN
> Population increase due to migration, 2010-2017: 159,311
> Population change, 2010-2017: +13.9% (1,670,883 to 1,903,045)
> Natural growth, 2010-2017: 170,824 births, 99,415 deaths
> Median home value: $208,900

Source: 4FR / Getty Images
15. Las Vegas-Henderson-Paradise, NV
> Population increase due to migration, 2010-2017: 166,153
> Population change, 2010-2017: +13.0% (1,951,269 to 2,204,079)
> Natural growth, 2010-2017: 194,083 births, 108,003 deaths
> Median home value: $233,700
[in-text-ad]

Source: Thinkstock
14. Boston-Cambridge-Newton, MA-NH
> Population increase due to migration, 2010-2017: 171,015
> Population change, 2010-2017: +6.2% (4,552,596 to 4,836,531)
> Natural growth, 2010-2017: 374,563 births, 258,488 deaths
> Median home value: $412,700

Source: photoquest7 / Getty Images
13. Denver-Aurora-Lakewood, CO
> Population increase due to migration, 2010-2017: 209,394
> Population change, 2010-2017: +13.5% (2,543,592 to 2,888,227)
> Natural growth, 2010-2017: 253,263 births, 121,114 deaths
> Median home value: $349,200

Source: Thinkstock
12. San Antonio-New Braunfels, TX
> Population increase due to migration, 2010-2017: 210,637
> Population change, 2010-2017: +15.5% (2,142,516 to 2,473,974)
> Natural growth, 2010-2017: 236,348 births, 117,289 deaths
> Median home value: $160,200
[in-text-ad-2]

Source: Riction / Wikimedia Commons
11. Charlotte-Concord-Gastonia, NC-SC
> Population increase due to migration, 2010-2017: 216,864
> Population change, 2010-2017: +13.9% (2,216,992 to 2,525,305)
> Natural growth, 2010-2017: 217,525 births, 127,523 deaths
> Median home value: $188,100
Source: Ershov_Maks / Getty Images
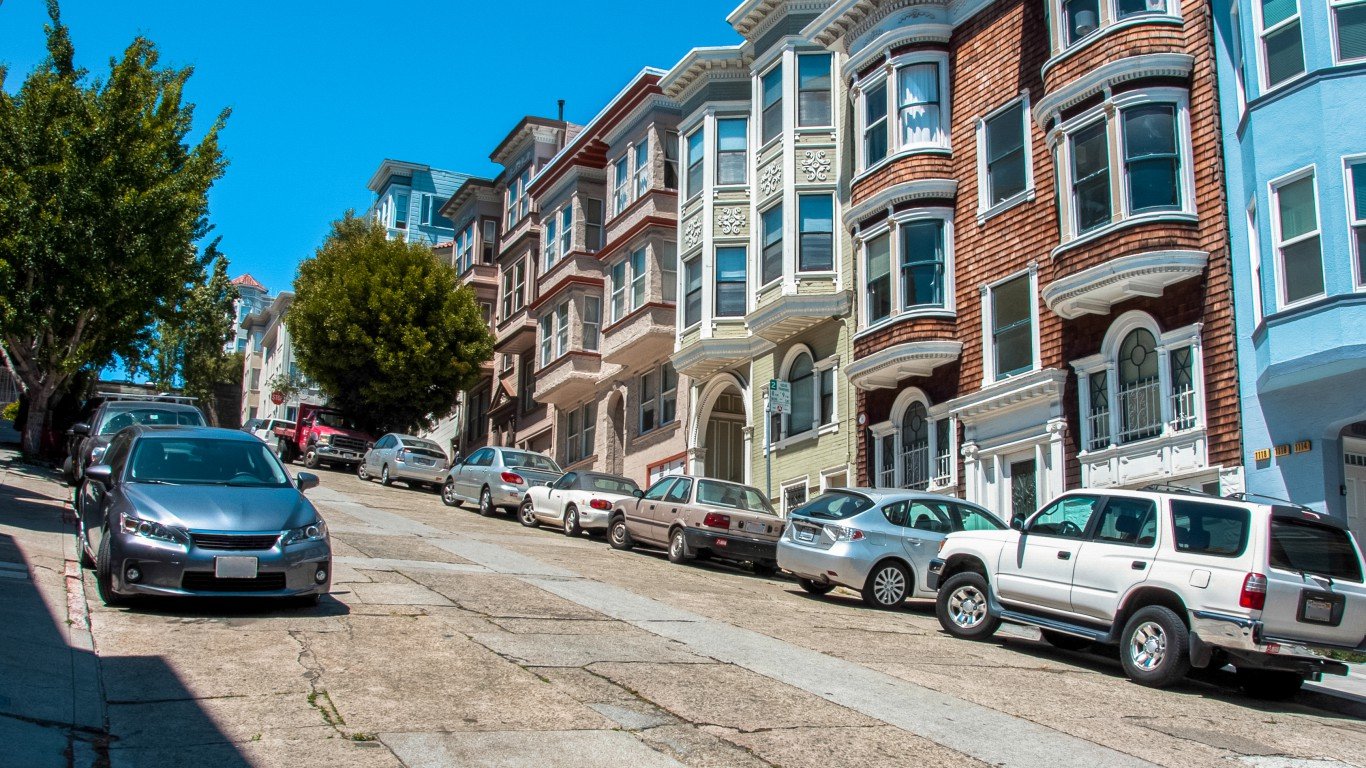
10. San Francisco-Oakland-Hayward, CA
> Population increase due to migration, 2010-2017: 230,286
> Population change, 2010-2017: +9.0% (4,335,573 to 4,727,357)
> Natural growth, 2010-2017: 377,444 births, 215,360 deaths
> Median home value: $796,100
[in-text-ad]

Source: Thinkstock
9. Seattle-Tacoma-Bellevue, WA
> Population increase due to migration, 2010-2017: 266,350
> Population change, 2010-2017: +12.4% (3,439,806 to 3,867,046)
> Natural growth, 2010-2017: 333,881 births, 172,982 deaths
> Median home value: $391,500

Source: Thinkstock
8. Austin-Round Rock, TX
> Population increase due to migration, 2010-2017: 273,662
> Population change, 2010-2017: +23.3% (1,716,320 to 2,115,827)
> Natural growth, 2010-2017: 188,961 births, 67,704 deaths
> Median home value: $263,300
Source: Thinkstock
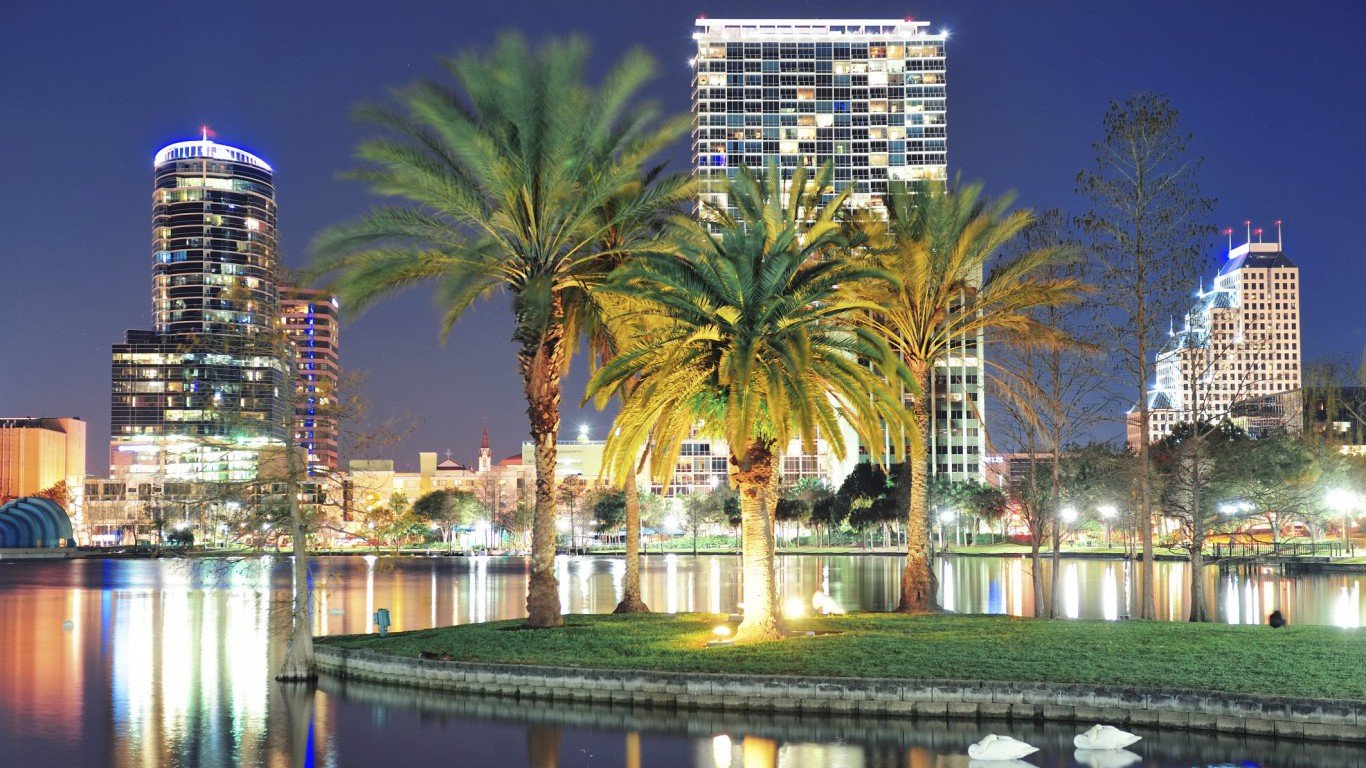
7. Orlando-Kissimmee-Sanford, FL
> Population increase due to migration, 2010-2017: 291,358
> Population change, 2010-2017: +17.6% (2,134,399 to 2,509,831)
> Natural growth, 2010-2017: 200,843 births, 117,771 deaths
> Median home value: $201,600
[in-text-ad-2]

Source: Jamie Beverly from St. Petersburg, Florida, USA / Wikimedia Commons
6. Tampa-St. Petersburg-Clearwater, FL
> Population increase due to migration, 2010-2017: 293,057
> Population change, 2010-2017: +11.1% (2,783,469 to 3,091,399)
> Natural growth, 2010-2017: 230,427 births, 217,187 deaths
> Median home value: $175,200

Source: SeanPavonePhoto / iStock
5. Atlanta-Sandy Springs-Roswell, GA
> Population increase due to migration, 2010-2017: 318,976
> Population change, 2010-2017: +11.3% (5,286,743 to 5,884,736)
> Natural growth, 2010-2017: 529,351 births, 251,100 deaths
> Median home value: $197,700
[in-text-ad]

Source: Thinkstock
4. Phoenix-Mesa-Scottsdale, AZ
> Population increase due to migration, 2010-2017: 336,896
> Population change, 2010-2017: +13.0% (4,193,129 to 4,737,270)
> Natural growth, 2010-2017: 428,751 births, 223,049 deaths
> Median home value: $231,000
Source: Thinkstock
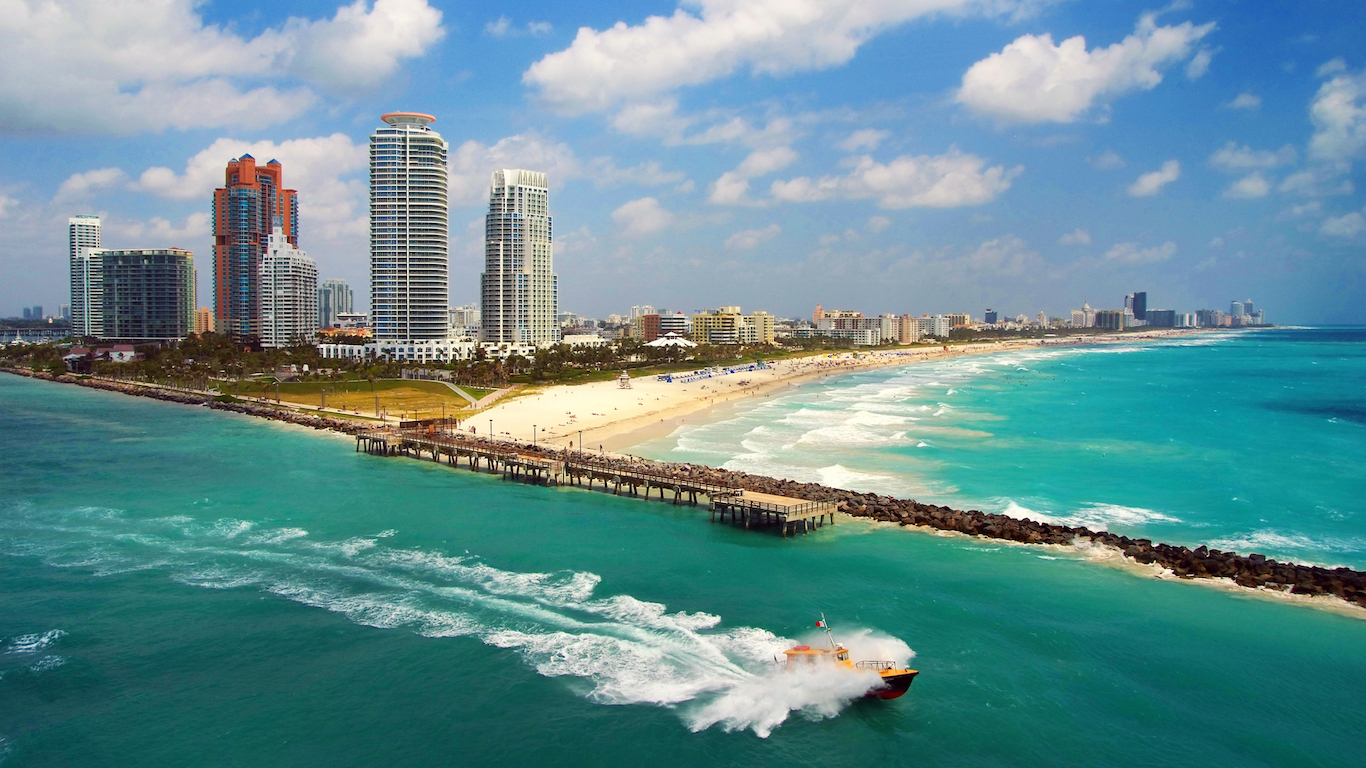
3. Miami-Fort Lauderdale-West Palm Beach, FL
> Population increase due to migration, 2010-2017: 450,144
> Population change, 2010-2017: +10.6% (5,566,299 to 6,158,824)
> Natural growth, 2010-2017: 490,495 births, 348,033 deaths
> Median home value: $260,600

Source: Thinkstock
2. Houston-The Woodlands-Sugar Land, TX
> Population increase due to migration, 2010-2017: 533,390
> Population change, 2010-2017: +16.4% (5,920,486 to 6,892,427)
> Natural growth, 2010-2017: 703,048 births, 266,717 deaths
> Median home value: $181,400
[in-text-ad-2]

Source: nthomas76207 / Wikimedia Commons
1. Dallas-Fort Worth-Arlington, TX
> Population increase due to migration, 2010-2017: 555,586
> Population change, 2010-2017: +15.1% (6,426,231 to 7,399,662)
> Natural growth, 2010-2017: 715,339 births, 299,371 deaths
> Median home value: $189,100
Detailed Findings
Not all of the cities with the largest net increases in population from migration are necessarily the fastest growing cities. However, among the U.S. metropolitan areas with the highest overall population increases, it is migration — mostly domestic migration — that accounts for the largest share of that growth.
Two notable exceptions are New York and Los Angeles. Tens of thousands more people moved out of each city than moved in. However, both cities have still had among the highest net increases in population due to natural population growth — hundreds of thousands more people in these cities have been born than have died. Notably, Los Angeles had a net migration loss of 93,959, but the overall population increased by over three-quarters of a million people because of births.
Frey explained that movement from New York and Los Angeles to many of the cities with the largest net migration gains is due to residents of these cities getting pushed out due to rising populations and rising prices, a product of the economic recovery. “Now that things are picking up again, people are moving out of cities. As the housing market is coming back, people are being sucked out of pricey areas to where it is more affordable again.”
Frey gave the example of one common migration pattern: Los Angeles to Las Vegas, the latter of which had the 15th highest net population increase due to migration, at 166,153. Las Vegas, Frey noted, has always added people seeking to move out of the bigger city, but when the recession hit and housing prices fell, that movement slowed significantly.
Now that Los Angeles housing prices have increased to unsustainable levels for many residents, people are once again moving out of the city in droves. As of 2016, Los Angeles had the seventh highest median home value of any metropolitan area, at $578,200. Las Vegas’ median home value is just slightly more than half that, at $233,700.
“The same sort of thing is true for a place like New York,” Frey said. “There has always been huge movement going from New York to Florida, but during the Great Recession period that slowed up quite a bit, and now it is picking up again.”
While most of these cities are in states known as retirement destinations, Frey cautioned that the narrative of retirees moving to the Sun Belt is frequently exaggerated and should not be interpreted as the reason cities like Miami, Phoenix Tampa, and Orlando have added a net of several hundred thousand more people.
Though some older people may move to so-called retirement destination, most older people prefer not to move. “The highest migration rates are people in their 20’s and early 30’s,” Frey said. Some of the places that are gaining the most migrants will gain a large share of the older population that is moving, like cities in Arizona and Florida, for example. “But even among the migrants who come to Arizona and Florida, only a tiny share are older people.”
Methodology
To identify the Cities Americans are Flocking to, 24/7 Wall St. reviewed the annual estimates of resident population and the estimates of the components of residential population change from April 1, 2010 to July 1, 2017, provided by the American Community Survey. Population, and home value data also came from the 2016 American Community Survey.
Sponsored: Find a Qualified Financial Advisor
Finding a qualified financial advisor doesn’t have to be hard. SmartAsset’s free tool matches you with up to 3 fiduciary financial advisors in your area in 5 minutes. Each advisor has been vetted by SmartAsset and is held to a fiduciary standard to act in your best interests. If you’re ready to be matched with local advisors that can help you achieve your financial goals, get started now.
Thank you for reading! Have some feedback for us?
Contact the 24/7 Wall St. editorial team.
Editors' Picks

