Poorest Countries in the World
June 12, 2018 by Sam StebbinsThe global economy is increasingly complicated and competitive. Countries are compelled to use whatever tools they have at their disposal to promote growth, attract business, and protect their economic interests. The international playing field is not level, however, and a number of unique disadvantages have made wealth creation and economic development nearly impossible in some parts of the world.
The poorest countries in the world, regardless of continent or hemisphere, often share some common traits. In several cases, they were under European colonial control and only gained independence some time in the last century. Many of the poorest countries have also recently been devastated by civil war or natural disasters. Poor populations are also often hamstrung by political corruption and instability, as well as inadequate infrastructure and public services.
Lacking the stability, and resources necessary to develop well-rounded, valuable economies of innovation, the poorest countries in the world tend to be heavily dependent on agriculture — both for subsistence and international trade. Further, the lack of economic activity in many of these countries has significant implications for public health and life expectancy.
24/7 Wall St. reviewed World Bank data on gross national income per capita based on purchasing power parity, or GNI per capita PPP, by country to identify the poorest countries in the world. This measure is commonly used to approximate average annual income. For reference, GNI per capita PPP in the United States is $54,151. In every country on this list, GNI per capita is below $3,000.
Click here to see the poorest countries in the world.
Click here to see our detailed findings and methodology.
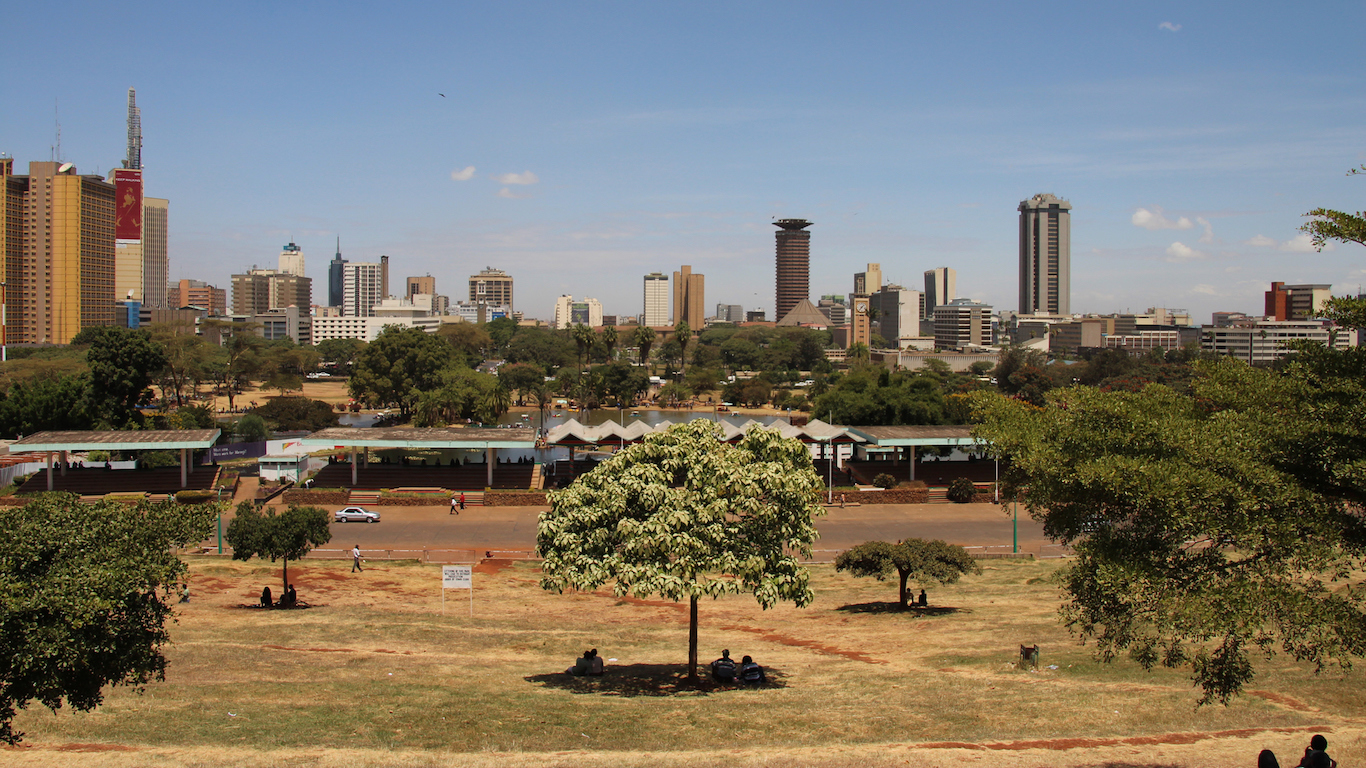
25. Kenya
> GNI per capita: $2,897
> 2016 GDP: $70.5 billion
> Population: 48.5 million
> Life expectancy: 67.0 years at birth
Kenya is one of 25 countries with a GNI per capita below $3,000. The Kenyan economy is largely dependent on farming. Agriculture accounts for 35.6% of the nation’s GDP, up from 27.8% as recently as 2010. Kenyan farmers typically grow corn, wheat, and rice, but domestic demand for these staples is greater that what the country produces, so Kenya imports much of its food from other countries.
Kenya’s economic struggles are likely compounded by rampant corruption.Transparency International rated Kenya 143 out of 180 countries in its Corruption Perceptions Index. More corrupt countries are riskier investment prospects for corporations and can lack the stability needed to build and grow successful businesses.
[in-text-ad]

24. Tanzania
> GNI per capita: $2,542
> 2016 GDP: $47.3 billion
> Population: 55.6 million
> Life expectancy: 65.7 years at birth
Tanzania is one of the fastest growing countries in the world with 21% population growth from 2010 to 2016 — three times the global population growth rate. As such, the population is also very young, with 43.7% of residents age 14 years or younger, and just 3.0% age 65 or older. The country faces significant health challenges, and has a life expectancy of 65.7 years at birth, one of the world’s lowest. Malaria is the leading cause of death of children under 5, and HIV is the most common cause of adult mortality in the country.
Tanzania’s economy is also growing relatively quickly. The east African country’s GNI per capita climbed 22.9% since 2010, well above the 17.9% comparable growth worldwide. Despite rapid growth, Tanzania’s $2,542 GNI per capita remains among the lowest of any country.
 24/7 Wall St.
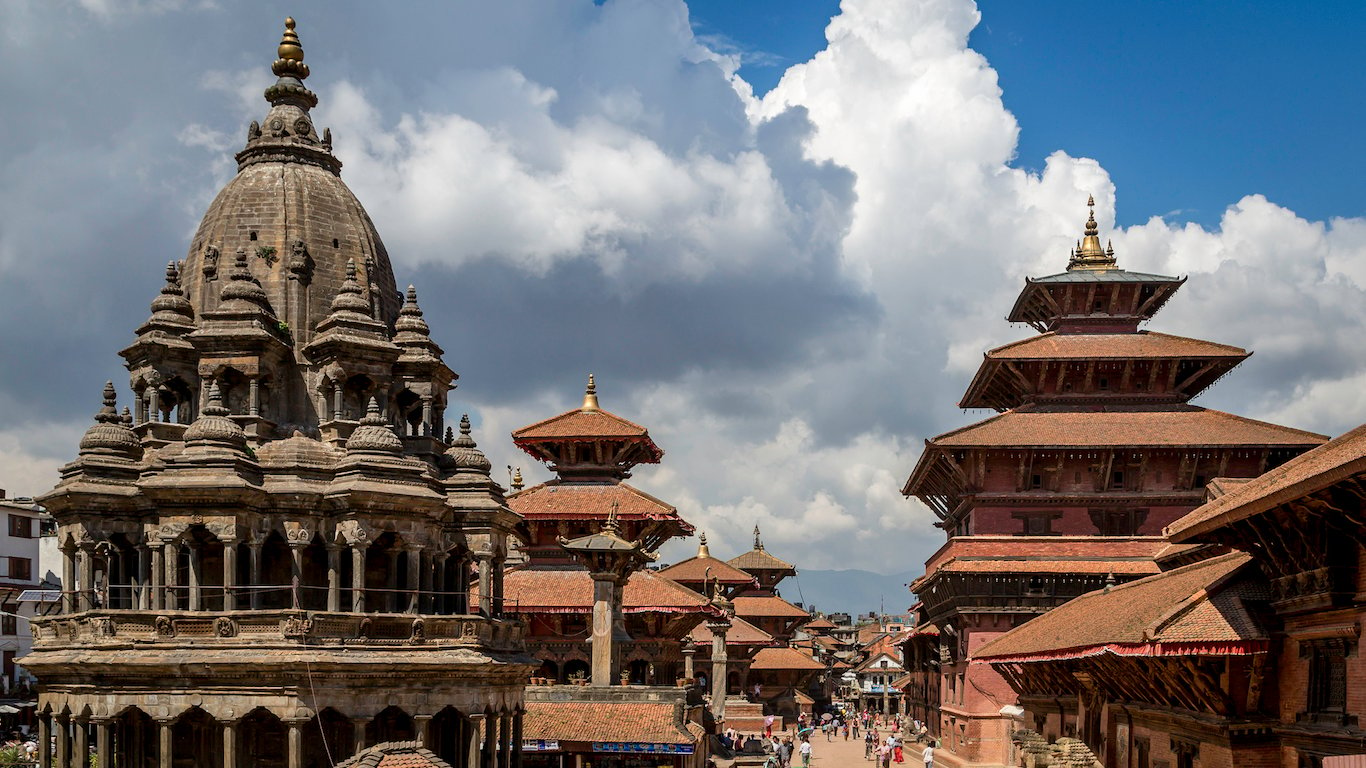
23. Nepal
> GNI per capita: $2,334
> 2016 GDP: $21.1 billion
> Population: 29.0 million
> Life expectancy: 70.3 years at birth
Along with Afghanistan, Nepal is one of only two Asian countries to rank among the world’s poorest. Nepal reported a decline in GNI per capita between 2015 and 2016. In 2015, the country was hit by a 7.8 magnitude earthquake, which killed over 9,000 people and badly damaged or destroyed hundreds of thousands of buildings near the city of Kathmandu.
As is the case in many poor countries, Nepal’s economy is largely driven by agriculture. Farming accounts for a third of Nepal’s economic output. Nepal is also one of only a few countries where exports account for less than 10% of total GDP. The the average Nepalese citizen lives on just $2,334 per year.
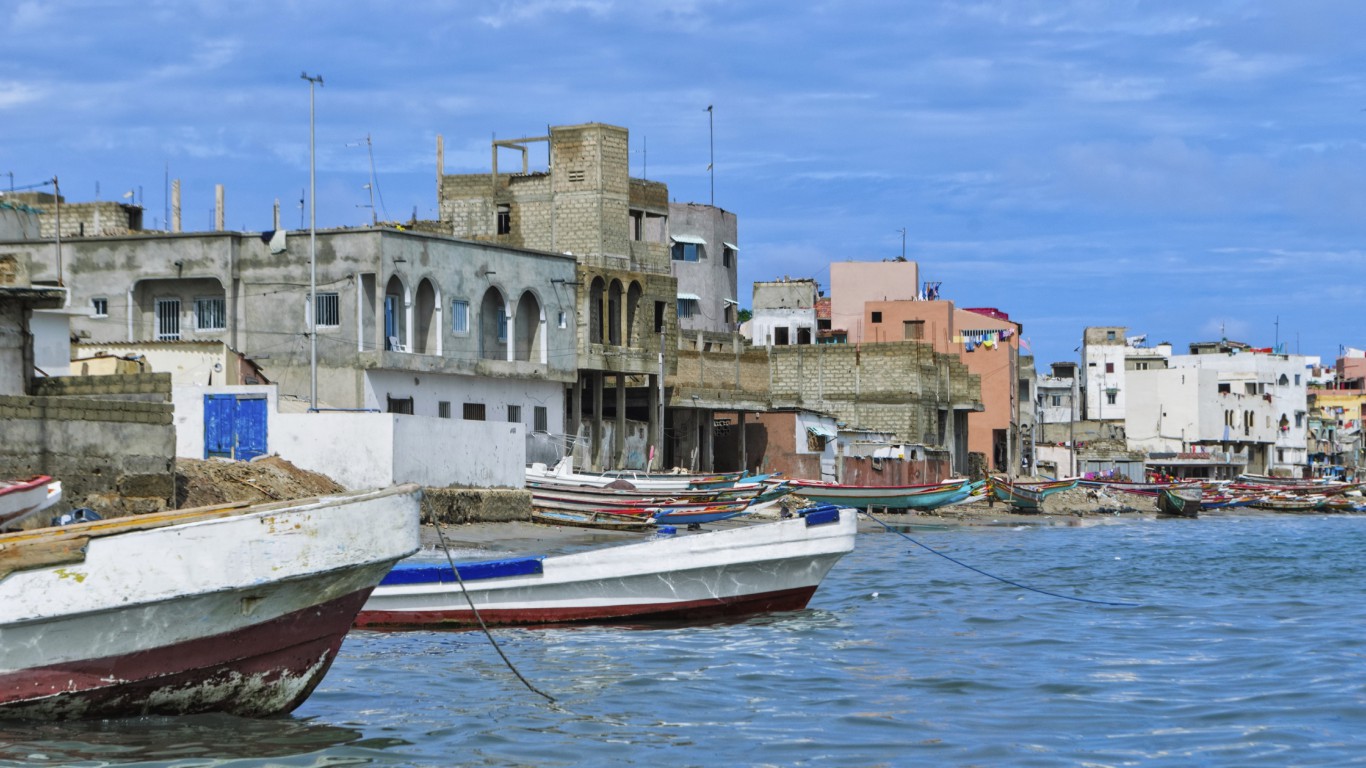
22. Senegal
> GNI per capita: $2,299
> 2016 GDP: $14.7 billion
> Population: 15.4 million
> Life expectancy: 67.1 years at birth
With a GNI per capita of just $2,299, the West African country of Senegal ranks among the poorest in the world. Formerly a major exporter of ivory and gold in the 17th and 18th centuries, Senegal now has a largely agrarian economy. Agriculture accounts for 17.5% of Senegal’s GDP. For comparison, agriculture accounts for just 4.6% of global economic output.
Unlike some other countries on this list, Senegal is investing heavily in education to improve quality and access, potentially setting itself up for a more dynamic workforce and stronger economic conditions in the coming years and decades. The Senegalese government spent 24.8% of its budget on education in 2014 compared to the 14.0% average allocation globally.
[in-text-ad-2]
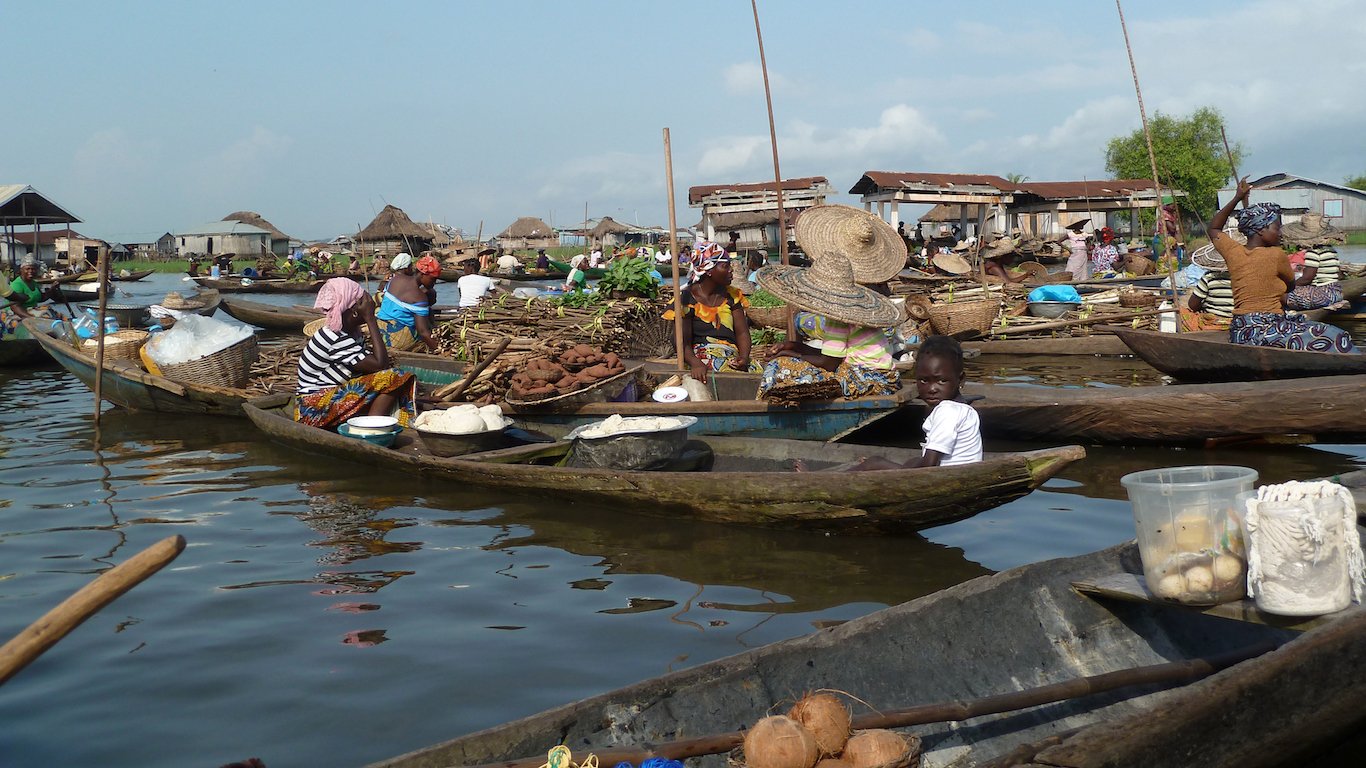
21. Benin
> GNI per capita: $2,011
> 2016 GDP: $8.6 billion
> Population: 10.9 million
> Life expectancy: 60.9 years at birth
Though it stands out as one of the most stable democracies in Africa, Benin is hamstrung by poor economic conditions. The average annual income in the country of just $2,011 is a fraction of the global average of $14,459. Poorer countries are often heavily dependent on agriculture and subsistence farming, and Benin is no exception. Agriculture accounts for over one-quarter of Benin’s GDP, more than five times the average across countries worldwide.
In international trade Benin ranks behind the majority of countries based on the total value of its exports. The country’s biggest exports are largely agricultural products, including cotton, cashews, coconuts, and Brazil nuts.
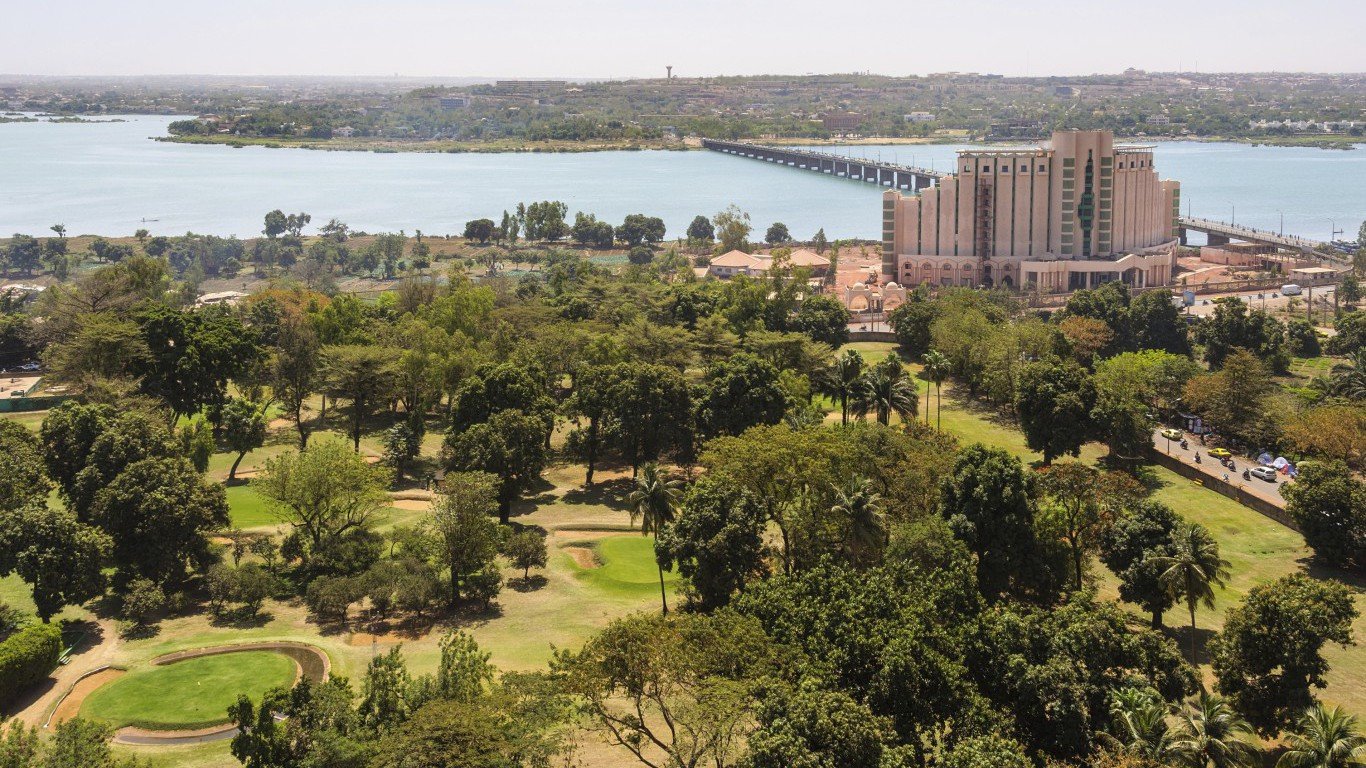
20. Mali
> GNI per capita: $1,909
> 2016 GDP: $14.0 billion
> Population: 18.0 million
> Life expectancy: 58.0 years at birth
Mali is one of only 20 countries with available adequate data where the average resident lives on less than $2,000 a year. Life expectancy tends to be lower in poorer parts of the world, and in Mali, life expectancy at birth is just 58 years — about 14 fewer years than the global average.
Mali is one of several countries on this list for which economic development has likely taken a back seat to more immediate problems. The Malian government still struggles to quell separatist uprisings, and as recently as 2013, Mali relied on French military assistance to retake towns held by Islamist insurgents.
[in-text-ad]
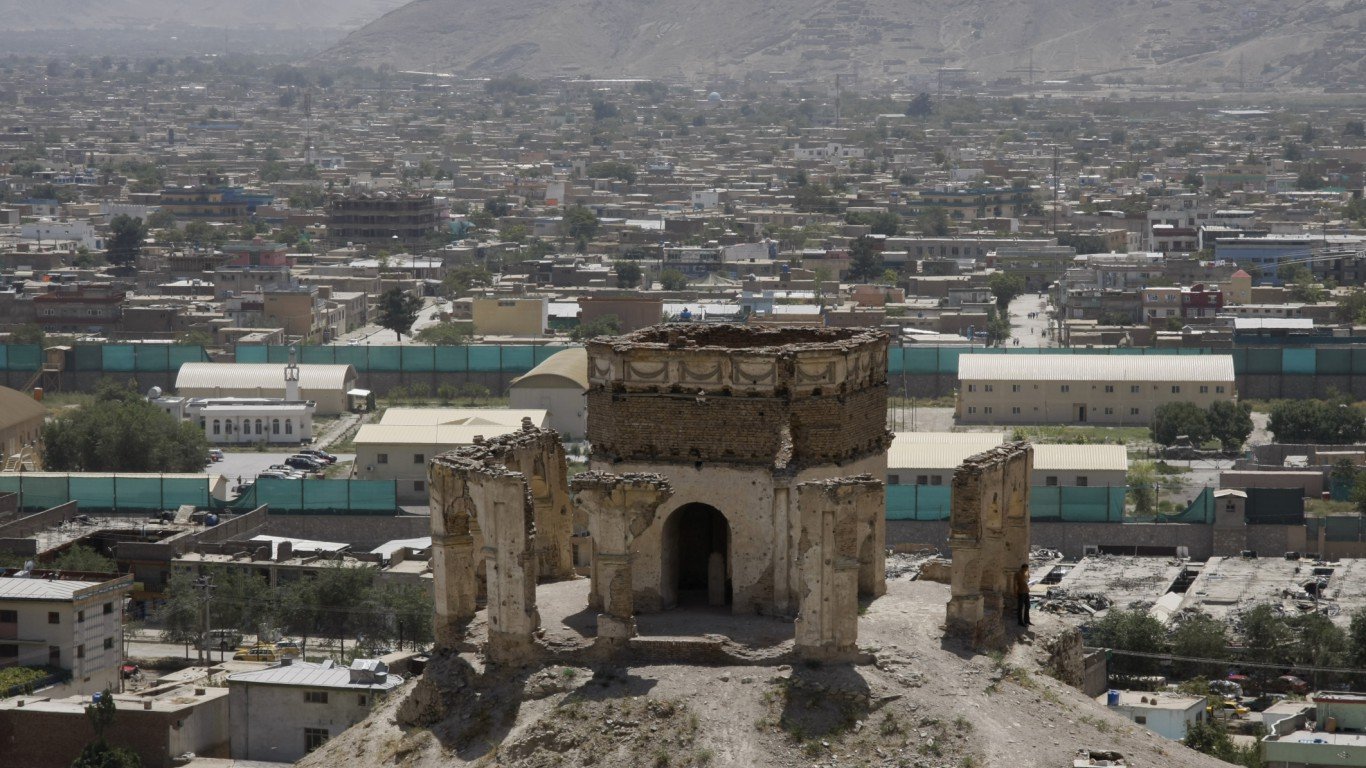
19. Afghanistan
> GNI per capita: $1,823
> 2016 GDP: $19.5 billion
> Population: 34.7 million
> Life expectancy: 63.7 years at birth
Afghanistan faces deep systemic problems rooted in decades of warfare and foreign invasions. Not long after the 1989 end of a decade-long soviet occupation — which resulted in over 1 million deaths — the Taliban seized control of the nation’s capital, imposing strict Islamic rule. Since 2002 Afghanistan was partially run by NATO forces, until 2014. Today, the newly instated Afghani government ranks among the most corrupt in the world and faces growing threats from insurgents.
No economy can thrive under such turbulent conditions, and Afghanistan ranks as one of the poorest countries in the world. The average resident lives on just $1,823 a year, a fraction of the global GNI per capita of $14,459.
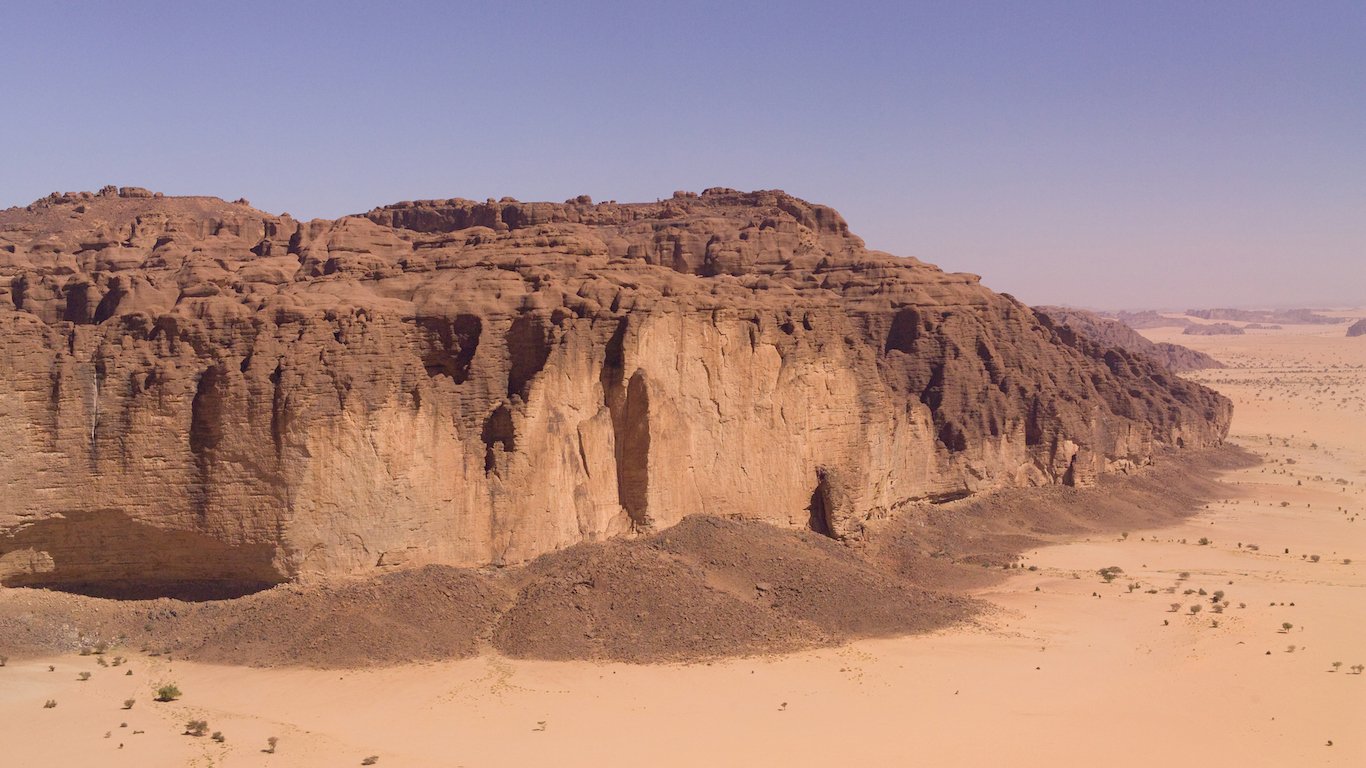
18. Chad
> GNI per capita: $1,817
> 2016 GDP: $9.6 billion
> Population: 14.5 million
> Life expectancy: 52.9 years at birth
Perhaps counterintuitively, many of the world’s poorest countries are rich in natural resources. Despite deposits of gold, uranium, and oil, Chad’s GNI per capita of $1,817 ranks among the lowest in the world. Still heavily reliant on farming, agriculture accounts for about half of Chad’s GDP. The low incomes contribute in part to the country’s low life expectancy. Life expectancy at birth in Chad is just 52.9 years.
According to corruption watchdog organization Transparency International, Chad ranks among the most corrupt countries in the world, based on the perceptions of its citizens. Such little faith in institutions can stifle economic development efforts.
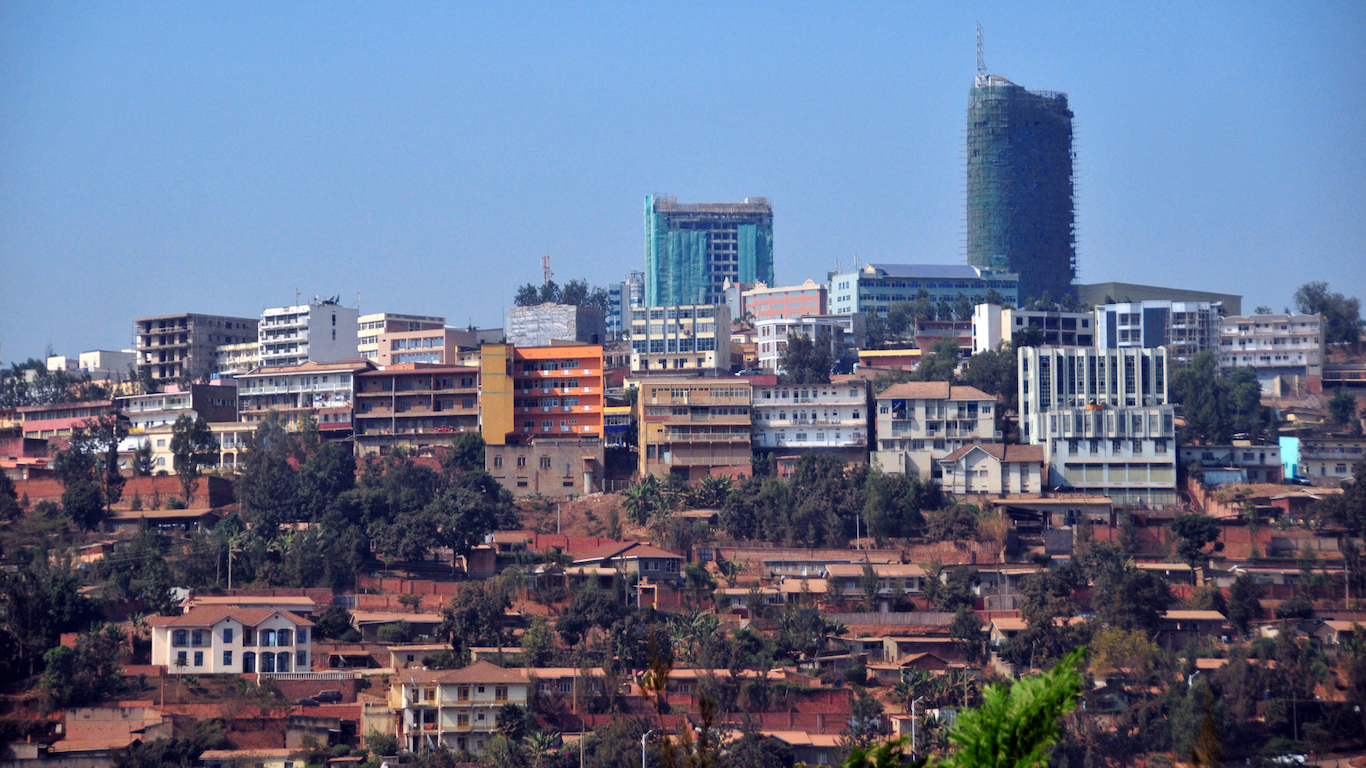
17. Rwanda
> GNI per capita: $1,727
> 2016 GDP: $8.4 billion
> Population: 11.9 million
> Life expectancy: 67.1 years at birth
Rwanda has come a long way since the genocide that devastated the country in the mid-1990s. Driven in large part by coffee and tea exports, Rwanda’s GNI per capita jumped by 28.6% between 2010 and 2016. For comparison, GNI per capita in the United States increased by just 7.9% over the same period. Despite improving conditions, Rwanda is still an exceptionally poor country, with the average resident living on just $1,727 a year.
While the country’s exports have expanded considerably in recent years, the economy remains heavily dependent on agriculture. Farming accounts for 31.5% of GDP, well above the 4.6% global average. Additionally, exports are equal to just 15.0% of Rwanda’s GDP compared to the 28.6% global average.
[in-text-ad-2]

16. Zimbabwe
> GNI per capita: $1,677
> 2016 GDP: $16.6 billion
> Population: 16.2 million
> Life expectancy: 61.2 years at birth
Zimbabwe’s GNI per capita of just $1,677 ranks as 16th lowest in the world. Poor economic conditions have driven many citizens to leave the country and look for work in neighboring South Africa. Despite its ranking among the world’s poorest countries, economic conditions in Zimbabwe have improved considerably in recent years. The country’s GNI per capita climbed 32.4% in the last six years, the second best improvement in Africa and one of the largest in the world.
Gaining independence from Great Britain as recently as 1980, Zimbabwe was headed by President Robert Mugabe until November 2017, when Emmerson Mnangagwa became the country’s first new president in 37 years. Transparency International ranks Zimbabwe’s government among the most corrupt in the world.
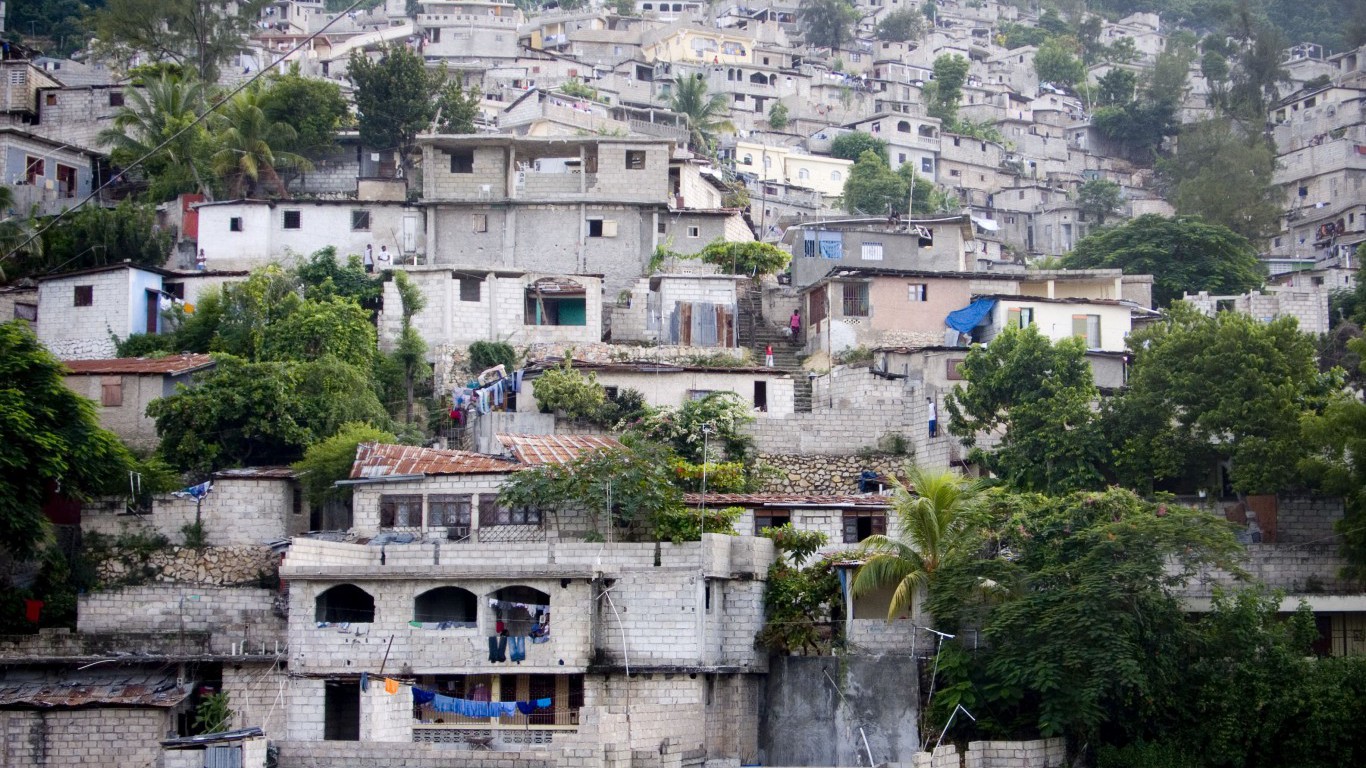
15. Haiti
> GNI per capita: $1,663
> 2016 GDP: $8.0 billion
> Population: 10.8 million
> Life expectancy: 63.3 years at birth
Haiti’s GNI per capita of $1,663 is the lowest of any country in the Western Hemisphere and 15th lowest in the world. Widespread economic hardship tends to impact health outcomes of a given population, and in Haiti, life expectancy at birth is just 63.3 years, or about nine years shy of the global average.
The country has a long history of political instability and has recently suffered the brunt of some devastating natural disasters. The island nation was slammed by Hurricane Matthew, which claimed the lives of hundreds of people just six years after a 2010 earthquake killed hundreds of thousands. The earthquake also demolished infrastructure and lead to a cholera epidemic that killed thousands more.
[in-text-ad]
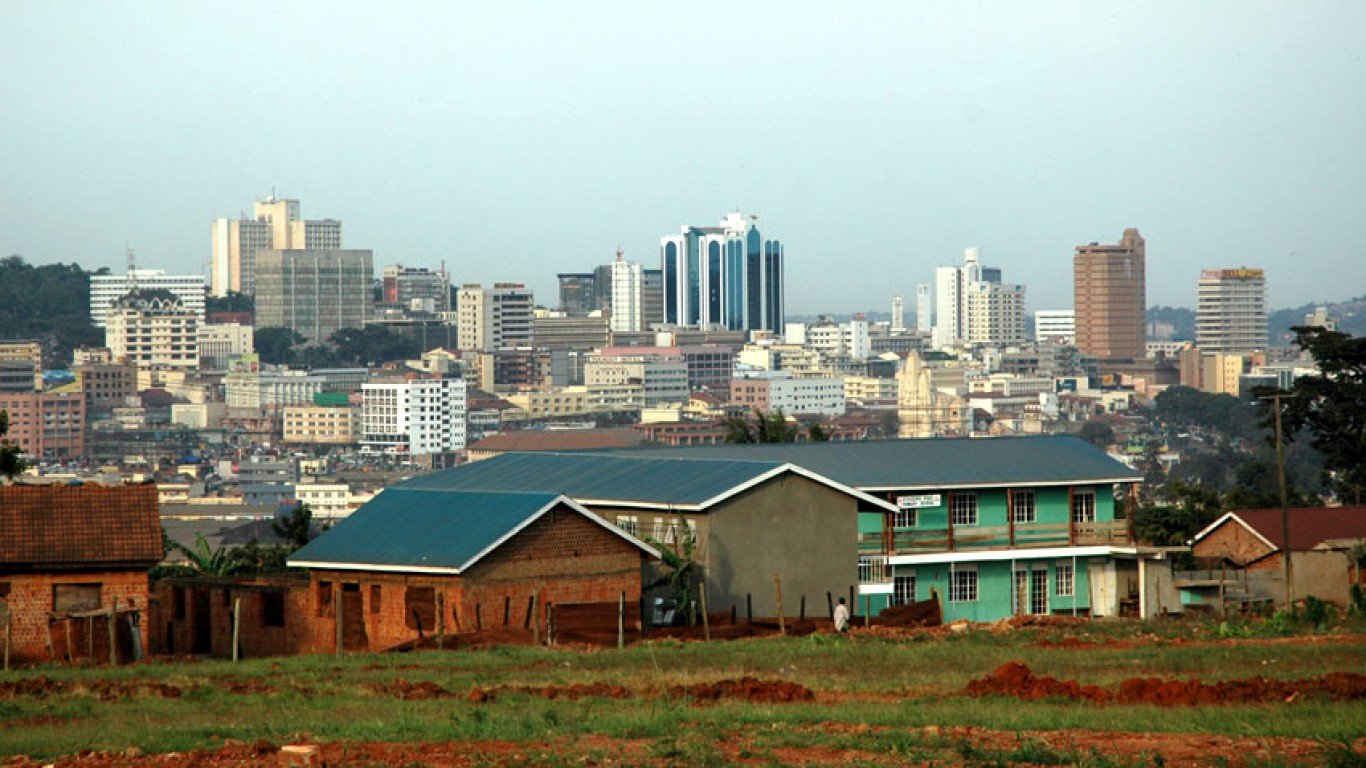
14. Uganda
> GNI per capita: $1,657
> 2016 GDP: $24.1 billion
> Population: 41.5 million
> Life expectancy: 59.9 years at birth
The average Ugandan lives on just $1,657 a year. Relative to much of the rest of the world, Uganda relies disproportionately on agriculture and less on trade. Political corruption may be stymying economic expansion in Uganda. The country has had the same president since 1986, and according to Transparency International, Ugandans have little faith that their government is acting ethically.
Like many countries on this list, Uganda’s population is growing rapidly. Between 2010 and 2016, the sub-Saharan nation’s population grew by 22%, more than triple the global population growth rate of 7% over the same period.
 24/7 Wall St.
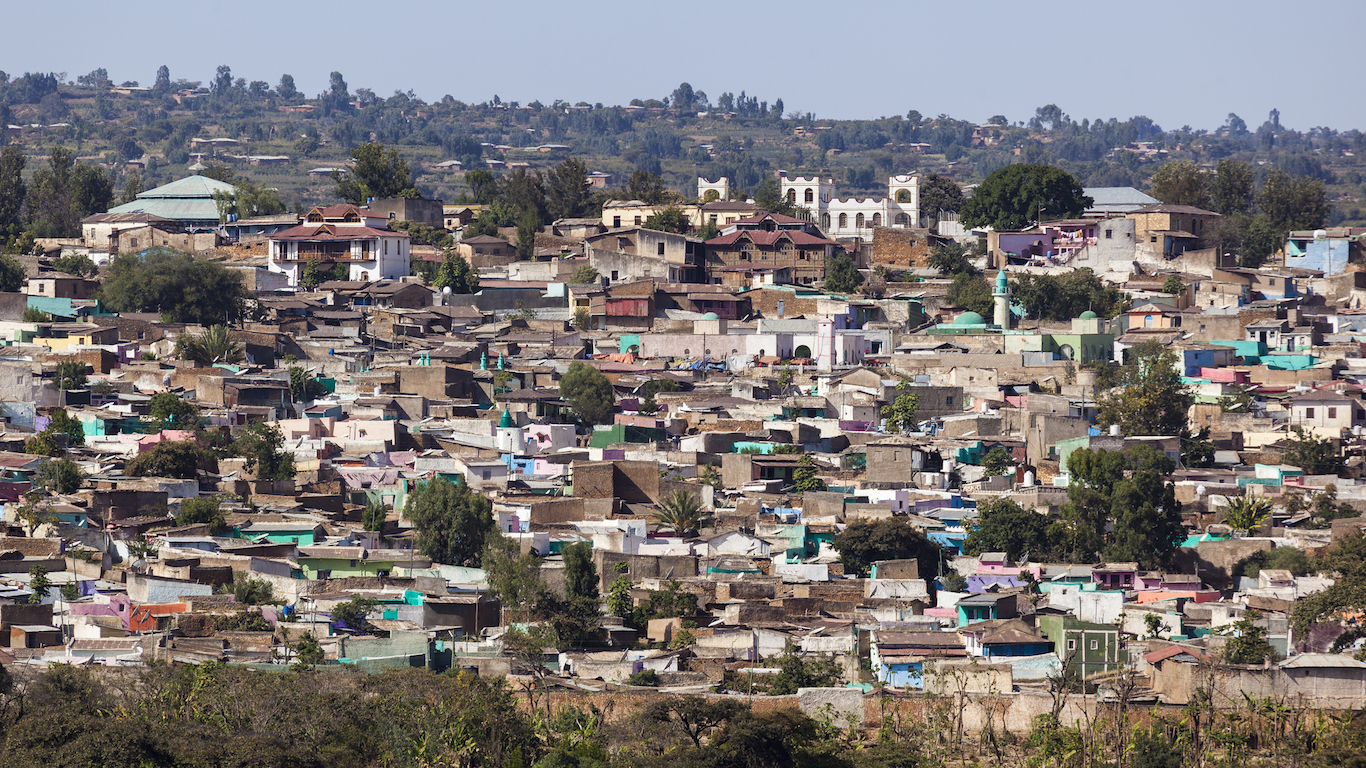
13. Ethiopia
> GNI per capita: $1,602
> 2016 GDP: $72.4 billion
> Population: 102.4 million
> Life expectancy: 65.5 years at birth
Unique among most African nations, Ethiopia has never been subject to a colonial power. Though it is the oldest independent nation on the continent, it still faces many of the same economic problems as some nearby nations that have only gained independence within the last 50 years. Poor countries are often heavily reliant on farming, and in Ethiopia, agriculture accounts for 37.2% of GDP — well above the 4.6% global average. Indeed, the bulk of the value of the country’s exports comes from agricultural goods like coffee, dried legumes, and seeds used in cooking oil. Ethiopians live on an average of just $1,602 a year.
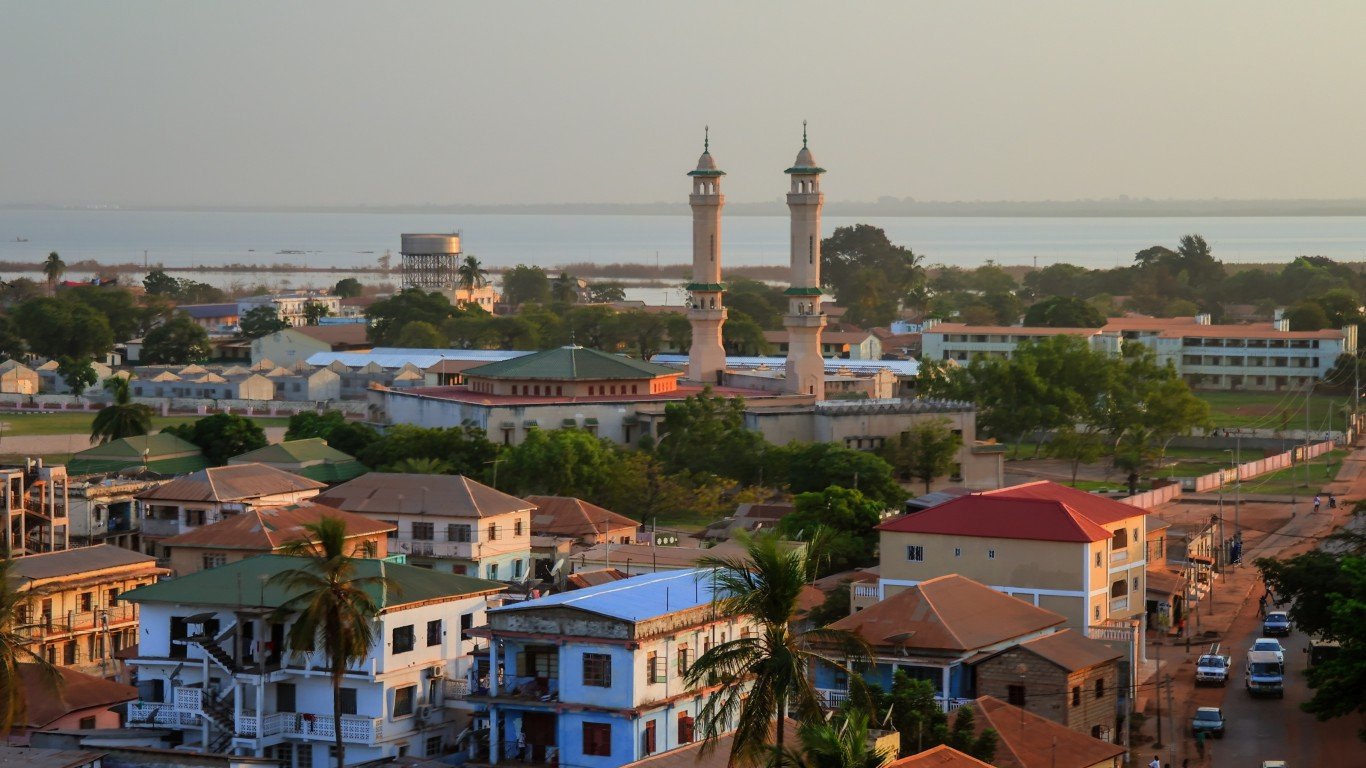
12. Gambia
> GNI per capita: $1,510
> 2016 GDP: $1.0 billion
> Population: 2.0 million
> Life expectancy: 61.2 years at birth
Gambia’s population expanded by 20% in the last six years, nearly three times the 7.0% global population growth rate over the same period. Economic growth, however, is not be keeping pace with population growth as Gambia is also one of the few countries on this list that has gotten poorer in the last six years. The West African nation’s GNI per capita fell from $1,593 in 2010 to $1,510 in 2016, a 5.2% drop.
Due to poor soil quality, the country has a limited range of exportable agricultural products. The bulk of Gambia’s export revenue comes from rough wood and nuts. Gambia’s economy is one of the smallest in the world, with a GDP just shy of $1 billion.
[in-text-ad-2]
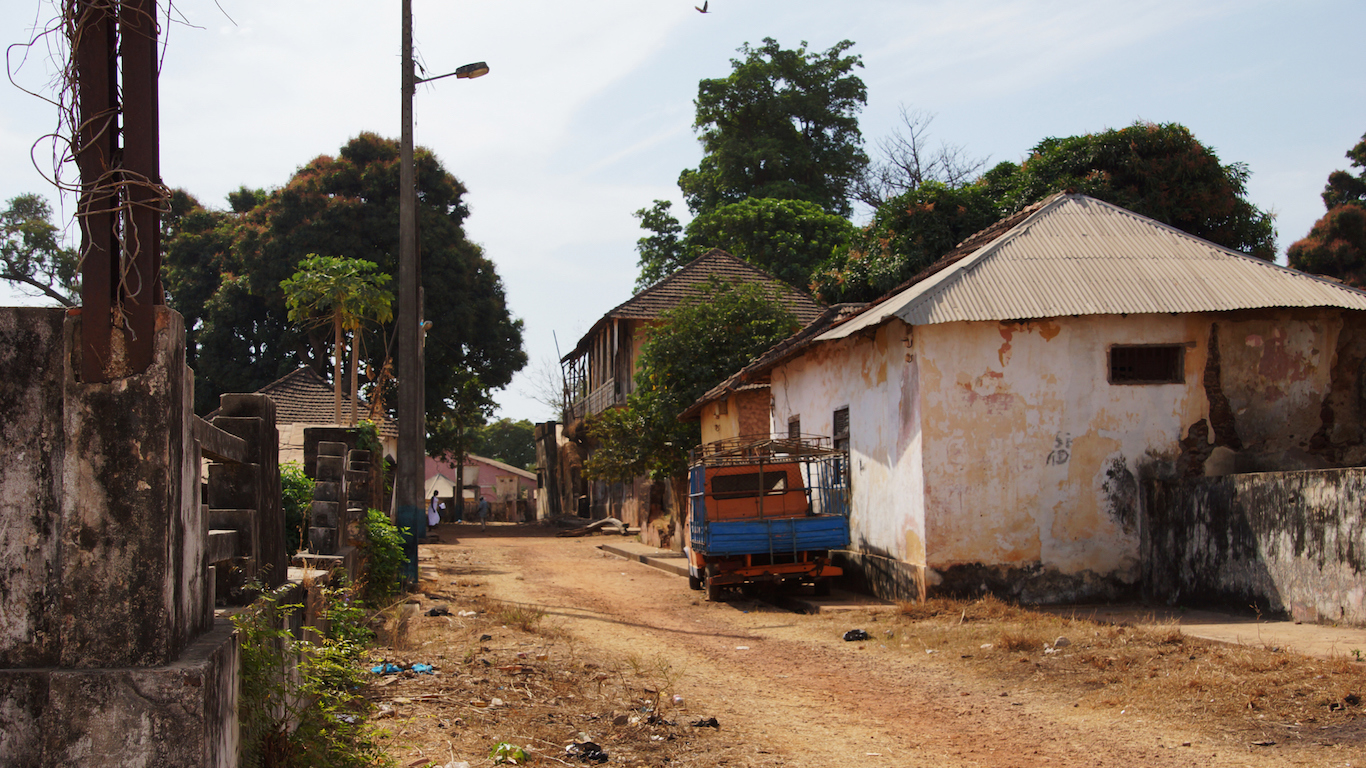
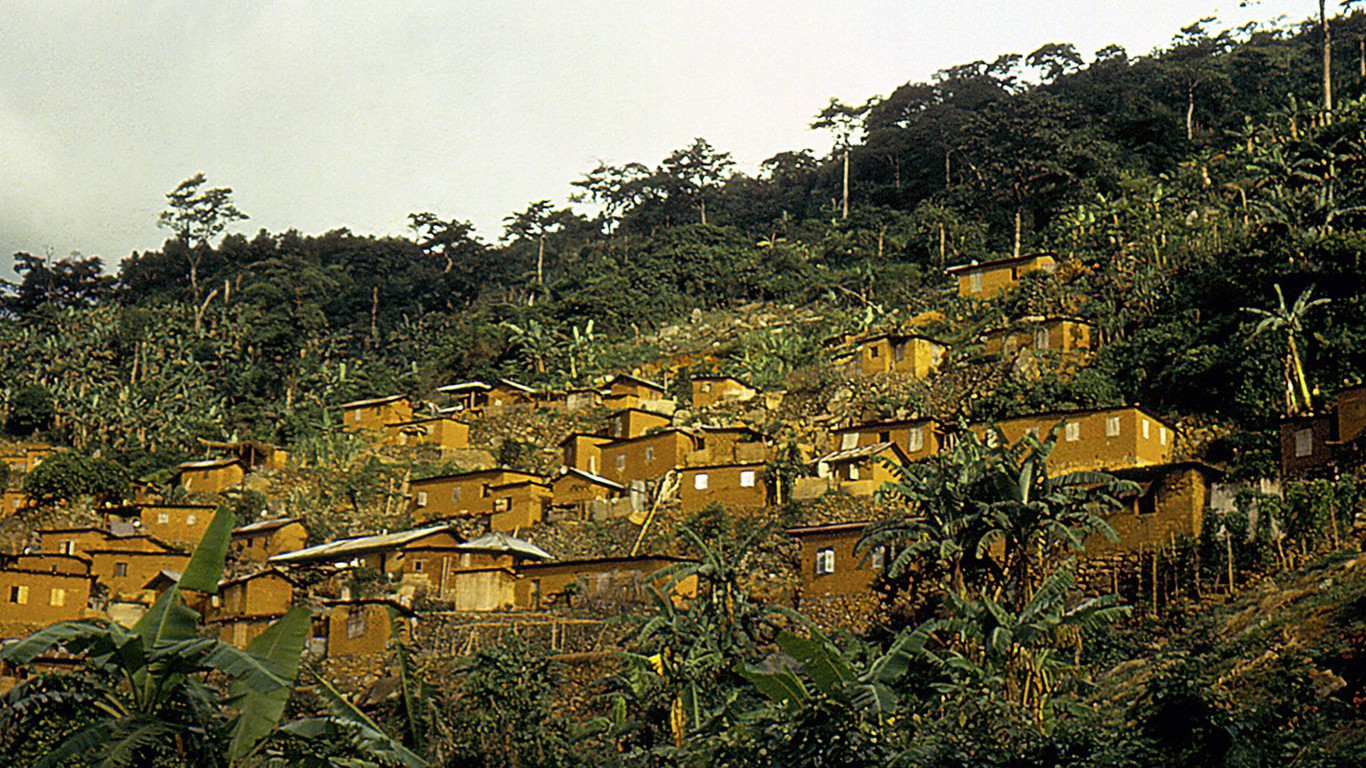
11. Guinea-Bissau
> GNI per capita: $1,431
> 2016 GDP: $1.2 billion
> Population: 1.8 million
> Life expectancy: 57.4 years at birth
Like most poor countries, Guinea-Bissau’s economy is largely based on farming. Agriculture accounts for about half of the country’s GDP, and coconuts, Brazil nuts, and cashews comprise over 80% of the total value of its exports. The the West African nation is heavily in debt and dependent on foreign aid.
Residents of Guinea-Bissau live on less than $1,500 a year, and as is often the case in poor countries, life expectancy is low. Life expectancy at birth in the country is just 57.4 years, about 15 years less than the global average.
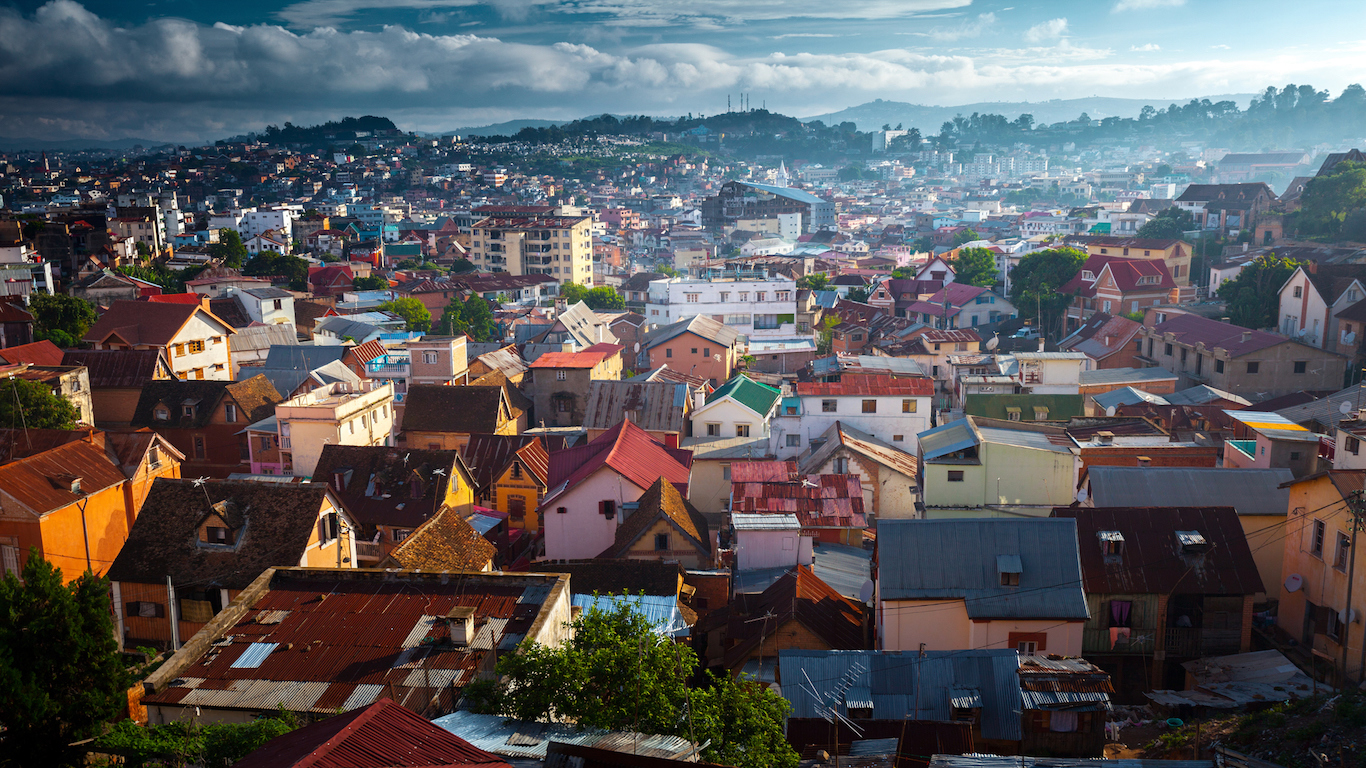
10. Madagascar
> GNI per capita: $1,339
> 2016 GDP: $10.0 billion
> Population: 24.9 million
> Life expectancy: 65.9 years at birth
Former French colony Madagascar is one of several resource-rich countries to rank among the world’s poorest. The island nation off the southeast coast of Africa has deposits of coal, graphite, semiprecious stones, and it exports vanilla, cloves, and vegetables, among other agricultural products. A relatively undeveloped economy, Madagascar derives about a quarter of its GDP from agriculture, compared to the 4.6% average across all countries. Infrastructure improvements and better access to technology would likely help modernize the country’s economy as currently just 4.7% of the population use the internet. Madagascar residents live on just $1,339 per year on average.
[in-text-ad]
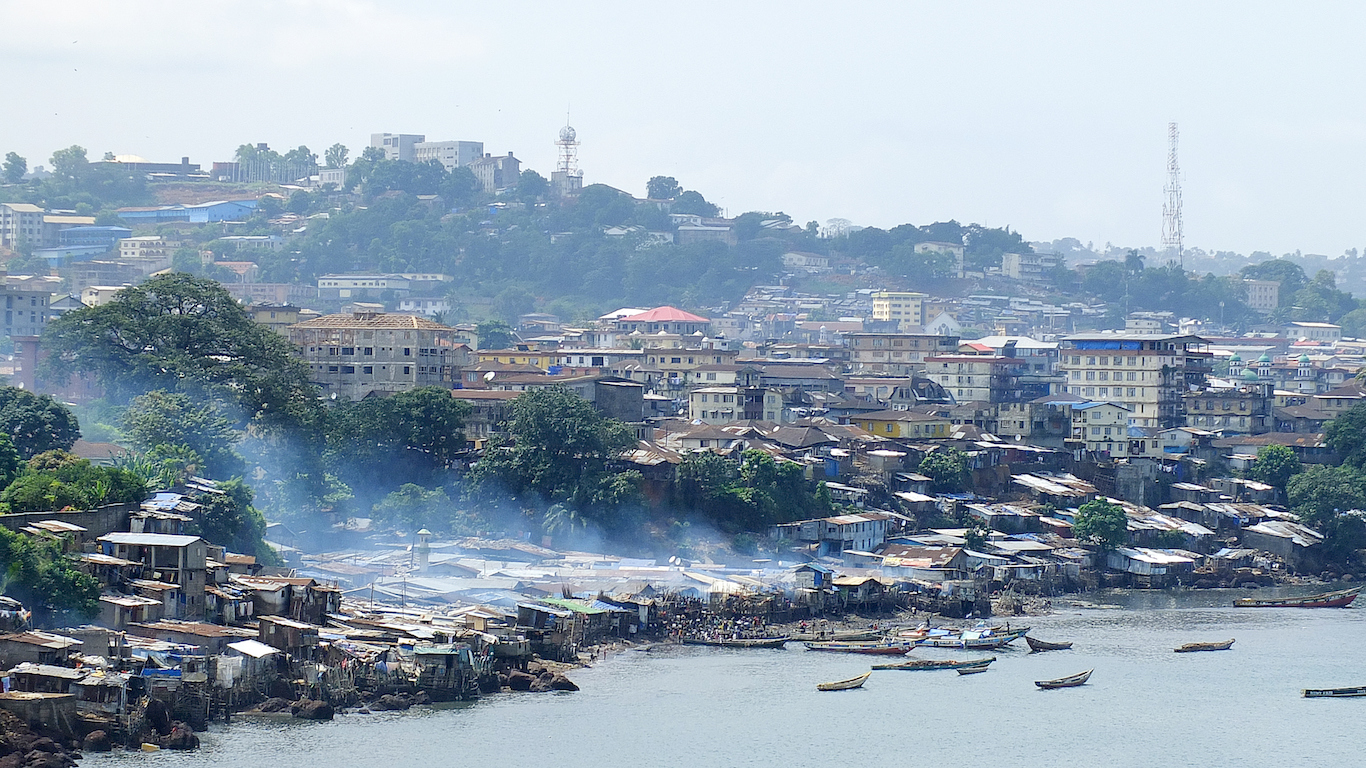
9. Sierra Leone
> GNI per capita: $1,221
> 2016 GDP: $3.7 billion
> Population: 7.4 million
> Life expectancy: 51.8 years at birth
Social and political instability have greatly hindered economic development in Sierra Leone as the West African nation is still reeling from an 11 year civil war that ended in 2002. Rich mineral deposits and the presence of precious gems have been a curse rather than a blessing on the country because their illicit trade has been the root of untold violence and suffering in the country. As recently as 2016, Sierra Leone suffered from an Ebola outbreak that claimed the lives of thousands throughout the region. Today, over half of the country’s GDP is derived from agriculture, a far greater share than is typical.
Sierra Leone’s GNI per capita is just $1,221. Due in part to poor economic conditions, life expectancy in the country is just 51.8 years.
8. Togo
> GNI per capita: $1,220
> 2016 GDP: $4.4 billion
> Population: 7.6 million
> Life expectancy: 60.2 years at birth
Togo’s GNI per capita of $1,220 is among of the lowest of any country, though it is improving. In 2010, GNI per capita was even lower at $1,047. The 16.6% increase is larger than that of most countries in the world.
Few countries are as reliant on agriculture as Togo. Some 41.3% of the country’s GDP came from agriculture in 2016, a significant increase from 2010, when agriculture accounted for less than a third of GDP. Cotton is the main cash crop, and other agricultural products include cocoa and coffee. Gold is the country’s top export, accounting for one-quarter of the total value of Togo’s exports.
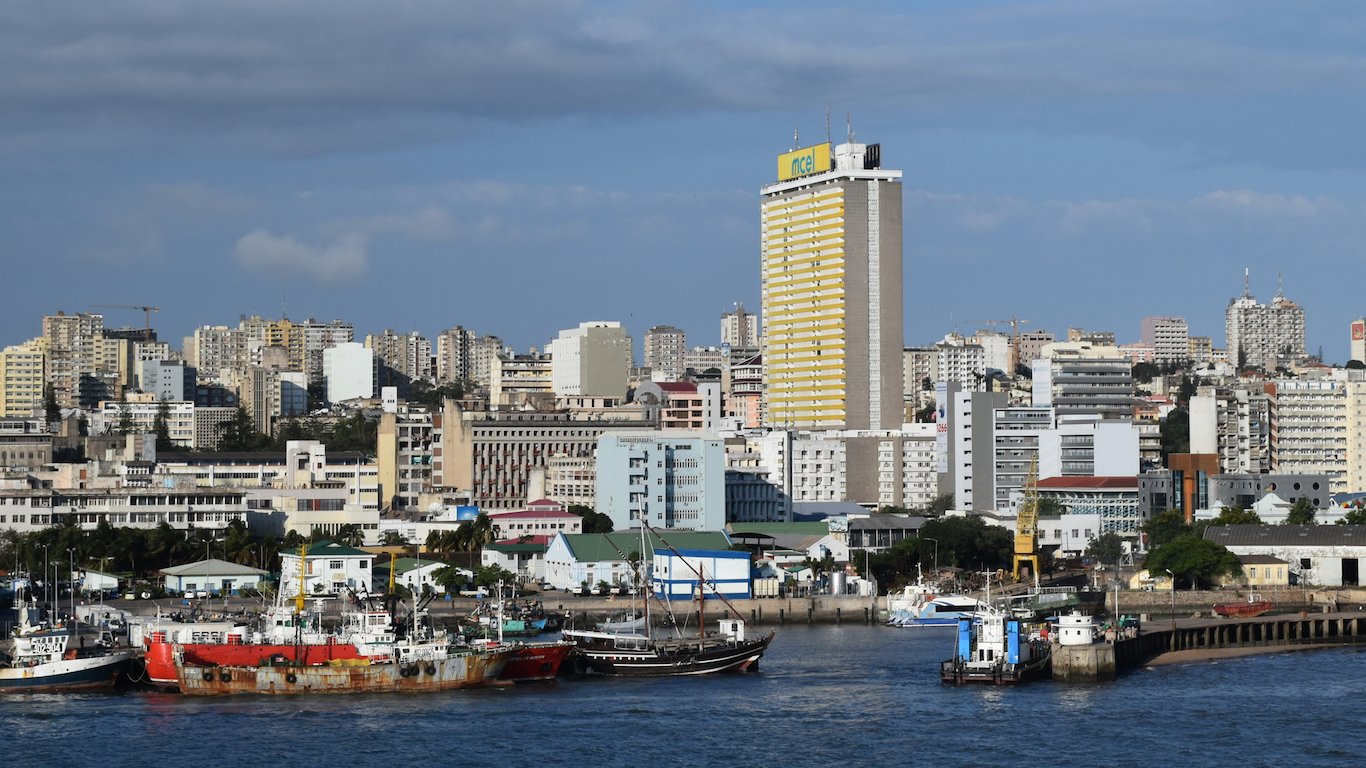
7. Mozambique
> GNI per capita: $1,100
> 2016 GDP: $11.0 billion
> Population: 28.8 million
> Life expectancy: 58.3 years at birth
A Portuguese colony until the mid 1970’s, Mozambique, like many countries on this list has only recently gained independence. Also like many other countries on this list, Mozambique’s recent history has been defined by conflict, as the country endured a decade and a half-long civil war.
In recent years, Mozambique’s economy has steadily improved. From 2010 to 2016, the country’s GNI per capita increased by 23.9%, one of the larger improvements of any nation. Despite the growth, GNI per capita in Mozambique remains among the lowest in the world, at $1,100.
[in-text-ad-2]
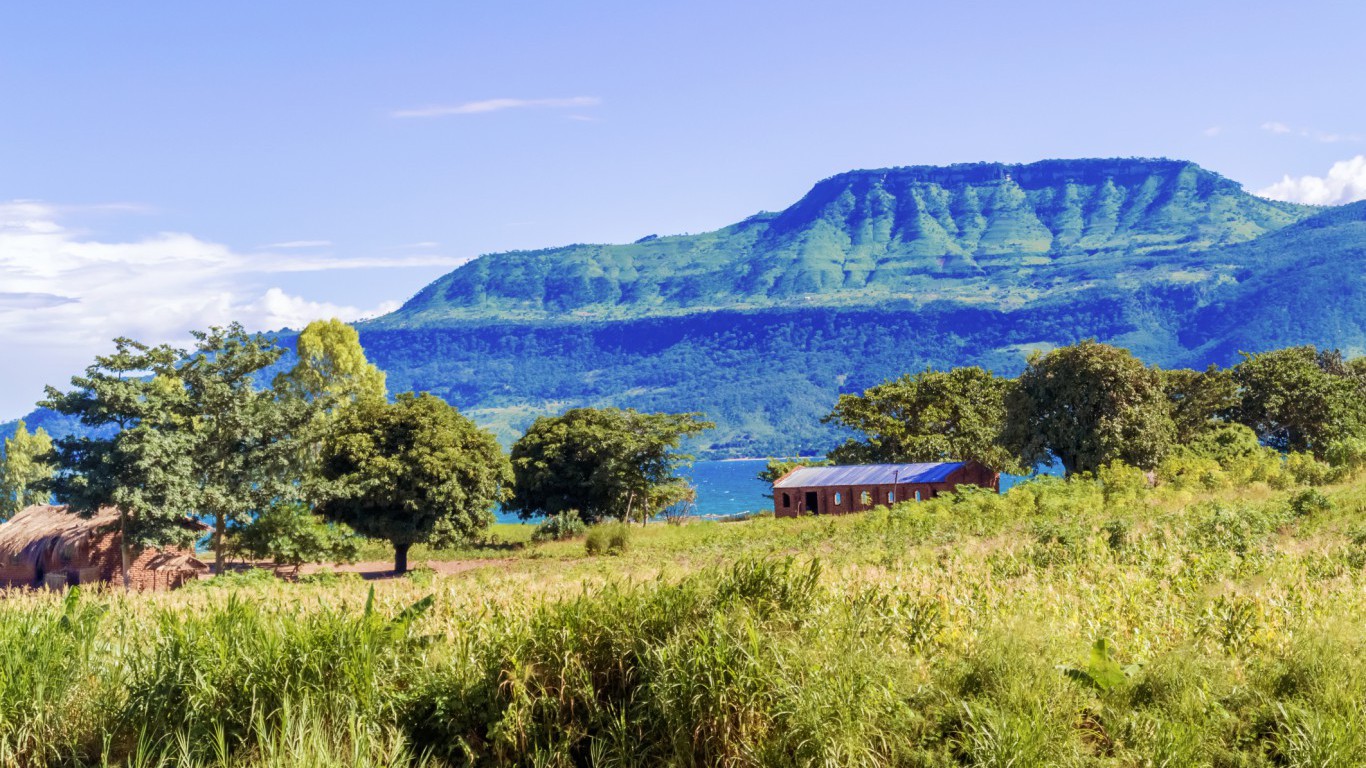
6. Malawi
> GNI per capita: $1,048
> 2016 GDP: $5.4 billion
> Population: 18.1 million
> Life expectancy: 63.2 years at birth
Malawi has a largely agrarian economy, with agriculture accounting for 28.1% of GDP, a far higher share than the average among countries worldwide of 4.6% of overall GDP. Tobacco and sugar alone account for over two-thirds of the total value of the country’s exports, and of all manufactured exports, high-technology products account for just 2%. Increased access to technology would likely help grow the country’s economy as currently fewer than one in 10 Malawi residents use the internet.
Hurdles to economic growth in Malawi include political corruption and pressing public health problems. Transparency International ranks the country worse than most when it comes to public sector corruption. Additionally, nearly one in every 10 citizens between the ages of 15 and 49 are HIV positive.
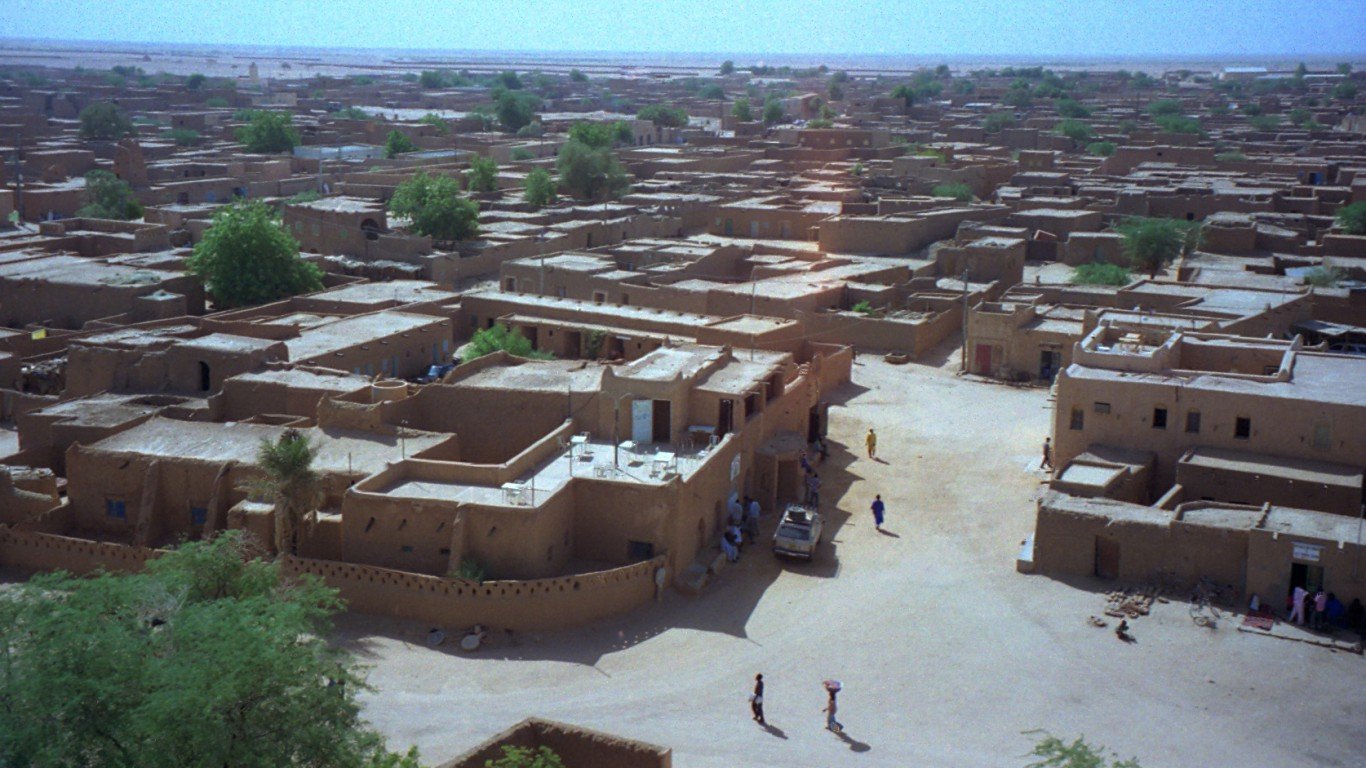
5. Niger
> GNI per capita: $897
> 2016 GDP: $7.5 billion
> Population: 20.7 million
> Life expectancy: 60.1 years at birth
Niger is one of just five countries in the world with a GNI per capita below $1,000. Niger gained its independence in 1960 from France. Since then, there have been several coups deposing leaders from power, most recently in 2010. The constant shifts in the country’s power structure has made it difficult for the economy to flourish.
Most citizens either farm or work with livestock as an occupation as there are relatively few alternative options. Agriculture accounts for 41.5% of Niger’s GDP, one of the highest shares in the world.
[in-text-ad]
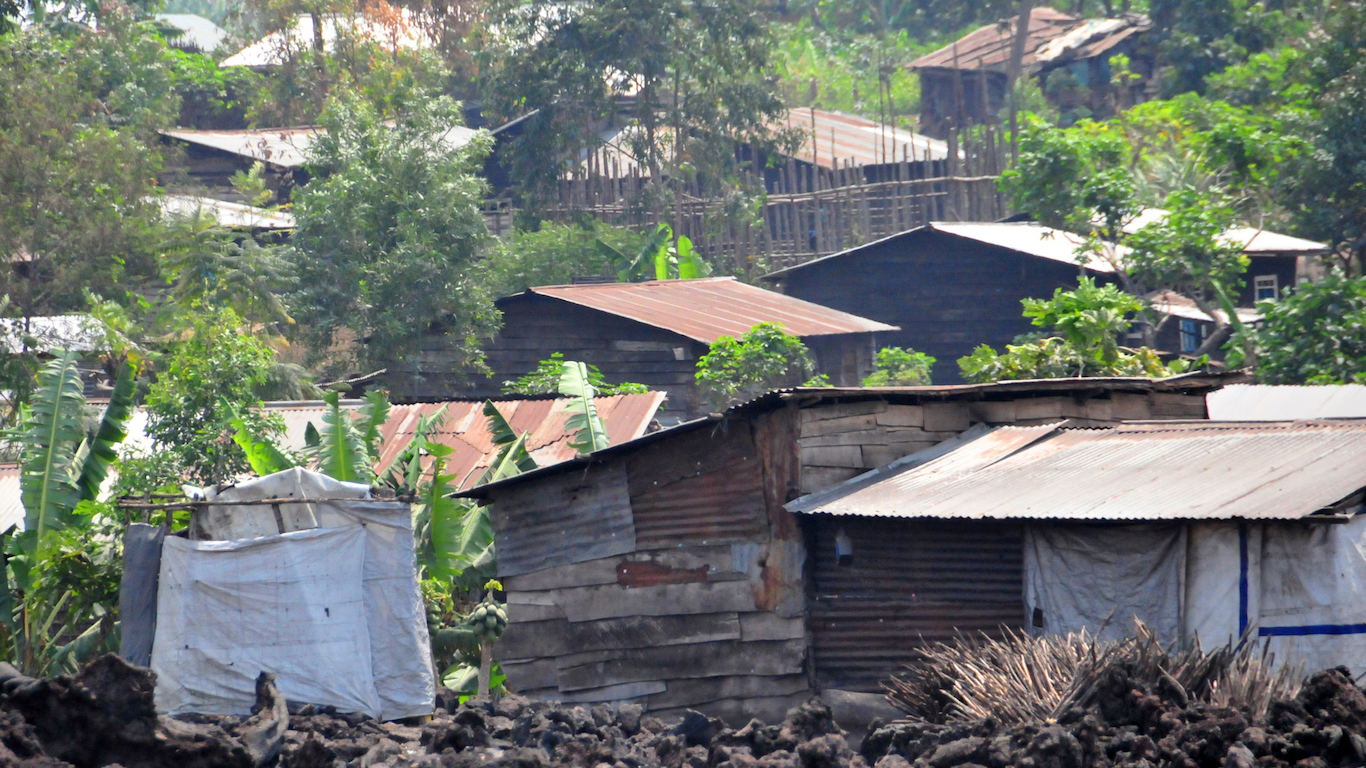
4. Democratic Republic of the Congo
> GNI per capita: $723
> 2016 GDP: $35.4 billion
> Population: 78.7 million
> Life expectancy: 59.6 years at birth
With a GNI per capita of just $723, the Democratic Republic of the Congo ranks as the fourth poorest country in the world. Like many poor countries, the DR Congo is resource rich, and its mineral wealth has only served to fuel a civil war that has claimed over 6 million lives through violence, starvation, and disease.
Partially due to the civil war that spanned 1997 through 2003 and ongoing conflict in regions of the country, the DR’s economy is among the least developed in the world. The country has no high-tech exports and just 6.2% of the population uses the internet.
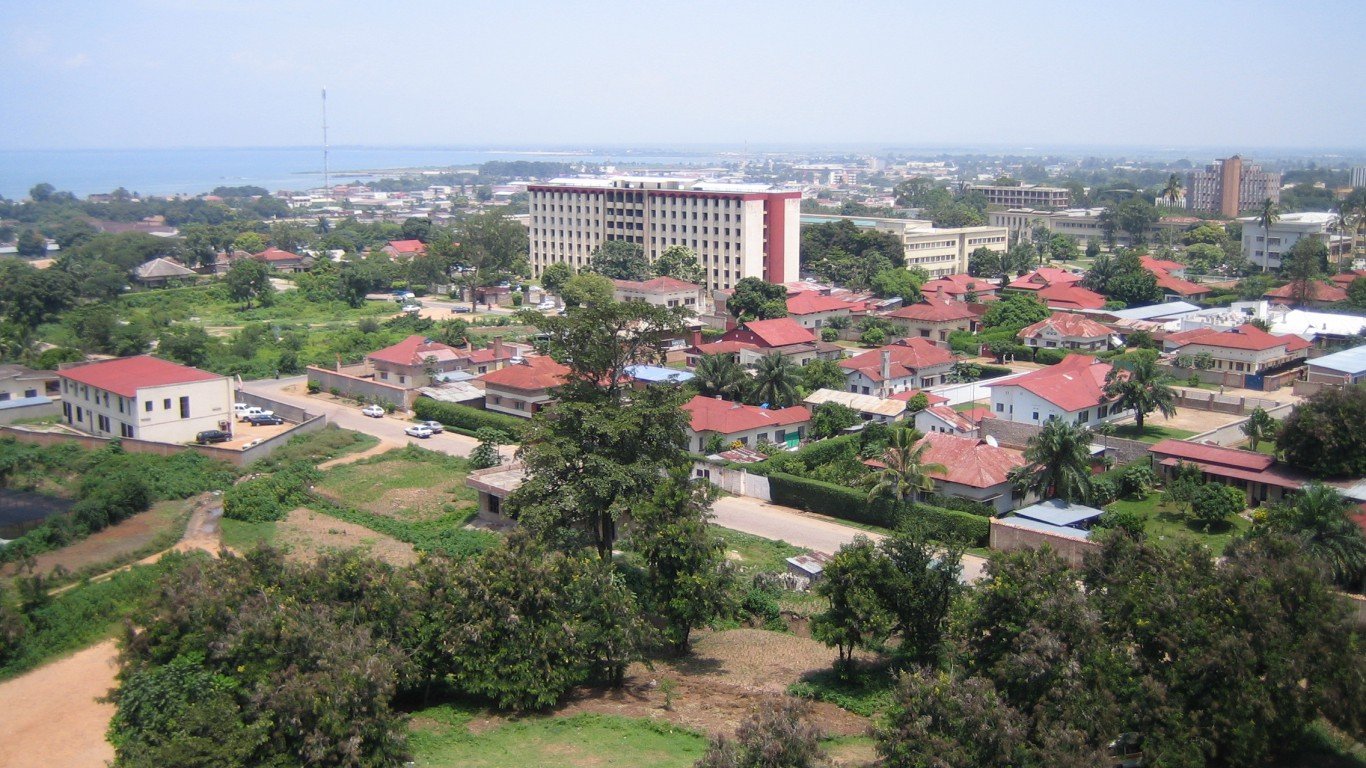
3. Burundi
> GNI per capita: $716
> 2016 GDP: $3.0 billion
> Population: 10.5 million
> Life expectancy: 57.5 years at birth
From 2010 to 2016, global GNI per capita increased by 17.6%. Yet in Burundi, GNI per capita dropped from $759 to $716 over that time, a 5.6% decline. Many of the world’s largest and most powerful economies export a high amount of goods and services relative to their GDP. In Burundi, exports of goods and services account for just 6.2% of the nation’s GDP, one of the lowest percentages of any nation.The East African nation’s primary exports include gold, coffee, and tea.
Burundi is one of the most corrupt countries in the world, according to Transparency International. A corrupt government can make it difficult for average citizens with no connection to power to improve their economic standing and end the cycle of poverty.
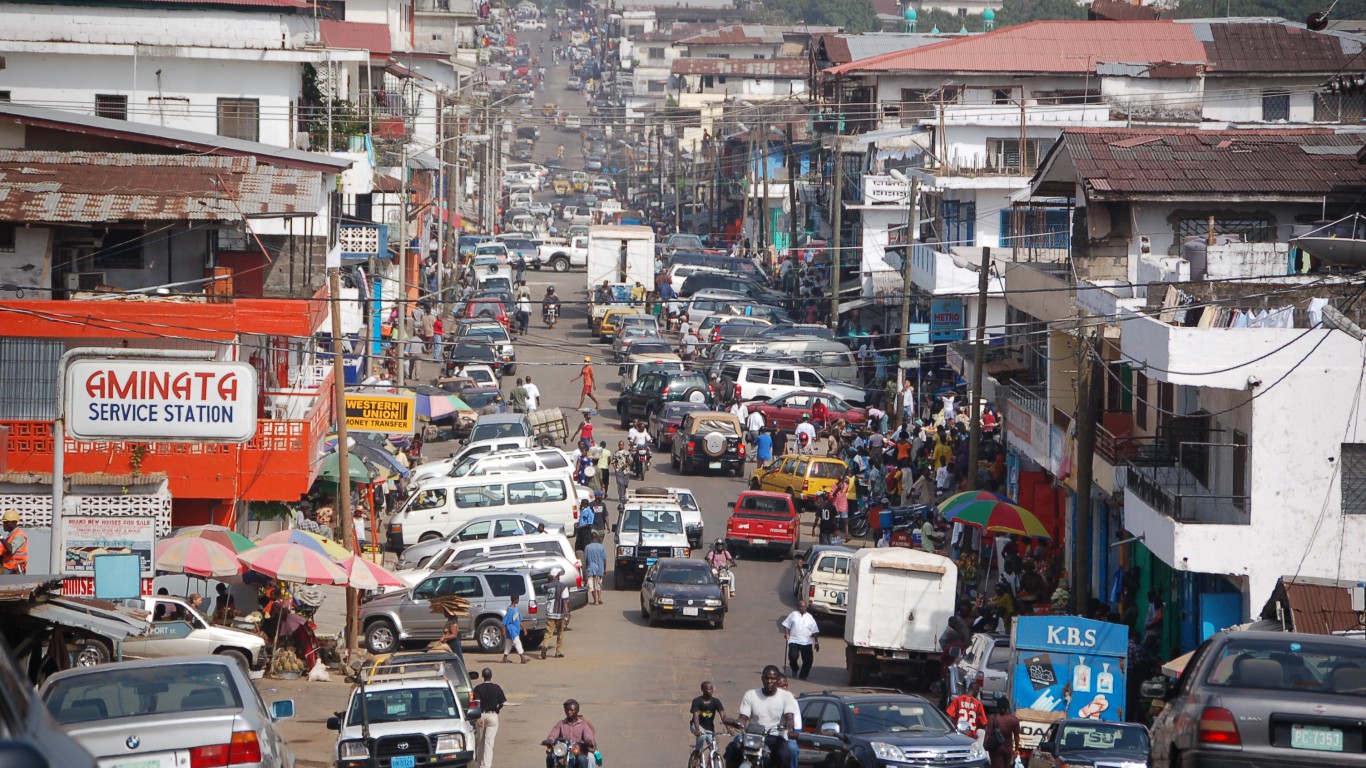
2. Liberia
> GNI per capita: $667
> 2016 GDP: $2.1 billion
> Population: 4.6 million
> Life expectancy: 62.5 years at birth
Liberia is one of only two countries where the average citizen lives on less than $700 a year. Illiteracy is one major hurdle to wealth creation in the west African nation. Greater education spending may go a long way to address the problem as the government spends only 8.1% of its budget on education compared to the average education spending across all countries of 14.2%. Access to electricity is another major problem in the country, and just 7.3% of the population uses the internet.
Economies dependent on agriculture are often poor, and farming accounts for over a third of Liberia’s GDP. In comparison, agriculture accounts for just 4.6% of GDP of the average world economy.
[in-text-ad-2]
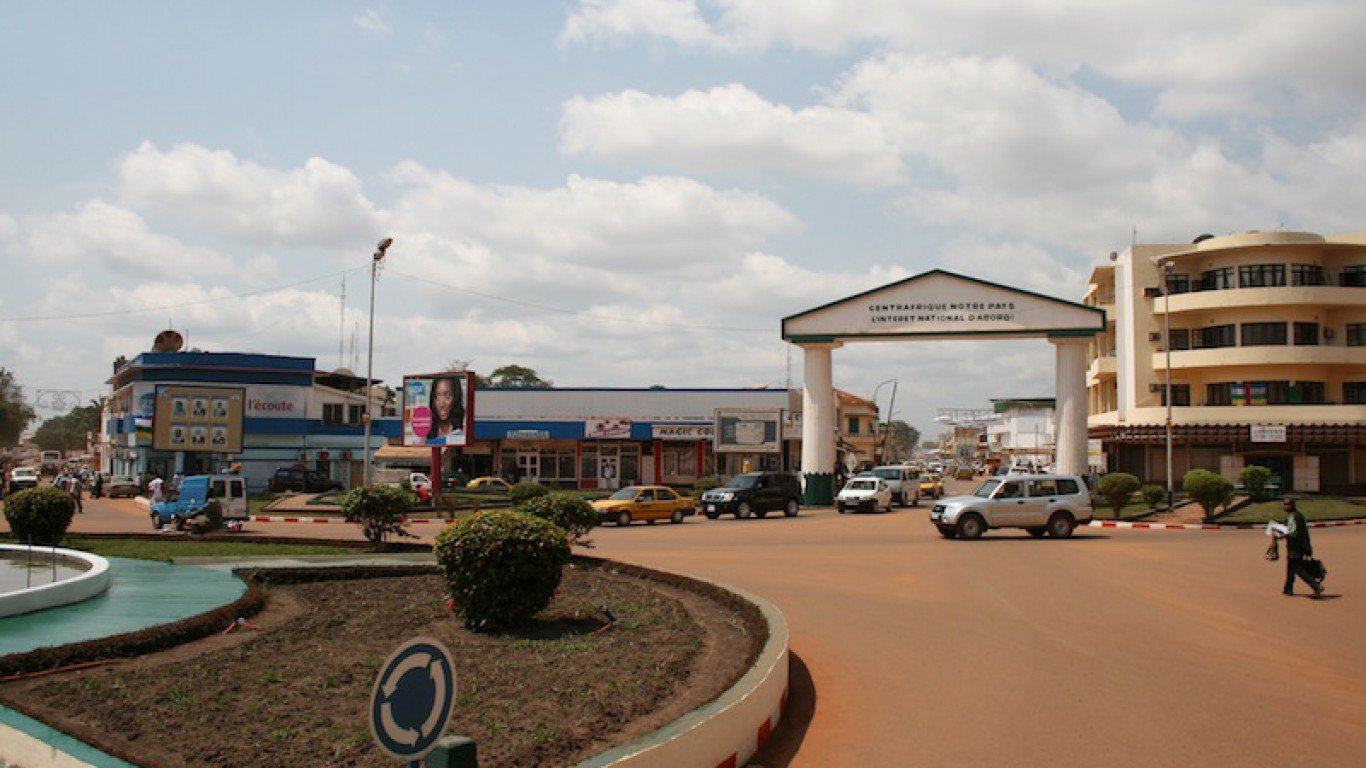
1. Central African Republic
> GNI per capita: $649
> 2016 GDP: $1.8 billion
> Population: 4.6 million
> Life expectancy: 52.2 years at birth
With a GNI per capita of $649, Central African Republic is the poorest country in the world. The sub-Saharan country has the resources to be a rich nation, but constant turmoil has kept it in a constant state of poverty. Fighting between Muslim and Christian groups has displaced thousands of residents since 2013, the same year President Francois Bozize was removed from office.
The coup that removed Bozize from office also seems to have had a massively negative effect on the Republic’s economy. In 2012, its GNI per capita was $951. The next year, it was just below $600. The Central African Republic’s economy largely depends on agriculture, which accounts for 42.9% of its GDP.
Detailed Findings & Methodology
GNI is perhaps similar to the more familiar measure of a country’s overall economic output, gross domestic product. But while GDP provides an accurate picture of the size of a nation’s economy, GNI is a more precise measure of the financial well-being of its citizens. A country’s GNI includes its total GDP as well as the net income generated by a country’s residents earned outside of national borders.
If an entrepreneur from France owns a factory in Germany, for example, the factory’s profits would be included in France’s GNI, but not its GDP. Accordingly, profits of foreign-owned companies within France would be excluded from the French GNI.
The vast majority of the world’s poorest countries as measured by GNI per capita are located in Africa. Most African nations face a unique set of hurdles to economic development. Nearly every country on the continent was at one time a European or British colony, many only gaining independence in the latter half of the 20th century. Many newly independent countries also break out into violent conflict immediately after decolonization, as warring political parties fight for dominance over the nation’s government.
There are many examples of countries on this list for which economic development may have taken a backseat to more pressing issues. Countries like Afghanistan, the Democratic Republic of the Congo, and Mali have all recently been mired in devastating conflicts. In Haiti, two major natural disasters in recent years have done untold damage to economic development.
Political instability and public sector corruption can also significantly hinder economic development. Countries with corrupt governments and unpredictable transitions of power are riskier investment prospects for corporations and can lack the stability needed to build and grow successful businesses. All but three countries on this list rank within the most corrupt half of all countries in the world, according to corruption watchdog group Transparency International’s Corruption Perceptions Index.
As opposed to wealthier countries, with export- and innovation-driven economies, the world’s poorest countries tend to depend heavily on agriculture and subsistence farming. In all but three countries on this list for which data is available, agriculture accounts for more than a fifth of overall GDP. In seven countries on this list, agriculture accounts for over 40% of all economic activity. For reference, agriculture accounts for just 4.6% of global GDP.
The implications of low incomes are serious. Without exception, the health outcomes for these countries’ populations are lagging. In each of the world’s poorest countries, life expectancy at birth is below the global average of 72 years. In nine countries on this list — including Sierra Leone, where life expectancy is just 52 years — life expectancy is below 60 years.
To identify the poorest countries in the world, 24/7 Wall St. reviewed gross national income per capita, purchasing power parity — tied to constant 2011 international dollars — for 131 countries with data from the World Bank. We ranked the bottom 25 countries based on GNI per capita and supplemented our analysis with data about GDP and GDP growth rates, as well as life expectancy, agricultural economic output, internet access, and government school spending from the World Bank. Additional trade data came from MIT’s Observatory of Economic Complexity and is for the most recent year available. Only countries with GNI per capita figures for 2016 were considered. In our analysis, we also included Transparency International’s Corruption Perceptions Index score, which ranks countries based on perceived corruption in the public sector.
Sponsored: Find a Qualified Financial Advisor
Finding a qualified financial advisor doesn’t have to be hard. SmartAsset’s free tool matches you with up to 3 fiduciary financial advisors in your area in 5 minutes. Each advisor has been vetted by SmartAsset and is held to a fiduciary standard to act in your best interests. If you’re ready to be matched with local advisors that can help you achieve your financial goals, get started now.