
The American dream means economic opportunity and mobility, especially to new generations of Americans. While debates rage on about whether the American dream is as it used to be, research certainly indicates it is not uniform across the country. While opportunities and upward income mobility exist in some areas, they are close to zero in others and have been falling sharply in recent decades.
It used to be that the vast majority of children ended up earning more than their parents. Today, however, the situation is vastly different. According to recent research on intergenerational mobility, approximately 90% of children born in the 1940s earned more than their parents, while only roughly 50% of children born in the 1980s — many of whom are entering the labor force today — do.
The Equality of Opportunity Project considered average incomes of 26-year-olds raised in the bottom quartile of income in 2,973 U.S. counties. A 26-year-old from this background who earns more than the national average for the bottom quartile is said to have managed upward income mobility.
The researchers found that neighborhood environments have substantial effects on children’s long-term economic outcomes. The probability of earning in adulthood more than $26,090 — the average annual income for the bottom quartile nationally — goes down every year of childhood spent in nearly 1,000 counties. To highlight the substantial geographic variation of this pattern, 24/7 Wall St. reviewed the 50 counties where the average income losses are greatest.
Children growing up in counties with less concentrated poverty, less income inequality, better schools, a larger share of two-parent families, and lower crime rates are significantly more likely to surpass their parents later in life.
Click here to see the counties where the American dream is dead.
Click here to see our detailed findings.
Click here to see our methodology.

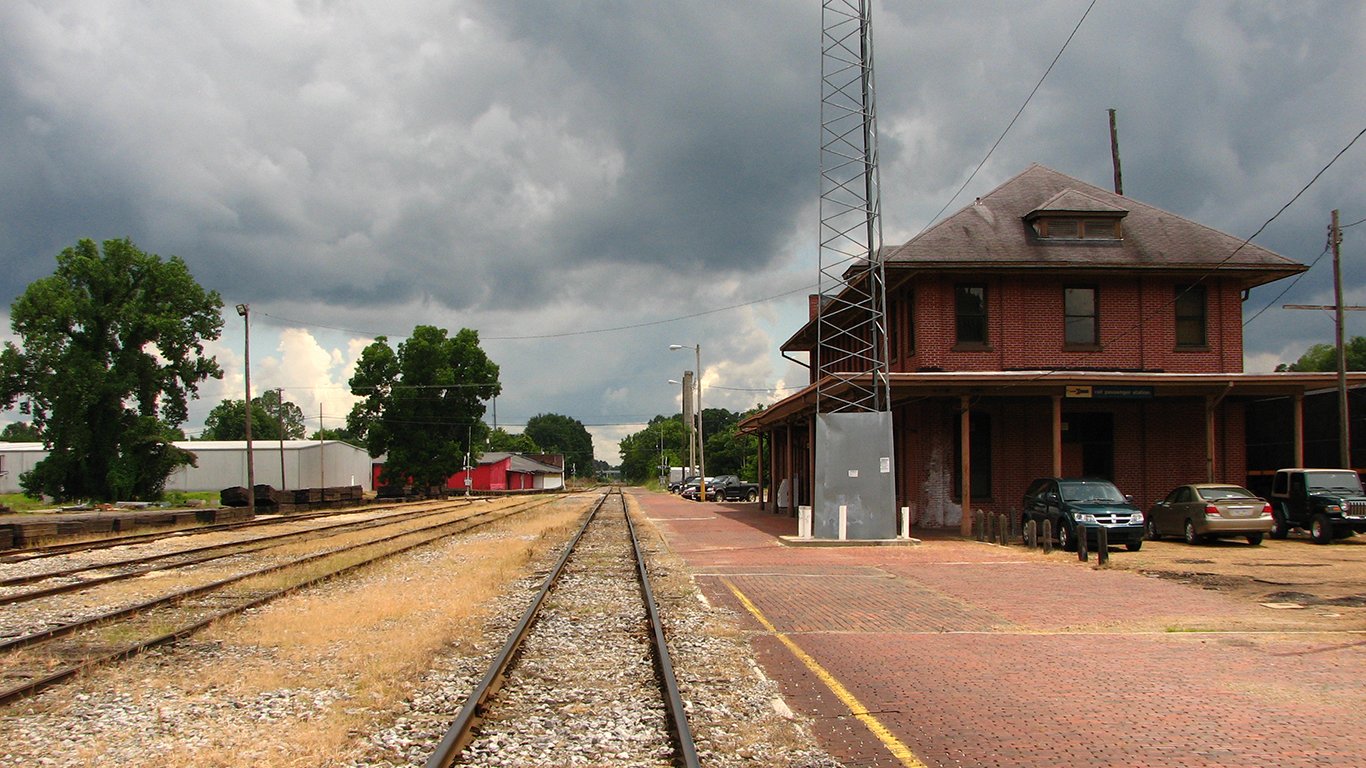
Source: Rivers Langley; SaveRivers / Wikimedia Commons
50. Macon County, Alabama
> Avg. income loss per year of childhood residence: -$201
> Population: 18,755
> Household income per capita: $24,917
> Poverty rate: 25.5%
> Jan. 2018 unemployment rate: 5.3%
[in-text-ad]

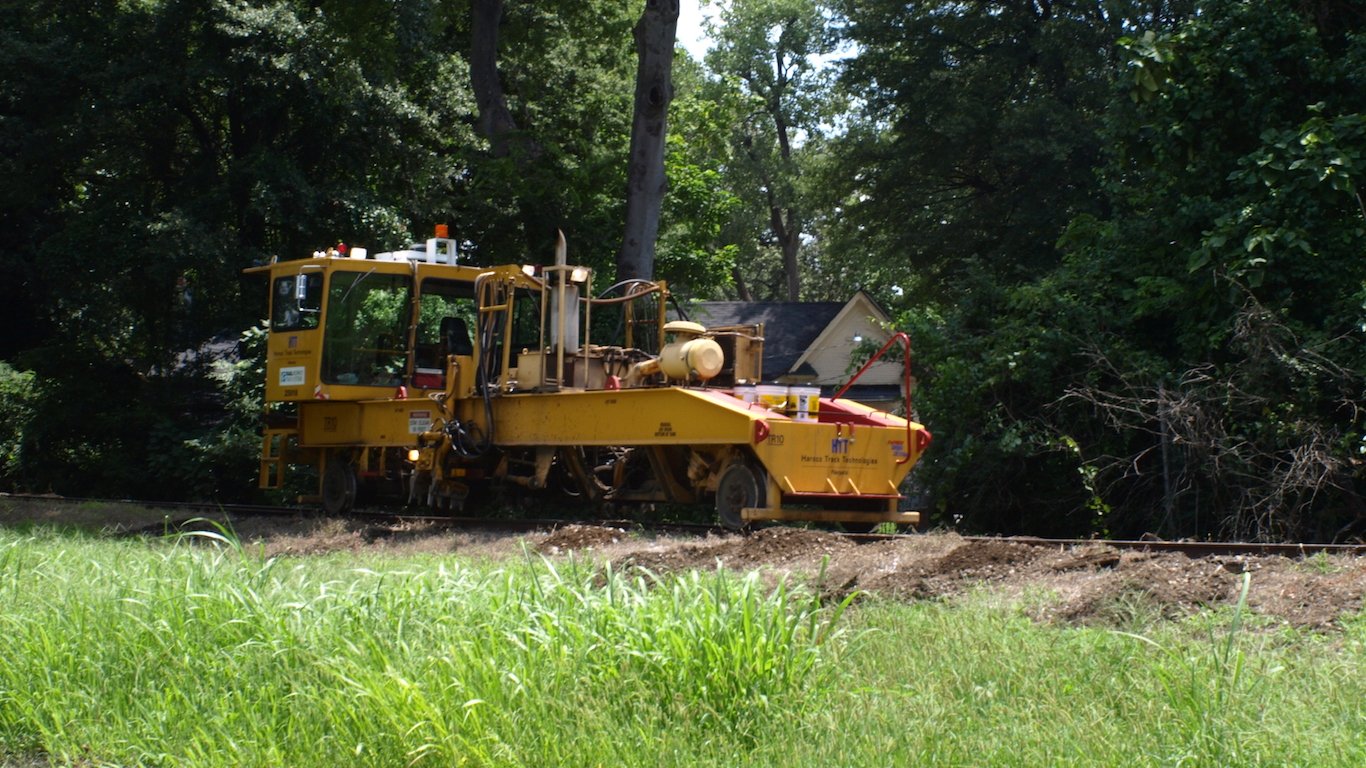
Source: SpecEd / Flickr
49. Early County, Georgia
> Avg. income loss per year of childhood residence: -$201
> Population: 10,296
> Household income per capita: $30,163
> Poverty rate: 31.2%
> Jan. 2018 unemployment rate: 5.5%
 24/7 Wall St.
Source: Courtesy of Duane Burdick via Flickr
48. Fairfield County, South Carolina
> Avg. income loss per year of childhood residence: -$202
> Population: 22,607
> Household income per capita: $28,030
> Poverty rate: 24.5%
> Jan. 2018 unemployment rate: 10.1%

Source: Andrew Filer / Flickr
47. Rolette County, North Dakota
> Avg. income loss per year of childhood residence: -$202
> Population: 14,531
> Household income per capita: $22,565
> Poverty rate: 31.6%
> Jan. 2018 unemployment rate: 10.7%
[in-text-ad-2]

Source: Thinkstock
46. Atlantic County, New Jersey
> Avg. income loss per year of childhood residence: -$203
> Population: 269,918
> Household income per capita: $38,869
> Poverty rate: 15.5%
> Jan. 2018 unemployment rate: 7.7%
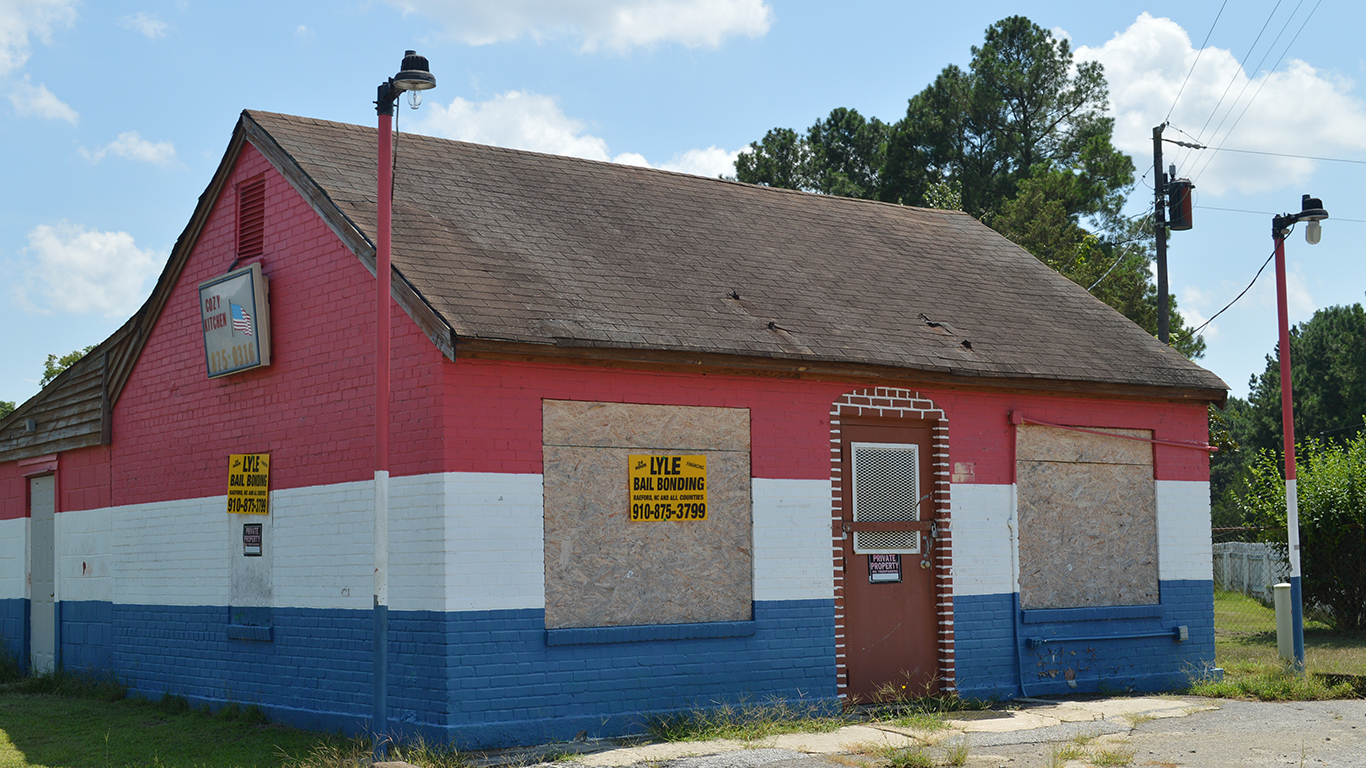
Source: Donald Lee Pardue / Flickr
45. Hoke County, North Carolina
> Avg. income loss per year of childhood residence: -$203
> Population: 54,116
> Household income per capita: $24,807
> Poverty rate: 22.9%
> Jan. 2018 unemployment rate: 5.8%
[in-text-ad]

Source: Thinkstock
44. East Baton Rouge Parish, Louisiana
> Avg. income loss per year of childhood residence: -$203
> Population: 446,268
> Household income per capita: $35,064
> Poverty rate: 19.5%
> Jan. 2018 unemployment rate: 3.8%

Source: GA-Kayaker / Flickr
43. Spalding County, Georgia
> Avg. income loss per year of childhood residence: -$203
> Population: 65,380
> Household income per capita: $31,155
> Poverty rate: 23.6%
> Jan. 2018 unemployment rate: 5.6%
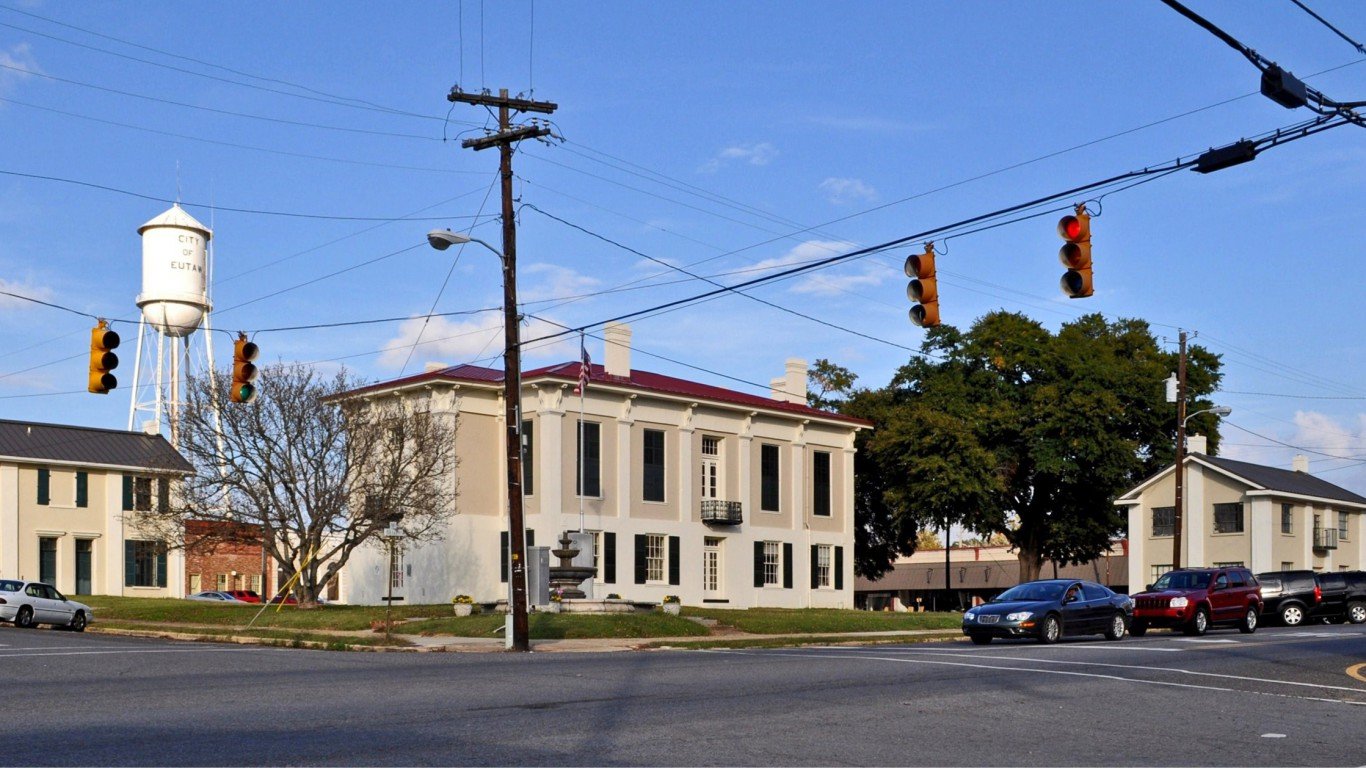
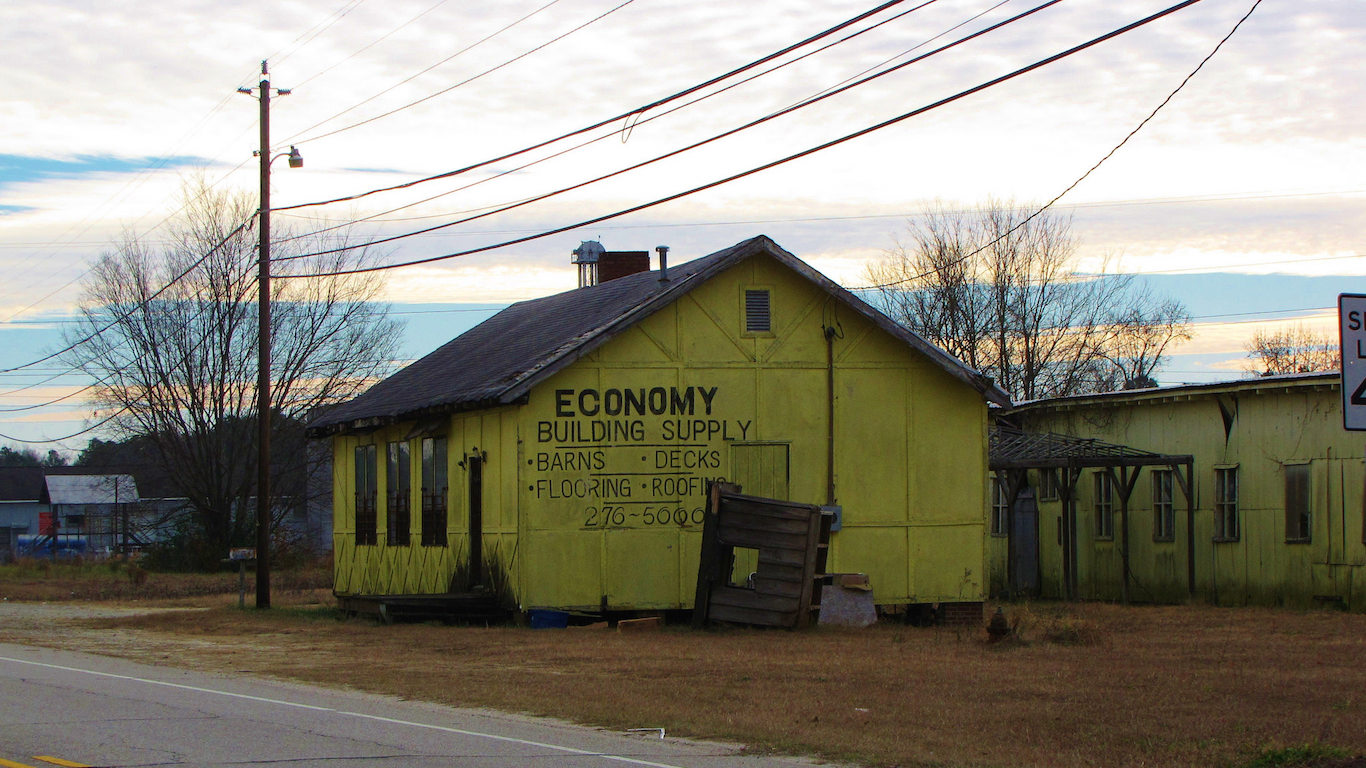
Source: RuralSWAlabama / Wikimedia Commons
42. Greene County, Alabama
> Avg. income loss per year of childhood residence: -$204
> Population: 8,330
> Household income per capita: $27,644
> Poverty rate: 37.9%
> Jan. 2018 unemployment rate: 7.0%
[in-text-ad-2]

Source: Stephen Matthew Milligan / Wikimedia Commons
41. Baldwin County, Georgia
> Avg. income loss per year of childhood residence: -$204
> Population: 44,906
> Household income per capita: $26,337
> Poverty rate: 29.7%
> Jan. 2018 unemployment rate: 6.1%

Source: Thinkstock
40. Guilford County, North Carolina
> Avg. income loss per year of childhood residence: -$205
> Population: 526,953
> Household income per capita: $41,339
> Poverty rate: 17.6%
> Jan. 2018 unemployment rate: 5.0%
[in-text-ad]
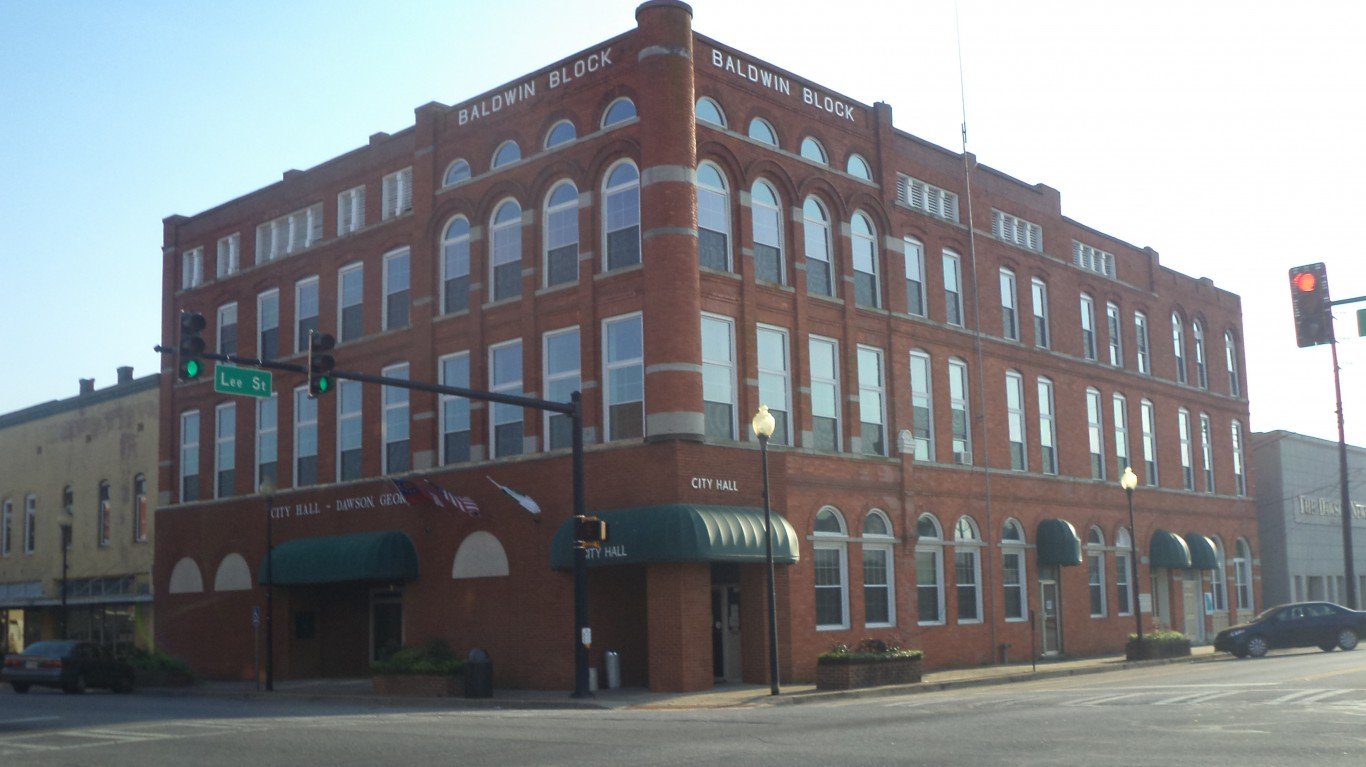
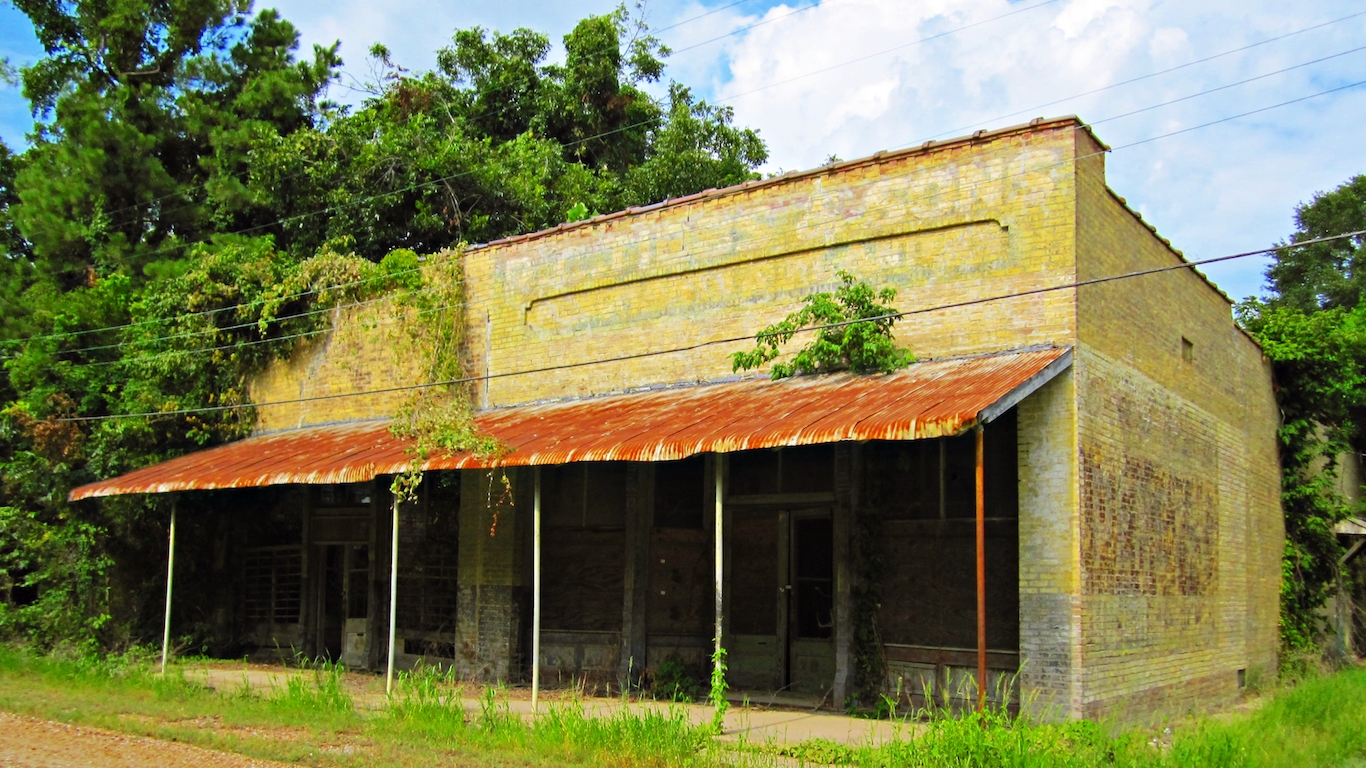
Source: Michael Rivera / Wikimedia Commons
39. Terrell County, Georgia
> Avg. income loss per year of childhood residence: -$205
> Population: 8,729
> Household income per capita: $26,851
> Poverty rate: 34.7%
> Jan. 2018 unemployment rate: 5.5%
 24/7 Wall St.
Source: Public Domain / Wikimedia Commons
38. Crittenden County, Arkansas
> Avg. income loss per year of childhood residence: -$206
> Population: 48,750
> Household income per capita: $27,744
> Poverty rate: 24.6%
> Jan. 2018 unemployment rate: 4.9%

Source: Michael Rivera / Wikimedia Commons
37. Gadsden County, Florida
> Avg. income loss per year of childhood residence: -$208
> Population: 46,071
> Household income per capita: $25,763
> Poverty rate: 25.6%
> Jan. 2018 unemployment rate: 5.3%
[in-text-ad-2]

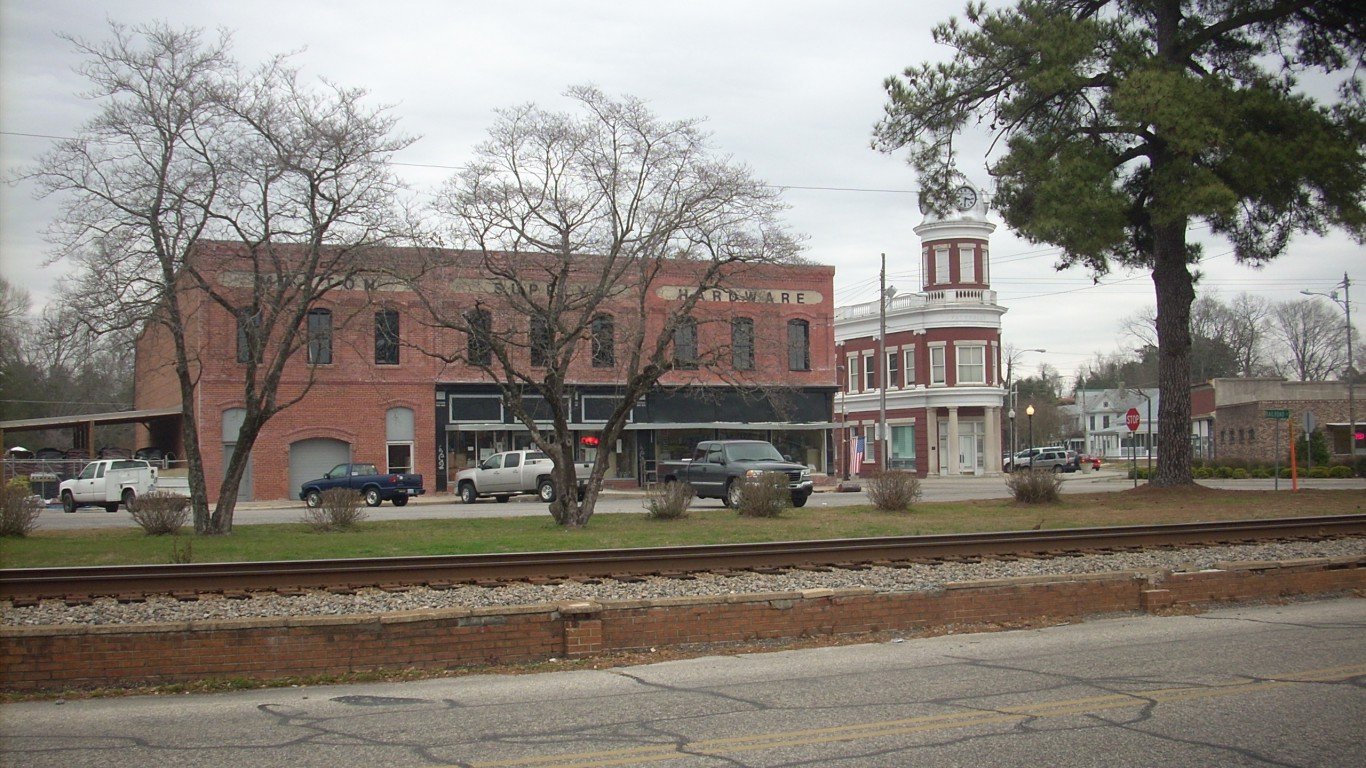
Source: Ken Lund / Flickr
36. Sumter County, Georgia
> Avg. income loss per year of childhood residence: -$208
> Population: 29,847
> Household income per capita: $28,432
> Poverty rate: 33.6%
> Jan. 2018 unemployment rate: 6.9%

Source: Billy Hathorn / Wikimedia Commons
35. East Carroll Parish, Louisiana
> Avg. income loss per year of childhood residence: -$210
> Population: 7,126
> Household income per capita: $18,062
> Poverty rate: 48.7%
> Jan. 2018 unemployment rate: 9.5%
[in-text-ad]
Source: Gerry Dincher / Wikimedia Commons
34. Robeson County, North Carolina
> Avg. income loss per year of childhood residence: -$212
> Population: 132,606
> Household income per capita: $24,221
> Poverty rate: 30.8%
> Jan. 2018 unemployment rate: 6.9%

Source: csmith/dbb1 / Wikimedia Commons
33. Hancock County, Georgia
> Avg. income loss per year of childhood residence: -$214
> Population: 8,561
> Household income per capita: $17,928
> Poverty rate: 31.4%
> Jan. 2018 unemployment rate: 7.5%

Source: Thomas R Machnitzki ([email protected]) / Wikimedia Commons
32. Quitman County, Mississippi
> Avg. income loss per year of childhood residence: -$214
> Population: 7,269
> Household income per capita: $22,166
> Poverty rate: 37.8%
> Jan. 2018 unemployment rate: 8.6%
[in-text-ad-2]
Source: Matthew Nichols / Flickr
31. Grenada County, Mississippi
> Avg. income loss per year of childhood residence: -$215
> Population: 21,087
> Household income per capita: $26,818
> Poverty rate: 24.1%
> Jan. 2018 unemployment rate: 4.0%

Source: JByard / iStock
30. St Louis city, Missouri (County)
> Avg. income loss per year of childhood residence: -$216
> Population: 308,626
> Household income per capita: $30,072
> Poverty rate: 26.7%
> Jan. 2018 unemployment rate: 4.4%
[in-text-ad]

Source: Kennethaw88 / Wikimedia Commons
29. Genesee County, Michigan
> Avg. income loss per year of childhood residence: -$217
> Population: 407,385
> Household income per capita: $38,963
> Poverty rate: 20.9%
> Jan. 2018 unemployment rate: 6.6%
Source: tinkerbrad / iStock
28. Washington County, Mississippi
> Avg. income loss per year of childhood residence: -$218
> Population: 46,221
> Household income per capita: $26,530
> Poverty rate: 34.9%
> Jan. 2018 unemployment rate: 7.3%
Source: Gerry Dincher / Flickr
27. Scotland County, North Carolina
> Avg. income loss per year of childhood residence: -$219
> Population: 35,093
> Household income per capita: $29,071
> Poverty rate: 31.5%
> Jan. 2018 unemployment rate: 8.7%
[in-text-ad-2]

Source: Traicovn / Wikimedia Commons
26. Oktibbeha County, Mississippi
> Avg. income loss per year of childhood residence: -$219
> Population: 49,799
> Household income per capita: $24,040
> Poverty rate: 32.6%
> Jan. 2018 unemployment rate: 4.5%
Source: Matthew Nichols / Flickr
25. Bolivar County, Mississippi
> Avg. income loss per year of childhood residence: -$223
> Population: 31,945
> Household income per capita: $22,311
> Poverty rate: 37.8%
> Jan. 2018 unemployment rate: 6.0%
[in-text-ad]

Source: Mike Norton / Flickr
24. Sunflower County, Mississippi
> Avg. income loss per year of childhood residence: -$228
> Population: 25,981
> Household income per capita: $18,895
> Poverty rate: 34.6%
> Jan. 2018 unemployment rate: 9.0%

Source: Upstateherd / Wikimedia Commons
23. Allendale County, South Carolina
> Avg. income loss per year of childhood residence: -$229
> Population: 9,002
> Household income per capita: $21,262
> Poverty rate: 29.7%
> Jan. 2018 unemployment rate: 8.3%
Source: Thomas R Machnitzki ([email protected]) / Wikimedia Commons
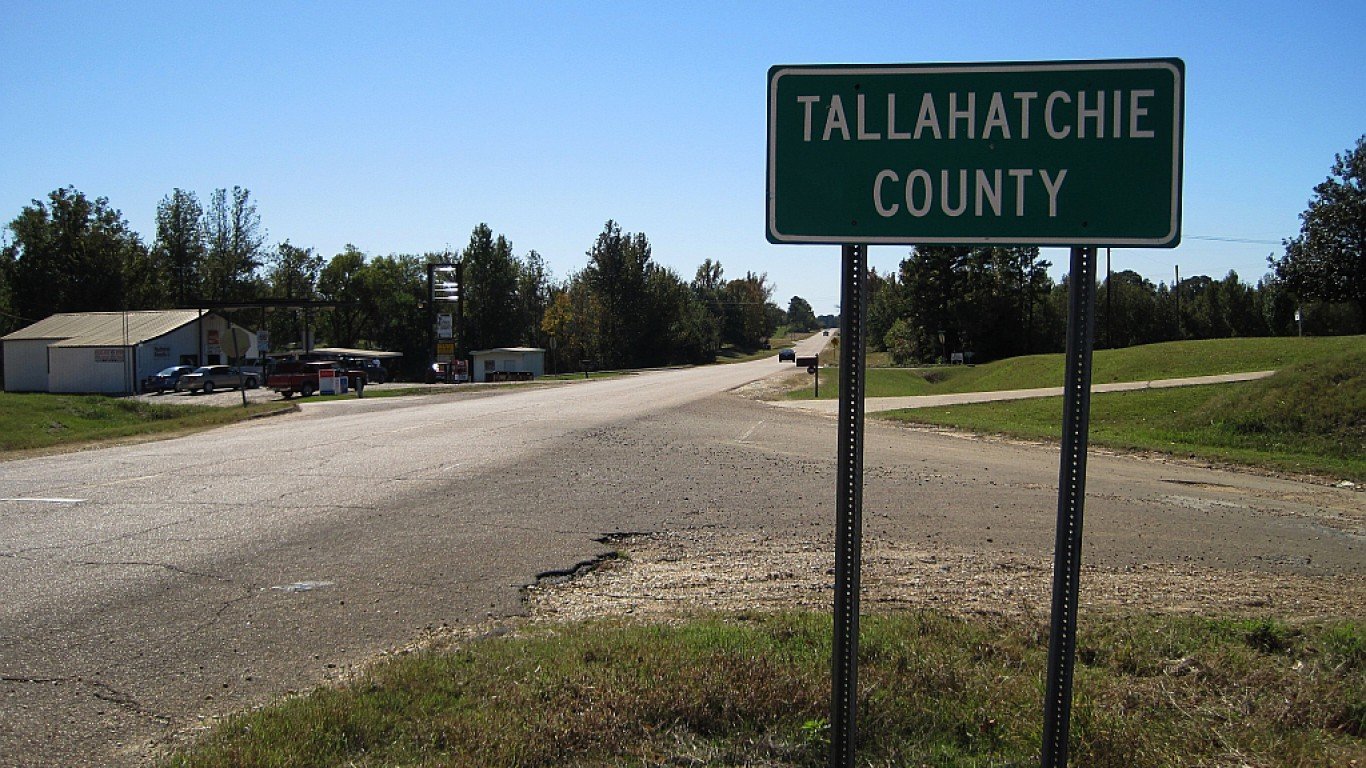
22. Tallahatchie County, Mississippi
> Avg. income loss per year of childhood residence: -$230
> Population: 14,125
> Household income per capita: $21,421
> Poverty rate: 28.2%
> Jan. 2018 unemployment rate: 6.0%
[in-text-ad-2]

Source: Joseph / Flickr
21. Nome County, Alaska
> Avg. income loss per year of childhood residence: -$230
> Population: 9,921
> Household income per capita: $29,589
> Poverty rate: 27.0%
> Jan. 2018 unemployment rate: 13.1%
Source: Andrew Filer / Flickr
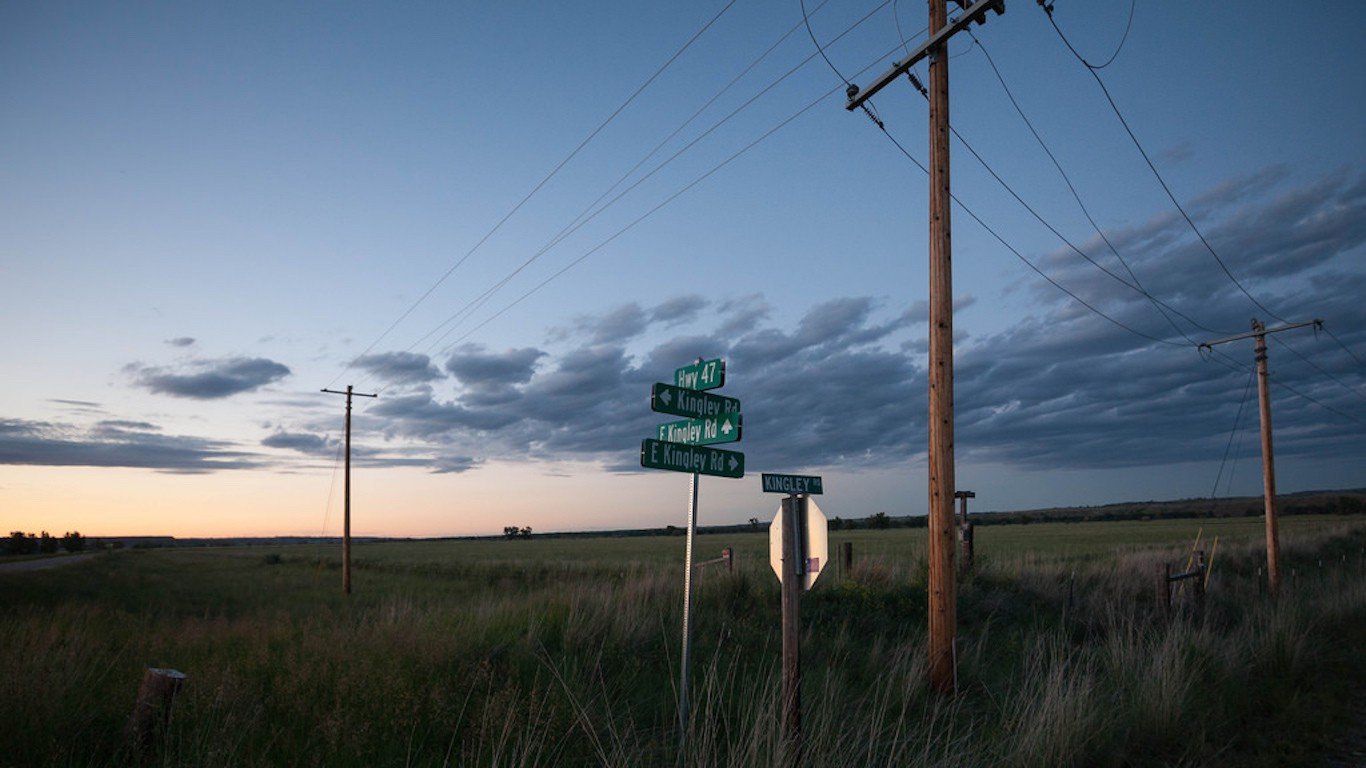
20. Big Horn County, Montana
> Avg. income loss per year of childhood residence: -$230
> Population: 13,360
> Household income per capita: $20,646
> Poverty rate: 27.8%
> Jan. 2018 unemployment rate: 11.8%
[in-text-ad]

Source: Thinkstock
19. Roanoke city, Virginia (County)
> Avg. income loss per year of childhood residence: -$233
> Population: 99,837
> Household income per capita: $34,745
> Poverty rate: 22.2%
> Jan. 2018 unemployment rate: 4.1%
 24/7 Wall St.
Source: JERRYE AND ROY KLOTZ MD / Wikimedia Commons
18. Dewey County, South Dakota
> Avg. income loss per year of childhood residence: -$235
> Population: 5,835
> Household income per capita: $19,529
> Poverty rate: 27.6%
> Jan. 2018 unemployment rate: 8.9%

Source: NatalieMaynor / Flickr
17. Hinds County, Mississippi
> Avg. income loss per year of childhood residence: -$235
> Population: 239,497
> Household income per capita: $32,627
> Poverty rate: 25.5%
> Jan. 2018 unemployment rate: 4.2%
[in-text-ad-2]
Source: Joseph / Flickr
16. Leflore County, Mississippi
> Avg. income loss per year of childhood residence: -$236
> Population: 29,223
> Household income per capita: $23,465
> Poverty rate: 40.4%
> Jan. 2018 unemployment rate: 7.5%

Source: pabradyphoto / iStock
15. Richmond city, Virginia (County)
> Avg. income loss per year of childhood residence: -$240
> Population: 227,032
> Household income per capita: $35,536
> Poverty rate: 25.4%
> Jan. 2018 unemployment rate: 4.3%
[in-text-ad]

Source: Thinkstock
14. Clarke County, Georgia
> Avg. income loss per year of childhood residence: -$242
> Population: 127,064
> Household income per capita: $26,220
> Poverty rate: 35.2%
> Jan. 2018 unemployment rate: 4.3%

Source: Thinkstock
13. Claiborne County, Mississippi
> Avg. income loss per year of childhood residence: -$242
> Population: 8,950
> Household income per capita: $19,485
> Poverty rate: 41.2%
> Jan. 2018 unemployment rate: 8.7%

Source: Public Domain / Wikimedia Commons
12. Kusilvak County, Alaska
> Avg. income loss per year of childhood residence: -$245
> Population: 8,202
> Household income per capita: $19,557
> Poverty rate: 36.0%
> Jan. 2018 unemployment rate: 0.0%
[in-text-ad-2]
Source: BriYYZ / Flickr
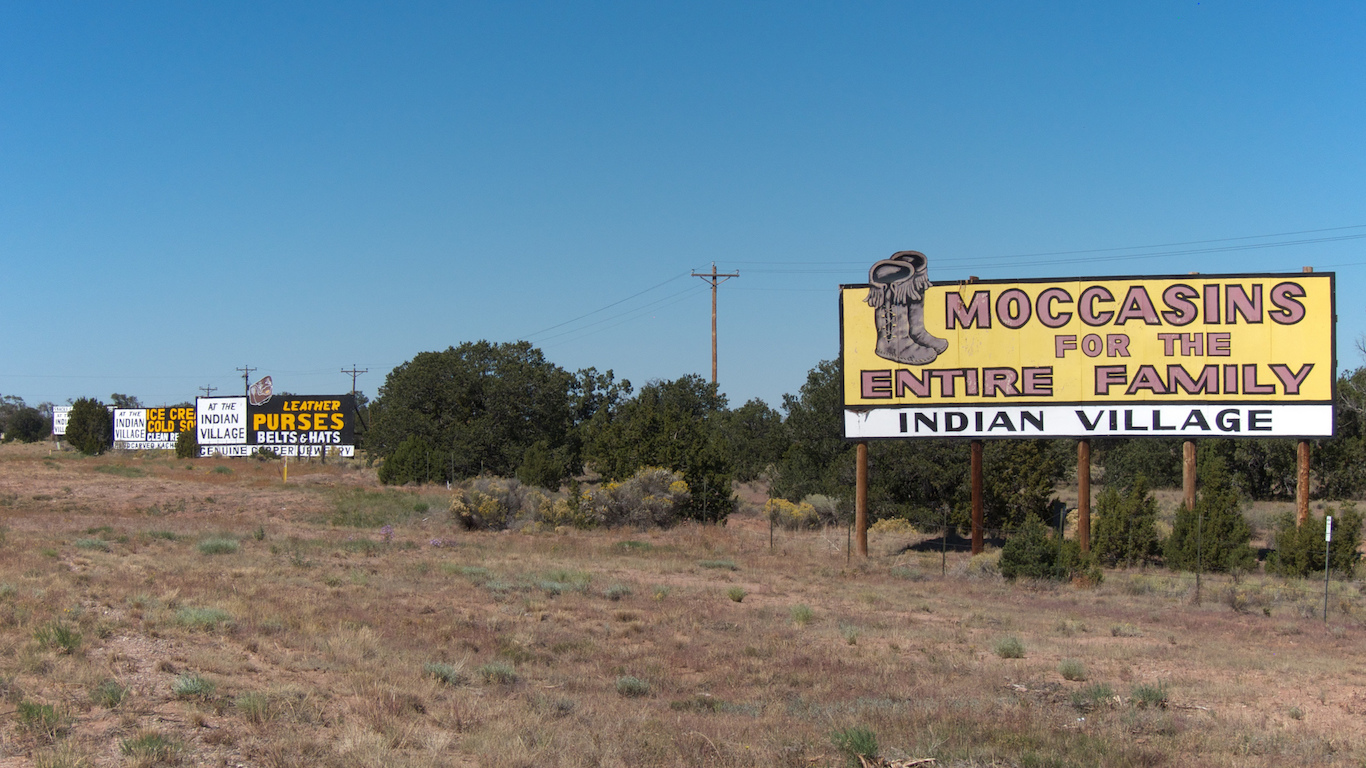
11. McKinley County, New Mexico
> Avg. income loss per year of childhood residence: -$248
> Population: 72,564
> Household income per capita: $19,744
> Poverty rate: 38.1%
> Jan. 2018 unemployment rate: 8.2%

Source: Jerrye
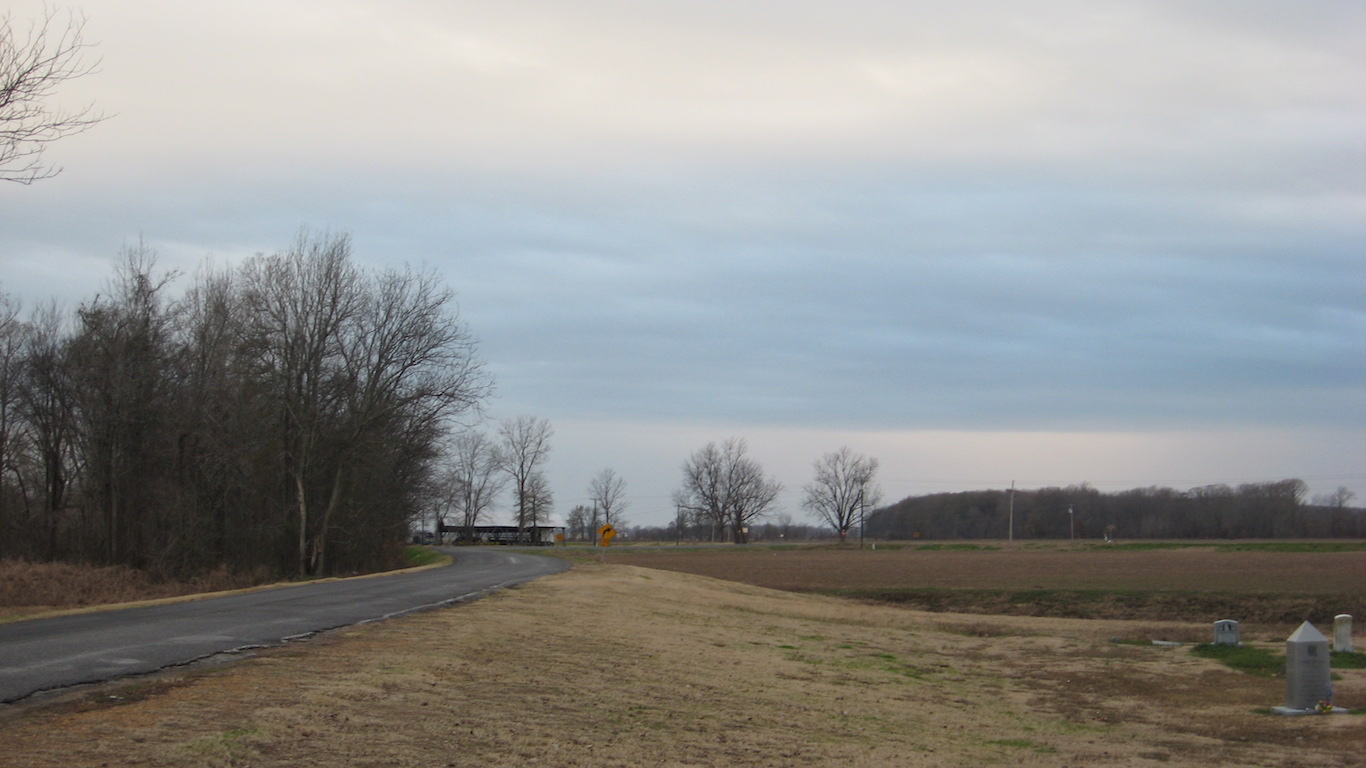
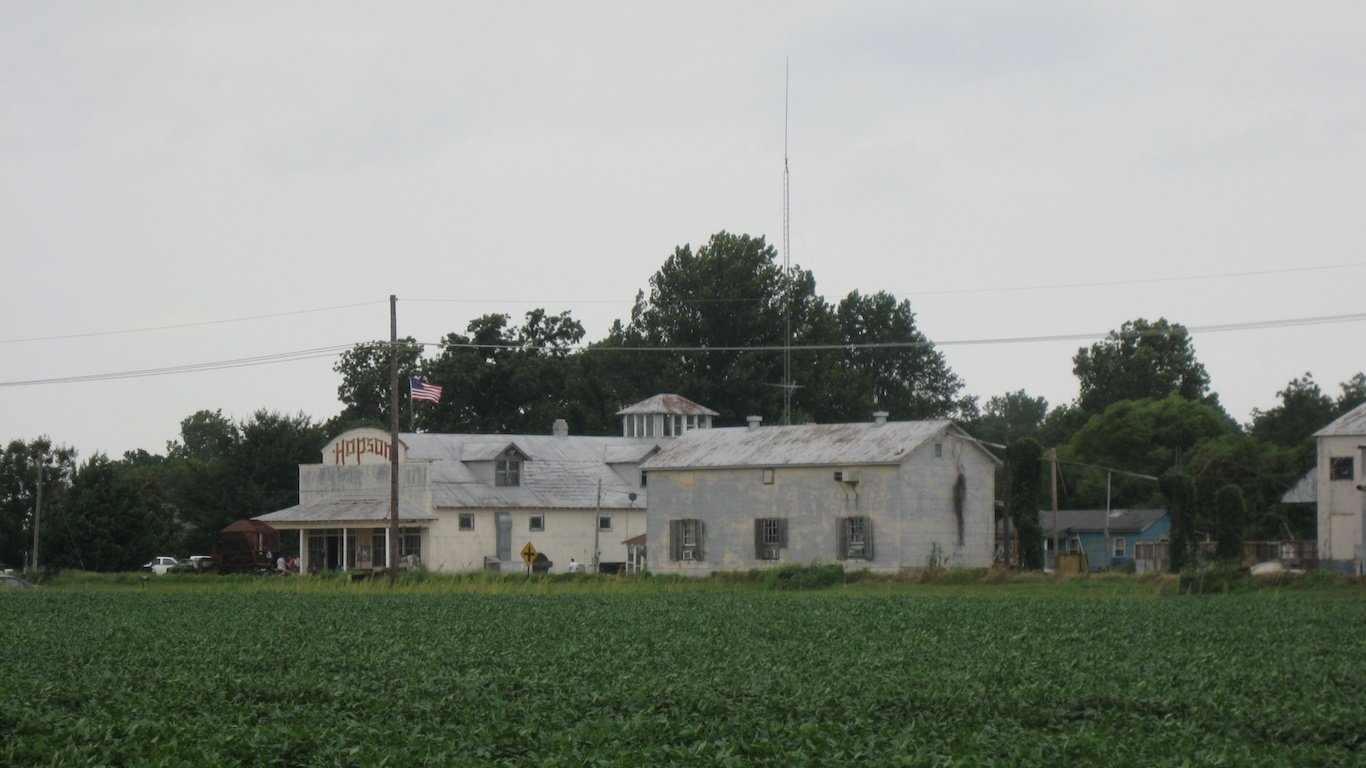
10. Tunica County, Mississippi
> Avg. income loss per year of childhood residence: -$249
> Population: 10,024
> Household income per capita: $22,618
> Poverty rate: 28.4%
> Jan. 2018 unemployment rate: 6.2%
[in-text-ad]

Source: Jerrye
9. Humphreys County, Mississippi
> Avg. income loss per year of childhood residence: -$254
> Population: 8,342
> Household income per capita: $21,846
> Poverty rate: 42.5%
> Jan. 2018 unemployment rate: 9.7%
 24/7 Wall St.
Source: Thinkstock
8. Glacier County, Montana
> Avg. income loss per year of childhood residence: -$263
> Population: 13,640
> Household income per capita: $23,252
> Poverty rate: 33.3%
> Jan. 2018 unemployment rate: 9.8%
Source: Nathan Cardozo / Flickr
7. Coahoma County, Mississippi
> Avg. income loss per year of childhood residence: -$273
> Population: 23,154
> Household income per capita: $25,675
> Poverty rate: 35.2%
> Jan. 2018 unemployment rate: 7.4%
[in-text-ad-2]

Source: Thinkstock
6. Orleans Parish, Louisiana
> Avg. income loss per year of childhood residence: -$276
> Population: 393,292
> Household income per capita: $31,246
> Poverty rate: 26.2%
> Jan. 2018 unemployment rate: 4.4%

Source: Thinkstock
5. Forsyth County, North Carolina
> Avg. income loss per year of childhood residence: -$286
> Population: 376,320
> Household income per capita: $41,647
> Poverty rate: 19.5%
> Jan. 2018 unemployment rate: 4.5%
[in-text-ad]
Source: Royalbroil / Wikimedia Commons
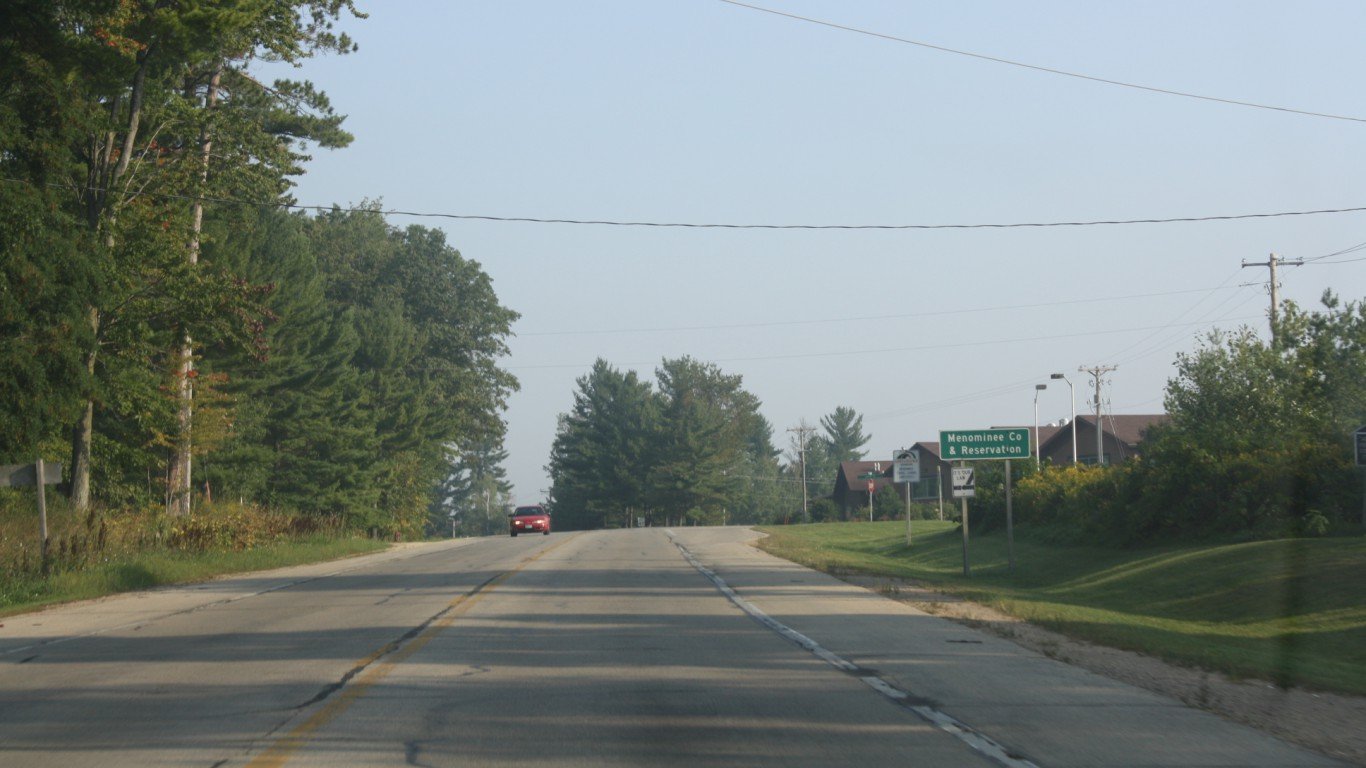
4. Menominee County, Wisconsin
> Avg. income loss per year of childhood residence: -$313
> Population: 4,615
> Household income per capita: $21,942
> Poverty rate: 33.1%
> Jan. 2018 unemployment rate: 4.5%
 24/7 Wall St.
Source: Andrew Filer / Wikimedia Commons
3. Sioux County, North Dakota
> Avg. income loss per year of childhood residence: -$318
> Population: 4,376
> Household income per capita: $16,103
> Poverty rate: 38.0%
> Jan. 2018 unemployment rate: 3.5%
Source: Courtesy of Túlio Assis via Flickr
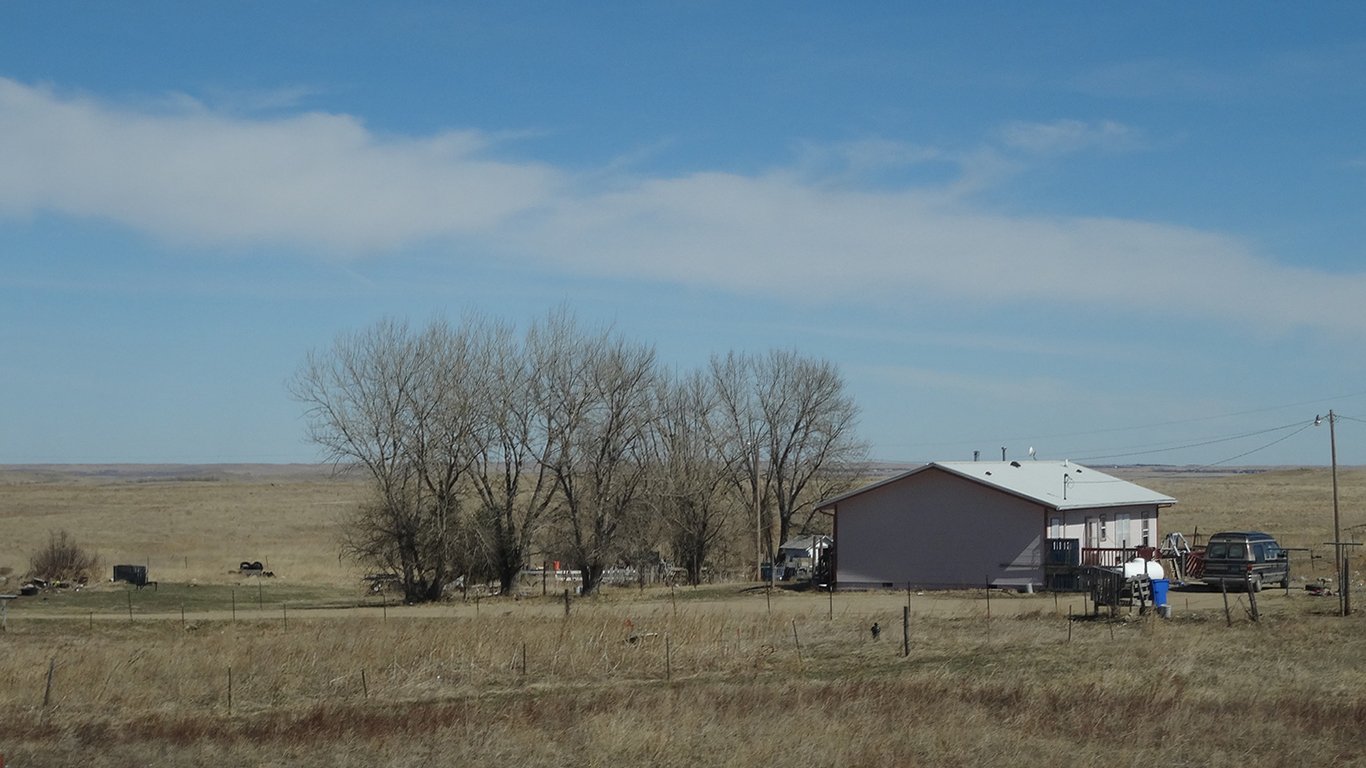
2. Todd County, South Dakota
> Avg. income loss per year of childhood residence: -$441
> Population: 10,065
> Household income per capita: $16,641
> Poverty rate: 47.1%
> Jan. 2018 unemployment rate: 6.8%
[in-text-ad-2]
Source: Thinkstock
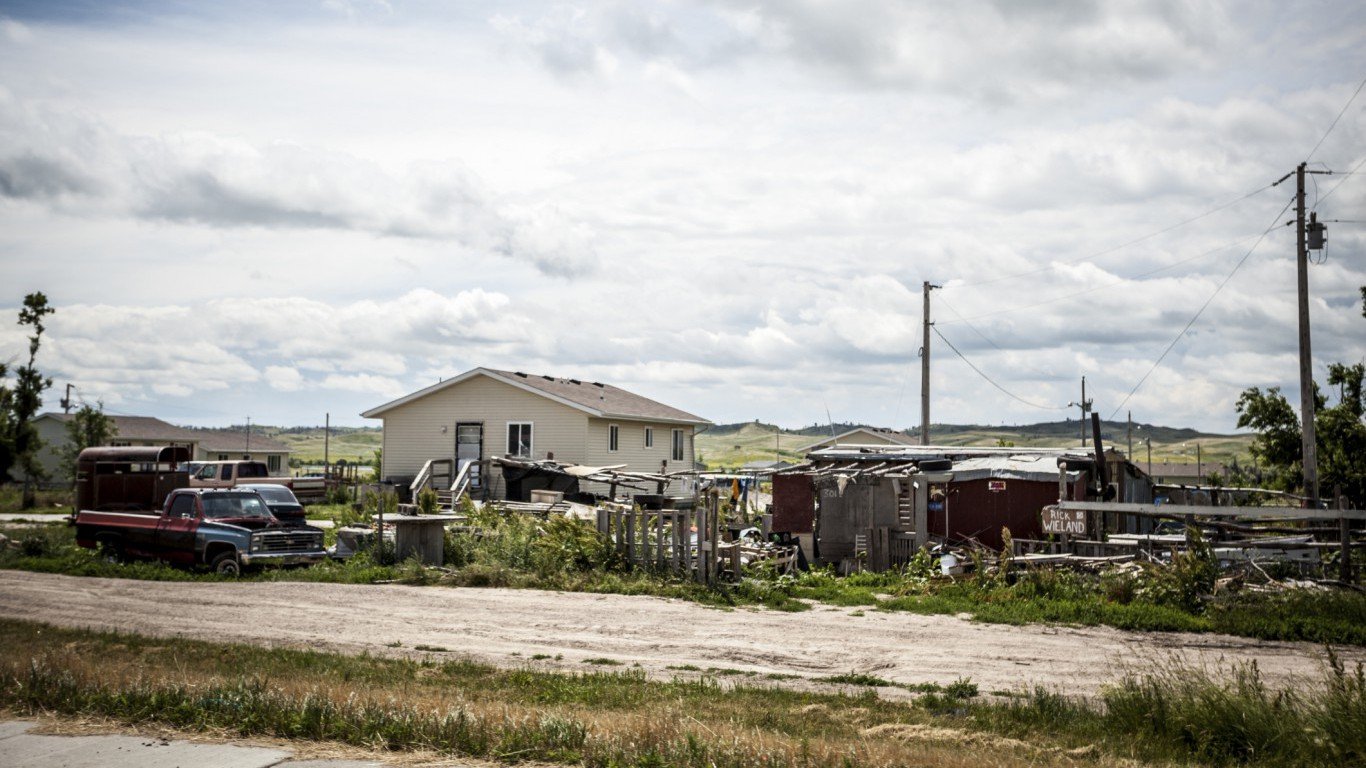
1. Oglala Lakota County, South Dakota
> Avg. income loss per year of childhood residence: -$484
> Population: 14,354
> Household income per capita: $13,647
> Poverty rate: 53.9%
> Jan. 2018 unemployment rate: N/A
Detailed Findings
Children living in Shannon County, South Dakota, have the worst odds of earning a decent wage in adulthood. The annual income that children in low-income families are likely to make as adults declines by 1.9% each year they spend in Shannon. At this rate, close to $500 is lost annually from the modest income a child might have earned had he or she grown up in a different neighborhood.
The areas that produce the worst upward mobility challenges for low-income children have several economic characteristics in common. For example, poverty rates in all but a handful of these counties exceed the national poverty rate of 15.5%. In 26, the poverty rate exceeds 30%.
Thirteen of the 50 counties on this list are home to or overlap with American Indian reservations. This includes the bottom four counties, where the vast majority of residents identify as Native Americans. Native Americans are one of the nation’s most economically disadvantaged populations. Unique business regulations, poor services and poor access to amenities, as well as housing challenges are among the limitations contributing to the exceptionally poor economic mobility in these areas.
In 2014, 28.3% of single-race Native Americans. and Alaskan Natives lived in poverty, almost double the national average poverty rate and the highest of any ethnic group.
Unsurprisingly, the counties where children have the best chance for success have below average poverty rates nearly without exception. Previous research has shown that upward mobility is also strongly correlated with low segregation, low inequality, high school quality, and solid family structure.
There is also a gender component to the relationship between home town and economic mobility. Boys’ mobility vary more across areas than girls’mobility, and boys have especially negative outcomes in highly segregated areas.
Methodology
To identify the counties where the American dream is dead, 24/7 Wall St. reviewed the effect on household income earned in adulthood for every year of childhood spent in 2,973 U.S. counties and county equivalents from data published by The Equality of Opportunity Project. Researchers at the organization used data from 1996-2012 tax returns to study the long-term economic outcomes of approximately 50 million children.
This annual effect on adult earnings is called the exposure effect and is measured as the percent gained or lost from the average annual household income for a 26 year old in the bottom quartile of U.S. earners — $26,090. To find the average income lost per county per year, we multiplied the exposure effect by this income threshold.
The Equality of Opportunity Project publishes economic mobility-related research and data files for public use. It receives funding from Stanford University, Harvard University, the National Science Foundation, and several charitable groups, including the Robert Wood Johnson Foundation.
The poverty rate for each county came from the U.S. Census Bureau’s 2016 American Community Survey and are 5-year averages. January 2018 unemployment figures are seasonally adjusted rates from the U.S. Bureau of Labor Statistics.
Take This Retirement Quiz To Get Matched With An Advisor Now (Sponsored)
Are you ready for retirement? Planning for retirement can be overwhelming, that’s why it could be a good idea to speak to a fiduciary financial advisor about your goals today.
Start by taking this retirement quiz right here from SmartAsset that will match you with up to 3 financial advisors that serve your area and beyond in 5 minutes. Smart Asset is now matching over 50,000 people a month.
Click here now to get started.
Thank you for reading! Have some feedback for us?
Contact the 24/7 Wall St. editorial team.
Editors' Picks

