
While federal taxes get the most attention, the average American spends well over $2,000 per year on state and local taxes. In return, their state and municipal governments provide a range of services year round.
State and local governments build parks and libraries, and maintain law and order. They operate municipal waste systems and educate children. States also provide for the welfare of residents through a variety of support systems. Larger urban areas provide public transportation systems.
The amount spent by state and local government on citizens varies significantly. Total state and local government spending is over $20,000 per resident in one state, and less than $8,000 in many others. Using data provided by the U.S. Census Bureau’s State and Local Government Snapshot, 24/7 Wall St. ranked all 50 states on expenditure per capita.
Spending by each state government is based in part on what is politically mandated. For example, health and welfare spending is unsurprisingly the highest in states that are traditionally “blue” states. California and New York rank first and third, respectively. Utah and South Dakota, two of the most right-leaning states, spend the least per capita on health and welfare.
24/7 Wall St. reviewed per capita state and local government expenditure figures from the U.S. Census Bureau’s 2015 State and Local Government Expenditures data, which includes data from its Surveys of State & Local Government Finances, Public Employment & Payroll, and the Annual Estimates of the Resident Population for the United States Regions, States, and Puerto Rico. State poverty rates came are for 2016 and are from the U.S. Census Bureau’s American Community Survey. State and local tax collections are from the Tax Foundation’s Facts and Figures report. The report, which was released for 2018, includes collections for the 2015 fiscal year.
Click here to see what your state spends on you.
Source: BJ Ray / Shutterstock.com
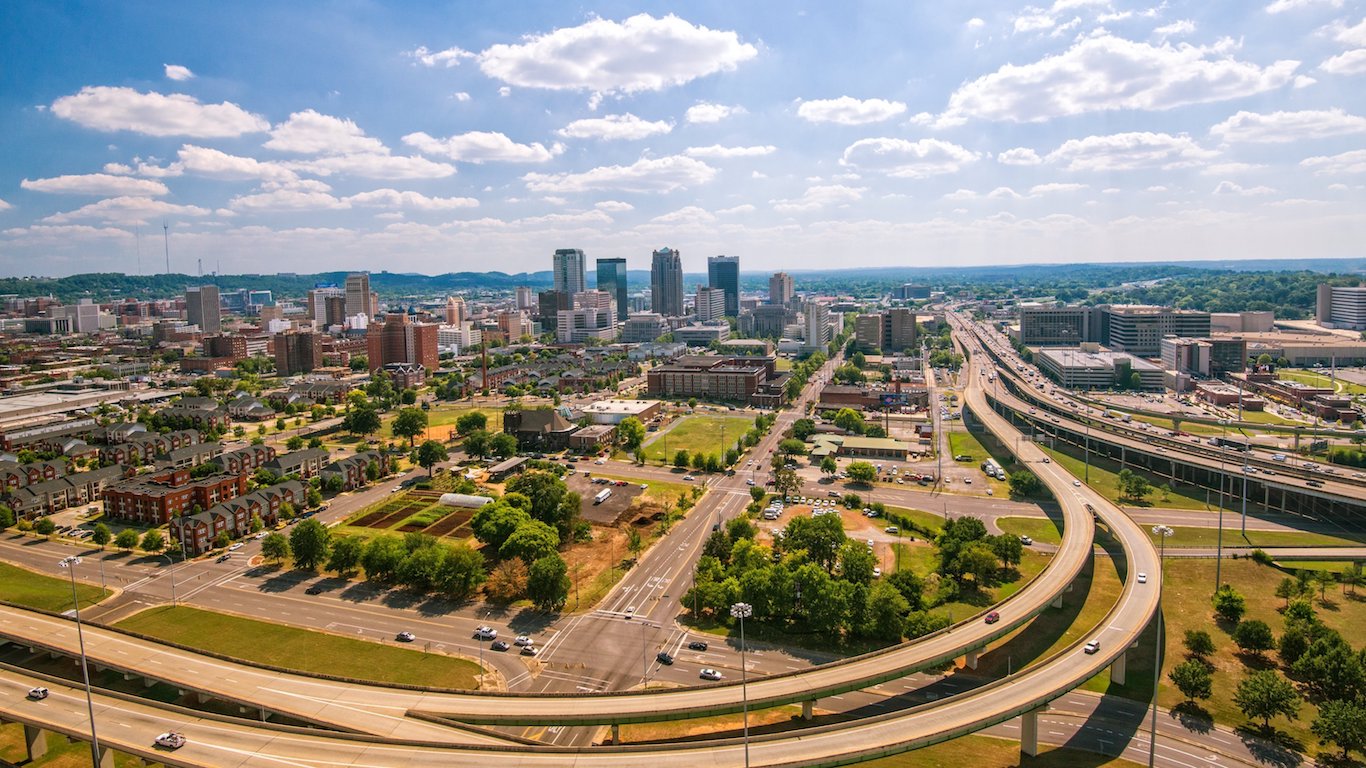
1. Alabama
> State & local government spending per capita: $8,327 (16th lowest)
> State & local tax collections per capita: $3,141 (the lowest)
> Largest spending category: Health and welfare (33.2% of spending)
> Share of workers in public sector jobs: 19.1% (10th highest)
> Poverty rate: 17.1% (7th highest)
[in-text-ad]
Source: Thinkstock
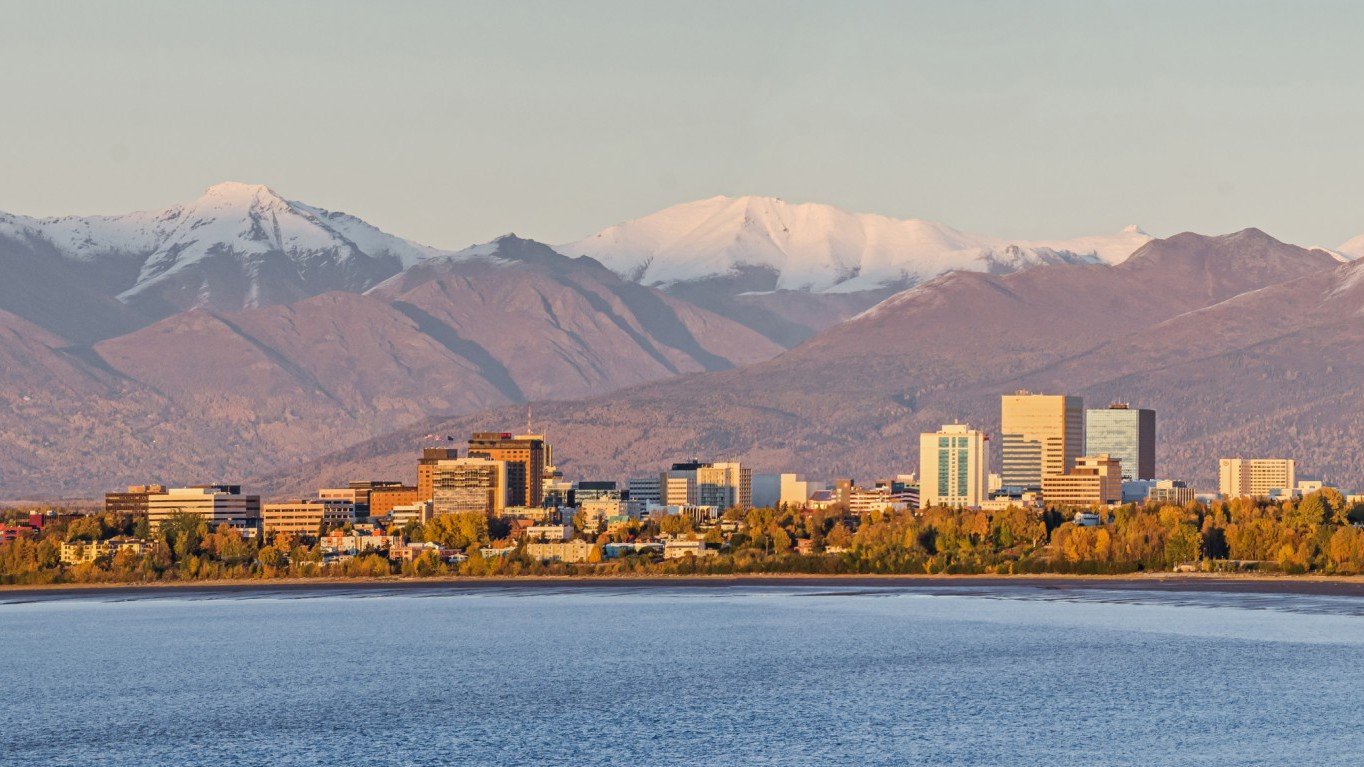
2. Alaska
> State & local government spending per capita: $20,668 (the highest)
> State & local tax collections per capita: $3,501 (7th lowest)
> Largest spending category: Education (24.2% of spending)
> Share of workers in public sector jobs: 24.6% (2nd highest)
> Poverty rate: 9.9% (6th lowest)
 24/7 Wall St.
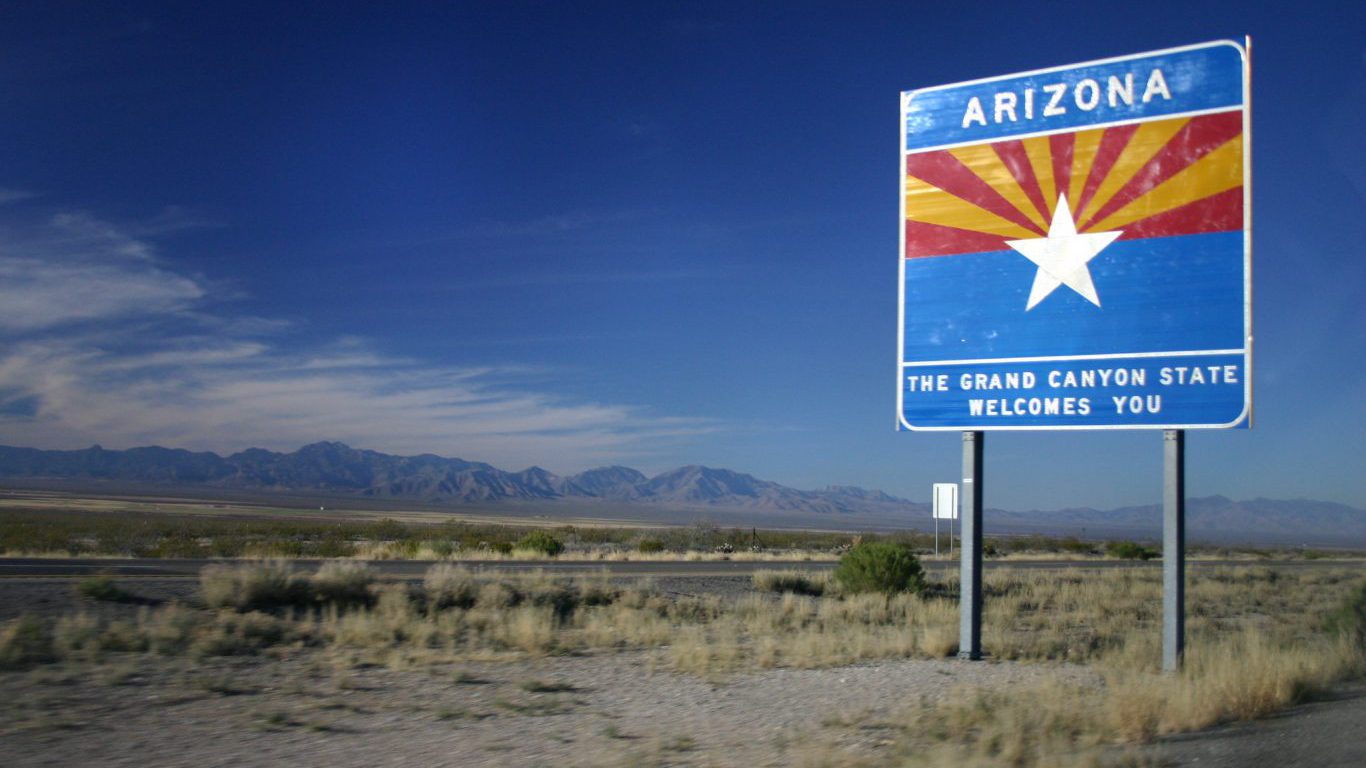
Source: Wing-Chi Poon
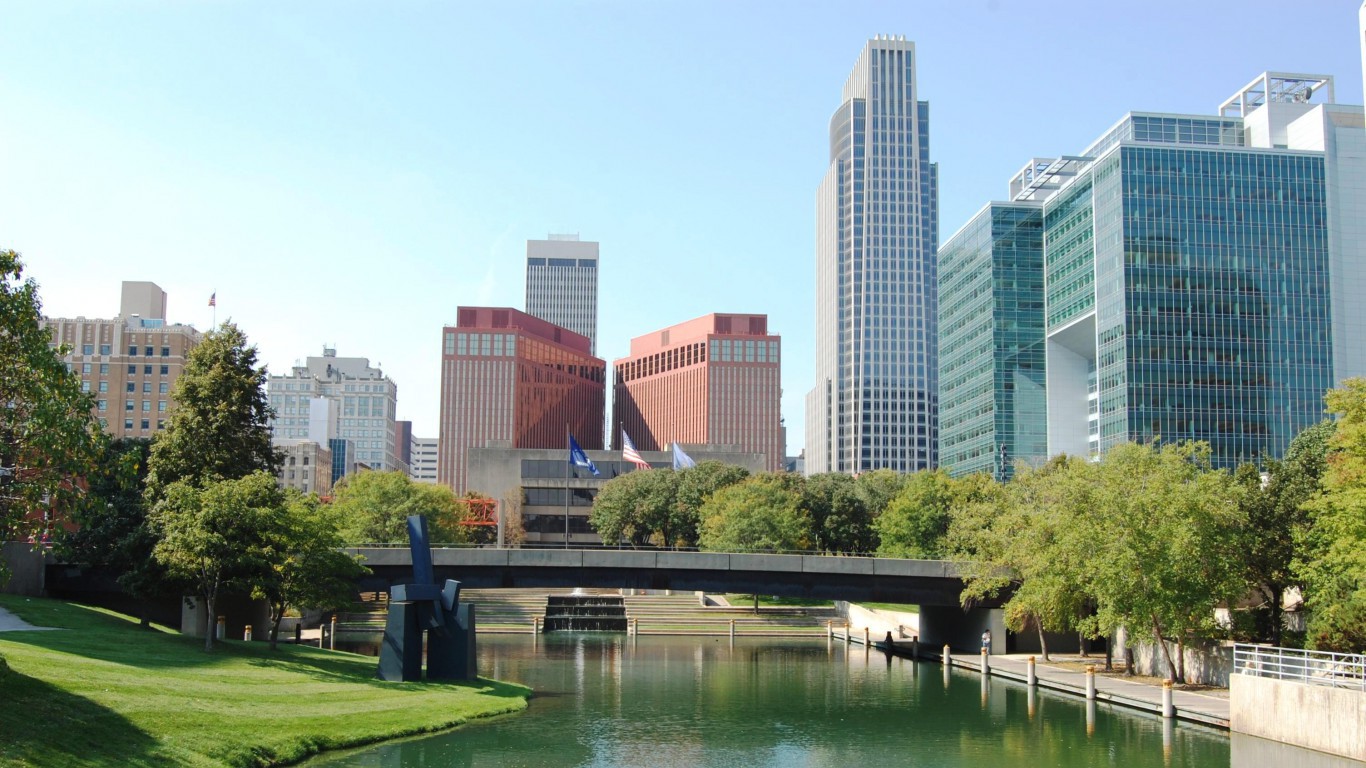
3. Arizona
> State & local government spending per capita: $7,353 (3rd lowest)
> State & local tax collections per capita: $3,480 (6th lowest)
> Largest spending category: Education (30.5% of spending)
> Share of workers in public sector jobs: 14.9% (17th lowest)
> Poverty rate: 16.4% (8th highest)

Source: Thinkstock
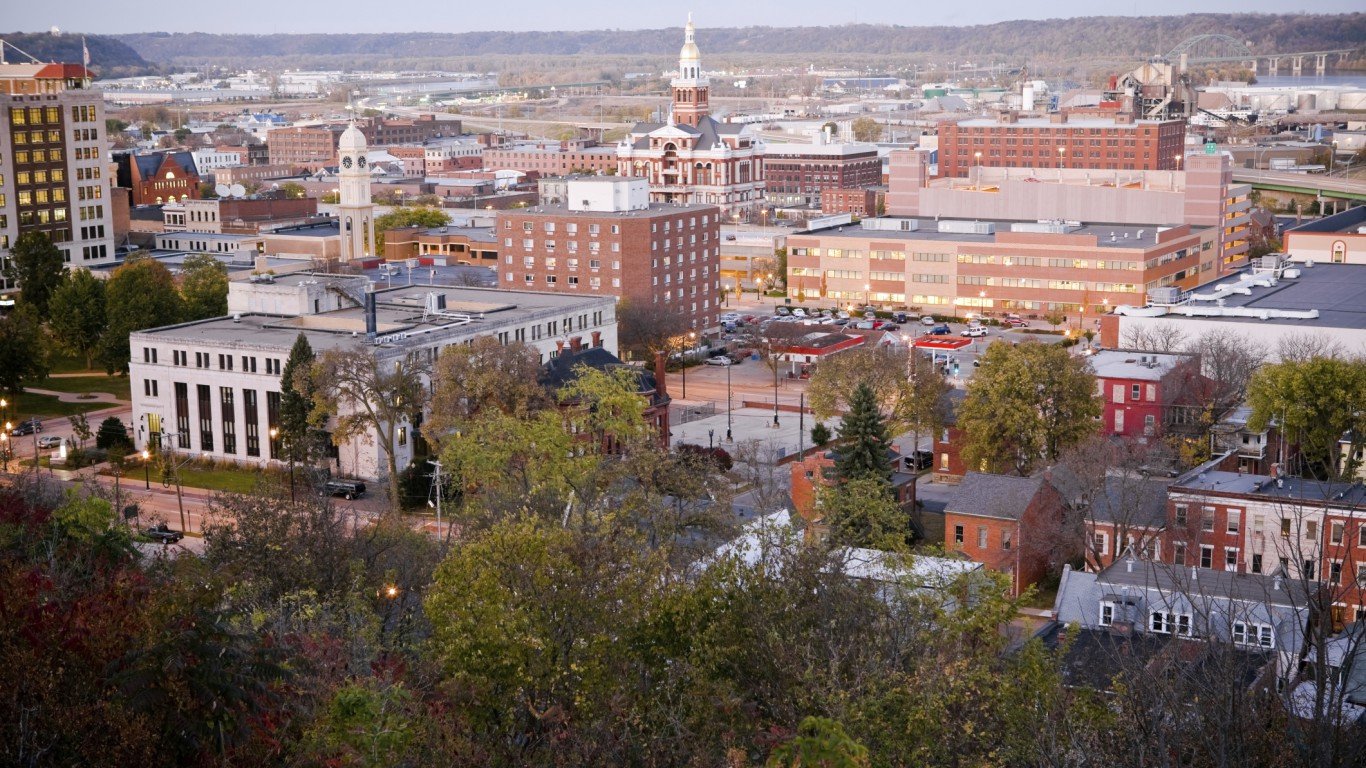
4. Arkansas
> State & local government spending per capita: $8,149 (14th lowest)
> State & local tax collections per capita: $3,868 (17th lowest)
> Largest spending category: Health and welfare (34.7% of spending)
> Share of workers in public sector jobs: 17.1% (19th highest)
> Poverty rate: 17.2% (6th highest)
[in-text-ad-2]
Source: Thinkstock
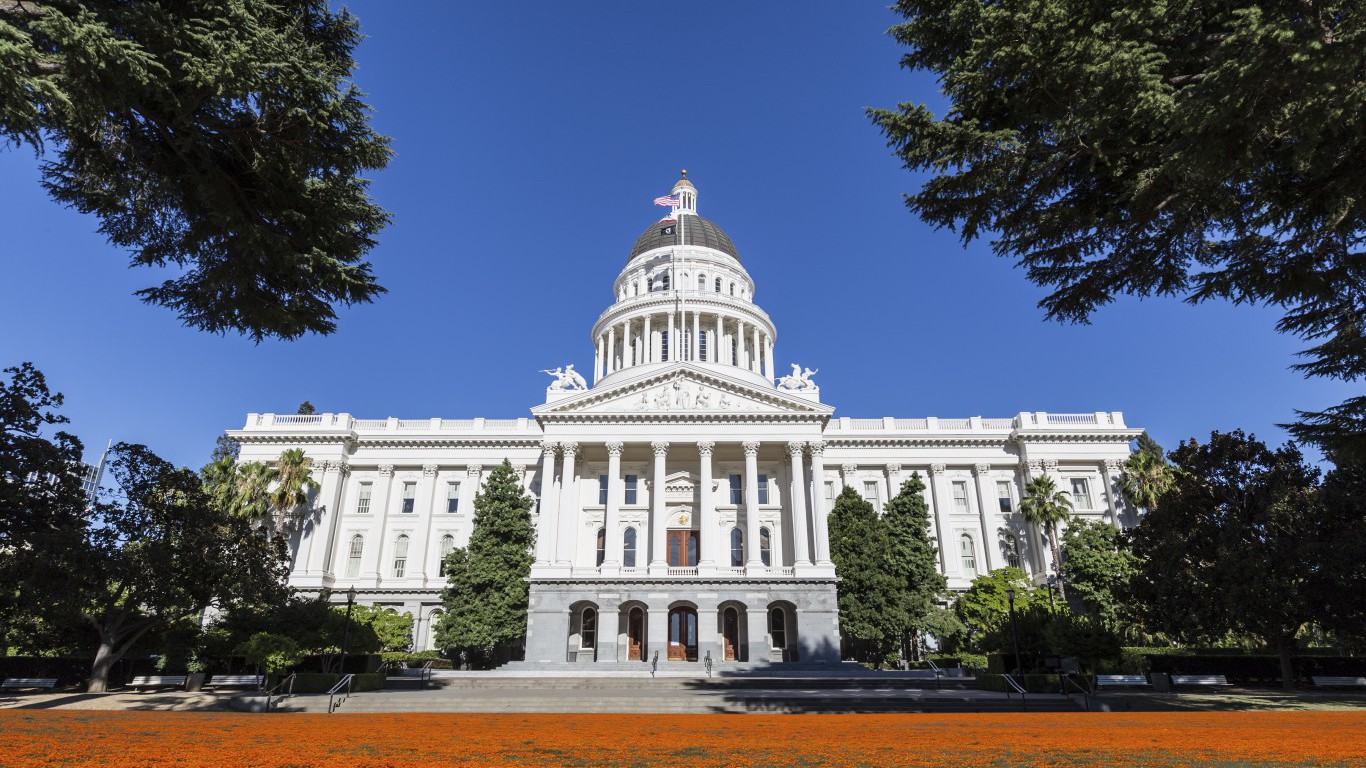
5. California
> State & local government spending per capita: $11,528 (6th highest)
> State & local tax collections per capita: $5,842 (10th highest)
> Largest spending category: Health and welfare (34.3% of spending)
> Share of workers in public sector jobs: 15.2% (19th lowest)
> Poverty rate: 14.3% (20th highest)
Source: Thinkstock
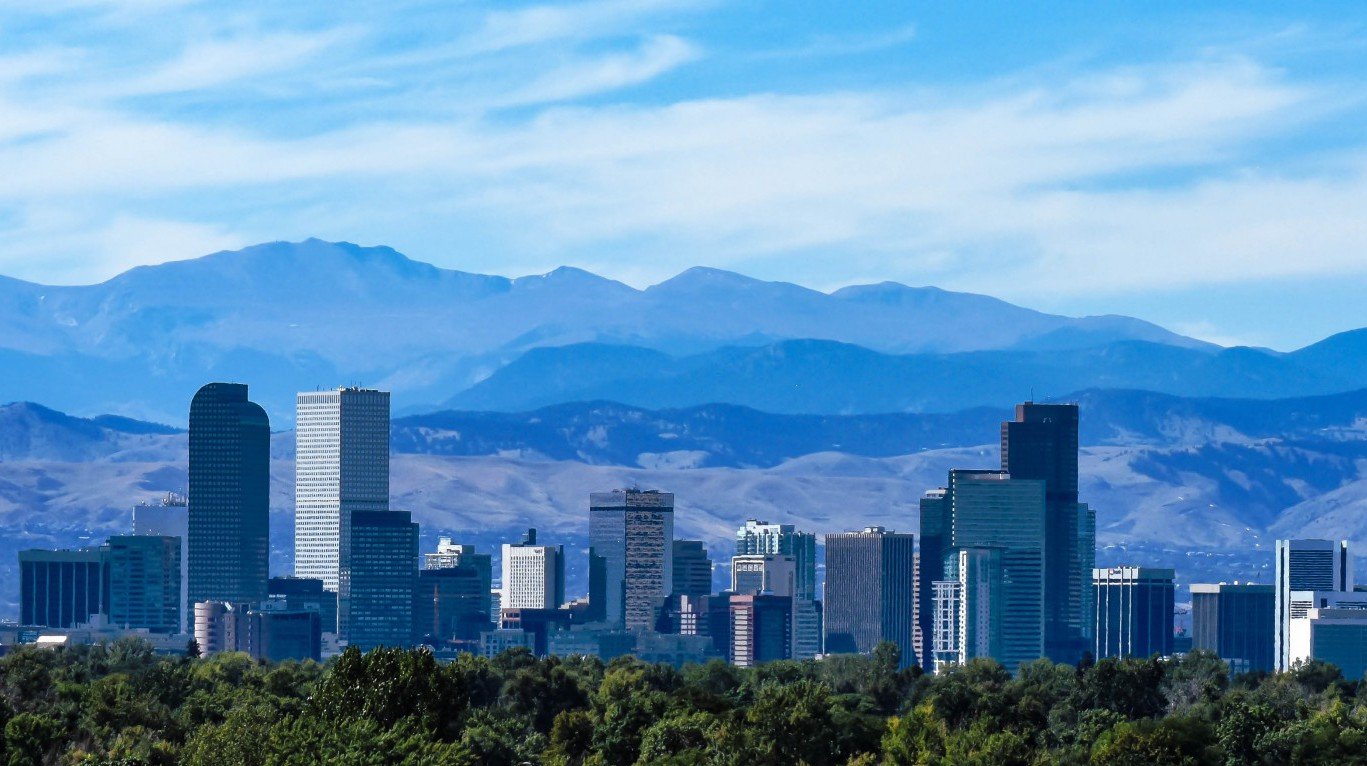
6. Colorado
> State & local government spending per capita: $9,336 (22nd highest)
> State & local tax collections per capita: $4,592 (22nd highest)
> Largest spending category: Education (29.9% of spending)
> Share of workers in public sector jobs: 16.4% (24th lowest)
> Poverty rate: 11.0% (12th lowest)
[in-text-ad]

Source: Thinkstock
7. Connecticut
> State & local government spending per capita: $10,915 (9th highest)
> State & local tax collections per capita: $7,410 (3rd highest)
> Largest spending category: Education (34.0% of spending)
> Share of workers in public sector jobs: 13.8% (10th lowest)
> Poverty rate: 9.8% (4th lowest)
Source: Thinkstock
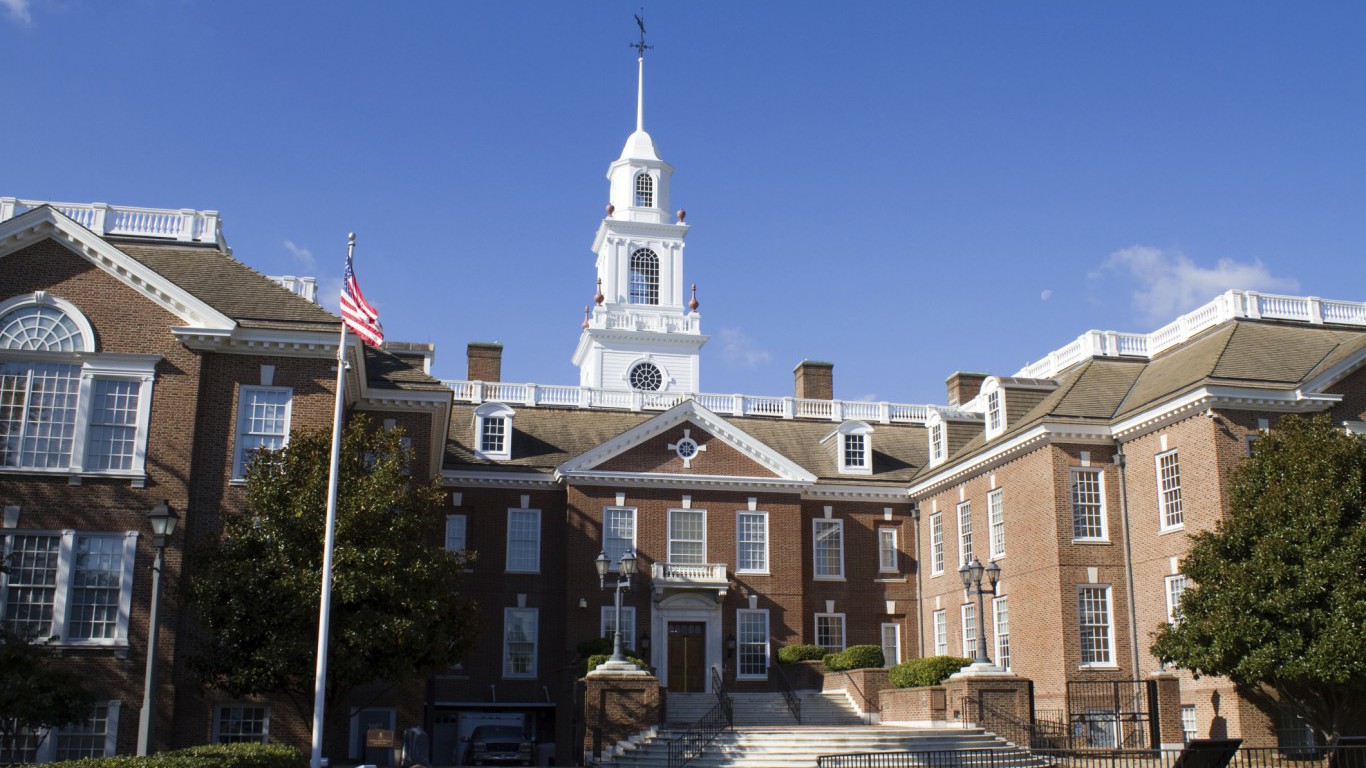
8. Delaware
> State & local government spending per capita: $10,742 (10th highest)
> State & local tax collections per capita: $4,760 (18th highest)
> Largest spending category: Education (35.7% of spending)
> Share of workers in public sector jobs: 14.5% (15th lowest)
> Poverty rate: 11.7% (16th lowest)

Source: GiorgioMorara / iStock
9. Florida
> State & local government spending per capita: $7,463 (5th lowest)
> State & local tax collections per capita: $3,448 (5th lowest)
> Largest spending category: Health and welfare (28.2% of spending)
> Share of workers in public sector jobs: 12.9% (5th lowest)
> Poverty rate: 14.7% (16th highest)
[in-text-ad-2]

Source: Thinkstock
10. Georgia
> State & local government spending per capita: $7,198 (2nd lowest)
> State & local tax collections per capita: $3,515 (8th lowest)
> Largest spending category: Education (35.5% of spending)
> Share of workers in public sector jobs: 15.4% (21st lowest)
> Poverty rate: 16.0% (10th highest)

Source: Thinkstock
11. Hawaii
> State & local government spending per capita: $10,225 (14th highest)
> State & local tax collections per capita: $6,084 (7th highest)
> Largest spending category: Health and welfare (28.9% of spending)
> Share of workers in public sector jobs: 19.2% (8th highest)
> Poverty rate: 9.3% (2nd lowest)
[in-text-ad]

Source: knowlesgallery / iStock
12. Idaho
> State & local government spending per capita: $6,493 (the lowest)
> State & local tax collections per capita: $3,433 (4th lowest)
> Largest spending category: Health and welfare (31.2% of spending)
> Share of workers in public sector jobs: 17.2% (18th highest)
> Poverty rate: 14.4% (19th highest)
 24/7 Wall St.
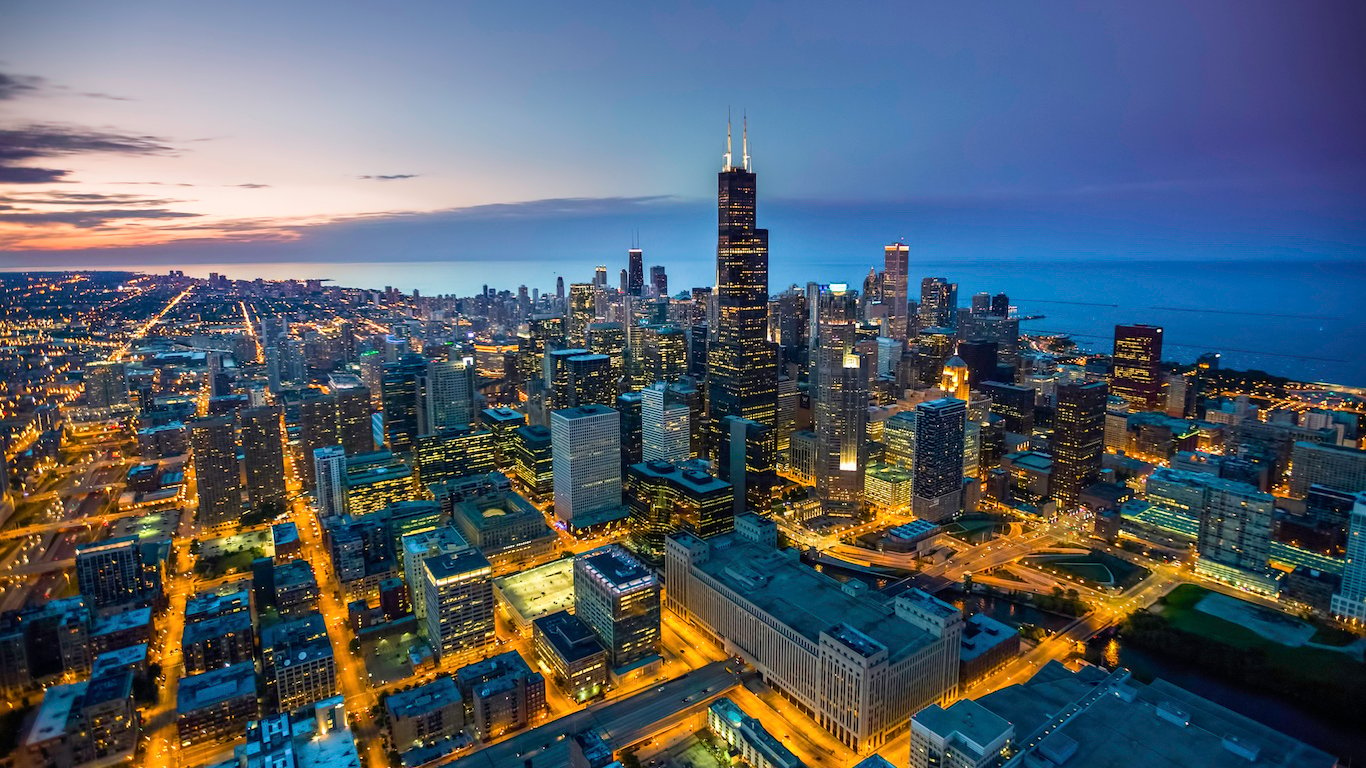
Source: Thinkstock
13. Illinois
> State & local government spending per capita: $9,615 (20th highest)
> State & local tax collections per capita: $5,742 (12th highest)
> Largest spending category: Education (31.4% of spending)
> Share of workers in public sector jobs: 13.7% (7th lowest)
> Poverty rate: 13.0% (24th lowest)
Source: Thinkstock
14. Indiana
> State & local government spending per capita: $7,802 (7th lowest)
> State & local tax collections per capita: $3,835 (15th lowest)
> Largest spending category: Health and welfare (35.0% of spending)
> Share of workers in public sector jobs: 13.7% (8th lowest)
> Poverty rate: 14.1% (21st highest)
[in-text-ad-2]
Source: Thinkstock
15. Iowa
> State & local government spending per capita: $10,093 (16th highest)
> State & local tax collections per capita: $4,756 (19th highest)
> Largest spending category: Education (34.7% of spending)
> Share of workers in public sector jobs: 16.6% (24th highest)
> Poverty rate: 11.8% (18th lowest)
Source: Thinkstock
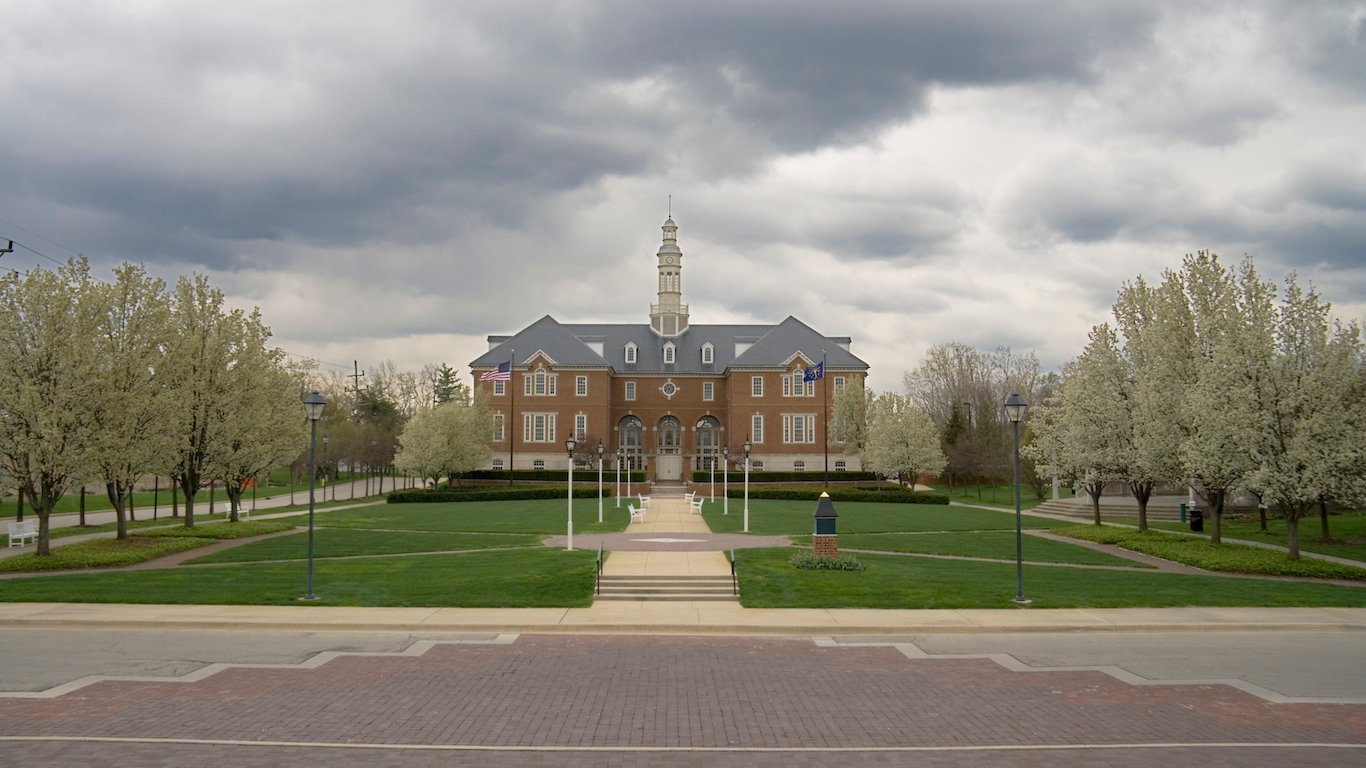
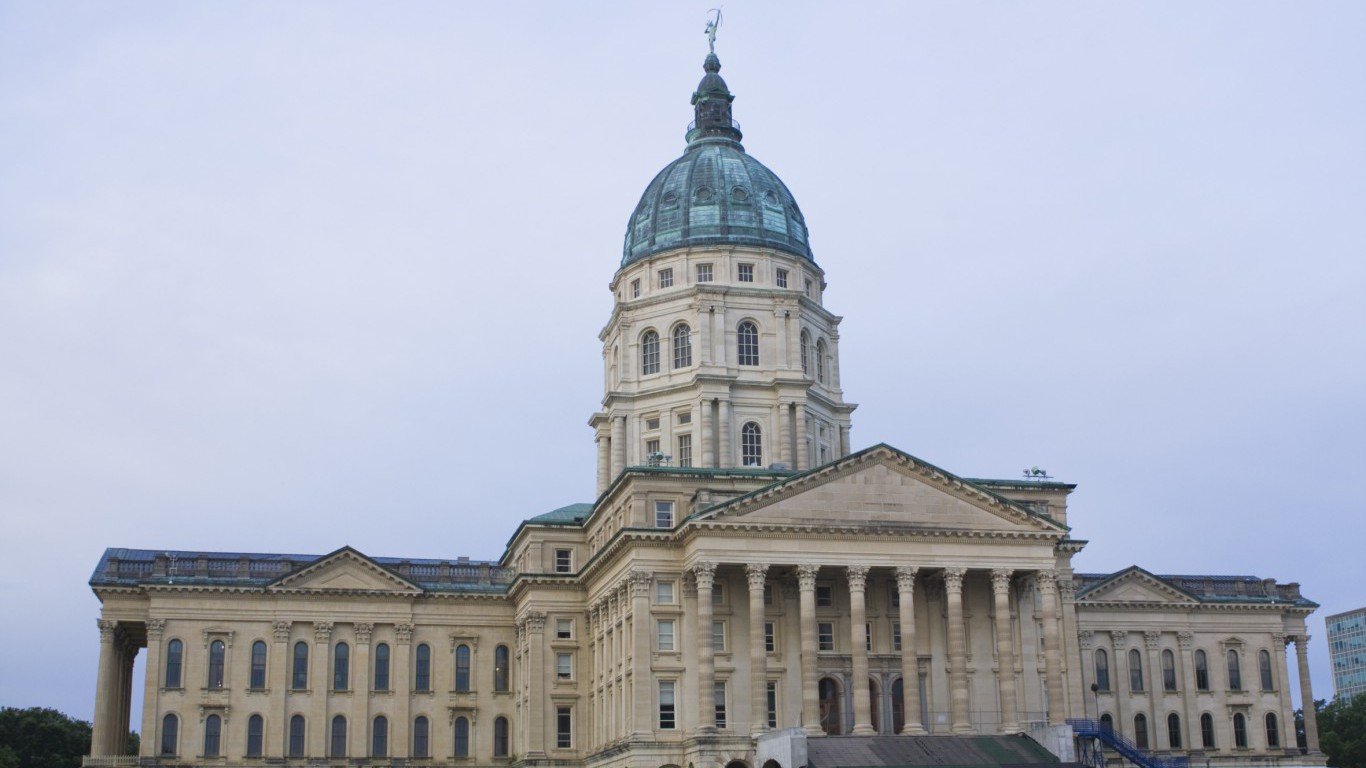
16. Kansas
> State & local government spending per capita: $8,899 (25th highest)
> State & local tax collections per capita: $4,386 (25th highest)
> Largest spending category: Education (35.9% of spending)
> Share of workers in public sector jobs: 18.3% (12th highest)
> Poverty rate: 12.1% (20th lowest)
[in-text-ad]
Source: Thinkstock
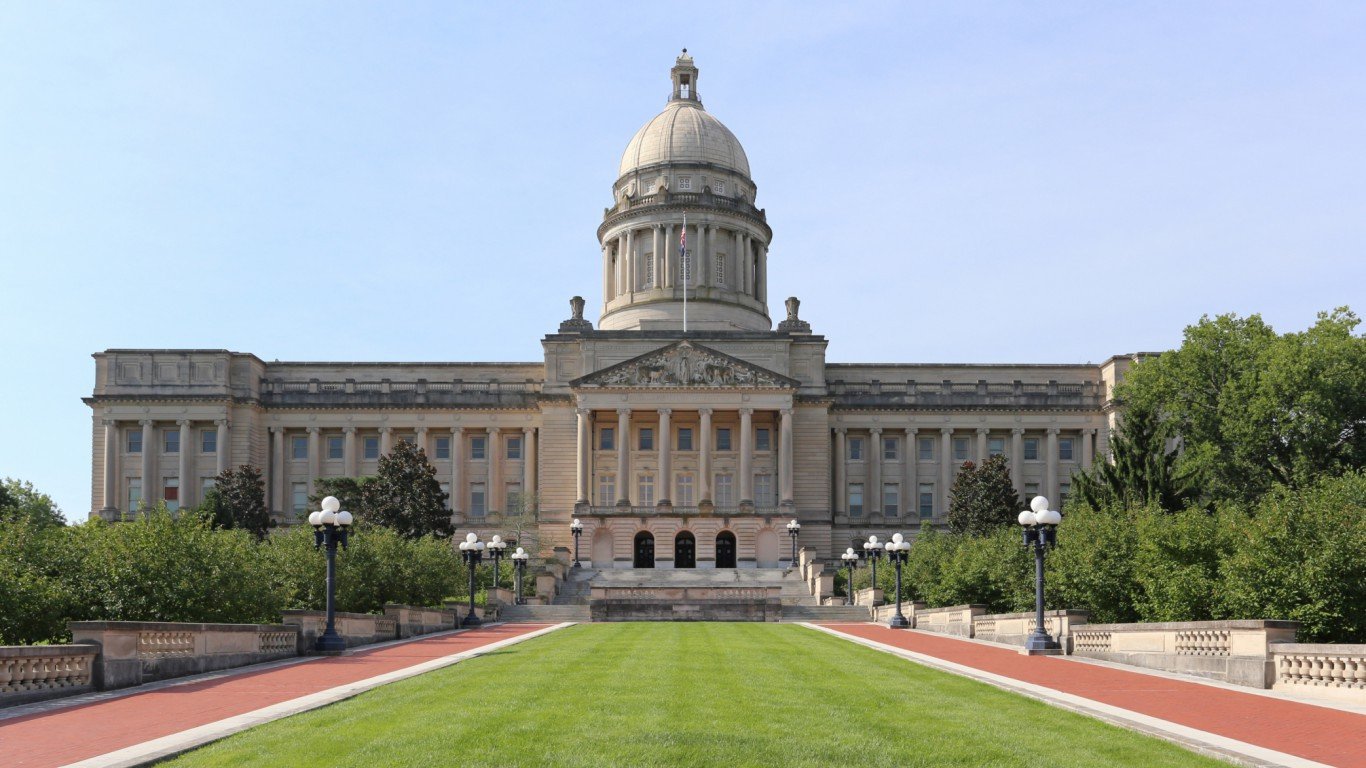
17. Kentucky
> State & local government spending per capita: $8,893 (25th lowest)
> State & local tax collections per capita: $3,782 (13th lowest)
> Largest spending category: Health and welfare (35.9% of spending)
> Share of workers in public sector jobs: 16.4% (25th lowest)
> Poverty rate: 18.5% (4th highest)

Source: Thinkstock
18. Louisiana
> State & local government spending per capita: $9,005 (24th highest)
> State & local tax collections per capita: $3,950 (18th lowest)
> Largest spending category: Health and welfare (30.5% of spending)
> Share of workers in public sector jobs: 16.6% (22nd highest)
> Poverty rate: 20.2% (2nd highest)
Source: Thinkstock
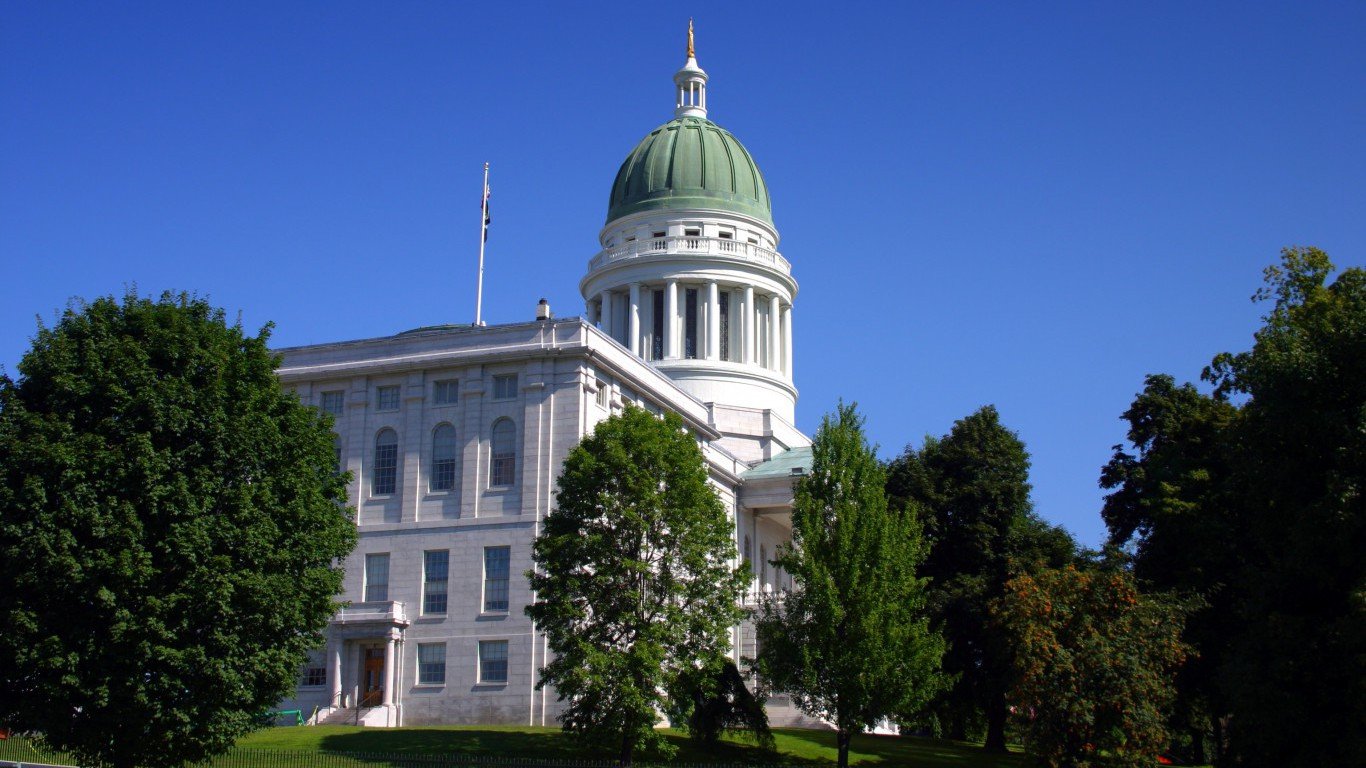
19. Maine
> State & local government spending per capita: $8,483 (18th lowest)
> State & local tax collections per capita: $5,106 (14th highest)
> Largest spending category: Health and welfare (34.4% of spending)
> Share of workers in public sector jobs: 16.1% (23rd lowest)
> Poverty rate: 12.5% (21st lowest)
[in-text-ad-2]

Source: Thinkstock
20. Maryland
> State & local government spending per capita: $10,032 (17th highest)
> State & local tax collections per capita: $5,846 (9th highest)
> Largest spending category: Education (32.7% of spending)
> Share of workers in public sector jobs: 18.5% (11th highest)
> Poverty rate: 9.7% (3rd lowest)

Source: Thinkstock
21. Massachusetts
> State & local government spending per capita: $11,478 (7th highest)
> State & local tax collections per capita: $6,339 (6th highest)
> Largest spending category: Health and welfare (31.1% of spending)
> Share of workers in public sector jobs: 12.5% (4th lowest)
> Poverty rate: 10.4% (9th lowest)
[in-text-ad]
Source: Thinkstock
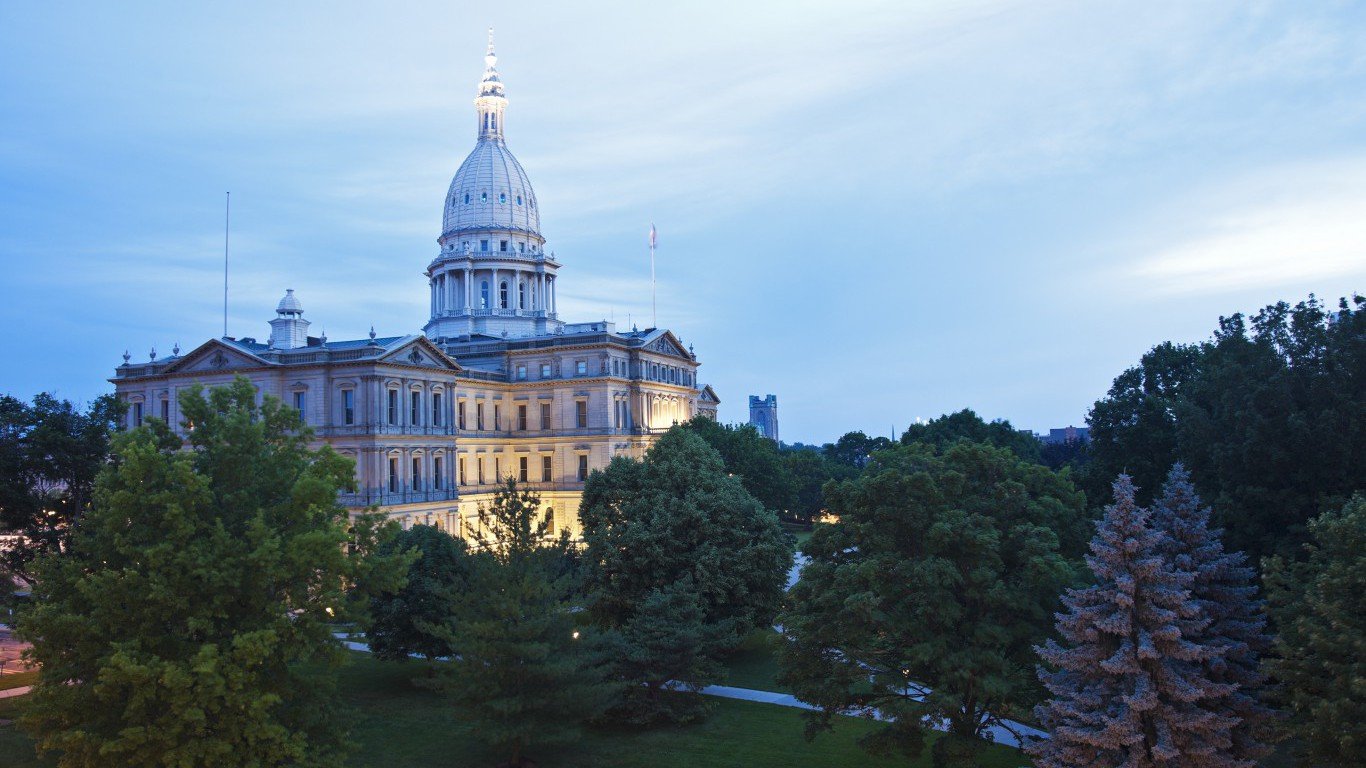
22. Michigan
> State & local government spending per capita: $8,475 (17th lowest)
> State & local tax collections per capita: $4,008 (19th lowest)
> Largest spending category: Education (34.7% of spending)
> Share of workers in public sector jobs: 13.8% (9th lowest)
> Poverty rate: 15.0% (15th highest)
Source: Thinkstock
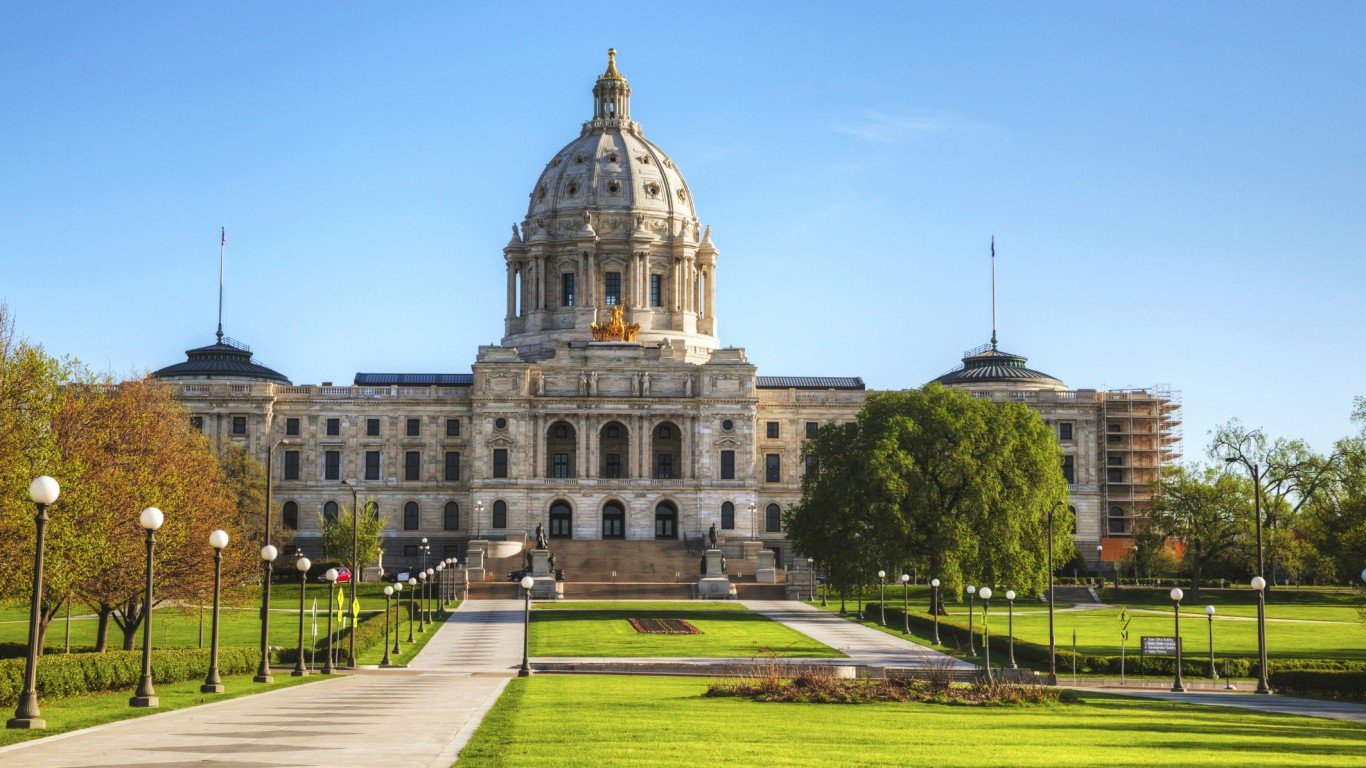
23. Minnesota
> State & local government spending per capita: $10,119 (15th highest)
> State & local tax collections per capita: $5,946 (8th highest)
> Largest spending category: Health and welfare (32.8% of spending)
> Share of workers in public sector jobs: 14.5% (14th lowest)
> Poverty rate: 9.9% (6th lowest)
Source: Thinkstock
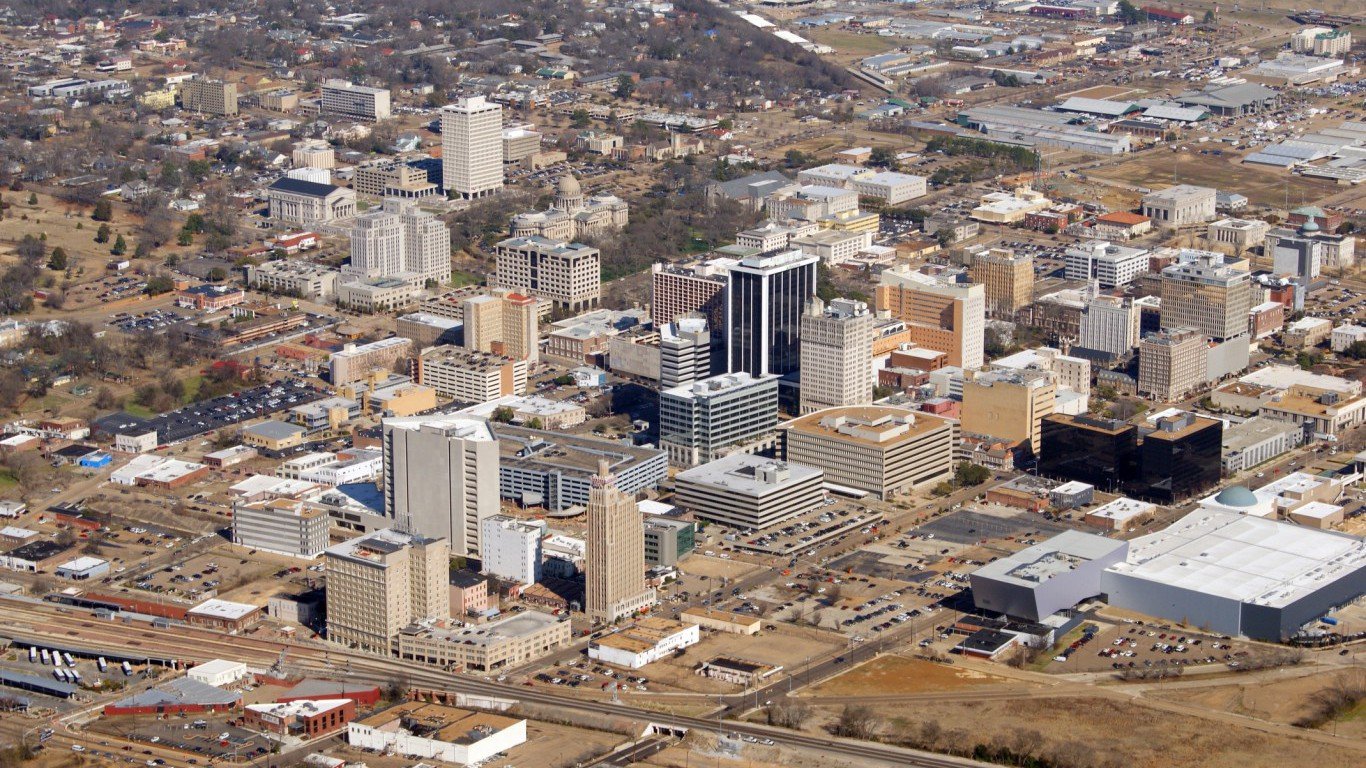
24. Mississippi
> State & local government spending per capita: $8,836 (24th lowest)
> State & local tax collections per capita: $3,669 (11th lowest)
> Largest spending category: Health and welfare (38.8% of spending)
> Share of workers in public sector jobs: 21.1% (5th highest)
> Poverty rate: 20.8% (the highest)
[in-text-ad-2]
Source: Thinkstock
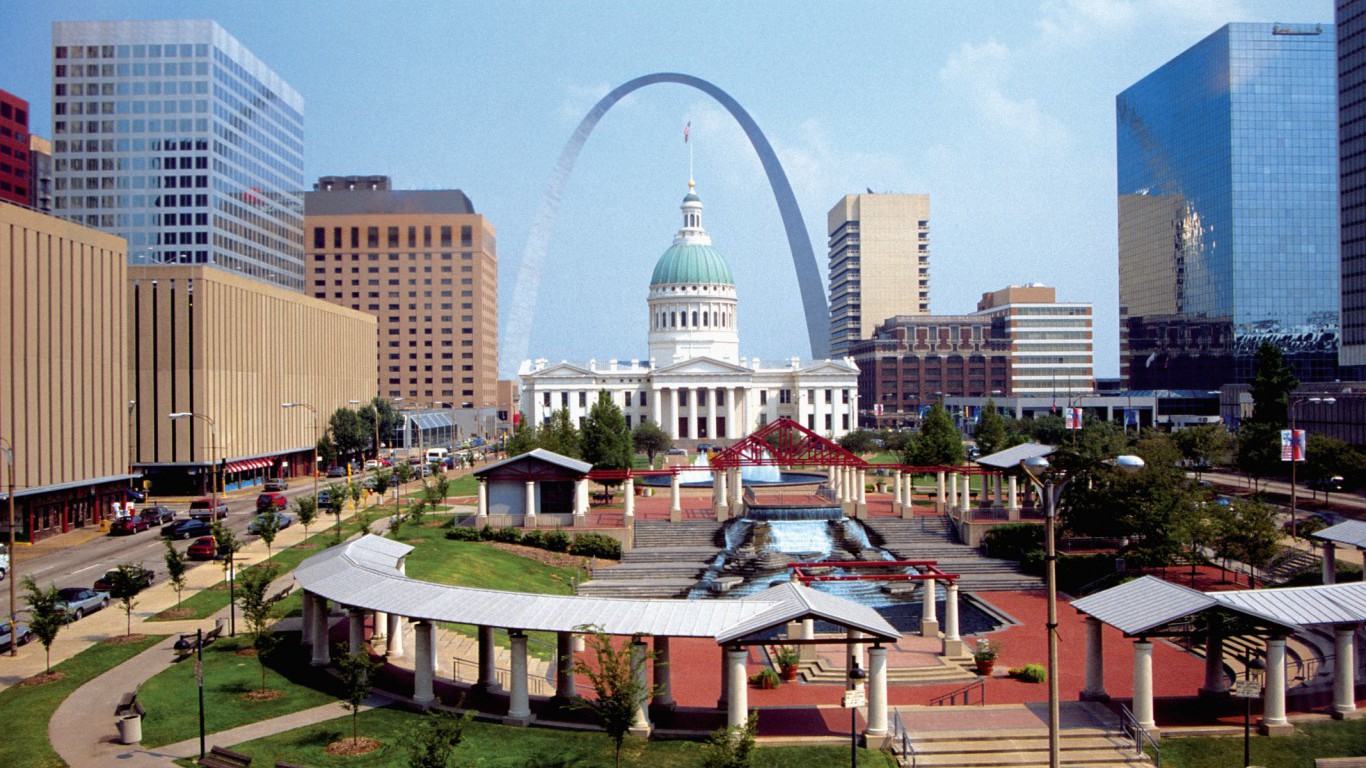
25. Missouri
> State & local government spending per capita: $7,640 (6th lowest)
> State & local tax collections per capita: $3,644 (10th lowest)
> Largest spending category: Education (32.8% of spending)
> Share of workers in public sector jobs: 15.2% (18th lowest)
> Poverty rate: 14.0% (22nd highest)

Source: Thinkstock
26. Montana
> State & local government spending per capita: $8,595 (22nd lowest)
> State & local tax collections per capita: $4,042 (20th lowest)
> Largest spending category: Education (31.7% of spending)
> Share of workers in public sector jobs: 19.3% (7th highest)
> Poverty rate: 13.3% (24th highest)
[in-text-ad]
Source: Thinkstock
27. Nebraska
> State & local government spending per capita: $10,992 (8th highest)
> State & local tax collections per capita: $5,051 (15th highest)
> Largest spending category: Education (32.1% of spending)
> Share of workers in public sector jobs: 17.0% (20th highest)
> Poverty rate: 11.4% (15th lowest)
 24/7 Wall St.
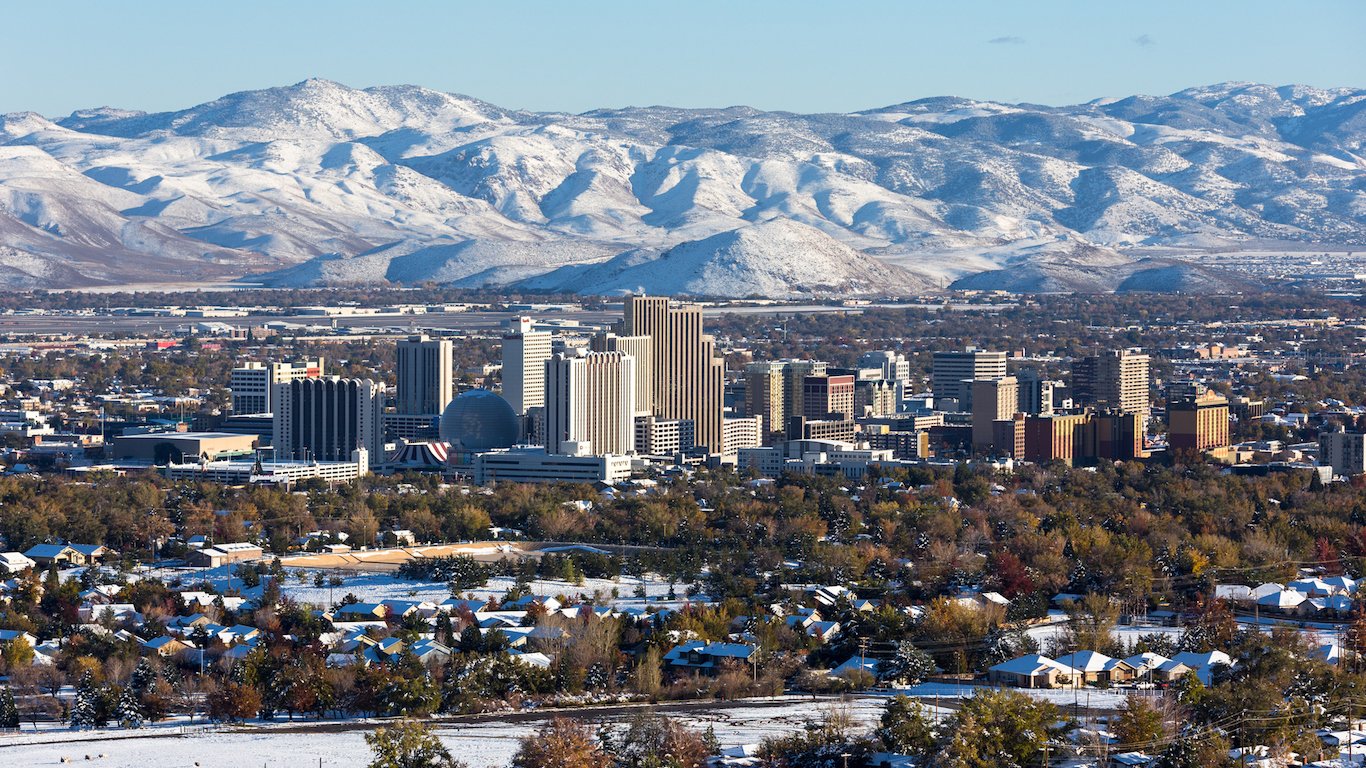
Source: Thinkstock
28. Nevada
> State & local government spending per capita: $7,383 (4th lowest)
> State & local tax collections per capita: $4,099 (22nd lowest)
> Largest spending category: Education (27.6% of spending)
> Share of workers in public sector jobs: 12.0% (2nd lowest)
> Poverty rate: 13.8% (23rd highest)

Source: Thinkstock
29. New Hampshire
> State & local government spending per capita: $8,314 (15th lowest)
> State & local tax collections per capita: $4,647 (21st highest)
> Largest spending category: Education (35.9% of spending)
> Share of workers in public sector jobs: 13.3% (6th lowest)
> Poverty rate: 7.3% (the lowest)
[in-text-ad-2]

Source: Thinkstock
30. New Jersey
> State & local government spending per capita: $10,531 (11th highest)
> State & local tax collections per capita: $6,664 (4th highest)
> Largest spending category: Education (37.4% of spending)
> Share of workers in public sector jobs: 14.9% (16th lowest)
> Poverty rate: 10.4% (9th lowest)
Source: Thinkstock
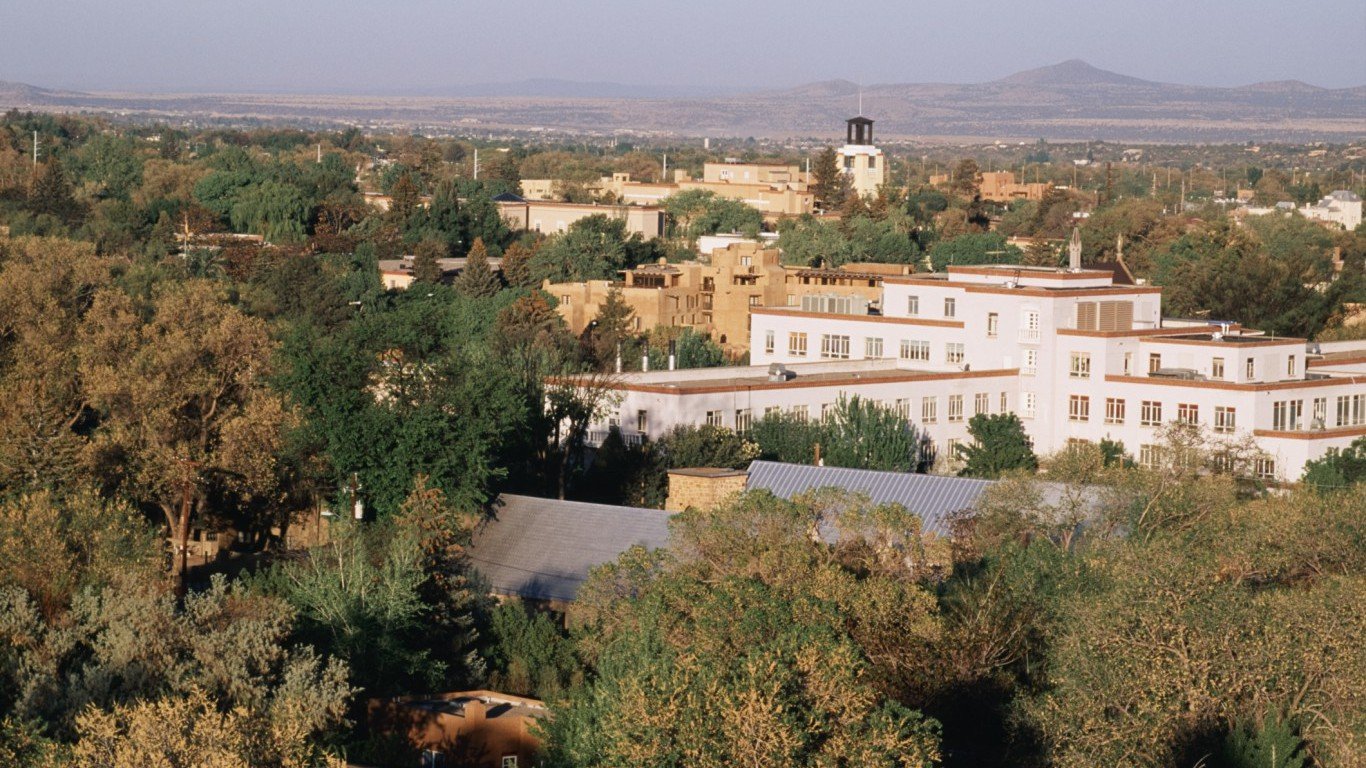
31. New Mexico
> State & local government spending per capita: $10,442 (12th highest)
> State & local tax collections per capita: $4,151 (24th lowest)
> Largest spending category: Health and welfare (35.7% of spending)
> Share of workers in public sector jobs: 22.5% (3rd highest)
> Poverty rate: 19.8% (3rd highest)
[in-text-ad]
Source: Thinkstock
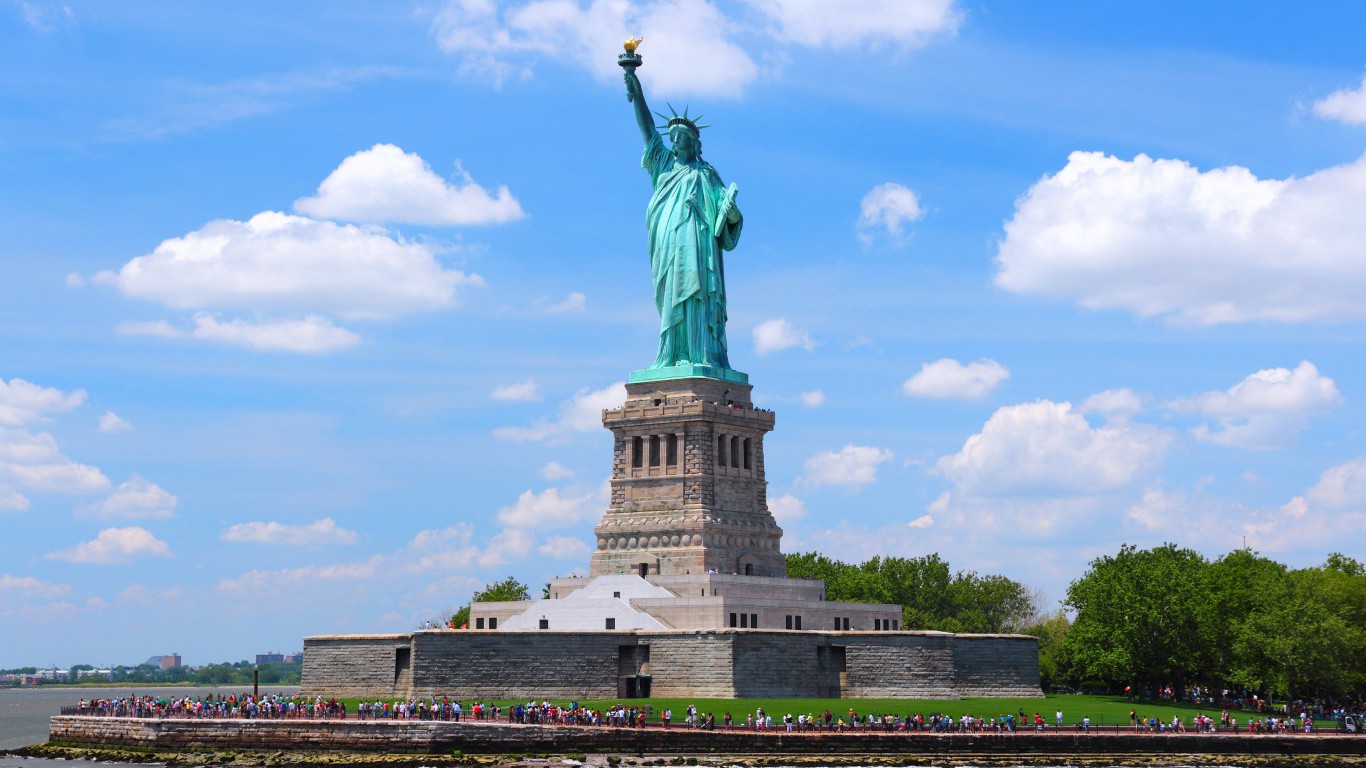
32. New York
> State & local government spending per capita: $14,647 (3rd highest)
> State & local tax collections per capita: $8,722 (2nd highest)
> Largest spending category: Health and welfare (30.5% of spending)
> Share of workers in public sector jobs: 15.2% (20th lowest)
> Poverty rate: 14.7% (16th highest)
 24/7 Wall St.
Source: Thinkstock
33. North Carolina
> State & local government spending per capita: $7,945 (9th lowest)
> State & local tax collections per capita: $3,788 (14th lowest)
> Largest spending category: Health and welfare (35.2% of spending)
> Share of workers in public sector jobs: 16.6% (21st highest)
> Poverty rate: 15.4% (13th highest)

Source: Thinkstock
34. North Dakota
> State & local government spending per capita: $12,360 (4th highest)
> State & local tax collections per capita: $9,182 (the highest)
> Largest spending category: Education (31.5% of spending)
> Share of workers in public sector jobs: 19.1% (9th highest)
> Poverty rate: 10.7% (10th lowest)
[in-text-ad-2]

Source: Thinkstock
35. Ohio
> State & local government spending per capita: $8,582 (21st lowest)
> State & local tax collections per capita: $4,414 (24th highest)
> Largest spending category: Education (34.3% of spending)
> Share of workers in public sector jobs: 14.2% (12th lowest)
> Poverty rate: 14.6% (18th highest)

Source: Thinkstock
36. Oklahoma
> State & local government spending per capita: $7,823 (8th lowest)
> State & local tax collections per capita: $3,697 (12th lowest)
> Largest spending category: Education (33.5% of spending)
> Share of workers in public sector jobs: 21.1% (4th highest)
> Poverty rate: 16.3% (9th highest)
[in-text-ad]

Source: BoucherPhotoStudio / iStock
37. Oregon
> State & local government spending per capita: $9,859 (18th highest)
> State & local tax collections per capita: $4,360 (25th lowest)
> Largest spending category: Health and welfare (34.4% of spending)
> Share of workers in public sector jobs: 16.5% (25th highest)
> Poverty rate: 13.3% (24th highest)
 24/7 Wall St.
Source: Thinkstock
38. Pennsylvania
> State & local government spending per capita: $9,373 (21st highest)
> State & local tax collections per capita: $4,950 (16th highest)
> Largest spending category: Education (32.7% of spending)
> Share of workers in public sector jobs: 11.8% (the lowest)
> Poverty rate: 12.9% (23rd lowest)
Source: Thinkstock
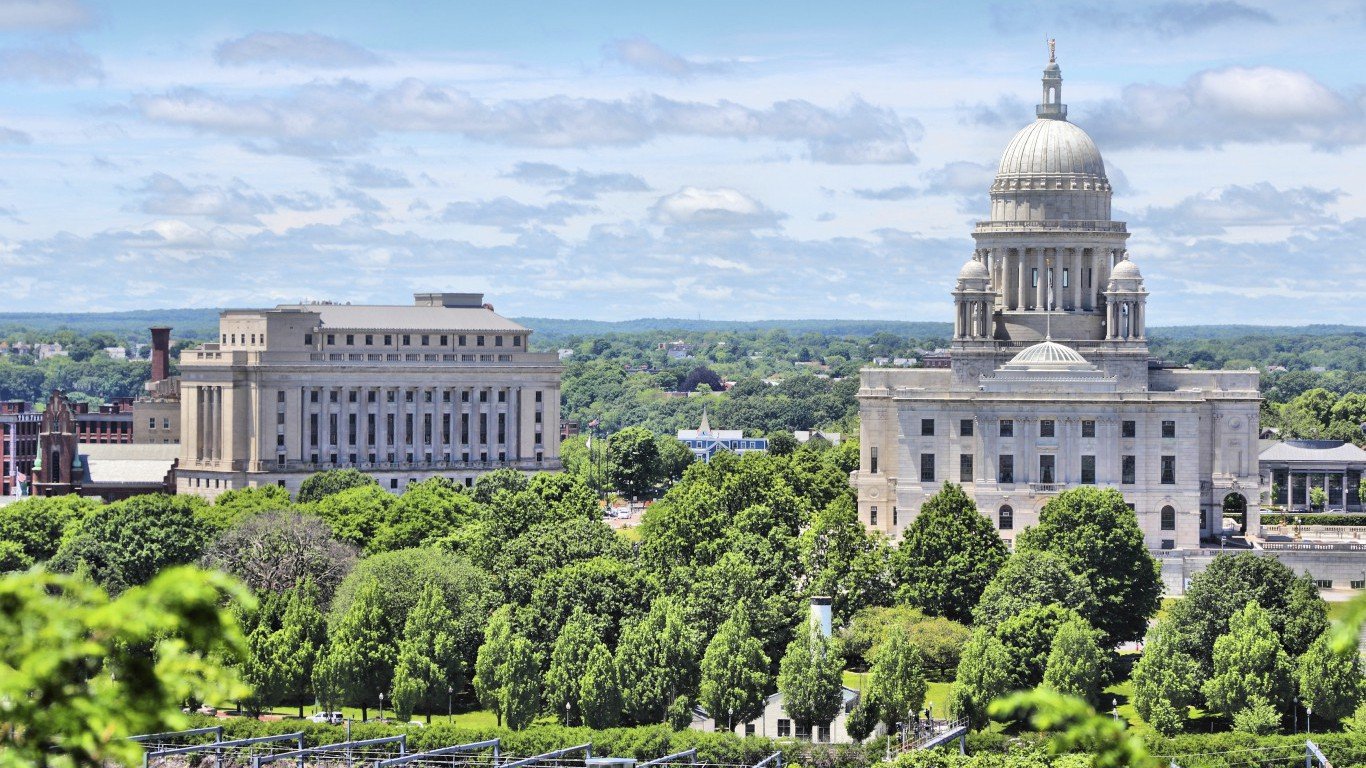
39. Rhode Island
> State & local government spending per capita: $9,846 (19th highest)
> State & local tax collections per capita: $5,418 (13th highest)
> Largest spending category: Education (31.8% of spending)
> Share of workers in public sector jobs: 12.3% (3rd lowest)
> Poverty rate: 12.8% (22nd lowest)
[in-text-ad-2]
Source: Thinkstock
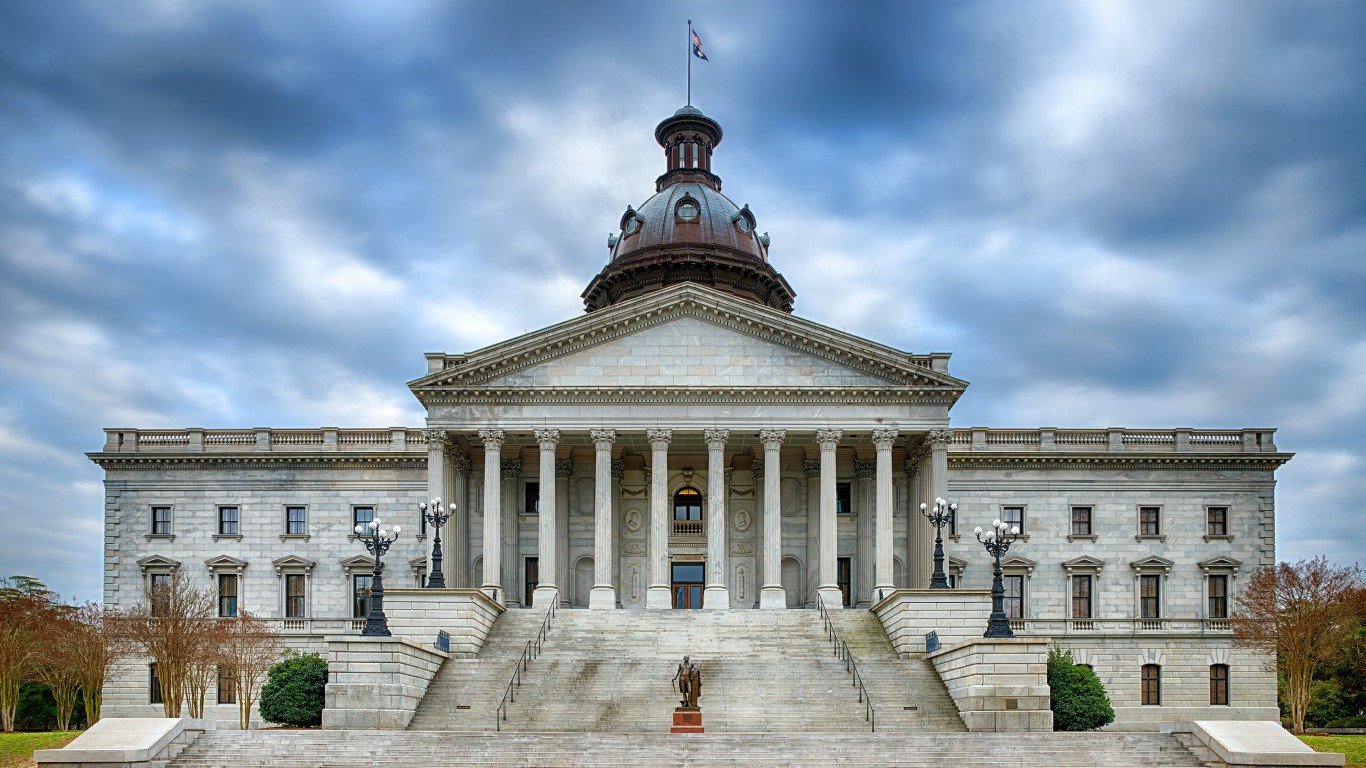
40. South Carolina
> State & local government spending per capita: $8,555 (20th lowest)
> State & local tax collections per capita: $3,425 (3rd lowest)
> Largest spending category: Health and welfare (35.7% of spending)
> Share of workers in public sector jobs: 17.5% (17th highest)
> Poverty rate: 15.3% (14th highest)
Source: Thinkstock
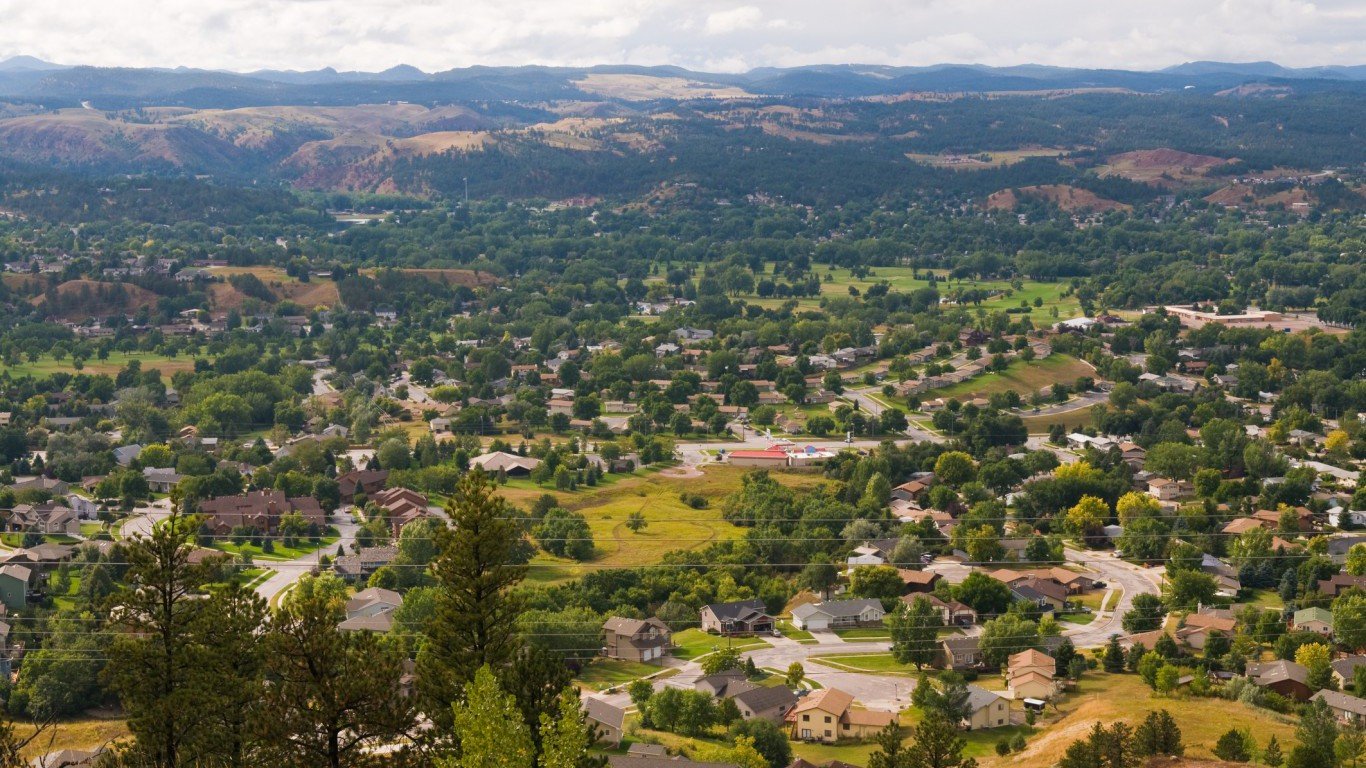
41. South Dakota
> State & local government spending per capita: $7,975 (11th lowest)
> State & local tax collections per capita: $3,835 (16th lowest)
> Largest spending category: Education (33.0% of spending)
> Share of workers in public sector jobs: 18.3% (13th highest)
> Poverty rate: 13.3% (24th highest)
[in-text-ad]

Source: Thinkstock
42. Tennessee
> State & local government spending per capita: $8,043 (13th lowest)
> State & local tax collections per capita: $3,268 (2nd lowest)
> Largest spending category: Health and welfare (29.8% of spending)
> Share of workers in public sector jobs: 14.3% (13th lowest)
> Poverty rate: 15.8% (11th highest)

Source: Thinkstock
43. Texas
> State & local government spending per capita: $8,036 (12th lowest)
> State & local tax collections per capita: $4,120 (23rd lowest)
> Largest spending category: Education (36.2% of spending)
> Share of workers in public sector jobs: 15.9% (22nd lowest)
> Poverty rate: 15.6% (12th highest)
Source: Thinkstock
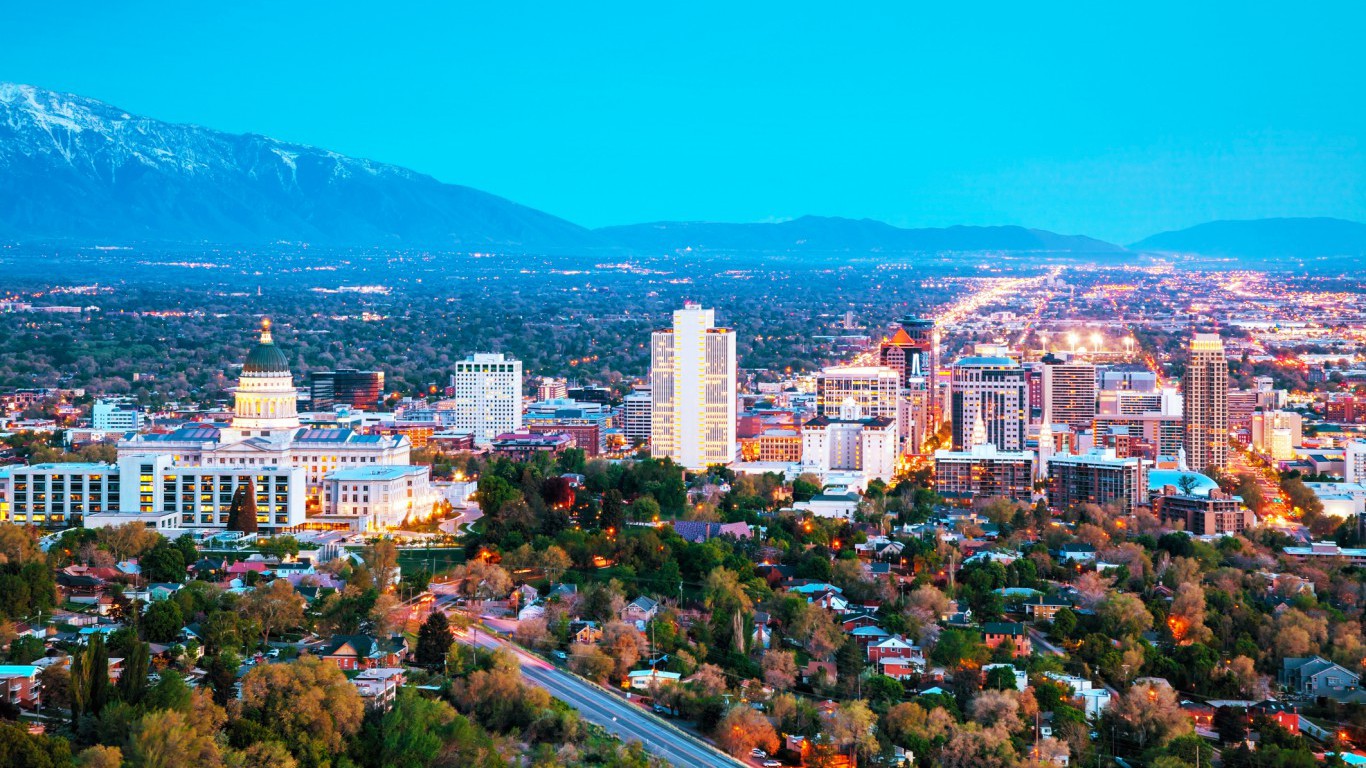
44. Utah
> State & local government spending per capita: $7,961 (10th lowest)
> State & local tax collections per capita: $3,622 (9th lowest)
> Largest spending category: Education (36.2% of spending)
> Share of workers in public sector jobs: 16.6% (23rd highest)
> Poverty rate: 10.2% (7th lowest)
[in-text-ad-2]

Source: SeanPavonePhoto / iStock
45. Vermont
> State & local government spending per capita: $11,627 (5th highest)
> State & local tax collections per capita: $5,801 (11th highest)
> Largest spending category: Education (35.4% of spending)
> Share of workers in public sector jobs: 17.7% (15th highest)
> Poverty rate: 11.9% (19th lowest)

Source: Thinkstock
46. Virginia
> State & local government spending per capita: $8,598 (23rd lowest)
> State & local tax collections per capita: $4,457 (23rd highest)
> Largest spending category: Education (35.1% of spending)
> Share of workers in public sector jobs: 18.1% (14th highest)
> Poverty rate: 11.0% (12th lowest)
[in-text-ad]

Source: aiisha5 / iStock
47. Washington
> State & local government spending per capita: $10,342 (13th highest)
> State & local tax collections per capita: $4,765 (17th highest)
> Largest spending category: Education (29.3% of spending)
> Share of workers in public sector jobs: 17.6% (16th highest)
> Poverty rate: 11.3% (14th lowest)
 24/7 Wall St.
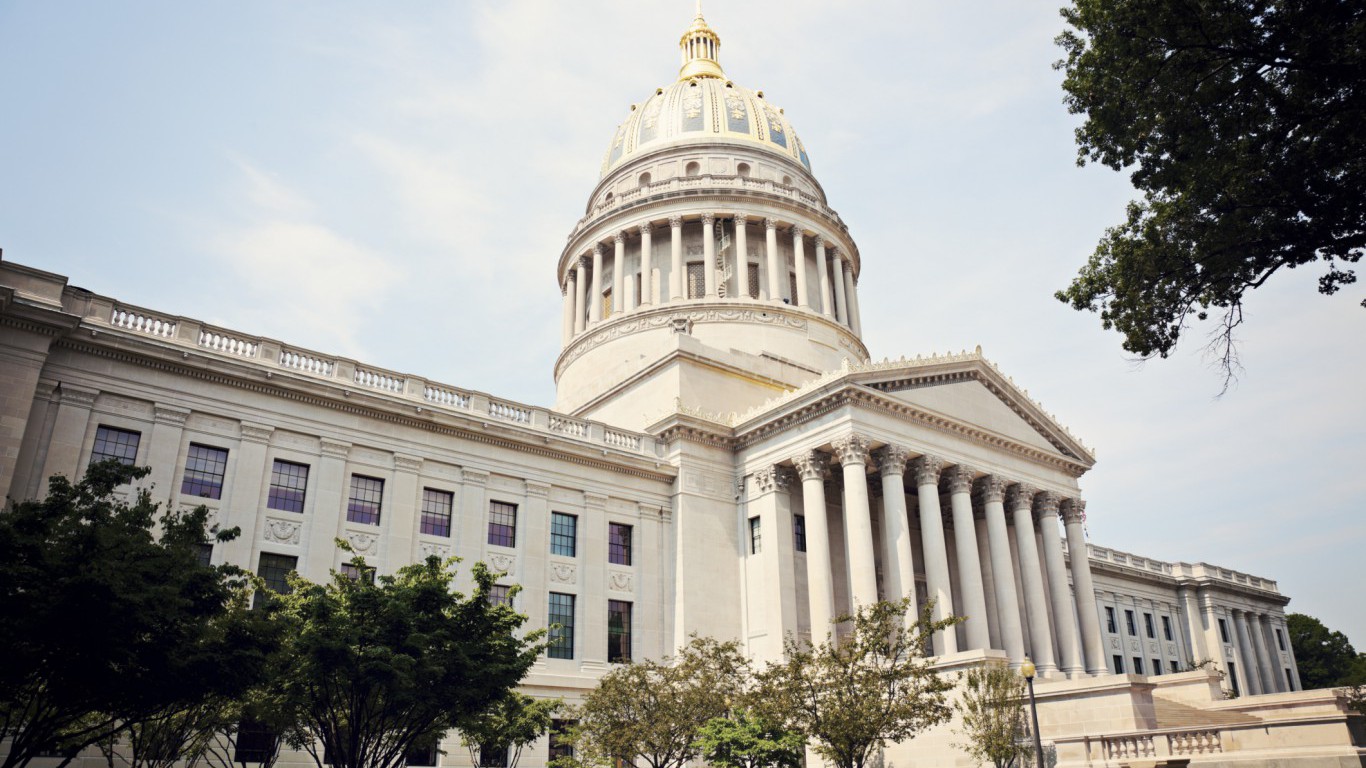
Source: Thinkstock
48. West Virginia
> State & local government spending per capita: $8,514 (19th lowest)
> State & local tax collections per capita: $4,098 (21st lowest)
> Largest spending category: Education (34.1% of spending)
> Share of workers in public sector jobs: 20.6% (6th highest)
> Poverty rate: 17.9% (5th highest)
Source: Thinkstock
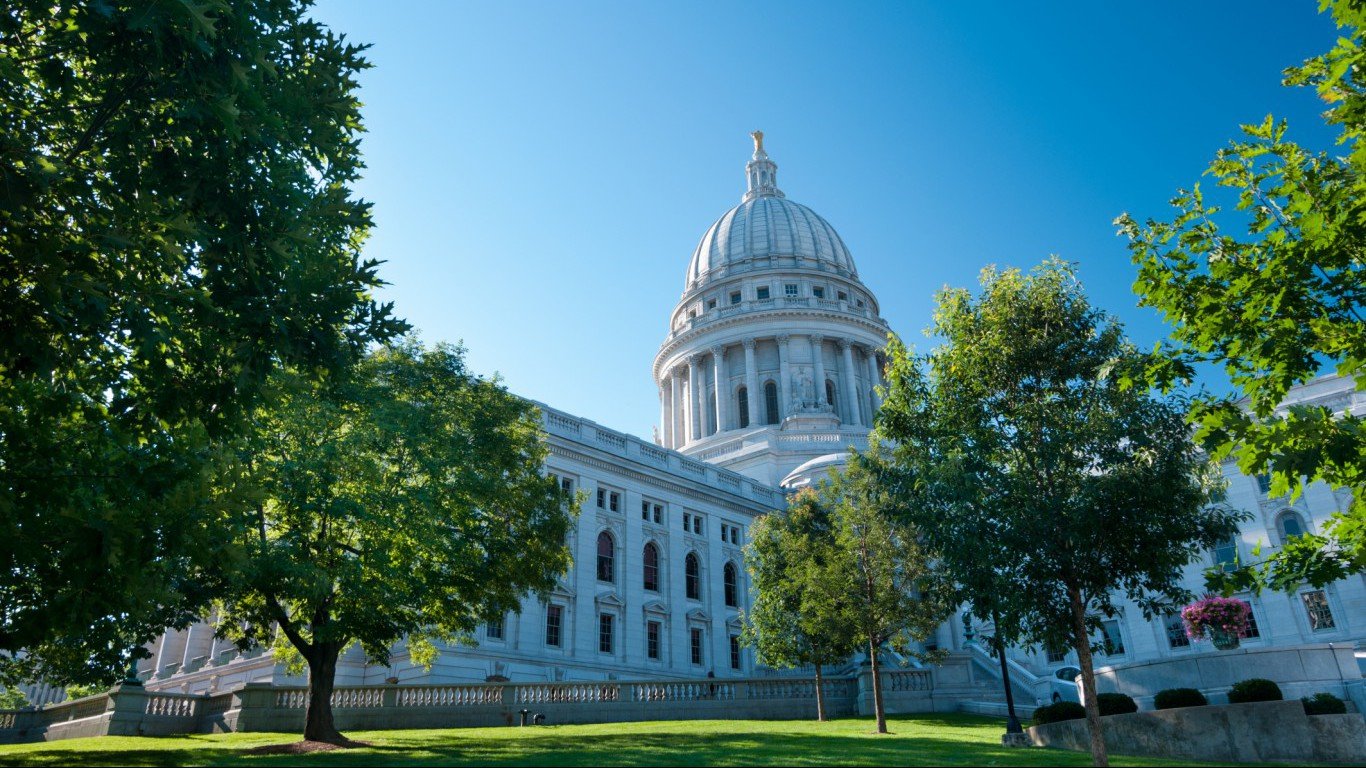
49. Wisconsin
> State & local government spending per capita: $9,268 (23rd highest)
> State & local tax collections per capita: $4,661 (20th highest)
> Largest spending category: Education (33.7% of spending)
> Share of workers in public sector jobs: 13.8% (11th lowest)
> Poverty rate: 11.8% (18th lowest)
[in-text-ad-2]
Source: Thinkstock
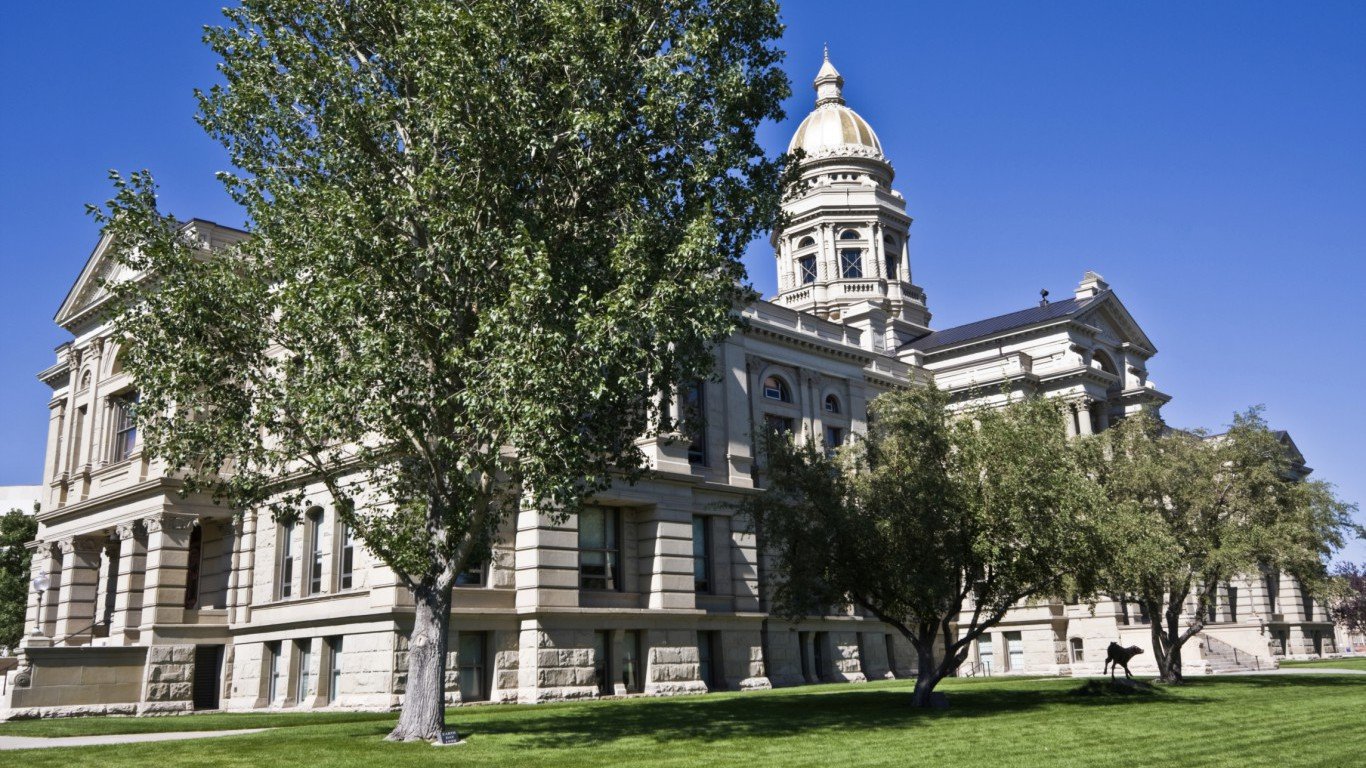
50. Wyoming
> State & local government spending per capita: $14,916 (2nd highest)
> State & local tax collections per capita: $6,394 (5th highest)
> Largest spending category: Education (33.3% of spending)
> Share of workers in public sector jobs: 24.9% (the highest)
> Poverty rate: 11.3% (14th lowest)
Sponsored: Attention Savvy Investors: Speak to 3 Financial Experts – FREE
Ever wanted an extra set of eyes on an investment you’re considering? Now you can speak with up to 3 financial experts in your area for FREE. By simply
clicking here you can begin to match with financial professionals who can help guide you through the financial decisions you’re making. And the best part? The first conversation with them is free.
Click here to match with up to 3 financial pros who would be excited to help you make financial decisions.
Thank you for reading! Have some feedback for us?
Contact the 24/7 Wall St. editorial team.
Editors' Picks

