

U.S. state governments spent about $390 billion on the welfare of their residents in 2015. Welfare represents about 26% of total state spending, the largest form of state-level spending by a large margin. The category includes cash assistance, public housing, and health expenses like Medicaid.
States differ not just in their economic and demographic makeup, but also in their finances, politics, policies, and procedures — all affect the size of state spending on public assistance programs. At the state level, per capita welfare spending ranges from just over $1,000 to more than $2,700.
While cash assistance programs are the ones most often associated with welfare spending, they represent an extremely small share of low-income support systems – less than 1% of total state welfare spending.
Such programs — including Temporary Assistance for Needy Families, or TANF; Supplemental Security Income, or SSI; and the Federal Low Income Home Energy Assistance Program — are mostly funded at the federal level. At the state level, health spending, and particularly payment to health providers through Medicaid, represents the largest share of state welfare costs.
24/7 Wall St. reviewed per-capita state government welfare expenditure figures from the U.S. Census Bureau’s 2015 State and Local Government Expenditures data. States with high welfare expenditures tend to be home to higher shares of elderly residents and higher tax collections per capita. Less affluent states tend to rely far more on the federal government to fund welfare programs. Our list is ranked in order from the lowest per capita state welfare expenditure to the highest.
Click here to see how your state funds welfare and where it goes.
Click here to see our detailed findings and methodology.

50. Utah
> Total 2015 state welfare spending: $1,076 per capita ($3.22 billion)
> Medical payments as share of state welfare spending: 79.6% (5th lowest)
> State welfare spending from federal funds: 74.9% (10th highest)
> Population 65 and over: 10.5% (2nd lowest)
> State tax collections per capita: $2,237 (13th lowest)
[in-text-ad]

49. Georgia
> Total 2015 state welfare spending: $1,152 per capita ($11.77 billion)
> Medical payments as share of state welfare spending: 90.3% (16th highest)
> State welfare spending from federal funds: 54.2% (15th lowest)
> Population 65 and over: 13.2% (4th lowest)
> State tax collections per capita: $1,931 (5th lowest)

48. North Carolina
> Total 2015 state welfare spending: $1,191 per capita ($11.96 billion)
> Medical payments as share of state welfare spending: 94.8% (2nd highest)
> State welfare spending from federal funds: 80.9% (7th highest)
> Population 65 and over: 15.5% (24th lowest)
> State tax collections per capita: $2,498 (19th lowest)

47. Virginia
> Total 2015 state welfare spending: $1,191 per capita ($9.98 billion)
> Medical payments as share of state welfare spending: 84.9% (19th lowest)
> State welfare spending from federal funds: 47.6% (4th lowest)
> Population 65 and over: 14.6% (10th lowest)
> State tax collections per capita: $2,450 (18th lowest)
[in-text-ad-2]

46. South Dakota
> Total 2015 state welfare spending: $1,205 per capita ($1.03 billion)
> Medical payments as share of state welfare spending: 66.8% (the lowest)
> State welfare spending from federal funds: 63.7% (23rd highest)
> Population 65 and over: 15.9% (23rd highest)
> State tax collections per capita: $1,950 (6th lowest)

45. Nevada
> Total 2015 state welfare spending: $1,260 per capita ($3.64 billion)
> Medical payments as share of state welfare spending: 90.3% (17th highest)
> State welfare spending from federal funds: 53.6% (13th lowest)
> Population 65 and over: 15.0% (17th lowest)
> State tax collections per capita: $2,606 (20th lowest)
[in-text-ad]

44. Texas
> Total 2015 state welfare spending: $1,273 per capita ($34.97 billion)
> Medical payments as share of state welfare spending: 88.3% (24th highest)
> State welfare spending from federal funds: 68.3% (14th highest)
> Population 65 and over: 12.0% (3rd lowest)
> State tax collections per capita: $2,005 (9th lowest)

43. Colorado
> Total 2015 state welfare spending: $1,277 per capita ($6.97 billion)
> Medical payments as share of state welfare spending: 91.2% (10th highest)
> State welfare spending from federal funds: 43.8% (2nd lowest)
> Population 65 and over: 13.4% (5th lowest)
> State tax collections per capita: $2,348 (14th lowest)

42. Florida
> Total 2015 state welfare spending: $1,278 per capita ($25.91 billion)
> Medical payments as share of state welfare spending: 91.9% (8th highest)
> State welfare spending from federal funds: 56.1% (17th lowest)
> Population 65 and over: 19.8% (the highest)
> State tax collections per capita: $1,836 (2nd lowest)
[in-text-ad-2]

41. Wyoming
> Total 2015 state welfare spending: $1,357 per capita ($0.8 billion)
> Medical payments as share of state welfare spending: 79.0% (4th lowest)
> State welfare spending from federal funds: 51.8% (10th lowest)
> Population 65 and over: 15.0% (13th lowest)
> State tax collections per capita: $4,020 (6th highest)

40. Nebraska
> Total 2015 state welfare spending: $1,362 per capita ($2.58 billion)
> Medical payments as share of state welfare spending: 67.0% (2nd lowest)
> State welfare spending from federal funds: 96.7% (the highest)
> Population 65 and over: 15.0% (14th lowest)
> State tax collections per capita: $2,683 (25th lowest)
[in-text-ad]

39. Kansas
> Total 2015 state welfare spending: $1,368 per capita ($3.98 billion)
> Medical payments as share of state welfare spending: 90.3% (18th highest)
> State welfare spending from federal funds: 58.7% (23rd lowest)
> Population 65 and over: 15.1% (20th lowest)
> State tax collections per capita: $2,708 (25th highest)

38. Missouri
> Total 2015 state welfare spending: $1,380 per capita ($8.4 billion)
> Medical payments as share of state welfare spending: 92.0% (7th highest)
> State welfare spending from federal funds: 71.4% (12th highest)
> Population 65 and over: 16.0% (22nd highest)
> State tax collections per capita: $1,965 (7th lowest)

37. Alabama
> Total 2015 state welfare spending: $1,382 per capita ($6.72 billion)
> Medical payments as share of state welfare spending: 91.0% (11th highest)
> State welfare spending from federal funds: 75.0% (9th highest)
> Population 65 and over: 16.1% (20th highest)
> State tax collections per capita: $2,008 (10th lowest)
[in-text-ad-2]

36. Idaho
> Total 2015 state welfare spending: $1,392 per capita ($2.3 billion)
> Medical payments as share of state welfare spending: 88.2% (25th highest)
> State welfare spending from federal funds: 56.7% (18th lowest)
> Population 65 and over: 15.2% (21st lowest)
> State tax collections per capita: $2,402 (15th lowest)

35. New Hampshire
> Total 2015 state welfare spending: $1,451 per capita ($1.93 billion)
> Medical payments as share of state welfare spending: 81.9% (8th lowest)
> State welfare spending from federal funds: 39.4% (the lowest)
> Population 65 and over: 17.0% (9th highest)
> State tax collections per capita: $1,870 (3rd lowest)
[in-text-ad]

34. Montana
> Total 2015 state welfare spending: $1,460 per capita ($1.51 billion)
> Medical payments as share of state welfare spending: 82.1% (10th lowest)
> State welfare spending from federal funds: 66.3% (20th highest)
> Population 65 and over: 17.6% (5th highest)
> State tax collections per capita: $2,753 (23rd highest)

33. Arizona
> Total 2015 state welfare spending: $1,477 per capita ($10.08 billion)
> Medical payments as share of state welfare spending: 84.5% (18th lowest)
> State welfare spending from federal funds: 83.1% (5th highest)
> Population 65 and over: 16.9% (10th highest)
> State tax collections per capita: $2,062 (11th lowest)

32. South Carolina
> Total 2015 state welfare spending: $1,493 per capita ($7.31 billion)
> Medical payments as share of state welfare spending: 90.7% (15th highest)
> State welfare spending from federal funds: 63.2% (24th highest)
> Population 65 and over: 16.7% (12th highest)
> State tax collections per capita: $1,967 (8th lowest)
[in-text-ad-2]

31. Ohio
> Total 2015 state welfare spending: $1,518 per capita ($17.63 billion)
> Medical payments as share of state welfare spending: 89.8% (20th highest)
> State welfare spending from federal funds: 71.1% (13th highest)
> Population 65 and over: 16.2% (17th highest)
> State tax collections per capita: $2,437 (17th lowest)

30. Michigan
> Total 2015 state welfare spending: $1,542 per capita ($15.3 billion)
> Medical payments as share of state welfare spending: 85.3% (20th lowest)
> State welfare spending from federal funds: 76.2% (8th highest)
> Population 65 and over: 16.2% (18th highest)
> State tax collections per capita: $2,717 (24th highest)
[in-text-ad]

29. Illinois
> Total 2015 state welfare spending: $1,580 per capita ($20.31 billion)
> Medical payments as share of state welfare spending: 83.4% (14th lowest)
> State welfare spending from federal funds: 51.2% (8th lowest)
> Population 65 and over: 14.6% (11th lowest)
> State tax collections per capita: $3,174 (13th highest)

28. Tennessee
> Total 2015 state welfare spending: $1,599 per capita ($10.55 billion)
> Medical payments as share of state welfare spending: 85.3% (21st lowest)
> State welfare spending from federal funds: 68.1% (15th highest)
> Population 65 and over: 15.7% (25th highest)
> State tax collections per capita: $1,924 (4th lowest)

27. Washington
> Total 2015 state welfare spending: $1,601 per capita ($11.48 billion)
> Medical payments as share of state welfare spending: 87.2% (24th lowest)
> State welfare spending from federal funds: 51.9% (11th lowest)
> Population 65 and over: 14.8% (12th lowest)
> State tax collections per capita: $2,879 (21st highest)
[in-text-ad-2]

26. Oklahoma
> Total 2015 state welfare spending: $1,651 per capita ($6.46 billion)
> Medical payments as share of state welfare spending: 83.7% (16th lowest)
> State welfare spending from federal funds: 59.4% (24th lowest)
> Population 65 and over: 15.0% (16th lowest)
> State tax collections per capita: $2,405 (16th lowest)

25. Wisconsin
> Total 2015 state welfare spending: $1,725 per capita ($9.96 billion)
> Medical payments as share of state welfare spending: 88.0% (25th lowest)
> State welfare spending from federal funds: 53.7% (14th lowest)
> Population 65 and over: 16.0% (21st highest)
> State tax collections per capita: $2,949 (18th highest)
[in-text-ad]

24. Indiana
> Total 2015 state welfare spending: $1,730 per capita ($11.45 billion)
> Medical payments as share of state welfare spending: 86.1% (23rd lowest)
> State welfare spending from federal funds: 66.9% (18th highest)
> Population 65 and over: 15.0% (15th lowest)
> State tax collections per capita: $2,628 (23rd lowest)

23. Hawaii
> Total 2015 state welfare spending: $1,732 per capita ($2.48 billion)
> Medical payments as share of state welfare spending: 83.8% (17th lowest)
> State welfare spending from federal funds: 50.9% (7th lowest)
> Population 65 and over: 17.0% (8th highest)
> State tax collections per capita: $4,530 (3rd highest)
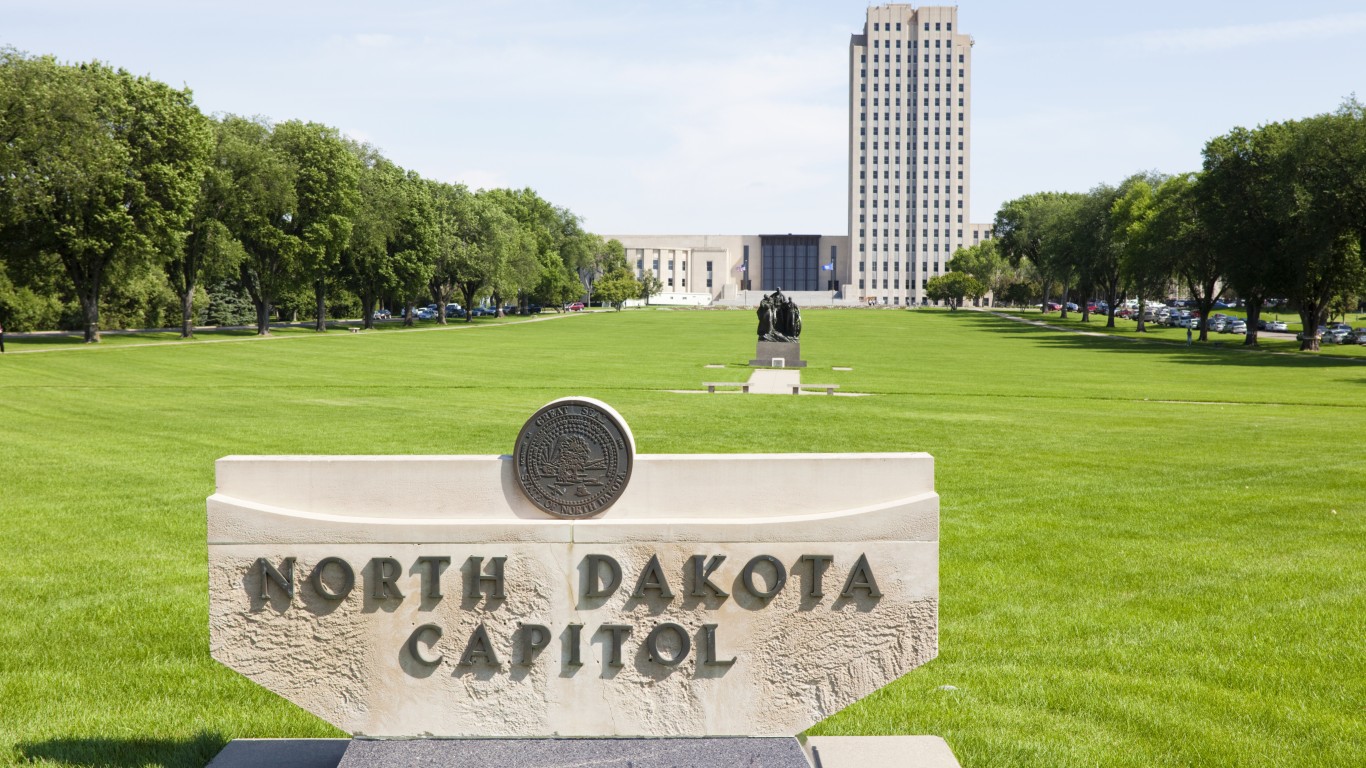
22. North Dakota
> Total 2015 state welfare spending: $1,740 per capita ($1.32 billion)
> Medical payments as share of state welfare spending: 82.0% (9th lowest)
> State welfare spending from federal funds: 60.2% (25th lowest)
> Population 65 and over: 14.5% (8th lowest)
> State tax collections per capita: $7,583 (the highest)
[in-text-ad-2]

21. Louisiana
> Total 2015 state welfare spending: $1,755 per capita ($8.2 billion)
> Medical payments as share of state welfare spending: 91.0% (12th highest)
> State welfare spending from federal funds: 86.5% (3rd highest)
> Population 65 and over: 14.4% (7th lowest)
> State tax collections per capita: $2,076 (12th lowest)

20. Pennsylvania
> Total 2015 state welfare spending: $1,785 per capita ($22.86 billion)
> Medical payments as share of state welfare spending: 88.3% (23rd highest)
> State welfare spending from federal funds: 58.6% (22nd lowest)
> Population 65 and over: 17.4% (7th highest)
> State tax collections per capita: $2,821 (22nd highest)
[in-text-ad]

19. New Jersey
> Total 2015 state welfare spending: $1,818 per capita ($16.28 billion)
> Medical payments as share of state welfare spending: 90.9% (13th highest)
> State welfare spending from federal funds: 46.9% (3rd lowest)
> Population 65 and over: 15.3% (22nd lowest)
> State tax collections per capita: $3,524 (11th highest)

18. Mississippi
> Total 2015 state welfare spending: $1,945 per capita ($5.82 billion)
> Medical payments as share of state welfare spending: 91.4% (9th highest)
> State welfare spending from federal funds: 88.3% (2nd highest)
> Population 65 and over: 15.0% (19th lowest)
> State tax collections per capita: $2,641 (24th lowest)

17. Iowa
> Total 2015 state welfare spending: $1,952 per capita ($6.1 billion)
> Medical payments as share of state welfare spending: 88.9% (22nd highest)
> State welfare spending from federal funds: 67.1% (17th highest)
> Population 65 and over: 16.4% (15th highest)
> State tax collections per capita: $2,942 (19th highest)
[in-text-ad-2]

16. Maryland
> Total 2015 state welfare spending: $2,018 per capita ($12.12 billion)
> Medical payments as share of state welfare spending: 80.2% (6th lowest)
> State welfare spending from federal funds: 51.8% (9th lowest)
> Population 65 and over: 14.6% (9th lowest)
> State tax collections per capita: $3,330 (12th highest)

15. Connecticut
> Total 2015 state welfare spending: $2,038 per capita ($7.32 billion)
> Medical payments as share of state welfare spending: 82.9% (12th lowest)
> State welfare spending from federal funds: 57.1% (20th lowest)
> Population 65 and over: 16.1% (19th highest)
> State tax collections per capita: $4,518 (4th highest)
[in-text-ad]

14. California
> Total 2015 state welfare spending: $2,175 per capita ($85.12 billion)
> Medical payments as share of state welfare spending: 93.5% (4th highest)
> State welfare spending from federal funds: 55.0% (16th lowest)
> Population 65 and over: 13.6% (6th lowest)
> State tax collections per capita: $3,862 (9th highest)

13. Maine
> Total 2015 state welfare spending: $2,184 per capita ($2.9 billion)
> Medical payments as share of state welfare spending: 81.7% (7th lowest)
> State welfare spending from federal funds: 64.1% (22nd highest)
> Population 65 and over: 19.3% (2nd highest)
> State tax collections per capita: $3,057 (15th highest)

12. Arkansas
> Total 2015 state welfare spending: $2,230 per capita ($6.64 billion)
> Medical payments as share of state welfare spending: 90.8% (14th highest)
> State welfare spending from federal funds: 63.0% (25th highest)
> Population 65 and over: 16.3% (16th highest)
> State tax collections per capita: $3,086 (14th highest)
[in-text-ad-2]

11. Minnesota
> Total 2015 state welfare spending: $2,271 per capita ($12.47 billion)
> Medical payments as share of state welfare spending: 89.4% (21st highest)
> State welfare spending from federal funds: 52.0% (12th lowest)
> Population 65 and over: 15.0% (18th lowest)
> State tax collections per capita: $4,452 (5th highest)

10. Oregon
> Total 2015 state welfare spending: $2,313 per capita ($9.32 billion)
> Medical payments as share of state welfare spending: 82.9% (13th lowest)
> State welfare spending from federal funds: 81.4% (6th highest)
> Population 65 and over: 16.8% (11th highest)
> State tax collections per capita: $2,625 (22nd lowest)
[in-text-ad]

9. West Virginia
> Total 2015 state welfare spending: $2,372 per capita ($4.37 billion)
> Medical payments as share of state welfare spending: 85.9% (22nd lowest)
> State welfare spending from federal funds: 73.7% (11th highest)
> Population 65 and over: 18.8% (3rd highest)
> State tax collections per capita: $3,018 (17th highest)

8. Kentucky
> Total 2015 state welfare spending: $2,441 per capita ($10.8 billion)
> Medical payments as share of state welfare spending: 90.2% (19th highest)
> State welfare spending from federal funds: 67.2% (16th highest)
> Population 65 and over: 15.5% (25th lowest)
> State tax collections per capita: $2,621 (21st lowest)

7. Delaware
> Total 2015 state welfare spending: $2,446 per capita ($2.31 billion)
> Medical payments as share of state welfare spending: 83.4% (15th lowest)
> State welfare spending from federal funds: 56.8% (19th lowest)
> Population 65 and over: 17.5% (6th highest)
> State tax collections per capita: $3,715 (10th highest)
[in-text-ad-2]

6. Rhode Island
> Total 2015 state welfare spending: $2,467 per capita ($2.61 billion)
> Medical payments as share of state welfare spending: 92.3% (6th highest)
> State welfare spending from federal funds: 50.5% (6th lowest)
> Population 65 and over: 16.5% (13th highest)
> State tax collections per capita: $3,026 (16th highest)

5. New York
> Total 2015 state welfare spending: $2,541 per capita ($50.31 billion)
> Medical payments as share of state welfare spending: 98.6% (the highest)
> State welfare spending from federal funds: 66.5% (19th highest)
> Population 65 and over: 15.3% (23rd lowest)
> State tax collections per capita: $3,951 (8th highest)
[in-text-ad]

4. New Mexico
> Total 2015 state welfare spending: $2,690 per capita ($5.61 billion)
> Medical payments as share of state welfare spending: 93.8% (3rd highest)
> State welfare spending from federal funds: 85.1% (4th highest)
> Population 65 and over: 16.4% (14th highest)
> State tax collections per capita: $2,882 (20th highest)

3. Alaska
> Total 2015 state welfare spending: $2,720 per capita ($2.01 billion)
> Medical payments as share of state welfare spending: 77.2% (3rd lowest)
> State welfare spending from federal funds: 58.4% (21st lowest)
> Population 65 and over: 10.2% (the lowest)
> State tax collections per capita: $1,170 (the lowest)

2. Massachusetts
> Total 2015 state welfare spending: $2,721 per capita ($18.49 billion)
> Medical payments as share of state welfare spending: 92.6% (5th highest)
> State welfare spending from federal funds: 50.2% (5th lowest)
> Population 65 and over: 15.8% (24th highest)
> State tax collections per capita: $3,976 (7th highest)
[in-text-ad-2]

1. Vermont
> Total 2015 state welfare spending: $2,761 per capita ($1.73 billion)
> Medical payments as share of state welfare spending: 82.5% (11th lowest)
> State welfare spending from federal funds: 64.7% (21st highest)
> Population 65 and over: 18.2% (4th highest)
> State tax collections per capita: $4,861 (2nd highest)
Detailed Findings
In an interview with 24/7 Wall St., Tracy Gordon, senior fellow at the nonpartisan think tank Urban Brookings Tax Policy Center, explained how welfare generally works in the United States. While states are largely responsible for outlays to welfare programs, most public assistance programs are actually mandated and administered by the federal government, which distributes funds to states for the majority of welfare program spending.
About 62% of total state welfare spending comes from federal funding. Federal funding of overall state welfare spending ranges from less than 50% in wealthier states like New Jersey and New Hampshire, to well above 80% in poorer states like Mississippi and Louisiana.
Other factors largely contributing to the substantial differences between welfare spending among states are differences in eligibility and in the maximum amounts for the different programs. “Some states have greater demographic needs,” Gordon said. “There are some states that just start out with more people who could potentially qualify for services, and sometimes [more residents] qualify for services because the rules are federal. And beyond that, some states have chosen to go farther and define more generous eligibility for services.”
Because Medicaid is such a large component of total state welfare spending, states with large shares of older and disabled residents also tend to spend more on welfare. Over two-thirds of total Medicaid spending goes to the elderly and disabled. Of the 20 states with the highest welfare spending, 15 have above-average shares of residents who are 65 or older.
Methodology
24/7 Wall St. reviewed per-capita state government welfare expenditure figures from the U.S. Census Bureau’s 2015 State and Local Government Expenditures data, which includes data from its Surveys of State Government Finances, Public Employment & Payroll, and the Annual Estimates of the Resident Population for the United States Regions, States, and Puerto Rico. State tax collections are from the Tax Foundation’s Facts and Figures report. The report, which was released in 2018, includes collections for the 2015 fiscal year. Data on the share of state welfare spending from federal sources came from the 2012 Census of Governments: State and Local Finances.
Sponsored: Find a Qualified Financial Advisor
Finding a qualified financial advisor doesn’t have to be hard. SmartAsset’s free tool matches you with up to 3 fiduciary financial advisors in your area in 5 minutes. Each advisor has been vetted by SmartAsset and is held to a fiduciary standard to act in your best interests. If you’re ready to be matched with local advisors that can help you achieve your financial goals, get started now.
Thank you for reading! Have some feedback for us?
Contact the 24/7 Wall St. editorial team.

