According to the U.S. Department of Housing and Urban Development, families that pay more than 30% of their incomes on housing are considered cost burdened and may have difficulty affording rent as well as other necessities such as food, clothing, transportation, and medical care. While the poorest families are the most likely to be housing-cost burdened, skyrocketing home prices in U.S. metropolitan areas have caused the nation’s housing affordability crisis to spread to a large number of middle class Americans.
While the housing cost burden for low-income households is often offset through housing subsidies, there are few forces protecting middle-income households from the rising cost of real estate. Fast-growing cities with high construction costs and low housing inventories have experienced some of the sharpest spikes in home prices over the past several decades, and today these cities have some of the largest shares of cost-burdened middle-class households.
To determine the cities where the middle class can no longer afford a home, 24/7 Wall St. reviewed the share of households earning $45,000 to $74,999 annually that spend at least 30% of their incomes on housing in the 100 largest U.S. metropolitan areas. Data came from “The State of the Nation’s Housing 2018” report of the Joint Center for Housing Studies of Harvard University. There are 20 metro areas in which more than 30% of households in the income bracket spend at least 30% of their incomes on housing.
Definitions of the middle class vary by housing organization and geography. Nationwide, the middle 20% of U.S. households earn between $45,325 and $72,384, roughly in line with the $45,000-$74,999 breakout provided by the JCHS. While the incomes earned by the middle class of earners varies by city to city, the $45,000-$74,999 range was used throughout this analysis as an approximation of the American middle class.
Click here to see the cities where the middle class can no longer afford a home.
Click here to see our detailed findings and methodology.

Source: Thinkstock
20. Stockton-Lodi, CA
> Cost-burdened middle-class households: 30.2%
> Median single-family home value: $347,675
> Median household income: $59,518
> Homeownership rate: 54.1%
Over the past two decades, rising home prices in the Stockton-Lodi metro area have led to increased housing cost burdens for the middle class. The median home value in Stockton rose by 28.2%, from $271,104 in 2000 to $347,675 in 2017, a larger increase than in the majority of U.S. metro areas. Today, some 30.2% of households earning between $45,000 and $74,999 — the middle income quintile nationwide — in the metro area spend at least 30% of their incomes on housing, more than the 22.0% of households in this income bracket nationwide and one of the largest shares of any U.S. metro area.
[in-text-ad]

Source: Thinkstock
19. Austin-Round Rock, TX
> Cost-burdened middle-class households: 30.7%
> Median single-family home value: $287,325
> Median household income: $71,000
> Homeownership rate: 57.6%
Austin-Round Rock is one of 20 major metro areas where more than 30% of middle-income households — those earning $45,000 to $74,999 annually — are housing-cost burdened. Unlike the vast majority of U.S. metro areas, housing costs are higher today in Austin than they were 10 years ago. Nationwide, the cost of a monthly mortgage payment on a typical home is 18.1% lower today than it was a decade ago. Meanwhile, in Austin, the median monthly mortgage payment is 14.4% higher than it was 10 years ago.
As is the case nationwide, renters in Austin are more likely to struggle to afford housing than homeowners. Some 47.1% of renters across all income levels in Austin are housing-cost burdened as of 2016, compared to 22.2% of homeowners.
 24/7 Wall St.
Source: Thinkstock
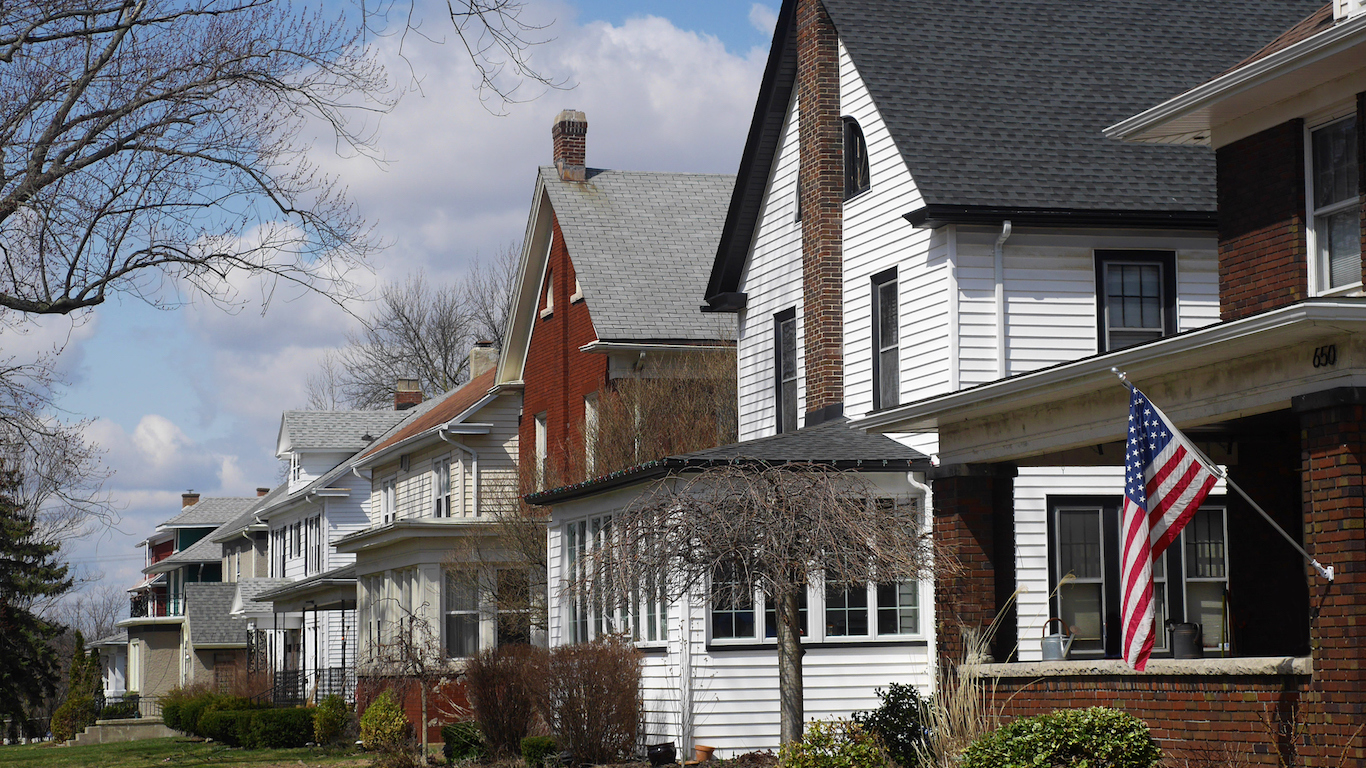
18. Baltimore-Columbia-Towson, MD
> Cost-burdened middle-class households: 33.7%
> Median single-family home value: $258,343
> Median household income: $76,788
> Homeownership rate: 65.3%
Just over one in every three households with annual earnings between $45,000 and $74,999 in the Baltimore metro area are housing-cost burdened. Some 6.3% of households in the same income range are severely burdened — spending over half of their income on housing. For reference, 3.9% of middle-class households nationwide spend over half of their income on housing. Property values are climbing rapidly in the Baltimore metro area. The median home price was 40% higher at the end of 2017 than it was at the end of 2000, a greater increase than in the vast majority of U.S. metro areas.
While Baltimore suffers from an apparent shortage of middle-market housing options, there is an even more limited supply of affordable housing for low-income residents. Some 57.5% of metro area households earning between $30,000 and $44,999 are housing-cost burdened, well above the 42.6% comparable share nationwide.
Source: Thinkstock
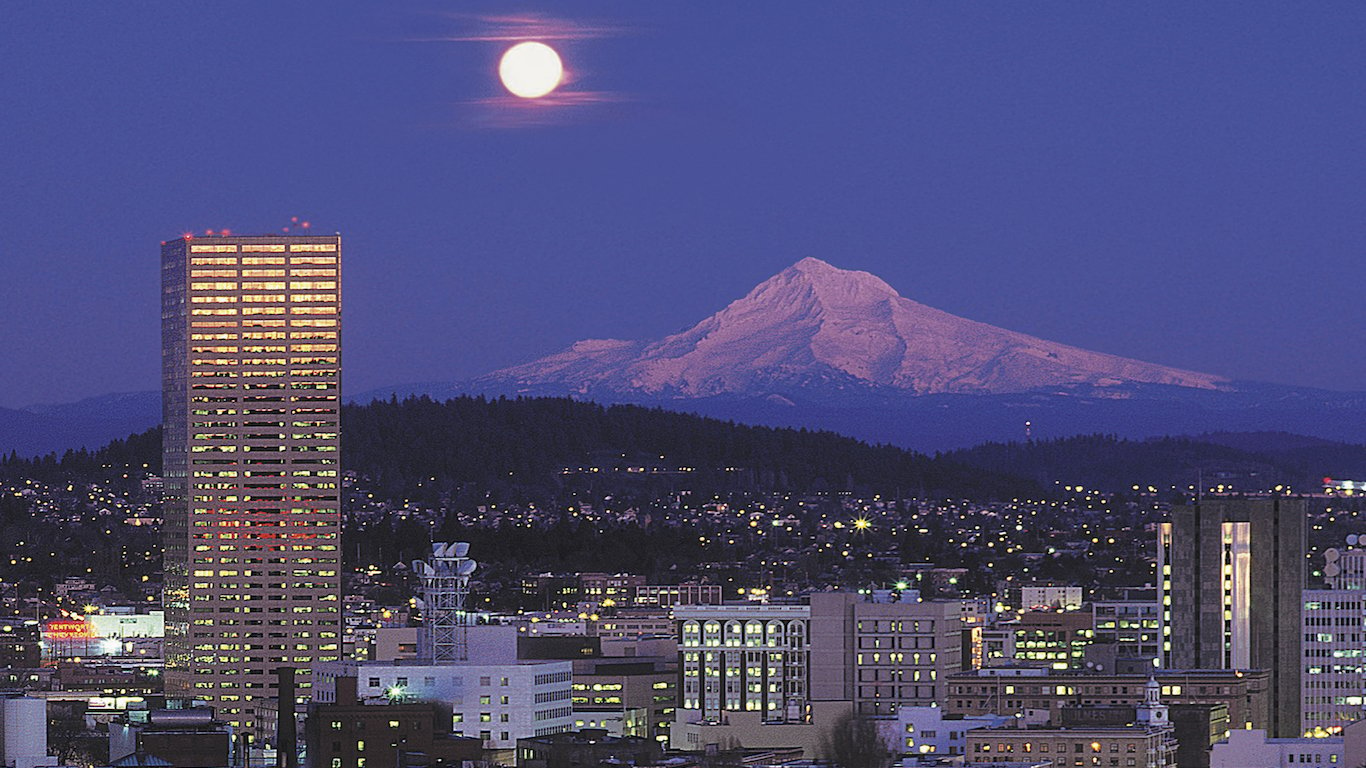
17. Portland-Vancouver-Hillsboro, OR-WA
> Cost-burdened middle-class households: 33.9%
> Median single-family home value: $379,891
> Median household income: $68,676
> Homeownership rate: 61.7%
Rapid population growth in the Portland-Vancouver-HIllsboro metro area over the past several years has led to higher home prices, which made the city far less affordable for a number of middle class residents. The population of Portland grew by 7.2% from 2011 to 2016, nearly twice the 3.7% national growth rate for the same period. The median home value in the metro rose 65.6% from $229,404 in 2000 to $379,891 in 2017, the largest percentage increase of any U.S. city.
Today, some 33.9% of households earning between $45,000 and $74,999 a year in the Portland metro area spend at least 30% of their incomes on housing, far more than the 22.0% of middle-income households nationwide who are housing-cost burdened and one of the largest shares in the country.
[in-text-ad-2]

Source: Thinkstock
16. Sacramento–Roseville–Arden-Arcade, CA
> Cost-burdened middle-class households: 33.9%
> Median single-family home value: $391,391
> Median household income: $64,052
> Homeownership rate: 59.1%
Housing costs have climbed far faster than incomes in the Sacramento metro area in recent years. Half a decade ago the price of a typical area home was 3.1 times greater than the area’s median income. Today a typical home in Sacramento costs 5.2 times the median income, nearly the highest price-income ratio of any metro area. Partially as a result, some 33.9% of households earning between $45,000 and $74,999 are burdened by housing costs, well above the 22.0% of middle-income households nationwide. Meanwhile, just 7.4% of households earning at least $75,000 in Sacramento are housing-cost burdened, only slightly more than the comparable 6.2% national share.
Source: Thinkstock
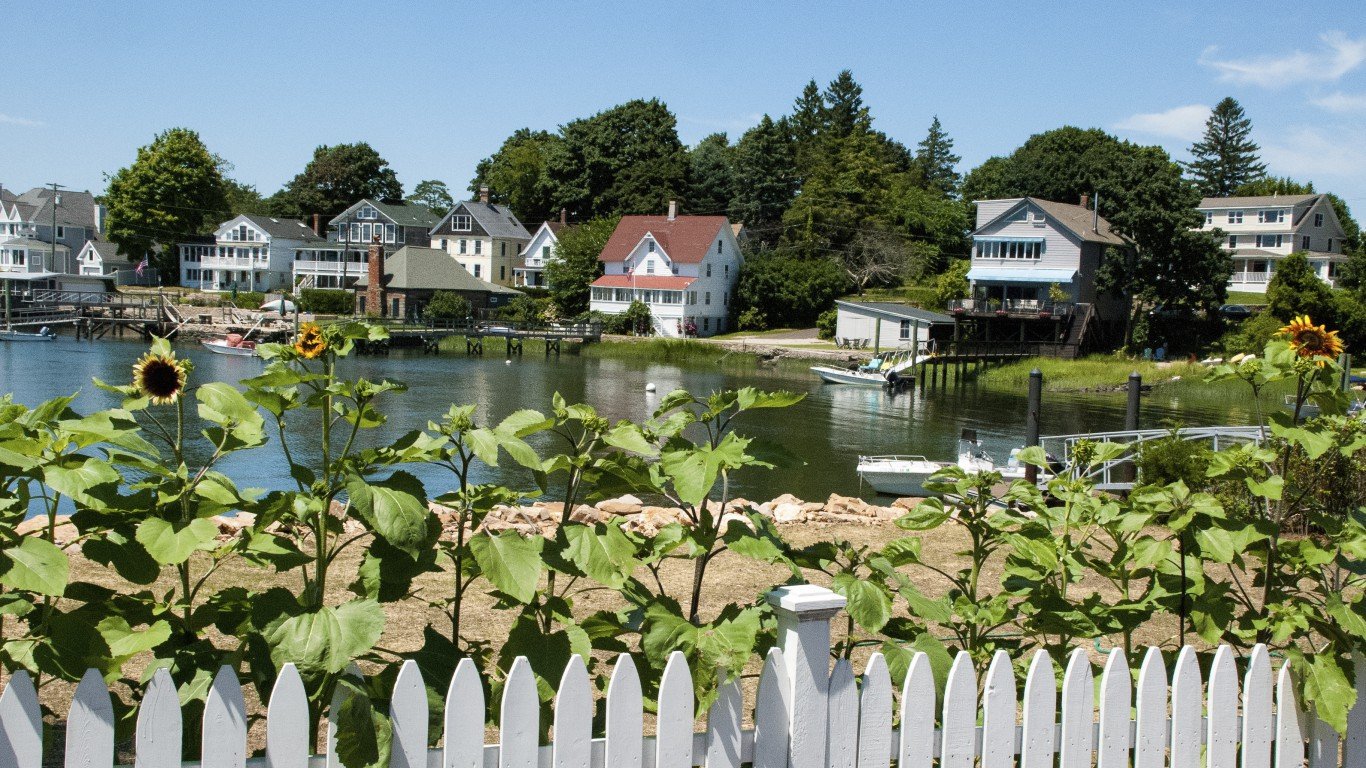
15. New Haven-Milford, CT
> Cost-burdened middle-class households: 34.2%
> Median single-family home value: $201,182
> Median household income: $66,176
> Homeownership rate: 61.2%
New Haven is one of several metro areas in Connecticut in which home prices remained essentially flat throughout 2017. Additionally, the median home price in the city was about 30.3% lower as of the end of 2017 from its peak in the 2000s. The city also has some of the largest housing inventories in the country. The drop in home prices and the large share of homes on the market are due in part to population decline. The metro area’s population fell by 0.5% from 2011 to 2016, even as the U.S. population grew by 3.7%.
Despite the relatively favorable conditions for buyers, housing costs remain a considerable burden for 34.2% of middle-income households. By comparison, 22.0% of middle-income households nationwide are housing-cost burdened. Low-income residents are even more likely to be affected. Some 61.8% of households earning between $30,000 and $44,999 a year are considered housing-cost burdened.
[in-text-ad]

Source: Thinkstock
14. Denver-Aurora-Lakewood, CO
> Cost-burdened middle-class households: 34.8%
> Median single-family home value: $385,017
> Median household income: $71,926
> Homeownership rate: 63.8%
The population of the Denver-Aurora-Lakewood metro area increased by 9.7% from 2011 to 2016, nearly three times the national population growth of 3.7% during that time. The increased demand for housing in Denver, as well as high construction costs, have created a housing crunch that has been particularly hard on middle-income households. According to real estate research firm Metrostudy, just 1% of listed homes cost less than $300,000, which has forced many middle class families to purchase a home outside of their budget range. The size of the average mortgage payment in Denver has increased by 20.5% over the past 10 years, the largest increase of any U.S. city.
Some 34.8% of households earning between $45,000 and $74,999 a year spend at least 30% of their incomes on housing, one of the largest shares nationwide.
 24/7 Wall St.
Source: Thinkstock
13. Miami-Fort Lauderdale-West Palm Beach, FL
> Cost-burdened middle-class households: 38.6%
> Median single-family home value: $263,245
> Median household income: $51,362
> Homeownership rate: 58.3%
The majority of homes in the Miami metro area are worth over a quarter-million dollars. As a result, many middle- and low-income area residents spend more than they can afford on housing. Some 38.6% of area households in the $45,000 to $74,999 income range and 66.1% of those in the $30,000 to $44,999 income range are housing-cost burdened. Renters in the Miami metro area are not spared. Some 61.2% of renters across all income brackets spend at least 30% of their incomes on housing, the highest rental housing-cost burden rate of any metro area in the country.
Housing costs are outpacing income growth in the Miami area due in part to rapid population growth. The metro area population grew by 7.0% from 2011 to 2016, more than the national population growth of 3.7% over the same period.

Source: Thinkstock
12. Seattle-Tacoma-Bellevue, WA
> Cost-burdened middle-class households: 39.4%
> Median single-family home value: $472,907
> Median household income: $78,612
> Homeownership rate: 59.5%
Many cities in which the middle class struggles to afford homes are growing rapidly — and the Seattle metro area is no exception. The metro area’s population grew by 8.5% from 2011 to 2016, more than double the 3.7% national population growth over that time. Housing costs climbed faster than incomes over the same period. Currently, 39.4% of middle-class households in the area spend at least 30% of their incomes on housing.
This overspending on housing is largely due to a lack of affordable options. The typical home in the Seattle-Tacoma-Bellevue metro area is worth $472,907, the sixth highest median home value of the 100 largest metro areas in the country.
[in-text-ad-2]

Source: Thinkstock
11. Riverside-San Bernardino-Ontario, CA
> Cost-burdened middle-class households: 42.3%
> Median single-family home value: $349,689
> Median household income: $58,236
> Homeownership rate: 61.1%
California has some of the most expensive real estate in the country, and Riverside-San Bernardino-Ontario is one of eight metro areas in the state where a large share of middle-income households struggle to afford their homes. Of all households earning between $45,000 and $74,999, 35.3% spend between 30% and 50% of their income on housing, and 7.0% spend over half of their income on housing.
Home values are climbing rapidly in the metro area. The median monthly mortgage payment in 2017 was $2,201, up 77.6% from five years prior. Nationwide, the median mortgage payment climbed by 41.4% over the same period. High housing costs are also affecting renters. Some 56% in of renters in Riverside are housing-cost burdened — the majority of whom spent over half of their income on rent.

Source: Thinkstock
10. Boston-Cambridge-Newton, MA-NH
> Cost-burdened middle-class households: 44.4%
> Median single-family home value: $442,151
> Median household income: $82,380
> Homeownership rate: 61.3%
In Boston, the fast pace of development of affordable housing units for low-income families and the boom in the construction of luxury units for the super wealthy have many middle-income families to purchase homes outside of their ideal budget range. According to statistics compiled by the Boston Department of Neighborhood Development, some 69% of housing units built in the city between 2011 and 2014 were high-end, 19% were affordable, and just 12% were in the middle.
Today, Boston is one of 14 U.S. metro areas in which the middle class is squeezed tighter on housing costs than the population as a whole. Some 44.4% of households earning between $45,000 and $74,999 a year spend at least 30% of their incomes on housing, more than the 35.1% share of cost burdened households across all income brackets and one of the largest shares of any U.S. metro.
[in-text-ad]
Source: Thinkstock
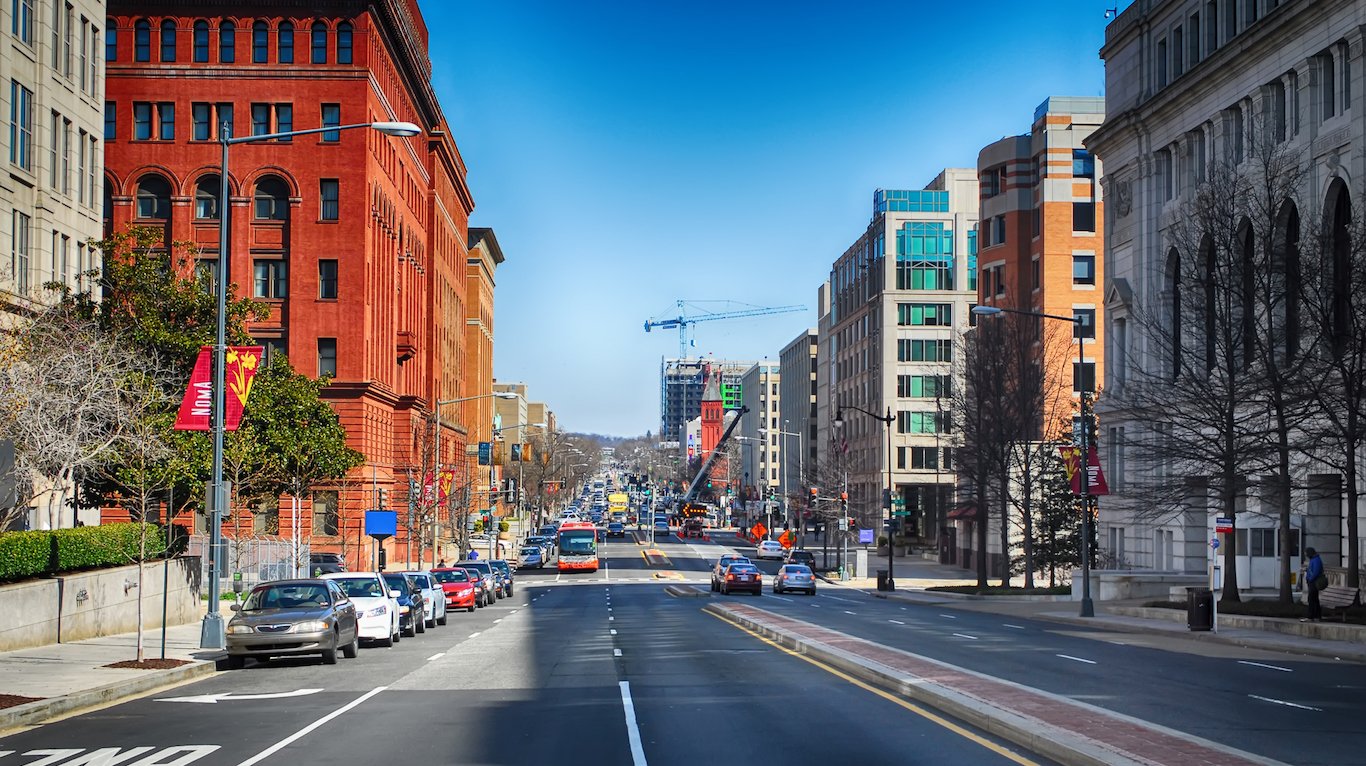
9. Washington-Arlington-Alexandria, DC-VA-MD-WV
> Cost-burdened middle-class households: 47.5%
> Median single-family home value: $393,206
> Median household income: $95,843
> Homeownership rate: 62.4%
From 2011 to 2016, the population of the Washington-Arlington-Alexandria metro area increased by 7.5%, more than double the national population growth rate of 3.7% over that time. Like in many of the country’s major cities, the influx of new residents created demand for high-end, upper-market housing options, ultimately reducing the number of housing options available to the city’s low- and middle-income families.
The scarcity of middle-market housing options has forced many middle-income families to spend more than the recommended share of their incomes on rent or a mortgage. Some 47.5% of households earning between $45,000 and $74,999 a year spend at least 30% of their incomes on housing, more than twice the 22.0% national share of cost-burdened middle class households.
Source: Thinkstock
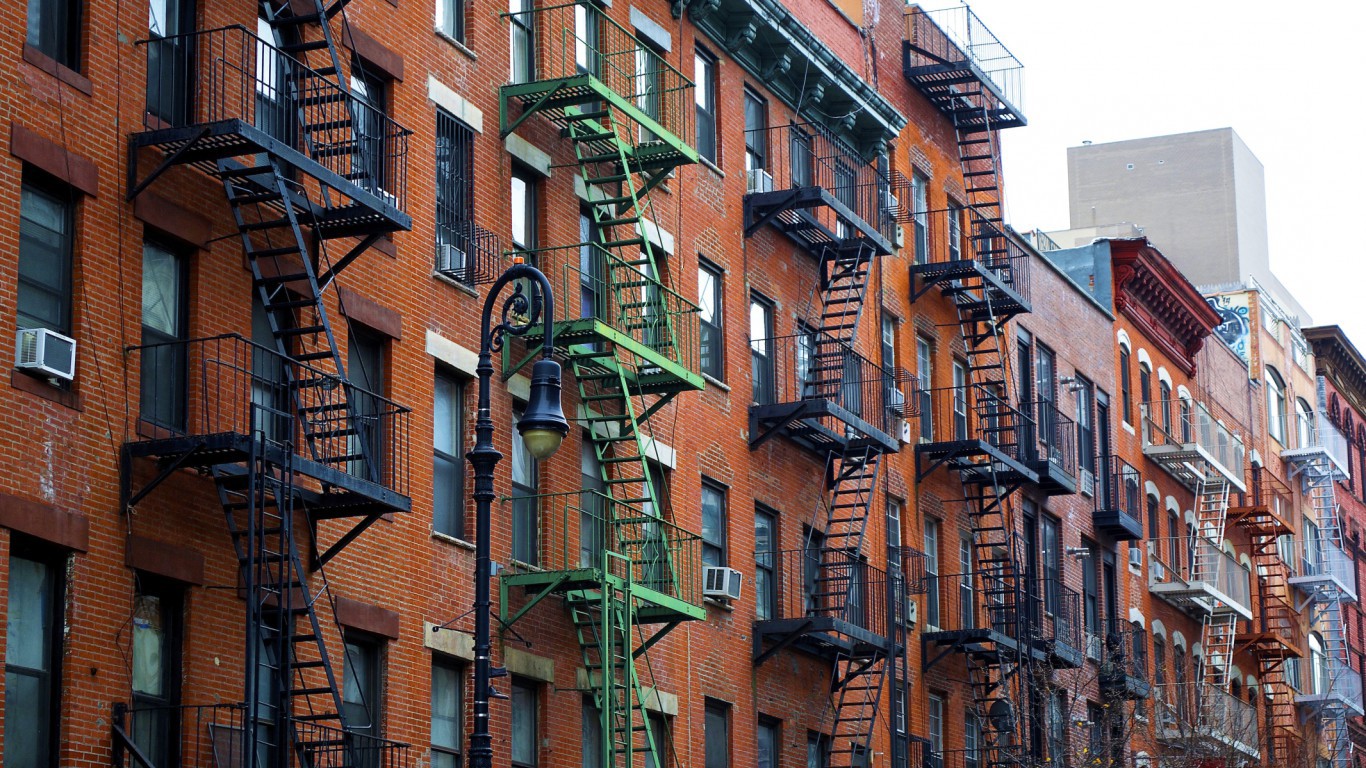
8. New York-Newark-Jersey City, NY-NJ-PA
> Cost-burdened middle-class households: 47.9%
> Median single-family home value: $420,083
> Median household income: $71,897
> Homeownership rate: 51.0%
In the New York metro area, nearly 48% of households earning between $45,000 and $74,999 annually spend at least 30% of their incomes on housing, more than the 43% share of cost-burdened households in the area across all income levels and more than twice the 22% national share of the middle income bracket.
The squeezing of the middle class is of major concern for a large number of New Yorkers. According to a recent survey conducted by nonprofits Public Agenda and WNYC Radio, 65% of New York metro area residents believe the income gap between the rich and poor is a somewhat serious or very serious problem.

Source: Thinkstock
7. Los Angeles-Long Beach-Anaheim, CA
> Cost-burdened middle-class households: 50.8%
> Median single-family home value: $631,007
> Median household income: $65,950
> Homeownership rate: 47.4%
One factor contributing to climbing home prices in Los Angeles is the slow pace of new home construction. The average time to issue a building permit in Los Angeles is longer than eight months, compared to four and a half months in the typical U.S. metro area. New home construction in Los Angeles from the period 1980 to 2010 was slower than new home construction in the United States as a whole. As a result, the supply of housing in Los Angeles is outstripped by demand. This has led to high home values and has priced many of the city’s middle class residents out of the housing market.
Just over half of households earning between $45,000 and $74,999 in the Los Angeles metro area spend at least 30% of their incomes on housing.
[in-text-ad-2]
Source: barbsimages / Shutterstock.com
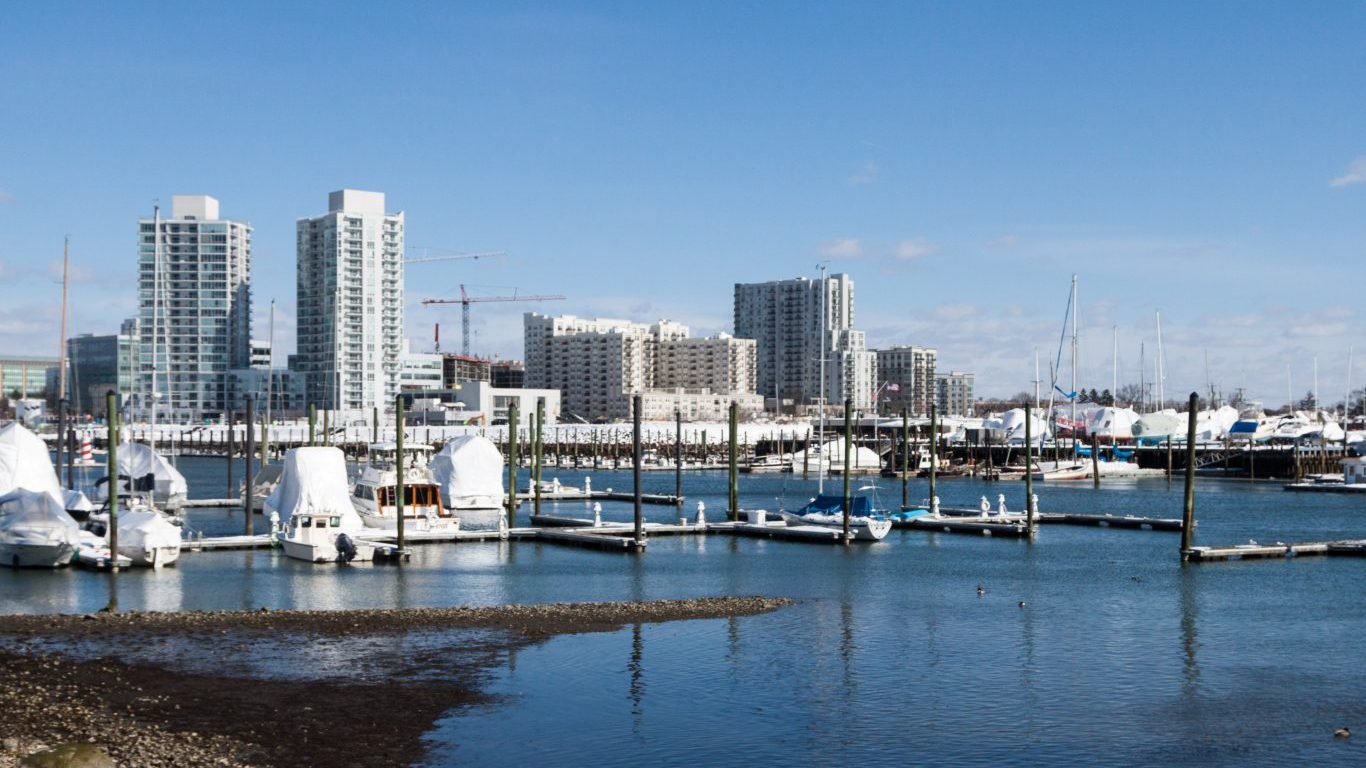
6. Bridgeport-Stamford-Norwalk, CT
> Cost-burdened middle-class households: 51.0%
> Median single-family home value: $323,589
> Median household income: $90,123
> Homeownership rate: 65.3%
While the median household income in the Bridgeport-Stamford-Norwalk metro area of $90,123 a year is the fourth highest of any U.S. metro area, income in the city is also more unevenly distributed than in nearly any other part of the country. The wealthiest 5% of households in Bridgeport earn 28.3% of all income in the city, the largest share of the 100 largest metro areas.
Income inequality has been shown to affect rent burden. Today, some 51.0% of households earning between $45,000 and $74,999 in Bridgeport spend at least 30% of their incomes on housing, the sixth largest share of cost-burdened middle-class households of all metro areas.

Source: Thinkstock
5. Urban Honolulu, HI
> Cost-burdened middle-class households: 51.9%
> Median single-family home value: N/A
> Median household income: $80,513
> Homeownership rate: 54.1%
Urban Honolulu is one of seven metro areas nationwide where over half of all middle-income households are housing-cost burdened. Despite a high share of housing cost burdened middle-class families, home prices are climbing slower than average in the city. The median monthly mortgage payment in Honolulu was $4,946 in in 2017, up just 20.9% from half a decade ago. Nationwide, the median monthly mortgage payment was 41.4% higher in 2017 than it was five years ago.
The high housing cost burden rate in Honolulu is driven in large part by the city’s rental market, which heavily targets high-income renters. The city has among the highest vacancy rates among Class A rentals, which include new and high quality rentals, of any American city. Additionally, 53.4% of renters in the metro area were cost burdened in 2016 — the majority of whom spent over half of their incomes on rent.
[in-text-ad]

Source: Thinkstock
4. San Diego-Carlsbad, CA
> Cost-burdened middle-class households: 52.2%
> Median single-family home value: $570,533
> Median household income: $70,824
> Homeownership rate: 52.1%
Like much of the California coast, the supply of housing in San Diego is far below the demand for housing. The shortage likely contributes to rising home prices in the metro that force many middle class families to purchase a home outside of their budget range. The median home value in San Diego rose by 62.8% from $350,390 in 2000 to $570,533 in 2017, the second largest increase and now the fifth highest median home value of the 100 largest metro areas. Some 52.2% of households earning between $45,000 and $74,999 a year in San Diego spend at least 30% of their incomes on housing, nearly the largest share of cost burdened middle-class households of any metro area.

Source: Thinkstock
3. Oxnard-Thousand Oaks-Ventura, CA
> Cost-burdened middle-class households: 53.5%
> Median single-family home value: $578,148
> Median household income: $80,135
> Homeownership rate: 62.1%
Middle-income households are more likely to be burdened by housing costs in Oxnard-Thousand Oaks-Ventura than in nearly every other metro area in the country. Part of the reason is the limited supply of modestly priced homes. The majority of single-family houses in the metro area are worth over half a million dollars. Of all middle-income homes in the area, 41.2% spend between 30% and 50% of their incomes on housing, and 12.3% spend over half of their incomes on housing — each more than double the corresponding national shares of 18.1% and 3.9%.
Housing costs are are so high in the area that even higher earners are cost burdened. Nearly 16% of households earning at least $75,000 a year are cost burdened, more than double the 6.2% share of households nationwide in the same income range.

Source: Thinkstock
2. San Jose-Sunnyvale-Santa Clara, CA
> Cost-burdened middle-class households: 54.7%
> Median single-family home value: $1.2 million
> Median household income: $110,040
> Homeownership rate: 56.6%
Rapid income growth among tech sector elites in Silicon Valley has pushed home prices in the San Jose metro higher, forcing lower- and middle-income households to relocate or buy or rent housing far beyond their budget range. The median home value in San Jose rose from $778,356 in 2000 to $1.2 million in 2017, the eighth largest increase and now the highest median home price of the 100 largest U.S. metro areas. Some 54.7% of households earning between $45,000 and $74,999 a year spend at least 30% of their incomes on housing, more than double the 22.0% national share of cost-burdened middle class households and the second largest share of any metro area in the country, after only San Francisco.
[in-text-ad-2]

Source: Thinkstock
1. San Francisco-Oakland-Hayward, CA
> Cost-burdened middle-class households: 55.9%
> Median single-family home value: $909,836
> Median household income: $96,677
> Homeownership rate: 53.6%
Two factors contributing to soaring home prices in San Francisco are the slow pace of new home construction and the scarcity of land available for new housing. The average time to issue a building permit in San Francisco is longer than a year, compared to four and a half months in the typical U.S. metro area. New home construction in San Francisco from the period 1980 to 2010 was slower than the new home construction in the U.S. as a whole. As a result, the supply of housing in San Francisco is outstripped by demand. This has led to high home values and has priced many of the city’s middle class residents out of the market. The typical home in the San Francisco metro area costs $909,836, the second highest median home value of any major metro area. Some 55.9% of households earning between $45,000 and $74,999 spend at least 30% of their incomes on housing, the largest share nationwide.
Detailed Findings
Home values have skyrocketed as a result of population growth in many of the cities with the largest shares of cost-burdened middle-class households. In 14 of the 20 cities where the middle class can no longer afford a home, the population growth from 2011 to 2016 exceeded the national growth of 3.7% over that time. Other factors driving home prices in the cities on this list include high construction costs, low housing inventories, environmental policies, and limited vacant developable land.
Cities with the largest shares of cost-burdened middle-class households are not necessarily the cities with the largest cost burdens across all income groups. In three metro areas on this list — Washington, D.C., Denver, and Baltimore — the share of all households spending at least 30% of their incomes on housing is below the 32.0% national share.
While there are particular factors that reduce the stock of affordable housing for middle-income families, cost burdens are still the greatest for low-income households. Nationwide, some 42.9% of households earning between $30,000 and $44,999 spend at least 30% of their incomes on housing, more than the 22.0% of households earning between $45,000 and $74,999 that are cost burdened and several times the 6.2% share of households earning $75,000 or more that are cost burdened. In all of the 100 largest metro areas, the share of cost burdened households is greater among the lower income brackets.
Methodology
To determine the cities where the middle class can no longer afford a home, 24/7 Wall St. reviewed the share of households earning $45,000 to $74,999 annually that spend at least 30% of their incomes on housing in the 100 largest U.S. metropolitan areas. Data on housing cost burdens came from “The State of the Nation’s Housing 2018” report of the Joint Center for Housing Studies of Harvard University. Data on population, homeownership, median household income, and income distribution by quintile came from the U.S. Census Bureau’s American Community Survey. All data are for the most recent period available.
Take This Retirement Quiz To Get Matched With A Financial Advisor (Sponsored)
Take the quiz below to get matched with a financial advisor today.
Each advisor has been vetted by SmartAsset and is held to a fiduciary standard to act in your best interests.
Here’s how it works:
1. Answer SmartAsset advisor match quiz
2. Review your pre-screened matches at your leisure. Check out the
advisors’ profiles.
3. Speak with advisors at no cost to you. Have an introductory call on the phone or introduction in person and choose whom to work with in the future
Take the retirement quiz right here.
Thank you for reading! Have some feedback for us?
Contact the 24/7 Wall St. editorial team.
Editors' Picks

