States With the Best Retirement Funding
July 27, 2018 by Mike SauterState governments spent close to $39 billion, or about $120 per capita, on retirement funding in 2015. For decades, the funding and distribution of pension funds for state government employees has been a contentious issue. State pension liabilities can strain overall state finances, especially when the economy is already struggling, and even put funding of other programs at risk.
Unlike the vast majority of private sector workers, most state government employees are guaranteed a steady income when they retire. Both the employee and the government contribute to a retirement plan, which is then invested in the market.When the employees retire, they receive a fixed amount over their remaining lifetime — whether the contributions have been enough to cover this amount or not. Meanwhile, just 19% of private sector workers have a similar pension program.
[in-text-ad]
The responsibility of collecting funds and paying the pensions falls to state and local governments, and these governments spend millions each year in regular payments and lump sums to the beneficiaries — the retired employees and their families. About 80% of state spending on retirement programs last year was part of regular payments to former employees. The remainder was in the form of lump sums paid to relatives of employees, as well as expenses.
24/7 Wall St. reviewed per-capita state government retirement funding expenditure figures from the U.S. Census Bureau’s 2015 State and Local Government Expenditures data. States with high pension expenditures tend to have higher tax collections per capita, and the size of the state government workforce does not appear to be a major factor in annual state pension payments. Our list is ranked in order from the lowest per-capita state retirement fund expenditure to the highest.
Click here to see the states with the best retirement funding.
Click here to see our detailed findings and methodology.

50. Georgia
> Total 2015 retirement spending: $26.4 per capita ($273 million)
> State government employment: 172,000 (3.8% of total employment)
> Percent of pension currently funded: 75.8% (17th highest)
> 2015 tax collections per capita: $1,931 (5th lowest)
[in-text-ad]

49. Tennessee
> Total 2015 retirement spending: $30.1 per capita ($200 million)
> State government employment: 98,700 (3.2% of total employment)
> Percent of pension currently funded: 94.1% (3rd highest)
> 2015 tax collections per capita: $1,924 (4th lowest)

48. Arkansas
> Total 2015 retirement spending: $41.9 per capita ($125 million)
> State government employment: 77,900 (6.3% of total employment)
> Percent of pension currently funded: 76.9% (15th highest)
> 2015 tax collections per capita: $3,086 (14th highest)

47. Nevada
> Total 2015 retirement spending: $46.7 per capita ($137 million)
> State government employment: 42,900 (3.1% of total employment)
> Percent of pension currently funded: 72.3% (21st highest)
> 2015 tax collections per capita: $2,606 (20th lowest)

46. Hawaii
> Total 2015 retirement spending: $51.5 per capita ($74 million)
> State government employment: 73,000 (11.0% of total employment)
> Percent of pension currently funded: 51.3% (6th lowest)
> 2015 tax collections per capita: $4,530 (3rd highest)

45. Mississippi
> Total 2015 retirement spending: $52.9 per capita ($158 million)
> State government employment: 59,300 (5.1% of total employment)
> Percent of pension currently funded: 57.5% (11th lowest)
> 2015 tax collections per capita: $2,641 (24th lowest)
[in-text-ad]

44. Kansas
> Total 2015 retirement spending: $59.4 per capita ($173 million)
> State government employment: 51,900 (3.7% of total employment)
> Percent of pension currently funded: 65.1% (21st lowest)
> 2015 tax collections per capita: $2,708 (25th highest)

43. Kentucky
> Total 2015 retirement spending: $62.8 per capita ($279 million)
> State government employment: 95,100 (4.9% of total employment)
> Percent of pension currently funded: 31.4% (2nd lowest)
> 2015 tax collections per capita: $2,621 (21st lowest)
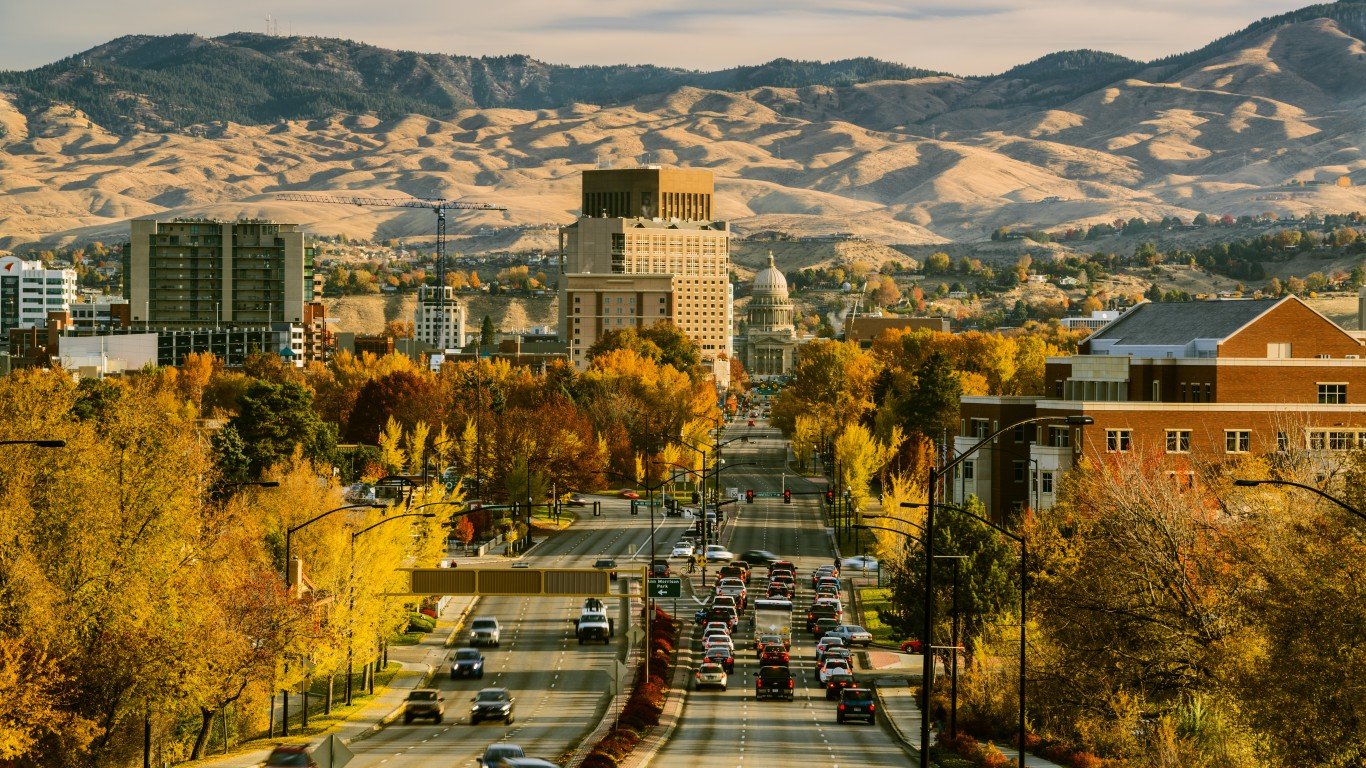
42. Idaho
> Total 2015 retirement spending: $73.0 per capita ($123 million)
> State government employment: 30,400 (4.1% of total employment)
> Percent of pension currently funded: 87.7% (7th highest)
> 2015 tax collections per capita: $2,402 (15th lowest)

41. Iowa
> Total 2015 retirement spending: $73.5 per capita ($231 million)
> State government employment: 68,000 (4.3% of total employment)
> Percent of pension currently funded: 81.6% (10th highest)
> 2015 tax collections per capita: $2,942 (19th highest)

40. Pennsylvania
> Total 2015 retirement spending: $78.1 per capita ($998 million)
> State government employment: 153,200 (2.5% of total employment)
> Percent of pension currently funded: 52.6% (7th lowest)
> 2015 tax collections per capita: $2,821 (22nd highest)
[in-text-ad]

39. Arizona
> Total 2015 retirement spending: $78.1 per capita ($541 million)
> State government employment: 91,300 (3.2% of total employment)
> Percent of pension currently funded: 60.4% (15th lowest)
> 2015 tax collections per capita: $2,062 (11th lowest)

38. Minnesota
> Total 2015 retirement spending: $79.8 per capita ($441 million)
> State government employment: 101,800 (3.4% of total employment)
> Percent of pension currently funded: 53.2% (8th lowest)
> 2015 tax collections per capita: $4,452 (5th highest)

37. Louisiana
> Total 2015 retirement spending: $80.2 per capita ($375 million)
> State government employment: 85,500 (4.3% of total employment)
> Percent of pension currently funded: 59.7% (14th lowest)
> 2015 tax collections per capita: $2,076 (12th lowest)

36. South Carolina
> Total 2015 retirement spending: $81.4 per capita ($404 million)
> State government employment: 107,300 (5.1% of total employment)
> Percent of pension currently funded: 53.8% (10th lowest)
> 2015 tax collections per capita: $1,967 (8th lowest)

35. Florida
> Total 2015 retirement spending: $85.6 per capita ($1,765 million)
> State government employment: 256,600 (2.9% of total employment)
> Percent of pension currently funded: 79.4% (13th highest)
> 2015 tax collections per capita: $1,836 (2nd lowest)
[in-text-ad]

34. California
> Total 2015 retirement spending: $88.4 per capita ($3,471 million)
> State government employment: 537,600 (3.1% of total employment)
> Percent of pension currently funded: 69.5% (25th lowest)
> 2015 tax collections per capita: $3,862 (9th highest)

33. Ohio
> Total 2015 retirement spending: $89.4 per capita ($1,038 million)
> State government employment: 187,700 (3.4% of total employment)
> Percent of pension currently funded: 72.0% (22nd highest)
> 2015 tax collections per capita: $2,437 (17th lowest)

32. Alabama
> Total 2015 retirement spending: $90.8 per capita ($442 million)
> State government employment: 117,500 (5.8% of total employment)
> Percent of pension currently funded: 67.2% (24th lowest)
> 2015 tax collections per capita: $2,008 (10th lowest)

31. Nebraska
> Total 2015 retirement spending: $91.0 per capita ($174 million)
> State government employment: 42,300 (4.1% of total employment)
> Percent of pension currently funded: 88.8% (5th highest)
> 2015 tax collections per capita: $2,683 (25th lowest)

30. North Carolina
> Total 2015 retirement spending: $94.2 per capita ($956 million)
> State government employment: 210,100 (4.7% of total employment)
> Percent of pension currently funded: 88.3% (6th highest)
> 2015 tax collections per capita: $2,498 (19th lowest)
[in-text-ad]

29. Oregon
> Total 2015 retirement spending: $96.6 per capita ($396 million)
> State government employment: 39,400 (2.1% of total employment)
> Percent of pension currently funded: 80.5% (12th highest)
> 2015 tax collections per capita: $2,625 (22nd lowest)

28. Oklahoma
> Total 2015 retirement spending: $102.0 per capita ($400 million)
> State government employment: 83,900 (5.0% of total employment)
> Percent of pension currently funded: 71.9% (24th highest)
> 2015 tax collections per capita: $2,405 (16th lowest)

27. Utah
> Total 2015 retirement spending: $103.9 per capita ($317 million)
> State government employment: 81,600 (5.4% of total employment)
> Percent of pension currently funded: 86.0% (8th highest)
> 2015 tax collections per capita: $2,237 (13th lowest)

26. Delaware
> Total 2015 retirement spending: $107.7 per capita ($102 million)
> State government employment: 33,100 (7.2% of total employment)
> Percent of pension currently funded: 81.1% (11th highest)
> 2015 tax collections per capita: $3,715 (10th highest)

25. Virginia
> Total 2015 retirement spending: $109.1 per capita ($918 million)
> State government employment: 159,900 (4.0% of total employment)
> Percent of pension currently funded: 72.4% (20th highest)
> 2015 tax collections per capita: $2,450 (18th lowest)
[in-text-ad]

24. Washington
> Total 2015 retirement spending: $110.4 per capita ($805 million)
> State government employment: 162,000 (4.7% of total employment)
> Percent of pension currently funded: 84.0% (9th highest)
> 2015 tax collections per capita: $2,879 (21st highest)

23. Missouri
> Total 2015 retirement spending: $119.9 per capita ($731 million)
> State government employment: 103,300 (3.6% of total employment)
> Percent of pension currently funded: 76.7% (16th highest)
> 2015 tax collections per capita: $1,965 (7th lowest)

22. West Virginia
> Total 2015 retirement spending: $121.6 per capita ($223 million)
> State government employment: 48,600 (6.4% of total employment)
> Percent of pension currently funded: 71.9% (23rd highest)
> 2015 tax collections per capita: $3,018 (17th highest)

21. Maryland
> Total 2015 retirement spending: $122.8 per capita ($739 million)
> State government employment: 110,000 (4.0% of total employment)
> Percent of pension currently funded: 64.9% (20th lowest)
> 2015 tax collections per capita: $3,330 (12th highest)
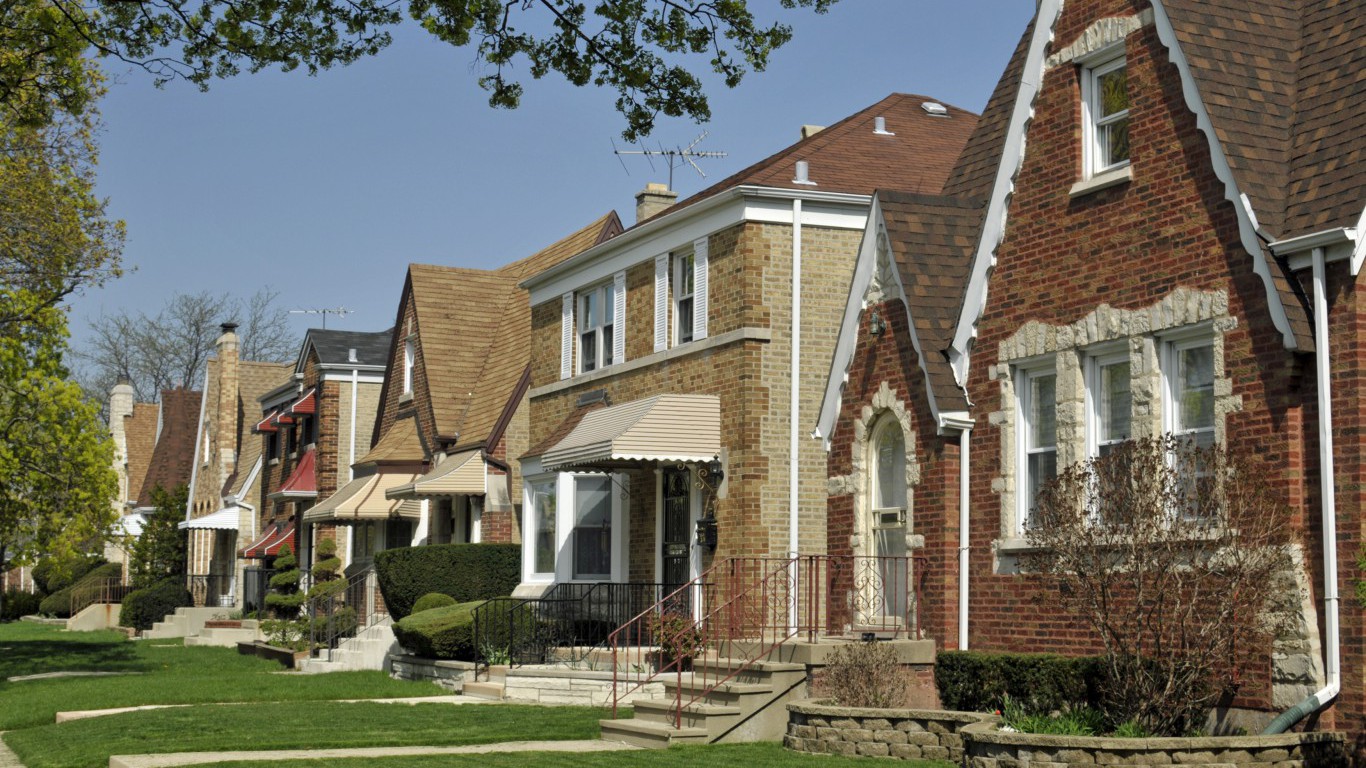
20. Illinois
> Total 2015 retirement spending: $129.1 per capita ($1,653 million)
> State government employment: 153,200 (2.5% of total employment)
> Percent of pension currently funded: 35.6% (3rd lowest)
> 2015 tax collections per capita: $3,174 (13th highest)
[in-text-ad]

19. Michigan
> Total 2015 retirement spending: $134.2 per capita ($1,332 million)
> State government employment: 192,700 (4.4% of total employment)
> Percent of pension currently funded: 64.0% (18th lowest)
> 2015 tax collections per capita: $2,717 (24th highest)

18. Maine
> Total 2015 retirement spending: $141.7 per capita ($189 million)
> State government employment: 25,400 (4.0% of total employment)
> Percent of pension currently funded: 77.3% (14th highest)
> 2015 tax collections per capita: $3,057 (15th highest)

17. Wisconsin
> Total 2015 retirement spending: $143.5 per capita ($829 million)
> State government employment: 93,900 (3.2% of total employment)
> Percent of pension currently funded: 99.1% (the highest)
> 2015 tax collections per capita: $2,949 (18th highest)

16. New Jersey
> Total 2015 retirement spending: $150.5 per capita ($1,346 million)
> State government employment: 144,300 (3.5% of total employment)
> Percent of pension currently funded: 30.9% (the lowest)
> 2015 tax collections per capita: $3,524 (11th highest)

15. Texas
> Total 2015 retirement spending: $151.1 per capita ($4,210 million)
> State government employment: 409,200 (3.3% of total employment)
> Percent of pension currently funded: 73.0% (19th highest)
> 2015 tax collections per capita: $2,005 (9th lowest)
[in-text-ad]

14. Indiana
> Total 2015 retirement spending: $153.1 per capita ($1,016 million)
> State government employment: 116,200 (3.7% of total employment)
> Percent of pension currently funded: 63.0% (17th lowest)
> 2015 tax collections per capita: $2,628 (23rd lowest)
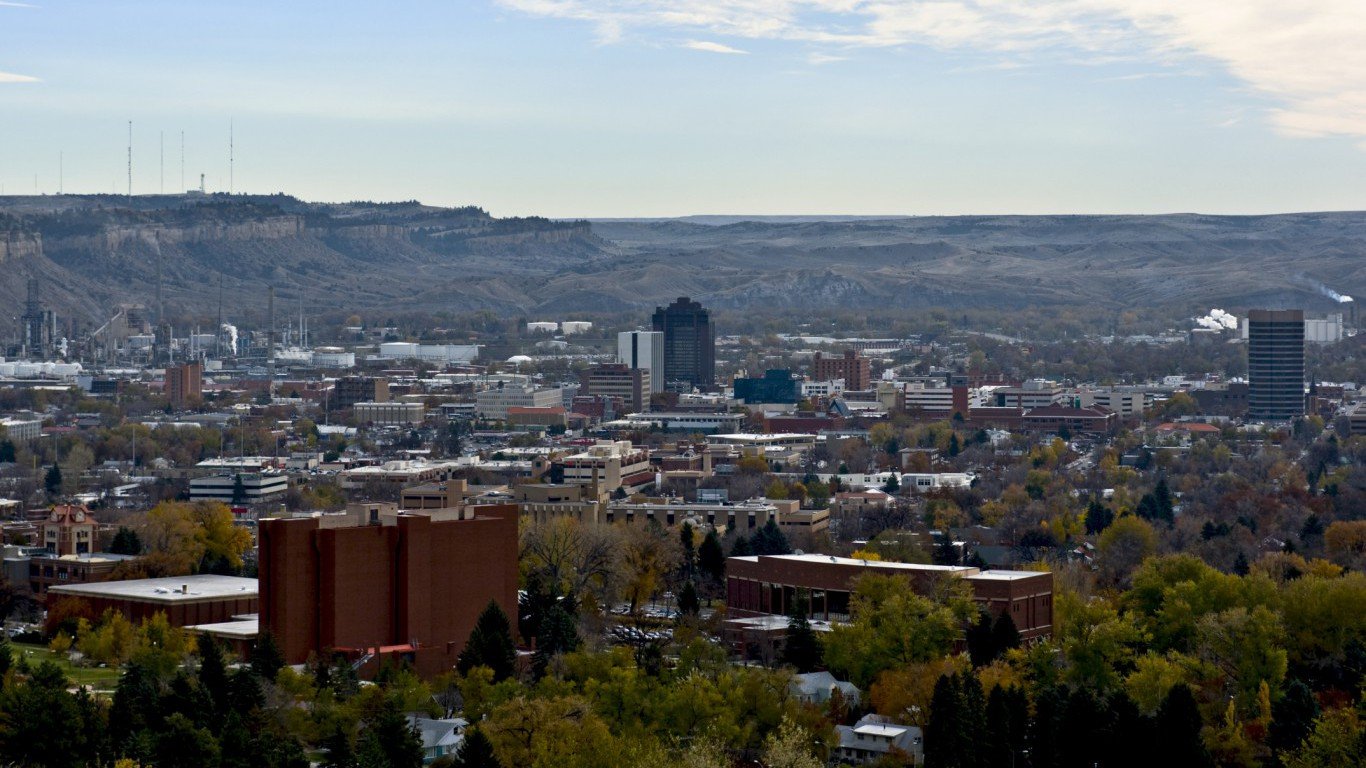
13. Montana
> Total 2015 retirement spending: $158.9 per capita ($166 million)
> State government employment: 27,800 (5.9% of total employment)
> Percent of pension currently funded: 71.2% (25th highest)
> 2015 tax collections per capita: $2,753 (23rd highest)

12. Vermont
> Total 2015 retirement spending: $175.7 per capita ($110 million)
> State government employment: 19,100 (6.1% of total employment)
> Percent of pension currently funded: 64.3% (19th lowest)
> 2015 tax collections per capita: $4,861 (2nd highest)

11. Colorado
> Total 2015 retirement spending: $183.0 per capita ($1,014 million)
> State government employment: 126,700 (4.7% of total employment)
> Percent of pension currently funded: 46.0% (5th lowest)
> 2015 tax collections per capita: $2,348 (14th lowest)

10. Connecticut
> Total 2015 retirement spending: $201.6 per capita ($721 million)
> State government employment: 62,700 (3.7% of total employment)
> Percent of pension currently funded: 41.4% (4th lowest)
> 2015 tax collections per capita: $4,518 (4th highest)
[in-text-ad]

9. New York
> Total 2015 retirement spending: $203.3 per capita ($4,014 million)
> State government employment: 255,000 (2.7% of total employment)
> Percent of pension currently funded: 90.6% (4th highest)
> 2015 tax collections per capita: $3,951 (8th highest)

8. Massachusetts
> Total 2015 retirement spending: $248.9 per capita ($1,695 million)
> State government employment: 128,300 (3.5% of total employment)
> Percent of pension currently funded: 57.6% (12th lowest)
> 2015 tax collections per capita: $3,976 (7th highest)

7. South Dakota
> Total 2015 retirement spending: $265.7 per capita ($230 million)
> State government employment: 18,900 (4.3% of total employment)
> Percent of pension currently funded: 96.9% (2nd highest)
> 2015 tax collections per capita: $1,950 (6th lowest)

6. New Hampshire
> Total 2015 retirement spending: $278.5 per capita ($372 million)
> State government employment: 25,000 (3.6% of total employment)
> Percent of pension currently funded: 58.2% (13th lowest)
> 2015 tax collections per capita: $1,870 (3rd lowest)

5. New Mexico
> Total 2015 retirement spending: $305.9 per capita ($637 million)
> State government employment: 54,300 (6.5% of total employment)
> Percent of pension currently funded: 65.4% (22nd lowest)
> 2015 tax collections per capita: $2,882 (20th highest)
[in-text-ad]

4. Rhode Island
> Total 2015 retirement spending: $371.1 per capita ($392 million)
> State government employment: 16,100 (3.2% of total employment)
> Percent of pension currently funded: 53.7% (9th lowest)
> 2015 tax collections per capita: $3,026 (16th highest)

3. North Dakota
> Total 2015 retirement spending: $524.6 per capita ($398 million)
> State government employment: 23,100 (5.4% of total employment)
> Percent of pension currently funded: 65.9% (23rd lowest)
> 2015 tax collections per capita: $7,583 (the highest)

2. Alaska
> Total 2015 retirement spending: $995.4 per capita ($738 million)
> State government employment: 23,800 (7.2% of total employment)
> Percent of pension currently funded: 62.7% (16th lowest)
> 2015 tax collections per capita: $1,170 (the lowest)

1. Wyoming
> Total 2015 retirement spending: $1527.8 per capita ($895 million)
> State government employment: 15,000 (5.3% of total employment)
> Percent of pension currently funded: 73.3% (18th highest)
> 2015 tax collections per capita: $4,020 (6th highest)
Detailed Findings
At the state level, the differences in funding are extreme, ranging from as little as $73.6 million annually to $4.2 billion, depending on the state. Per-capita spending ranges from as little as $26 to well over $1,500.
There is little relationship currently between the amount spent per capita on pensions and the level to which these pensions are funded, but many state pension funds appear to be drastically underfunded, and continued pressure could result in crisis for some of these states.
As of 2016, 14 states had less than 60% of the funds needed to meet their future pension payment obligations. Speaking to 24/7 Wall St., David Draine, senior officer of the public sector retirement systems project at The Pew Charitable Trusts, explained the extent of the potential crisis.
“The Great Recession caused substantial losses for state pension plans; nine years into the recovery many state pension plans have failed to make up lost ground and overall public sector retirement systems have never been more vulnerable to the next recession,” Draine said.
Methodology
To identify what each state spends on retirement, 24/7 Wall St. reviewed the detailed expenditures for State governments toward retirement, as well as State revenue and Cash / Security Holdings, provided by the U.S. Census Bureau’s 2015 State and Local Finance data. State pension deficit data was provided by The PEW Charitable Trust’s “The State Pension Funding Gap: 2016.” State government employment as a share of total nonfarm employment came from the bureau of labor Statistics, and is as of May 2018. State tax collections are from the Tax Foundation’s Facts and Figures report. The report, which was released in 2018, includes collections for the 2015 fiscal year.
Sponsored: Attention Savvy Investors: Speak to 3 Financial Experts – FREE
Ever wanted an extra set of eyes on an investment you’re considering? Now you can speak with up to 3 financial experts in your area for FREE. By simply
clicking here you can begin to match with financial professionals who can help guide you through the financial decisions you’re making. And the best part? The first conversation with them is free.
Click here to match with up to 3 financial pros who would be excited to help you make financial decisions.