
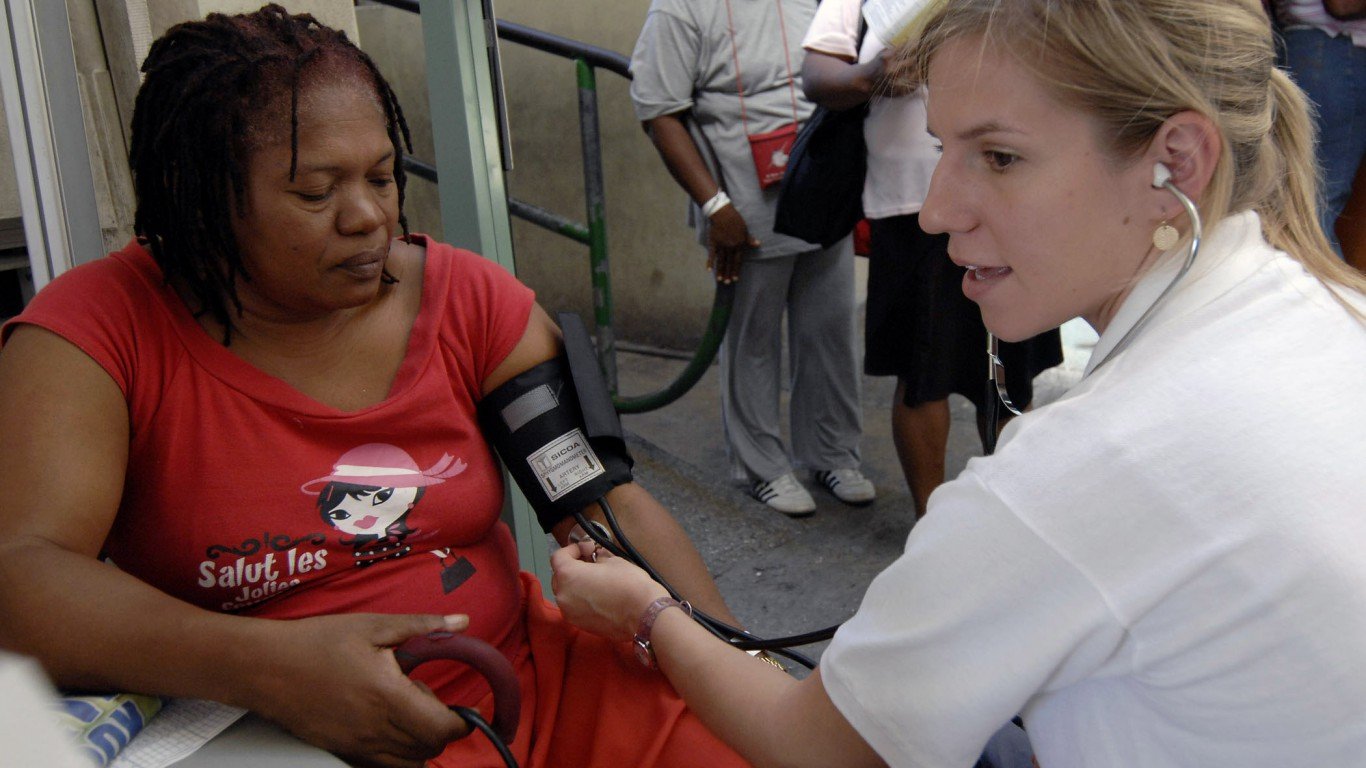
Not that long ago, opportunities for women in the workforce were quite limited. Secretarial and clerical work, nursing, jobs in textiles and in service were expected positions for women, and those jobs were almost entirely performed by them.
Today, while very few jobs remain completely out of reach for women, many are still highly female or male-dominated. And many of the female-dominated jobs are the same ones of 70 years ago. While many of these primarily women-occupied jobs are vanishing due to changes in technology — telemarketers, bank tellers, bookkeepers, and librarians, to name a few — others are in fields that are in great demand, and are growing rapidly.
In fact, while many male-dominated roles — manufacturing and other forms of manual labor — are shrinking, the majority of the fastest growing jobs are held primarily by women. Still, because these are female dominated occupations, they are often dismissed as “women’s work” by men.
Notably, as they have done traditionally, women continue to occupy a number of jobs in caretaking and medicine. As the baby boomer generation ages, demand for those roles has grown and will continue to grow in the foreseeable future.
Based on occupation data from the Bureau of Labor Statistics, 24/7 Wall St. reviewed jobs where at least two-thirds of the workers are women. Of those, we identified 32 jobs where employment has increased by at least 10% between 2011 and 2017. Employment at some of these occupations has grown by over 50% during that time.
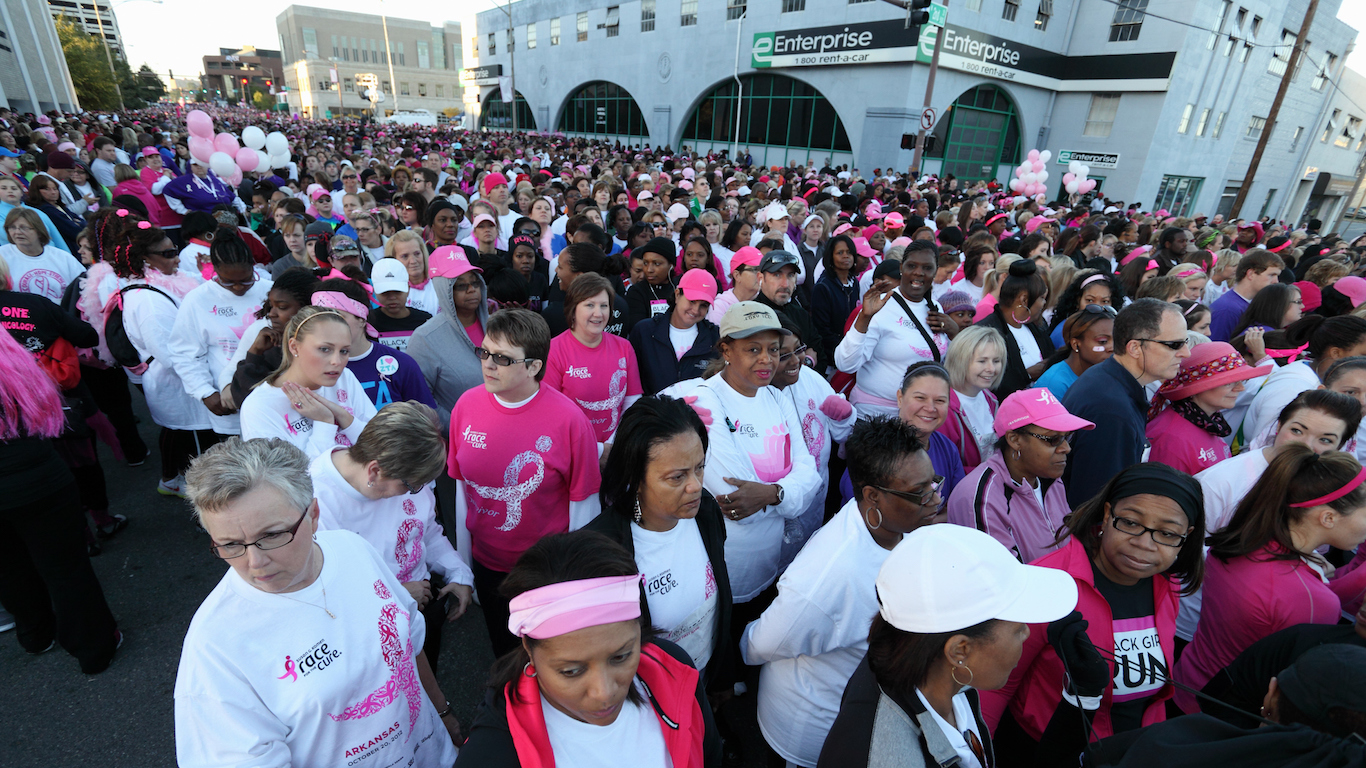
Click here to see the 32 fastest growing jobs dominated by women.
Click here to see our detailed findings and methodology.

Source: santypan / iStock
32. Dental assistants
> 2011-2017 growth: +12.6%
> 2017 employment: 215,000
> Six-year employment change: +5,000 men; +19,000 women
> Share of women: 94.4%
[in-text-ad]

Source: Nomadsoul1 / iStock
31. Hairdressers, hairstylists, and cosmetologists
> 2011-2017 growth: +14.9%
> 2017 employment: 324,000
> Six-year employment change: -1,000 men; +43,000 women
> Share of women: 93.2%
 24/7 Wall St.
Source: Thinkstock
30. Travel agents
> 2011-2017 growth: +16.3%
> 2017 employment: 57,000
> Six-year employment change: -1,000 men; +9,000 women
> Share of women: 82.5%

Source: Thinkstock
29. Graders and sorters, agricultural products
> 2011-2017 growth: +16.5%
> 2017 employment: 99,000
> Six-year employment change: +00 men; +14,000 women
> Share of women: 67.7%
[in-text-ad-2]

Source: Thinkstock
28. Meeting, convention, and event planners
> 2011-2017 growth: +17.2%
> 2017 employment: 102,000
> Six-year employment change: -2,000 men; +18,000 women
> Share of women: 87.3%

Source: Wavebreakmedia / iStock
27. Office clerks, general
> 2011-2017 growth: +17.8%
> 2017 employment: 935,000
> Six-year employment change: +21,000 men; +120,000 women
> Share of women: 84.8%
[in-text-ad]

Source: Thinkstock
26. Licensed practical and licensed vocational nurses
> 2011-2017 growth: +18.2%
> 2017 employment: 501,000
> Six-year employment change: +23,000 men; +52,000 women
> Share of women: 87.4%
Source: Public Domain / Wikimedia Commons
25. Registered nurses
> 2011-2017 growth: +18.2%
> 2017 employment: 2,536,000
> Six-year employment change: +75,000 men; +316,000 women
> Share of women: 88.8%
Source: Gilitukha / iStock
24. Nonfarm animal caretakers
> 2011-2017 growth: +20.7%
> 2017 employment: 99,000
> Six-year employment change: -1,000 men; +18,000 women
> Share of women: 78.8%
[in-text-ad-2]

Source: monkeybusinessimages / iStock
23. Social and community service managers
> 2011-2017 growth: +21.7%
> 2017 employment: 337,000
> Six-year employment change: +20,000 men; +40,000 women
> Share of women: 70.0%

Source: Thinkstock
22. Speech-language pathologists
> 2011-2017 growth: +21.8%
> 2017 employment: 106,000
> Six-year employment change: +1,000 men; +18,000 women
> Share of women: 96.2%
[in-text-ad]

Source: Thinkstock
21. Childcare workers
> 2011-2017 growth: +22.1%
> 2017 employment: 448,000
> Six-year employment change: +9,000 men; +71,000 women
> Share of women: 92.2%
 24/7 Wall St.
Source: Trish233 / iStock
20. Library technicians
> 2011-2017 growth: +23.1%
> 2017 employment: 16,000
> Six-year employment change: -1,000 men; +4,000 women
> Share of women: 87.5%

Source: MaxRiesgo / iStock
19. Opticians, dispensing
> 2011-2017 growth: +26.5%
> 2017 employment: 43,000
> Six-year employment change: +5,000 men; +4,000 women
> Share of women: 69.8%
[in-text-ad-2]

Source: Lipik1 / iStock
18. Dietitians and nutritionists
> 2011-2017 growth: +27.5%
> 2017 employment: 88,000
> Six-year employment change: +2,000 men; +16,000 women
> Share of women: 90.9%

Source: Thinkstock
17. Dental hygienists
> 2011-2017 growth: +27.9%
> 2017 employment: 78,000
> Six-year employment change: +2,000 men; +14,000 women
> Share of women: 93.6%
[in-text-ad]
Source: Sean_Gao / iStock
16. Fundraisers
> 2011-2017 growth: +28.6%
> 2017 employment: 72,000
> Six-year employment change: +3,000 men; +13,000 women
> Share of women: 76.4%
 24/7 Wall St.
Source: MangoStar_Studio / iStock
15. New accounts clerks
> 2011-2017 growth: +33.3%
> 2017 employment: 36,000
> Six-year employment change: +00 men; +9,000 women
> Share of women: 77.8%

Source: Thinkstock
14. Personal care aides
> 2011-2017 growth: +33.9%
> 2017 employment: 735,000
> Six-year employment change: +33,000 men; +153,000 women
> Share of women: 82.7%
[in-text-ad-2]

Source: Thinkstock
13. Medical and health services managers
> 2011-2017 growth: +35.6%
> 2017 employment: 610,000
> Six-year employment change: +52,000 men; +108,000 women
> Share of women: 71.0%

Source: CandyBox Images / Shutterstock.com
12. Flight attendants
> 2011-2017 growth: +36.5%
> 2017 employment: 71,000
> Six-year employment change: +6,000 men; +13,000 women
> Share of women: 71.8%
[in-text-ad]

Source: Thinkstock
11. Sewing machine operators
> 2011-2017 growth: +40.2%
> 2017 employment: 157,000
> Six-year employment change: +21,000 men; +24,000 women
> Share of women: 68.8%

Source: Thinkstock
10. Physician assistants
> 2011-2017 growth: +40.6%
> 2017 employment: 97,000
> Six-year employment change: +7,000 men; +22,000 women
> Share of women: 68.0%

Source: Public Domain / Wikimedia Commons
9. Medical records and health information technicians
> 2011-2017 growth: +41.1%
> 2017 employment: 151,000
> Six-year employment change: +1,000 men; +44,000 women
> Share of women: 92.7%
[in-text-ad-2]

Source: Lighthaunter / iStock
8. Medical assistants
> 2011-2017 growth: +45.5%
> 2017 employment: 457,000
> Six-year employment change: +18,000 men; +125,000 women
> Share of women: 91.5%

Source: UberImages / iStock
7. Human resources managers
> 2011-2017 growth: +46.9%
> 2017 employment: 304,000
> Six-year employment change: +34,000 men; +62,000 women
> Share of women: 69.4%
[in-text-ad]

Source: Thinkstock
6. Veterinarians
> 2011-2017 growth: +50.0%
> 2017 employment: 60,000
> Six-year employment change: +8,000 men; +12,000 women
> Share of women: 66.7%

Source: Thinkstock
5. Massage therapists
> 2011-2017 growth: +50.0%
> 2017 employment: 51,000
> Six-year employment change: +9,000 men; +8,000 women
> Share of women: 70.6%

Source: Wavebreakmedia / iStock
4. Therapists, all other
> 2011-2017 growth: +71.1%
> 2017 employment: 142,000
> Six-year employment change: +10,000 men; +50,000 women
> Share of women: 80.3%
[in-text-ad-2]

Source: Thinkstock
3. Nurse practitioners
> 2011-2017 growth: +74.1%
> 2017 employment: 141,000
> Six-year employment change: +1,000 men; +60,000 women
> Share of women: 91.5%

Source: DGLimages / iStock
2. Social and human service assistants
> 2011-2017 growth: +80.0%
> 2017 employment: 189,000
> Six-year employment change: +27,000 men; +58,000 women
> Share of women: 74.6%
[in-text-ad]
Source: yacobchuk / iStock
1. Veterinary assistants and laboratory animal caretakers
> 2011-2017 growth: +85.0%
> 2017 employment: 37,000
> Six-year employment change: -3,000 men; +20,000 women
> Share of women: 89.2%
Detailed Findings
Of the 32 fast-growing jobs on this list, 17 are in medical and caregiving occupations, including nursing, veterinary work, dentistry, and therapy. Of the six positions with at least 50% employment growth between 2011 and 2017, all but one are in health care-related roles.
While there have been improvements over the decades, women keep running into hurdles, and breaking the glass ceiling remains an important goal in gender equality in the workforce. The exclusion of women from certain occupations has diminished over time, although it remains an issue. Still, as the broad cultural understanding of acceptable roles in the workplace has been changing, women’s representation in higher-paying roles, such as executive positions and science and technology jobs, also has gradually increased.
Another, often less discussed, aspect of the changing workforce is the increasing representation of men in some occupations that were once considered just women’s work.
Most of the jobs on this list, while all still predominantly occupied by women, are showing signs of men taking up these occupation. While just over 70% of massage therapists today are women, that is down from 82% just a few years ago.
The share of men in 18 of the 32 jobs on this list has increased over the last six years. The effects of this shift is not yet clear and may not be as positive as might be hoped. According to one New York Times piece, published last year, men who take jobs in women’s roles tend to be paid better and treated better than women who hold those positions.
Methodology
To identify the fastest growing jobs dominated by women, 24/7 Wall St. reviewed overall employment growth across occupations in which women have traditionally dominated the workforce. The jobs on this list are the 32 occupations in which women comprise at least two-thirds of the employed workforce, and for which employment increased by at least 10% between 2011, the first year with consistent available data, and 2017. These occupations were obtained from the U.S. Census Bureau’s Current Population Survey (CPS), a Bureau of Labor Statistics (BLS) program. To be considered, an occupation must have had at least 10,000 women holding such jobs in 2011. We excluded occupations defined as miscellaneous.
Sponsored: Want to Retire Early? Here’s a Great First Step
Want retirement to come a few years earlier than you’d planned? Or are you ready to retire now, but want an extra set of eyes on your finances?
Now you can speak with up to 3 financial experts in your area for FREE. By simply clicking here you can begin to match with financial professionals who can help you build your plan to retire early. And the best part? The first conversation with them is free.
Click here to match with up to 3 financial pros who would be excited to help you make financial decisions.
Thank you for reading! Have some feedback for us?
Contact the 24/7 Wall St. editorial team.
Editors' Picks

