
The U.S. is in a period of record-breaking economic growth. The economy added 157,000 jobs in July 2018, marking the 94th consecutive month of employment growth. Last month’s hiring is the continuation of a pattern that has netted some 19 million new jobs since the Great Recession.
What the national job numbers fail to convey is that cities and urban areas are, by and large, the engines driving employment growth nationwide. Employment in U.S. metro areas climbed 8.8% over the last half decade — nearly triple the comparable 3.2% job growth in the rest of the country.
The same general pattern of rapid job growth in urban economies holds true at a state level. In nearly every state in the country, there is at least one city where job growth outpaced job growth across the state as a whole in the last half decade. Indeed, 16 states have at least one metro area where five-year employment growth more than doubled employment growth statewide over the same period.
In Lake Charles, Louisiana, for example, total employment increased 30.5% over the last five years. Meanwhile, employment across Louisiana climbed by just 3.6% over the same period. Employment in the metro area was driven in large part by its booming construction industry, which more than doubled in size in the last half decade.
24/7 Wall St. reviewed changes in total employment in 381 metro areas from May 2013 to May 2018 to identify the cities adding the most jobs in every state.
Click here to see the cities adding the most jobs in every state.
Click here to see the cities with the weakest job growth in every state.
Click here to see our detailed findings and methodology.

Source: George Dodd / Getty Images
Alabama: Daphne-Fairhope-Foley
> Employment chg. 2013-2018: +13.4% (81,475 to 92,384)
> State employment chg. 2013-2018: +3.9% (2.0 million to 2.1 million)
> June unemployment: 4.0%
> Industry with largest employment increase: Government
> Employment growth in government: 4.2%
[in-text-ad]

Source: RobsonAbbott / Getty Images
Alaska: Anchorage
> Employment chg. 2013-2018: -1.1% (190,310 to 188,245)
> State employment chg. 2013-2018: -1.4% (340,553 to 335,748)
> June unemployment: 6.1%
> Industry with largest employment increase: Transportation, warehousing, and utilities
> Employment growth in transportation, warehousing, and utilities: 13.6%

Source: desertsolitaire / Getty Images
Arizona: Prescott
> Employment chg. 2013-2018: +19.1% (84,310 to 100,374)
> State employment chg. 2013-2018: +15.5% (2.8 million to 3.2 million)
> June unemployment: 4.2%
> Industry with largest employment increase: Professional and business services
> Employment growth in professional and business services: 52.0%

Source: JTGrafix / Getty Images
Arkansas: Fayetteville-Springdale-Rogers
> Employment chg. 2013-2018: +20.9% (223,052 to 269,580)
> State employment chg. 2013-2018: +5.5% (1.2 million to 1.3 million)
> June unemployment: 2.6%
> Industry with largest employment increase: Other services
> Employment growth in other services: 42.9%
[in-text-ad-2]

Source: Kit_Leong / Getty Images
California: Riverside-San Bernardino-Ontario
> Employment chg. 2013-2018: +14.0% (1.7 million to 1.9 million)
> State employment chg. 2013-2018: +9.0% (17.0 million to 18.6 million)
> June unemployment: 4.4%
> Industry with largest employment increase: Transportation, warehousing, and utilities
> Employment growth in transportation, warehousing, and utilities: 63.2%

Source: Bbean32 / Wikimedia Commons
Colorado: Greeley
> Employment chg. 2013-2018: +23.3% (130,288 to 160,622)
> State employment chg. 2013-2018: +16.8% (2.6 million to 3.0 million)
> June unemployment: 2.5%
> Industry with largest employment increase: Leisure and hospitality
> Employment growth in leisure and hospitality: 30.7%
[in-text-ad]

Source: SeanPavonePhoto / Getty Images
Connecticut: Hartford-West Hartford-East Hartford
> Employment chg. 2013-2018: +6.1% (561,997 to 596,384)
> State employment chg. 2013-2018: +5.8% (1.7 million to 1.8 million)
> June unemployment: 4.3%
> Industry with largest employment increase: Transportation, warehousing, and utilities
> Employment growth in transportation, warehousing, and utilities: 25.3%

Source: DenisTangneyJr / Getty Images
Delaware: Dover
> Employment chg. 2013-2018: +12.1% (68,358 to 76,606)
> State employment chg. 2013-2018: +13.9% (410,908 to 468,143)
> June unemployment: 4.3%
> Industry with largest employment increase: Professional and business services
> Employment growth in professional and business services: 28.6%

Source: bobbyuzda / Getty Images
Florida: Orlando-Kissimmee-Sanford
> Employment chg. 2013-2018: +17.9% (1.1 million to 1.3 million)
> State employment chg. 2013-2018: +12.4% (8.8 million to 9.9 million)
> June unemployment: 3.3%
> Industry with largest employment increase: Construction
> Employment growth in construction: 56.3%
[in-text-ad-2]

Source: Jerrye & Roy Klotz, MD / Wikimedia Commons
Georgia: Gainesville
> Employment chg. 2013-2018: +20.3% (83,984 to 101,070)
> State employment chg. 2013-2018: +13.2% (4.4 million to 5.0 million)
> June unemployment: 3.1%
> Industry with largest employment increase: Trade, transportation, and utilities
> Employment growth in trade, transportation, and utilities: 17.3%

Source: Thinkstock
Hawaii: Kahului-Wailuku-Lahaina
> Employment chg. 2013-2018: +13.6% (74,842 to 85,015)
> State employment chg. 2013-2018: +9.1% (617,311 to 673,649)
> June unemployment: 2.3%
> Industry with largest employment increase: Education and health services
> Employment growth in education and health services: 37.5%
[in-text-ad]

Source: knowlesgallery / Getty Images
Idaho: Boise City
> Employment chg. 2013-2018: +19.3% (290,478 to 346,506)
> State employment chg. 2013-2018: +14.6% (726,135 to 831,838)
> June unemployment: 2.7%
> Industry with largest employment increase: Leisure and hospitality
> Employment growth in leisure and hospitality: 28.1%
 24/7 Wall St.
Source: davidwilson1949 / Flickr
Illinois: Kankakee
> Employment chg. 2013-2018: +10.9% (50,138 to 55,581)
> State employment chg. 2013-2018: +4.3% (6.0 million to 6.2 million)
> June unemployment: 4.9%
> Industry with largest employment increase: Professional and business services
> Employment growth in professional and business services: 78.1%

Source: davidwilson1949 / Flickr
Indiana: Elkhart-Goshen
> Employment chg. 2013-2018: +24.4% (92,876 to 115,514)
> State employment chg. 2013-2018: +11.6% (3.0 million to 3.3 million)
> June unemployment: 2.6%
> Industry with largest employment increase: Manufacturing
> Employment growth in manufacturing: 31.4%
[in-text-ad-2]

Source: nashvilledino2 / Getty Images
Iowa: Des Moines-West Des Moines
> Employment chg. 2013-2018: +9.4% (314,492 to 343,995)
> State employment chg. 2013-2018: +2.9% (1.6 million to 1.6 million)
> June unemployment: 2.4%
> Industry with largest employment increase: Leisure and hospitality
> Employment growth in leisure and hospitality: 26.4%

Source: Epicsosseum25 / Wikimedia Commons
Kansas: Lawrence
> Employment chg. 2013-2018: +3.8% (60,847 to 63,166)
> State employment chg. 2013-2018: +1.6% (1.4 million to 1.4 million)
> June unemployment: 3.0%
> Industry with largest employment increase: Leisure and hospitality
> Employment growth in leisure and hospitality: 17.5%
[in-text-ad]

Source: DenisTangneyJr / Getty Images
Kentucky: Bowling Green
> Employment chg. 2013-2018: +8.8% (75,028 to 81,622)
> State employment chg. 2013-2018: +4.1% (1.9 million to 2.0 million)
> June unemployment: 4.1%
> Industry with largest employment increase: Manufacturing
> Employment growth in manufacturing: 29.4%

Source: DenisTangneyJr / Getty Images
Louisiana: Lake Charles
> Employment chg. 2013-2018: +30.5% (85,917 to 112,145)
> State employment chg. 2013-2018: +3.6% (2.0 million to 2.0 million)
> June unemployment: 4.0%
> Industry with largest employment increase: Construction
> Employment growth in construction: 136.4%

Source: SeanPavonePhoto / Getty Images
Maine: Portland-South Portland
> Employment chg. 2013-2018: +6.5% (192,776 to 205,238)
> State employment chg. 2013-2018: +4.1% (655,565 to 682,267)
> June unemployment: 2.5%
> Industry with largest employment increase: Other services
> Employment growth in other services: 22.7%
[in-text-ad-2]

Source: Famartin / Wikimedia Commons
Maryland: Salisbury
> Employment chg. 2013-2018: +10.0% (164,697 to 181,239)
> State employment chg. 2013-2018: +5.8% (2.9 million to 3.1 million)
> June unemployment: 5.3%
> Industry with largest employment increase: Professional and business services
> Employment growth in professional and business services: 25.8%

Source: MIHAI ANDRITOIU / Getty Images
Massachusetts: Boston-Cambridge-Newton
> Employment chg. 2013-2018: +12.4% (2.4 million to 2.7 million)
> State employment chg. 2013-2018: +12.1% (3.3 million to 3.7 million)
> June unemployment: 3.3%
> Industry with largest employment increase: Professional and business services
> Employment growth in professional and business services: 19.5%
[in-text-ad]

Source: jag64551 / Getty Images
Michigan: Grand Rapids-Wyoming
> Employment chg. 2013-2018: +14.6% (496,810 to 569,151)
> State employment chg. 2013-2018: +9.2% (4.3 million to 4.7 million)
> June unemployment: 2.8%
> Industry with largest employment increase: Manufacturing
> Employment growth in manufacturing: 18.9%

Source: diversey / Flickr
Minnesota: St. Cloud
> Employment chg. 2013-2018: +9.0% (102,583 to 111,787)
> State employment chg. 2013-2018: +7.5% (2.8 million to 3.0 million)
> June unemployment: 3.0%
> Industry with largest employment increase: Transportation, warehousing, and utilities
> Employment growth in transportation, warehousing, and utilities: 23.5%

Source: csfotoimages / Getty Images
Mississippi: Hattiesburg
> Employment chg. 2013-2018: +10.8% (59,903 to 66,360)
> State employment chg. 2013-2018: +4.7% (1.2 million to 1.2 million)
> June unemployment: 4.2%
> Industry with largest employment increase: Leisure and hospitality
> Employment growth in leisure and hospitality: 13.7%
[in-text-ad-2]

Source: Wallaceweeks / Getty Images
Missouri: Kansas City
> Employment chg. 2013-2018: +8.3% (1.0 million to 1.1 million)
> State employment chg. 2013-2018: +5.0% (2.8 million to 3.0 million)
> June unemployment: 3.5%
> Industry with largest employment increase: Transportation, warehousing, and utilities
> Employment growth in transportation, warehousing, and utilities: 22.6%

Source: Lorraine Boogich / Getty Images
Montana: Missoula
> Employment chg. 2013-2018: +7.0% (56,839 to 60,843)
> State employment chg. 2013-2018: +4.1% (485,750 to 505,759)
> June unemployment: 3.0%
> Industry with largest employment increase: Leisure and hospitality
> Employment growth in leisure and hospitality: 11.1%
[in-text-ad]

Source: ChrisBoswell / Getty Images
Nebraska: Omaha-Council Bluffs
> Employment chg. 2013-2018: +3.7% (455,482 to 472,184)
> State employment chg. 2013-2018: +0.3% (985,755 to 988,458)
> June unemployment: 2.9%
> Industry with largest employment increase: Leisure and hospitality
> Employment growth in leisure and hospitality: 11.6%
 24/7 Wall St.
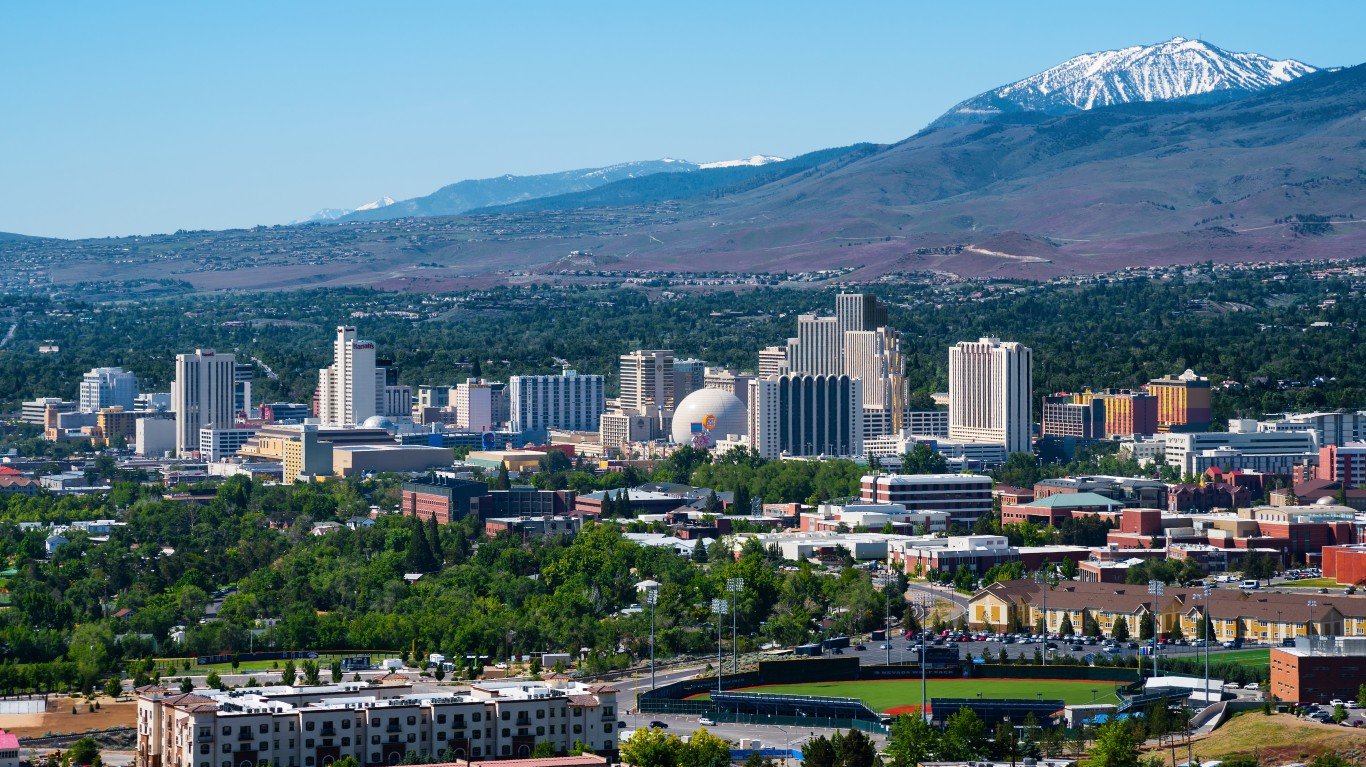
Source: photoquest7 / Getty Images
Nevada: Reno
> Employment chg. 2013-2018: +19.0% (201,802 to 240,078)
> State employment chg. 2013-2018: +14.9% (1.2 million to 1.4 million)
> June unemployment: 3.4%
> Industry with largest employment increase: Construction
> Employment growth in construction: 79.6%

Source: SeanPavonePhoto / Getty Images
New Hampshire: Manchester-Nashua
> Employment chg. 2013-2018: +7.2% (107,809 to 115,569)
> State employment chg. 2013-2018: +4.8% (701,613 to 735,499)
> June unemployment: 2.5%
> Industry with largest employment increase: Education and health services
> Employment growth in education and health services: 22.1%
[in-text-ad-2]

Source: Aneese / Getty Images
New Jersey: Trenton
> Employment chg. 2013-2018: +6.7% (179,797 to 191,767)
> State employment chg. 2013-2018: +2.3% (4.2 million to 4.3 million)
> June unemployment: 3.6%
> Industry with largest employment increase: Transportation, warehousing, and utilities
> Employment growth in transportation, warehousing, and utilities: 139.6%

Source: photoBeard / Getty Images
New Mexico: Albuquerque
> Employment chg. 2013-2018: +6.6% (388,115 to 413,546)
> State employment chg. 2013-2018: +4.0% (859,642 to 894,321)
> June unemployment: 4.2%
> Industry with largest employment increase: Professional and business services
> Employment growth in professional and business services: 13.2%
[in-text-ad]

Source: TomasSereda / Getty Images
New York: New York-Newark-Jersey City
> Employment chg. 2013-2018: +5.1% (9.2 million to 9.6 million)
> State employment chg. 2013-2018: +3.6% (9.0 million to 9.3 million)
> June unemployment: 4.0%
> Industry with largest employment increase: Transportation, warehousing, and utilities
> Employment growth in transportation, warehousing, and utilities: 18.9%

Source: Sean Pavone / Getty Images
North Carolina: Raleigh
> Employment chg. 2013-2018: +18.7% (582,557 to 691,462)
> State employment chg. 2013-2018: +11.5% (4.3 million to 4.8 million)
> June unemployment: 3.5%
> Industry with largest employment increase: Transportation, warehousing, and utilities
> Employment growth in transportation, warehousing, and utilities: 33.0%

Source: Solange_Z / Getty Images
North Dakota: Fargo
> Employment chg. 2013-2018: +10.5% (123,010 to 135,952)
> State employment chg. 2013-2018: +0.7% (396,546 to 399,161)
> June unemployment: 2.5%
> Industry with largest employment increase: Transportation, warehousing, and utilities
> Employment growth in transportation, warehousing, and utilities: 21.3%
[in-text-ad-2]

Source: traveler1116 / Getty Images
Ohio: Columbus
> Employment chg. 2013-2018: +10.4% (953,515 to 1.1 million)
> State employment chg. 2013-2018: +4.5% (5.3 million to 5.6 million)
> June unemployment: 4.1%
> Industry with largest employment increase: Transportation, warehousing, and utilities
> Employment growth in transportation, warehousing, and utilities: 23.5%

Source: Majestic_Aerials / Getty Images
Oklahoma: Oklahoma City
> Employment chg. 2013-2018: +6.5% (618,625 to 658,992)
> State employment chg. 2013-2018: +4.5% (1.7 million to 1.8 million)
> June unemployment: 3.3%
> Industry with largest employment increase: Other services
> Employment growth in other services: 29.3%
[in-text-ad]

Source: fdastudillo / Getty Images
Oregon: Bend-Redmond
> Employment chg. 2013-2018: +29.1% (70,714 to 91,322)
> State employment chg. 2013-2018: +15.4% (1.8 million to 2.0 million)
> June unemployment: 3.9%
> Industry with largest employment increase: Transportation, warehousing, and utilities
> Employment growth in transportation, warehousing, and utilities: 53.8%

Source: Dillon_Naber_Cruz / Getty Images
Pennsylvania: Lancaster
> Employment chg. 2013-2018: +6.4% (255,019 to 271,447)
> State employment chg. 2013-2018: +1.9% (6.0 million to 6.1 million)
> June unemployment: 3.2%
> Industry with largest employment increase: Transportation, warehousing, and utilities
> Employment growth in transportation, warehousing, and utilities: 35.4%

Source: SeanPavonePhoto / Getty Images
Rhode Island: Providence-Warwick
> Employment chg. 2013-2018: +8.0% (616,857 to 665,982)
> State employment chg. 2013-2018: +6.9% (502,147 to 536,972)
> June unemployment: 4.0%
> Industry with largest employment increase: Transportation, warehousing, and utilities
> Employment growth in transportation, warehousing, and utilities: 37.0%
[in-text-ad-2]

Source: stonena7 / Getty Images
South Carolina: Hilton Head Island-Bluffton-Beaufort
> Employment chg. 2013-2018: +15.1% (74,229 to 85,460)
> State employment chg. 2013-2018: +9.9% (2.0 million to 2.2 million)
> June unemployment: 3.0%
> Industry with largest employment increase: Government
> Employment growth in government: 3.6%

Source: DenisTangneyJr / Getty Images
South Dakota: Sioux Falls
> Employment chg. 2013-2018: +10.2% (133,502 to 147,137)
> State employment chg. 2013-2018: +4.2% (427,395 to 445,496 )
> June unemployment: 2.5%
> Industry with largest employment increase: Other services
> Employment growth in other services: 17.0%
[in-text-ad]

Source: DenisTangneyJr / Getty Images
Tennessee: Nashville-Davidson–Murfreesboro–Franklin
> Employment chg. 2013-2018: +18.2% (855,020 to 1.0 million)
> State employment chg. 2013-2018: +10.3% (2.9 million to 3.2 million)
> June unemployment: 2.8%
> Industry with largest employment increase: Transportation, warehousing, and utilities
> Employment growth in transportation, warehousing, and utilities: 39.0%
 24/7 Wall St.
Source: RoschetzkyIstockPhoto / Getty Images
Texas: Austin-Round Rock
> Employment chg. 2013-2018: +19.6% (966,562 to 1.2 million)
> State employment chg. 2013-2018: +10.3% (12.1 million to 13.3 million)
> June unemployment: 3.0%
> Industry with largest employment increase: Transportation, warehousing, and utilities
> Employment growth in transportation, warehousing, and utilities: 42.6%
Source: kenlund / Flickr
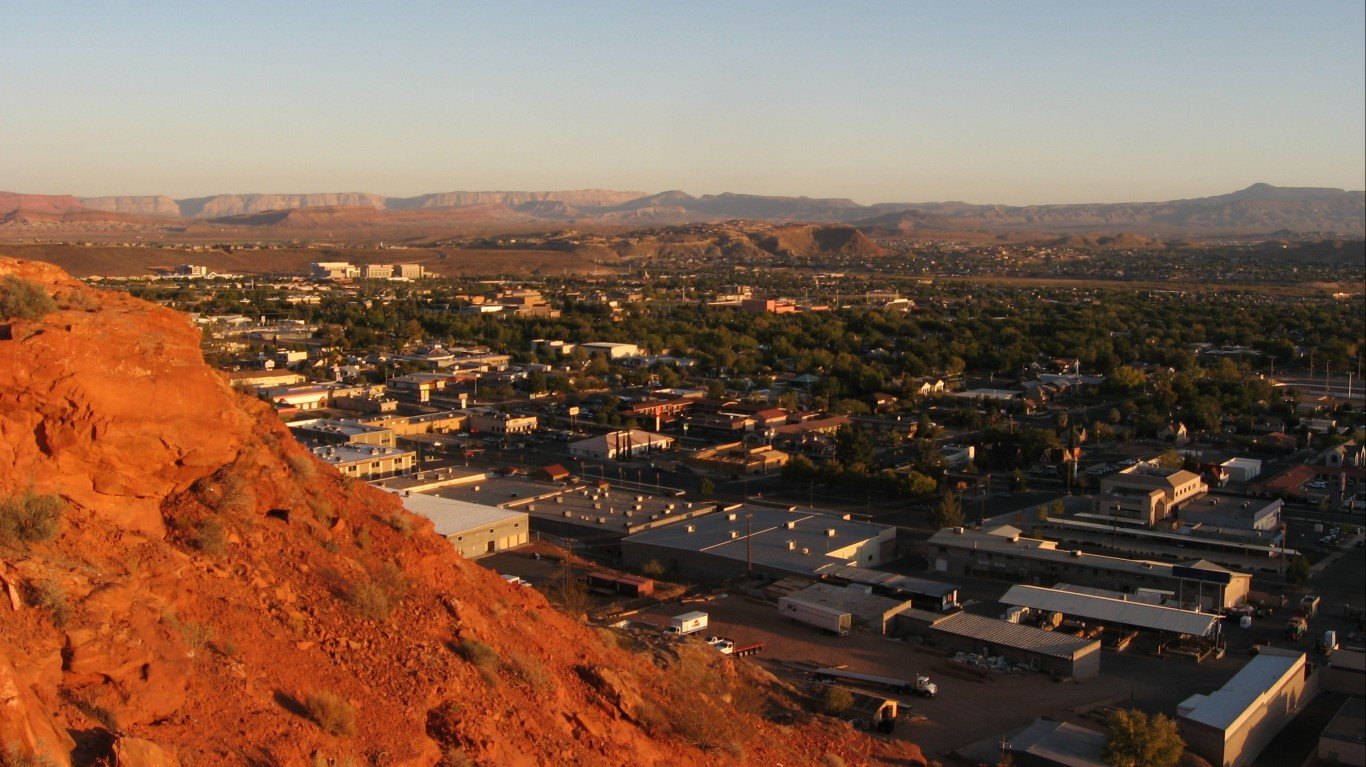
Utah: St. George
> Employment chg. 2013-2018: +27.2% (56,568 to 71,969)
> State employment chg. 2013-2018: +15.7% (1.3 million to 1.5 million)
> June unemployment: 3.4%
> Industry with largest employment increase: Transportation, warehousing, and utilities
> Employment growth in transportation, warehousing, and utilities: 48.3%
[in-text-ad-2]

Source: Sean Pavone / Getty Images
Vermont: Burlington-South Burlington
> Employment chg. 2013-2018: +3.6% (119,597 to 123,877)
> State employment chg. 2013-2018: +1.4% (333,604 to 338,332)
> June unemployment: 3.8%
> Industry with largest employment increase: Leisure and hospitality
> Employment growth in leisure and hospitality: 15.2%

Source: Joel Carillet / Getty Images
Virginia: Charlottesville
> Employment chg. 2013-2018: +10.3% (108,841 to 120,042)
> State employment chg. 2013-2018: +5.7% (4.0 million to 4.2 million)
> June unemployment: 2.7%
> Industry with largest employment increase: Leisure and hospitality
> Employment growth in leisure and hospitality: 24.8%
[in-text-ad]

Source: Erhoman / Getty Images
Washington: Wenatchee
> Employment chg. 2013-2018: +16.5% (51,631 to 60,144)
> State employment chg. 2013-2018: +11.4% (3.2 million to 3.6 million)
> June unemployment: 4.9%
> Industry with largest employment increase: Leisure and hospitality
> Employment growth in leisure and hospitality: 24.6%
 24/7 Wall St.
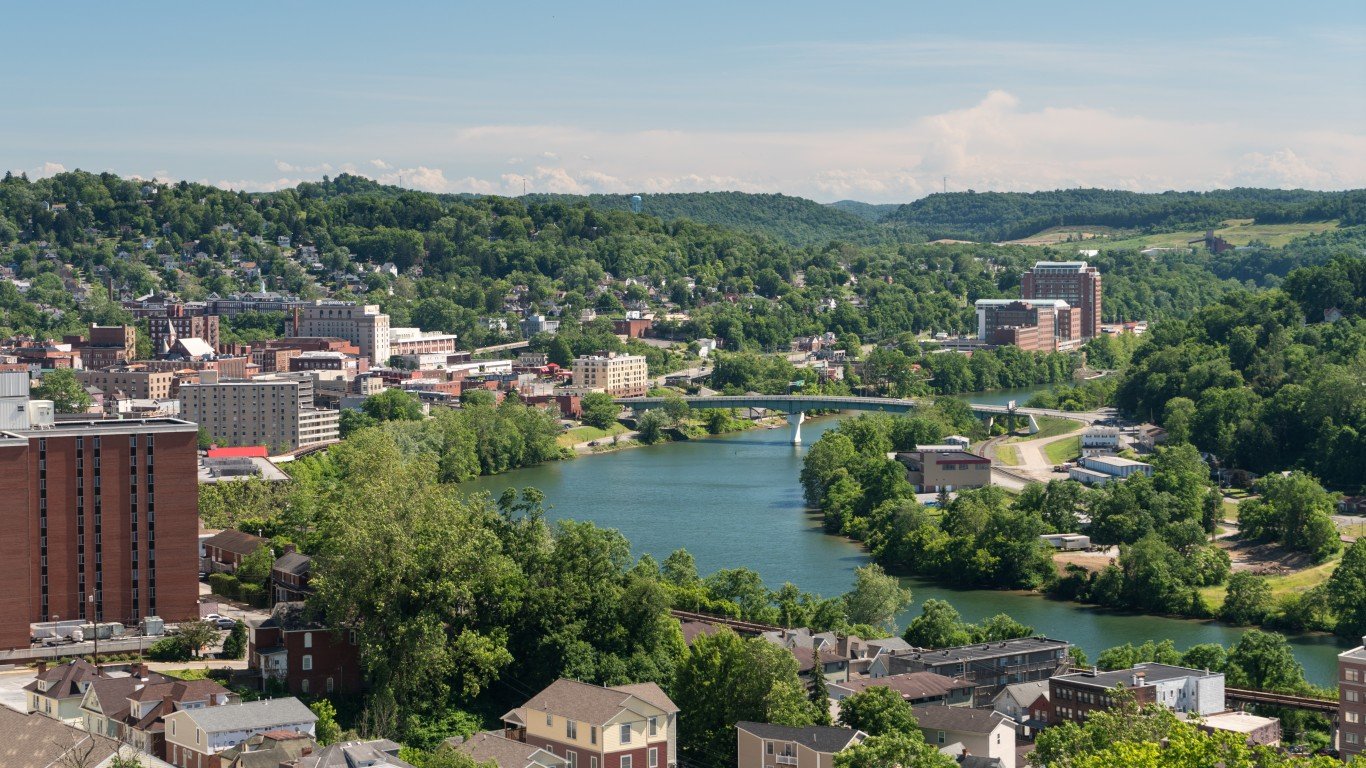
Source: BackyardProduction / Getty Images
West Virginia: Morgantown
> Employment chg. 2013-2018: +6.3% (62,288 to 66,181)
> State employment chg. 2013-2018: -0.4% (751,043 to 748,008)
> June unemployment: 4.3%
> Industry with largest employment increase: Education and health services
> Employment growth in education and health services: 16.2%

Source: RudyBalasko / Getty Images
Wisconsin: Madison
> Employment chg. 2013-2018: +10.5% (346,966 to 383,369)
> State employment chg. 2013-2018: +7.5% (2.9 million to 3.1 million)
> June unemployment: 2.3%
> Industry with largest employment increase: Information
> Employment growth in information: 24.8%
[in-text-ad-2]
Source: Davel5957 / Getty Images
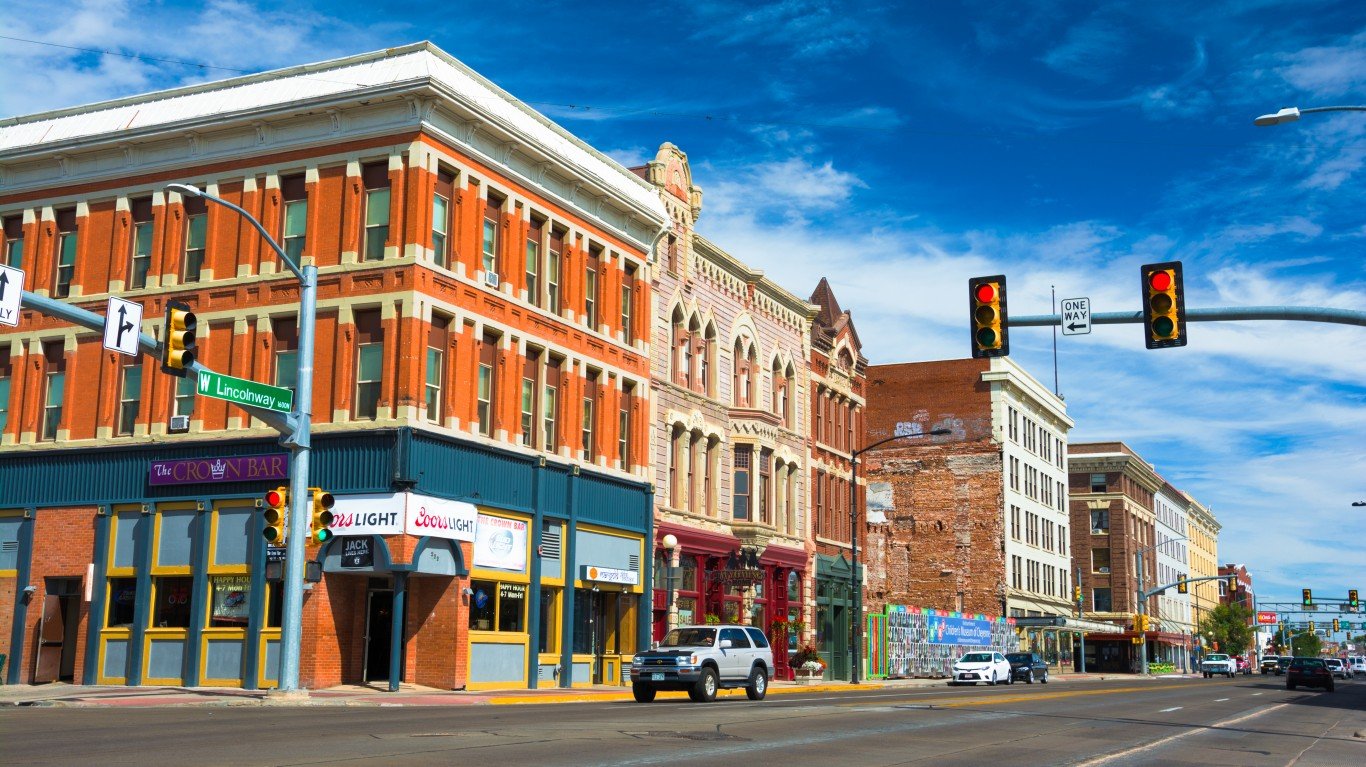
Wyoming: Cheyenne
> Employment chg. 2013-2018: -2.4% (46,141 to 45,038)
> State employment chg. 2013-2018: -5.9% (291,200 to 274,136)
> June unemployment: 3.8%
> Industry with largest employment increase: Professional and business services
> Employment growth in professional and business services: 8.6%
Detailed Findings
The majority of cities adding the most jobs are growing rapidly. The U.S. population expanded by 3% from 2013 to 2017. In 34 of the 50 metro areas on this list, population growth outpaced national population growth. Population growth can drive up demand for services, and contributed to employment surges in such industries as construction and transportation, warehousing, and utilities in many cities on this list.
In each of the metro areas on this list where employment has increased, job growth has resulted in a lower unemployment rate. Five-year declines in unemployment range from 0.5 percentage points to 6.3 percentage points.
Reduced joblessness appears to have had a meaningful impact on the overall quality of life in the cities on this list. In over half of the cities adding the most jobs in each state, the poverty rate fell by as much or more than the 1.8 percentage point national decline. Only six cities on this list reported an uptick in poverty over the last five years.
While most states have at least one metro area that added jobs more rapidly than the state as a whole, there are a handful of outliers. Among them are Delaware, New Hampshire, Rhode Island, and Vermont. These states are distinct in that each of them have only one metro area. But, with the exception of Delaware, these smaller U.S. states followed a similar pattern as the rest of the country: metro-area hiring grew much faster compared to the statewide average over the past five years.
While employment in the Dover metro area grew 12.1% over the past five years — slower than the statewide average of 13.9% — that figure is still well above the comparable 8.0% national employment growth.
Just because a metro area added jobs more rapidly than anywhere else in the state does not necessarily mean it added jobs faster than the nation as a whole. In 16 cities on this list — including the metro areas in New Hampshire, Rhode Island, and Vermont — five-year job growth trailed the comparable 8.0% national growth.
The other exceptions on this list are Anchorage, Alaska and Cheyenne, Wyoming where the number of jobs actually declined by 1.1% and 2.4% respectively from 2013 to 2018. Employment declines in those states fit into the broader statewide patterns as employment fell 1.4% in Alaska and 5.9% in Wyoming over the last five years.
Methodology
To determine the cities adding the most jobs in every state, 24/7 Wall St. reviewed employment growth for 381 metropolitan statistical areas for the period of May 2013 to May 2018 with data from the Bureau of Labor Statistics. Supplementary data on unemployment and employment by industry also came from the BLS. We also reviewed 2013 and 2016 poverty rates and households earning $200,000 or more per year from the U.S. Census Bureau’s American Community Survey. Population estimates come from Census Bureau data for July 2013 and July 2017.
Take This Retirement Quiz To Get Matched With A Financial Advisor (Sponsored)
Take the quiz below to get matched with a financial advisor today.
Each advisor has been vetted by SmartAsset and is held to a fiduciary standard to act in your best interests.
Here’s how it works:
1. Answer SmartAsset advisor match quiz
2. Review your pre-screened matches at your leisure. Check out the
advisors’ profiles.
3. Speak with advisors at no cost to you. Have an introductory call on the phone or introduction in person and choose whom to work with in the future
Take the retirement quiz right here.
Thank you for reading! Have some feedback for us?
Contact the 24/7 Wall St. editorial team.
Editors' Picks

