
August 2018 marked the 94th consecutive month of job growth in the United States, a record high. The narrative of a nearly eight-year-long hiring boom does not tell the whole story, however, as the jobs picture in dozens of cities represents a stark departure from the broader national trend.
Overall employment climbed by 1.6% in the United States from July 2017 to July 2018 — and by nearly 10% in the last half decade. Largely as a result, the U.S. unemployment rate stands at 3.9% — down from 4.3% a year ago and 7.3% in July 2013.
Meanwhile, in over 50 major cities, the unemployment rate remains above 5% — a level not seen nationwide since the summer of 2015. In a similar number of cities, total employment has slumped in the last year as jobs are vanishing.
To identify the worst cities to find a job, 24/7 Wall St. reviewed the U.S. metropolitan areas that either had relatively steep employment declines in the last year, high unemployment, or both. Not confined to a single region, the 25 cities on this list span 14 states from coast to coast.
Click here to see the worst cities to find a job.
Click here to see our detailed findings and methodology.
Source: Nicholas Krotki / Shutterstock.com
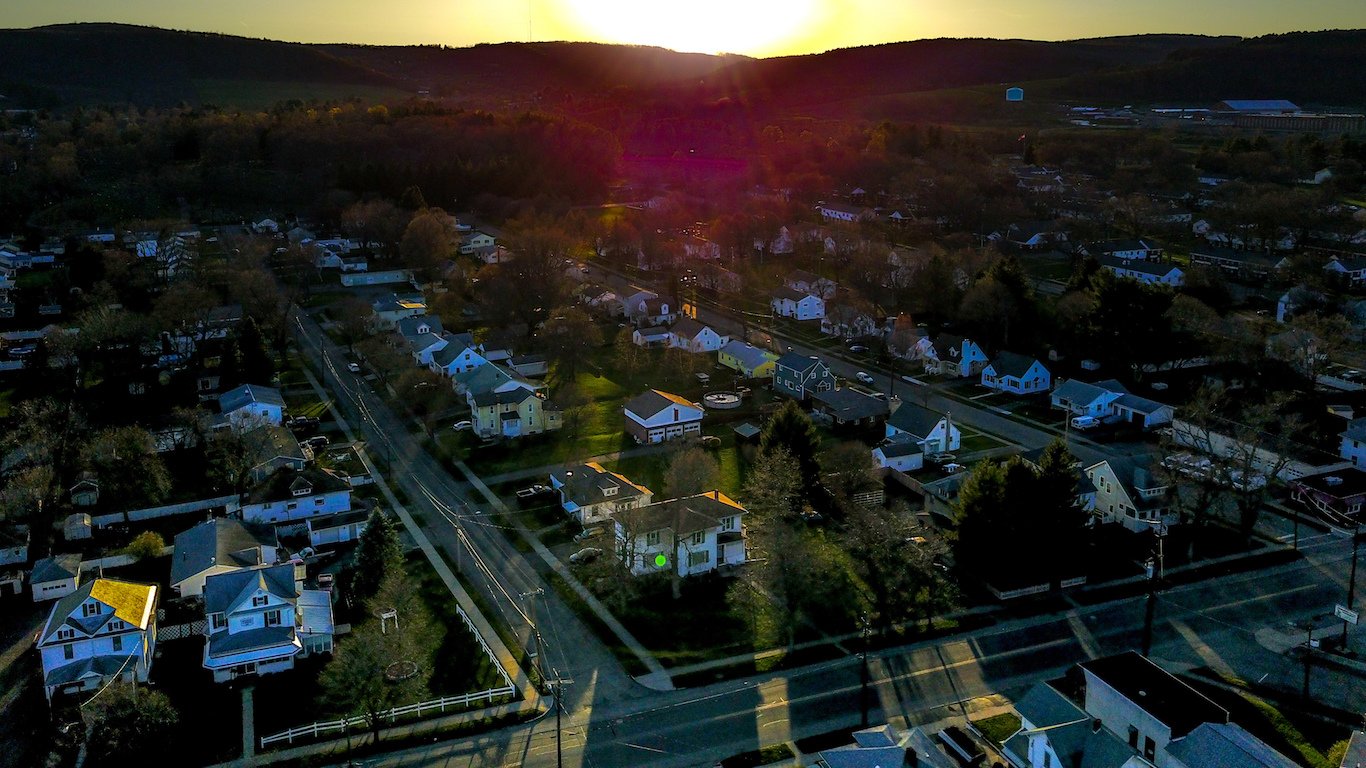
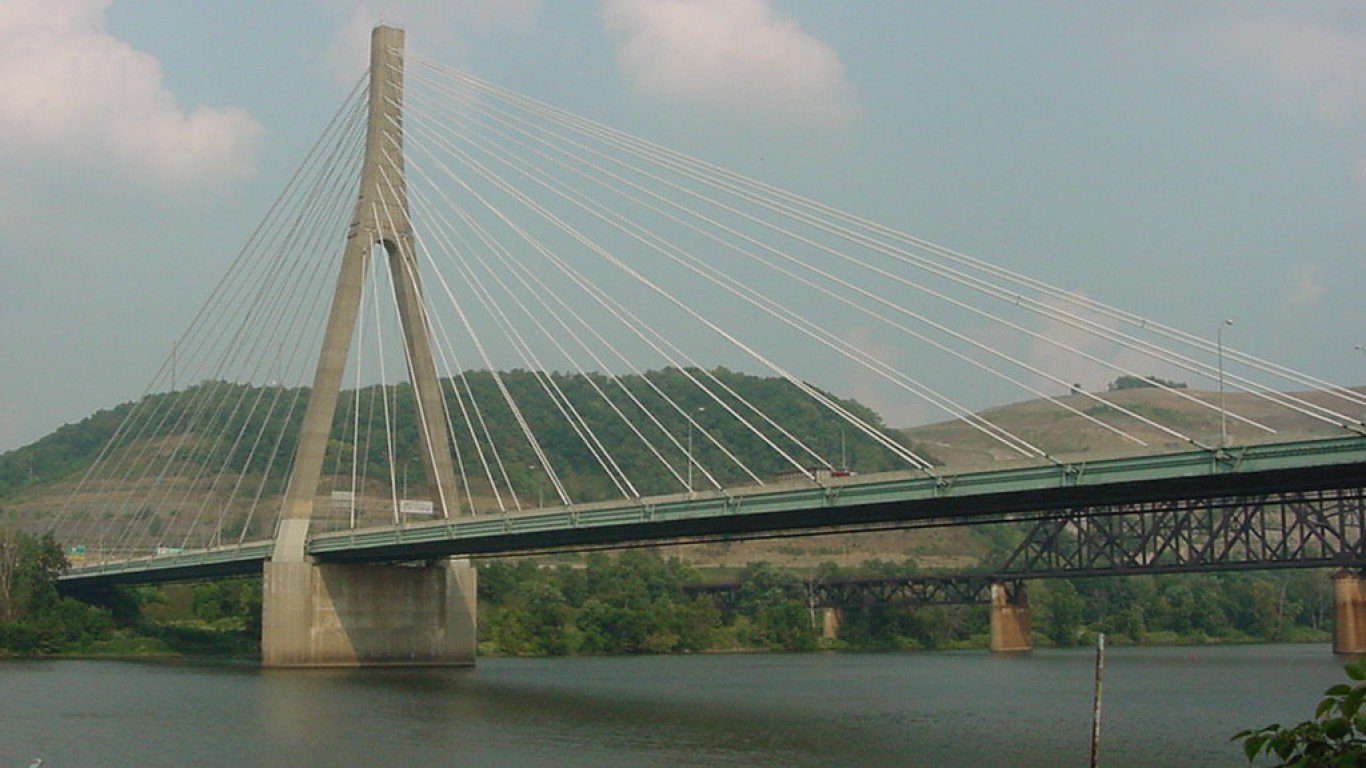
25. Elmira, New York
> July 2018 unemployment: 4.8%
> Labor force: 35,227
> Number unemployed: 1,676
> 1-year employment change: -1.2%
[in-text-ad]
Source: Public Domain / Wikimedia Commons
24. Watertown-Fort Drum, New York
> July 2018 unemployment: 5.7%
> Labor force: 44,733
> Number unemployed: 2,558
> 1-year employment change: -0.5%
Source: Davel5957 / Getty Images
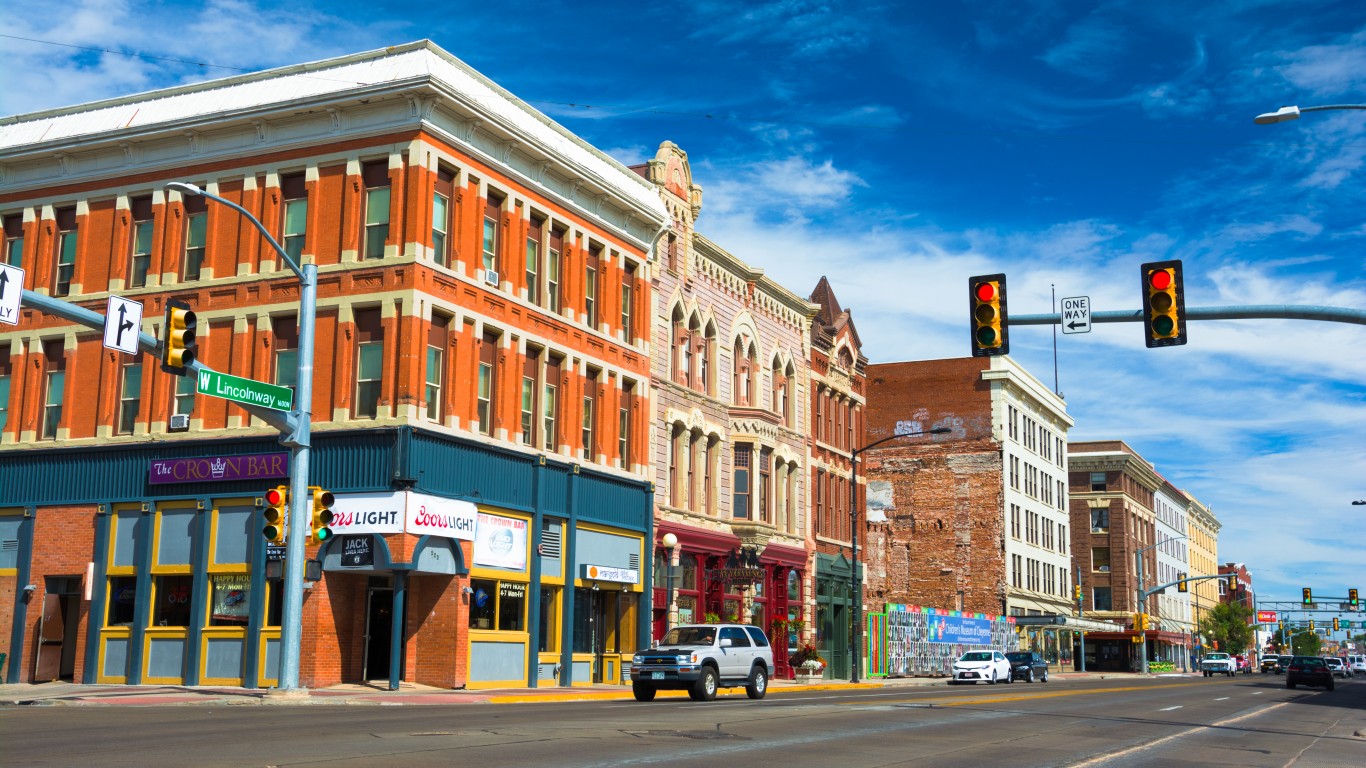
23. Cheyenne, Wyoming
> July 2018 unemployment: 3.9%
> Labor force: 46,791
> Number unemployed: 1,814
> 1-year employment change: -2.2%
Source: User Youngamerican on en.wikipedia / Wikimedia Commons
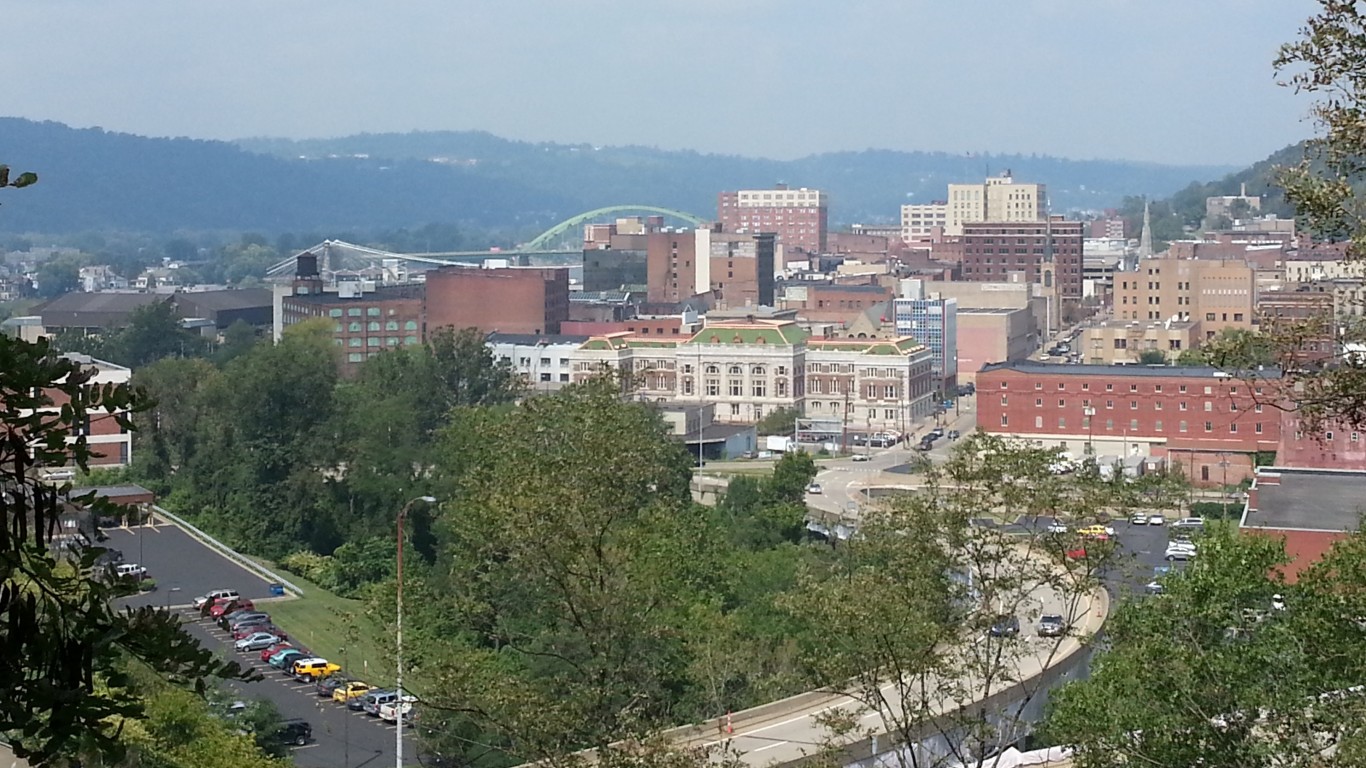
22. Huntington-Ashland, West Virginia
> July 2018 unemployment: 5.7%
> Labor force: 146,655
> Number unemployed: 8,300
> 1-year employment change: -0.5%
[in-text-ad-2]
Source: DenisTangneyJr / Getty Images
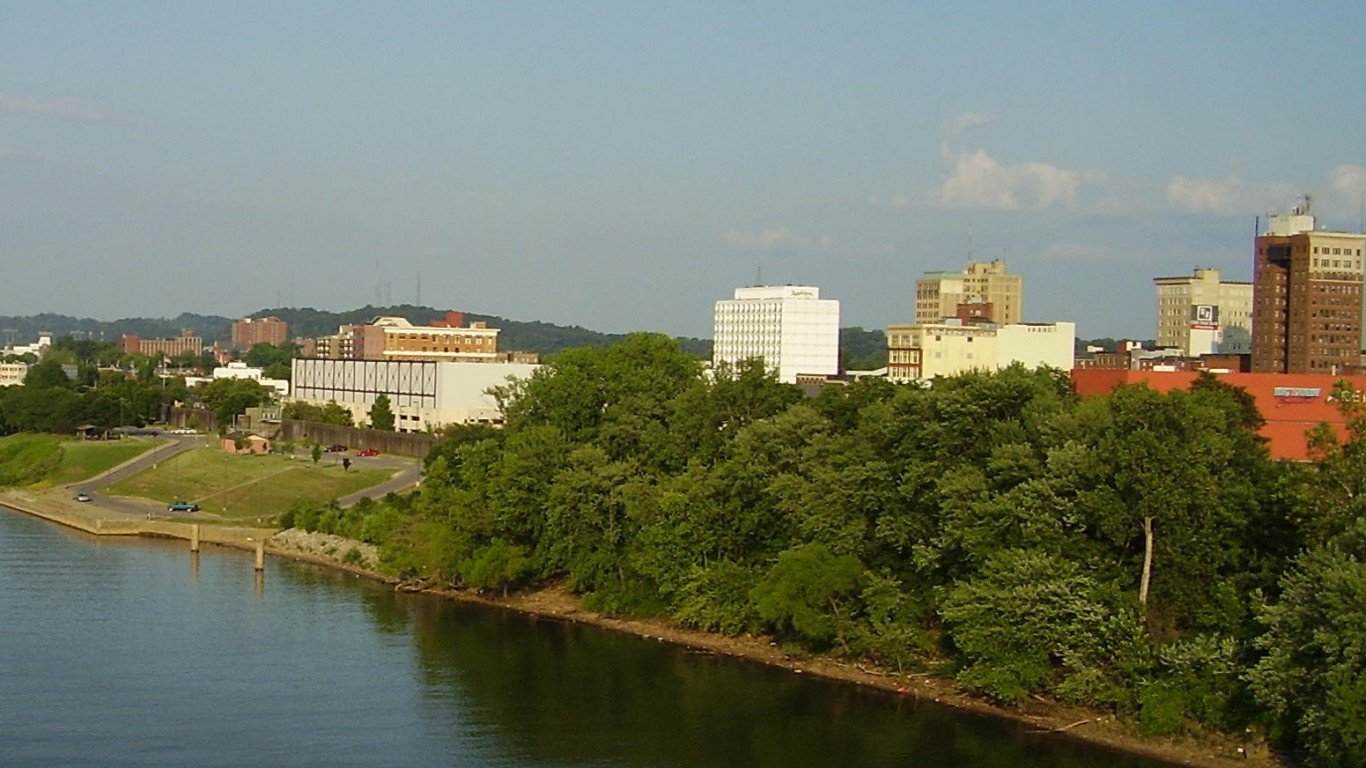
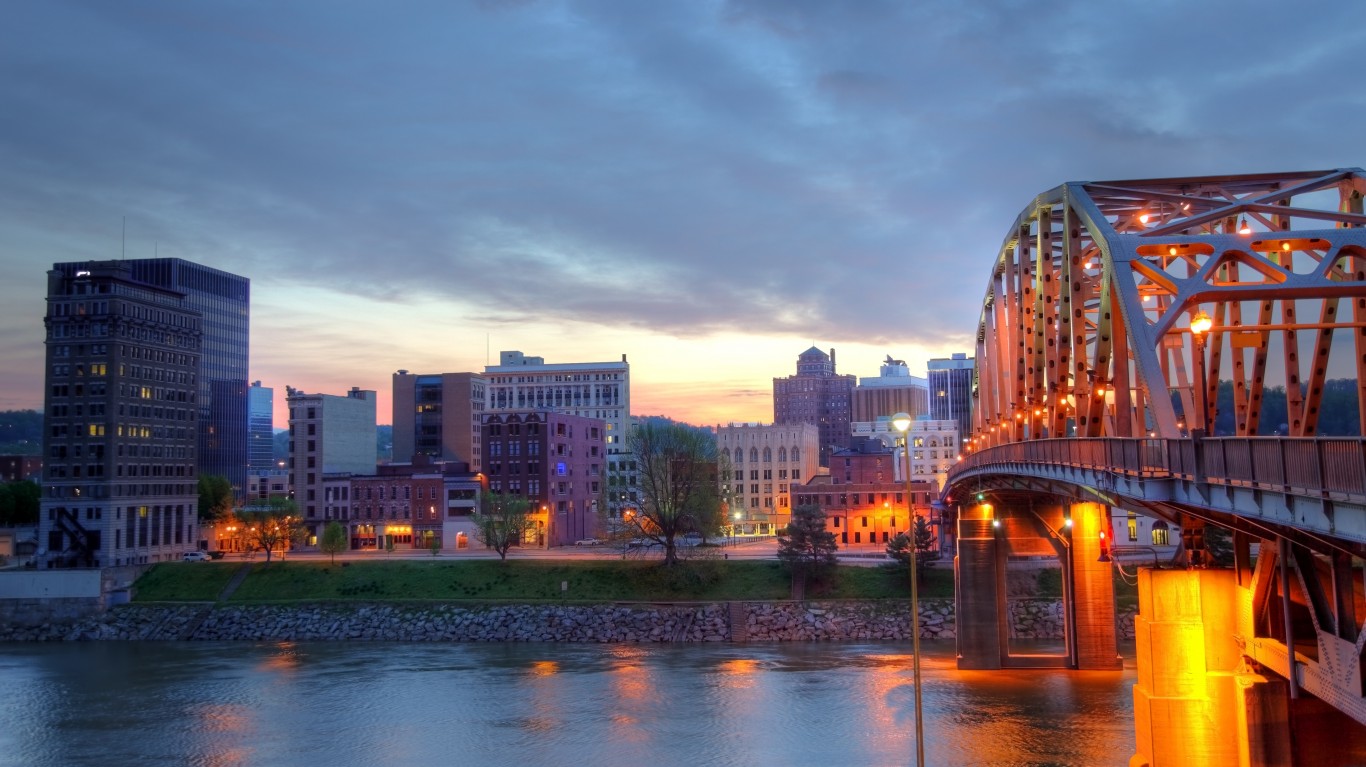
21. Charleston, West Virginia
> July 2018 unemployment: 5.4%
> Labor force: 94,658
> Number unemployed: 5,157
> 1-year employment change: -0.9%
Source: Paul Sableman / Wikimedia Commons
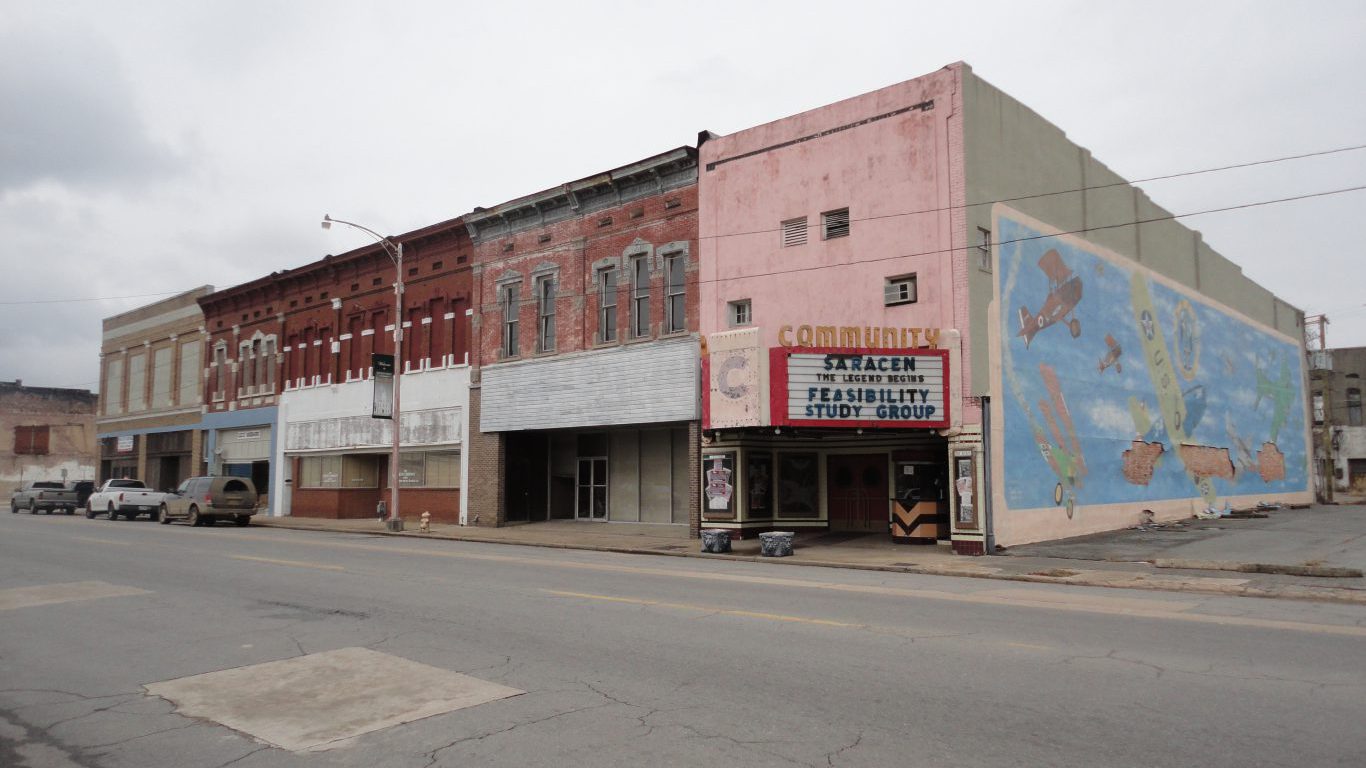
20. Pine Bluff, Arkansas
> July 2018 unemployment: 4.8%
> Labor force: 34,789
> Number unemployed: 1,661
> 1-year employment change: -1.5%
[in-text-ad]
Source: David Wilson from Oak Park, Illinois, USA / Wikimedia Commons
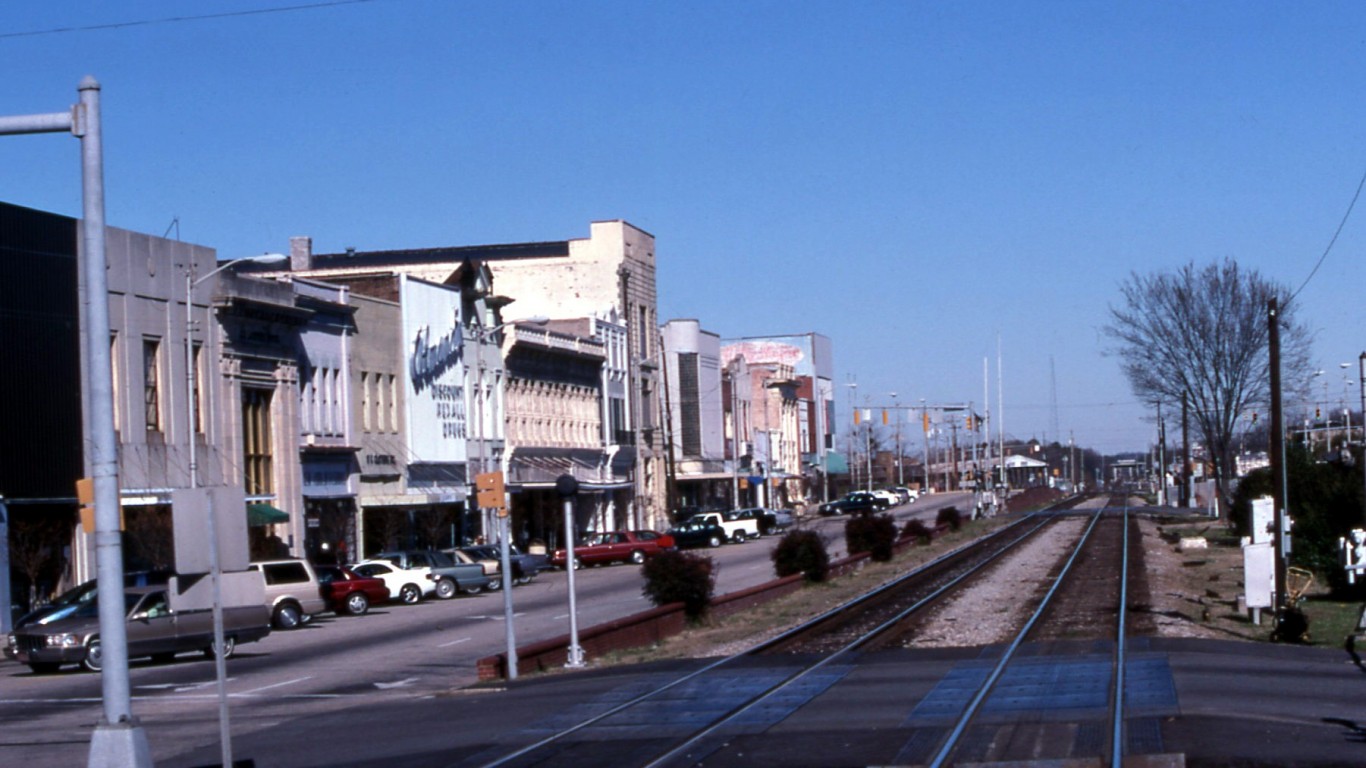
19. Rocky Mount, North Carolina
> July 2018 unemployment: 5.7%
> Labor force: 64,610
> Number unemployed: 3,682
> 1-year employment change: -0.7%
 24/7 Wall St.
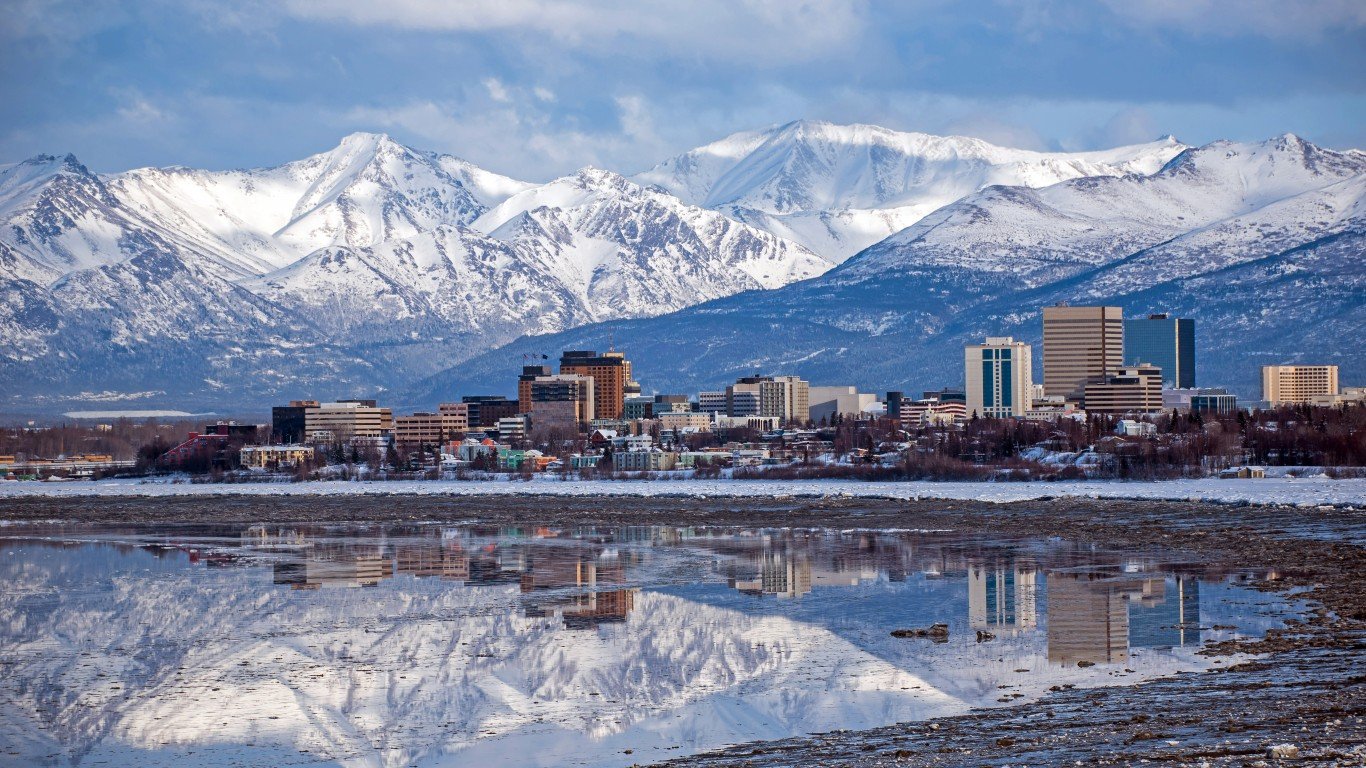
Source: Chilkoot / Getty Images
18. Anchorage, Alaska
> July 2018 unemployment: 5.8%
> Labor force: 200,202
> Number unemployed: 11,600
> 1-year employment change: -0.7%
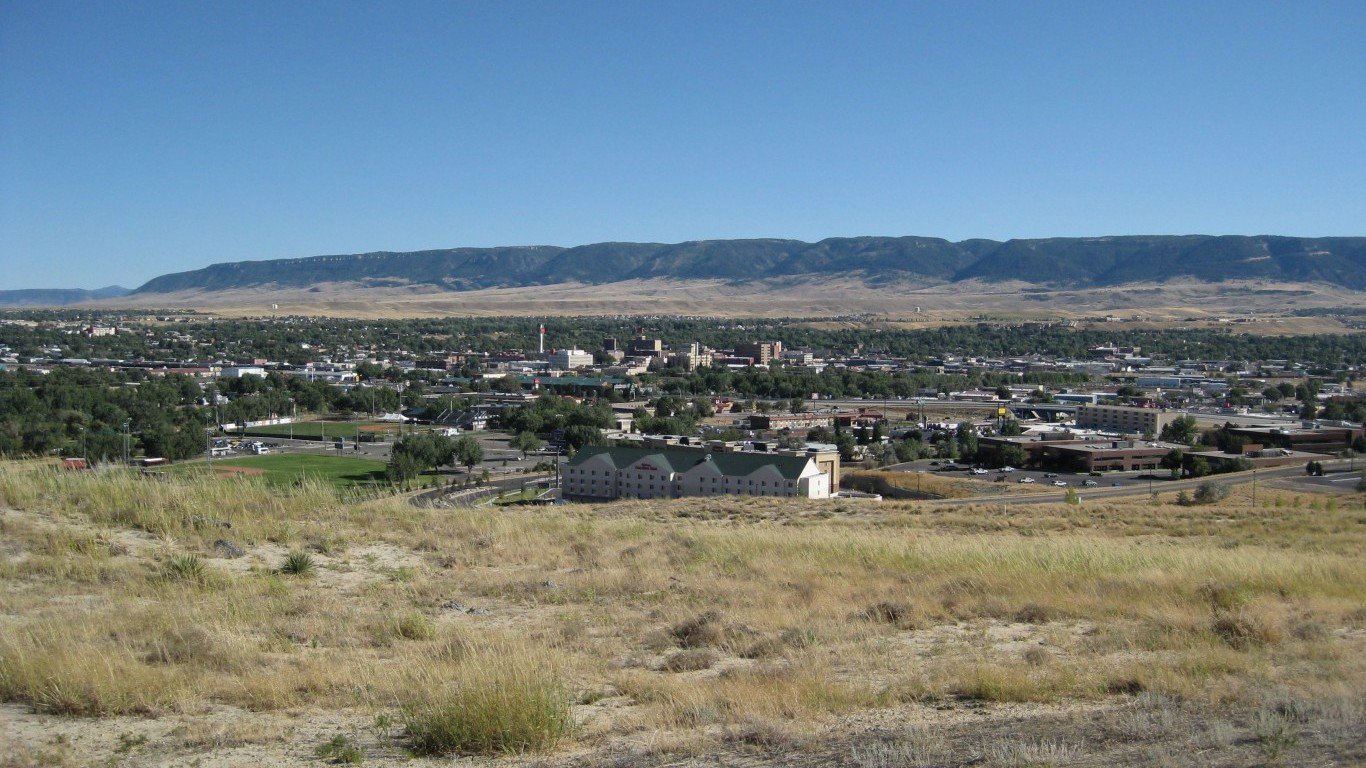
Source: Phillip Stewart / Flickr
17. Casper, Wyoming
> July 2018 unemployment: 4.6%
> Labor force: 38,513
> Number unemployed: 1,761
> 1-year employment change: -1.8%
[in-text-ad-2]
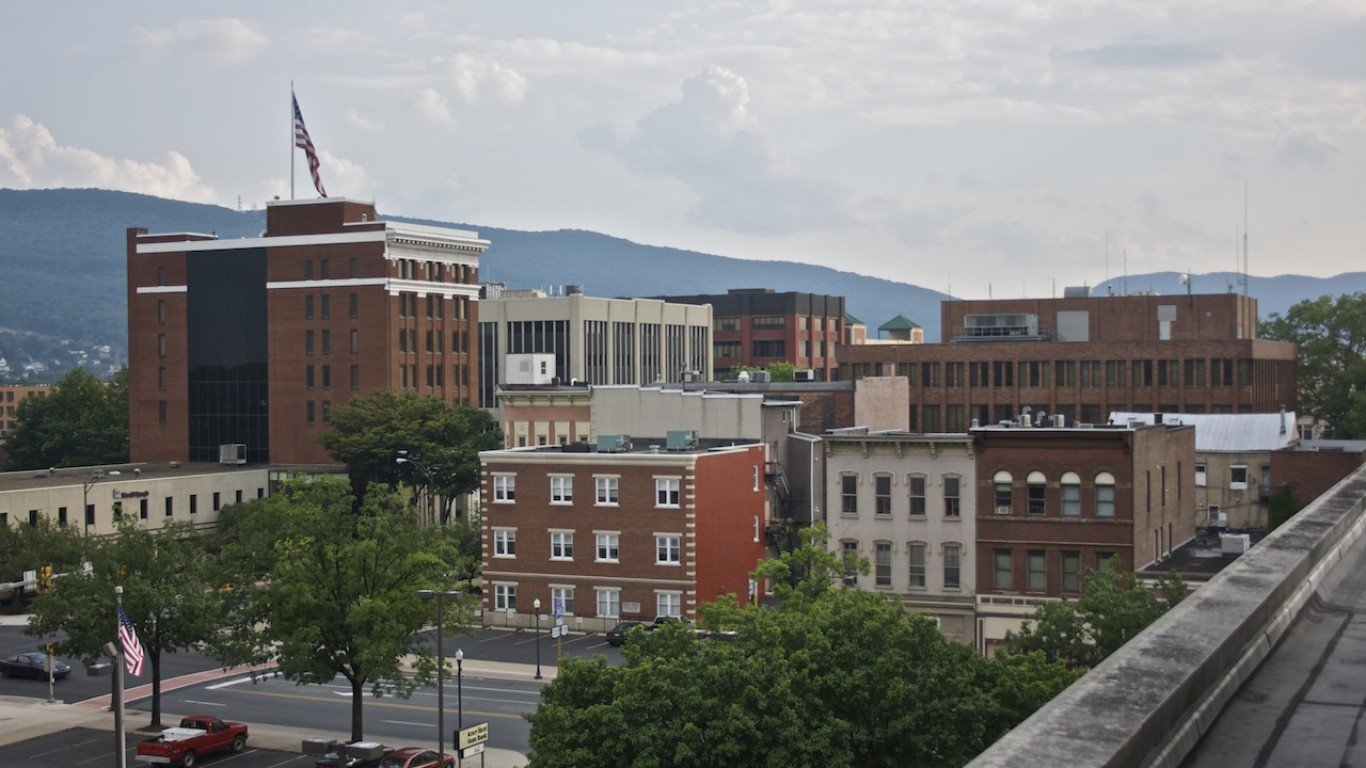
Source: Djorion / Wikimedia Commons
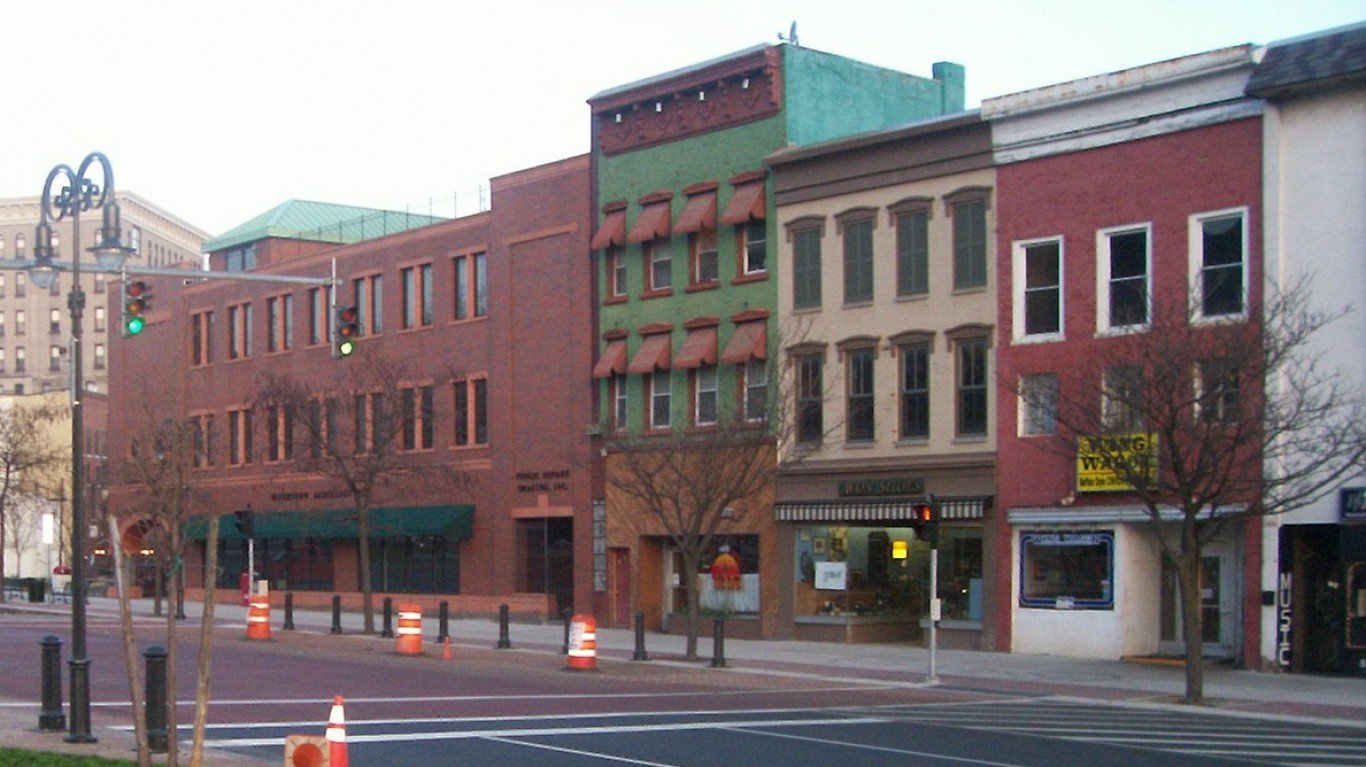
16. Williamsport, Pennsylvania
> July 2018 unemployment: 4.6%
> Labor force: 55,934
> Number unemployed: 2,574
> 1-year employment change: -2.0%
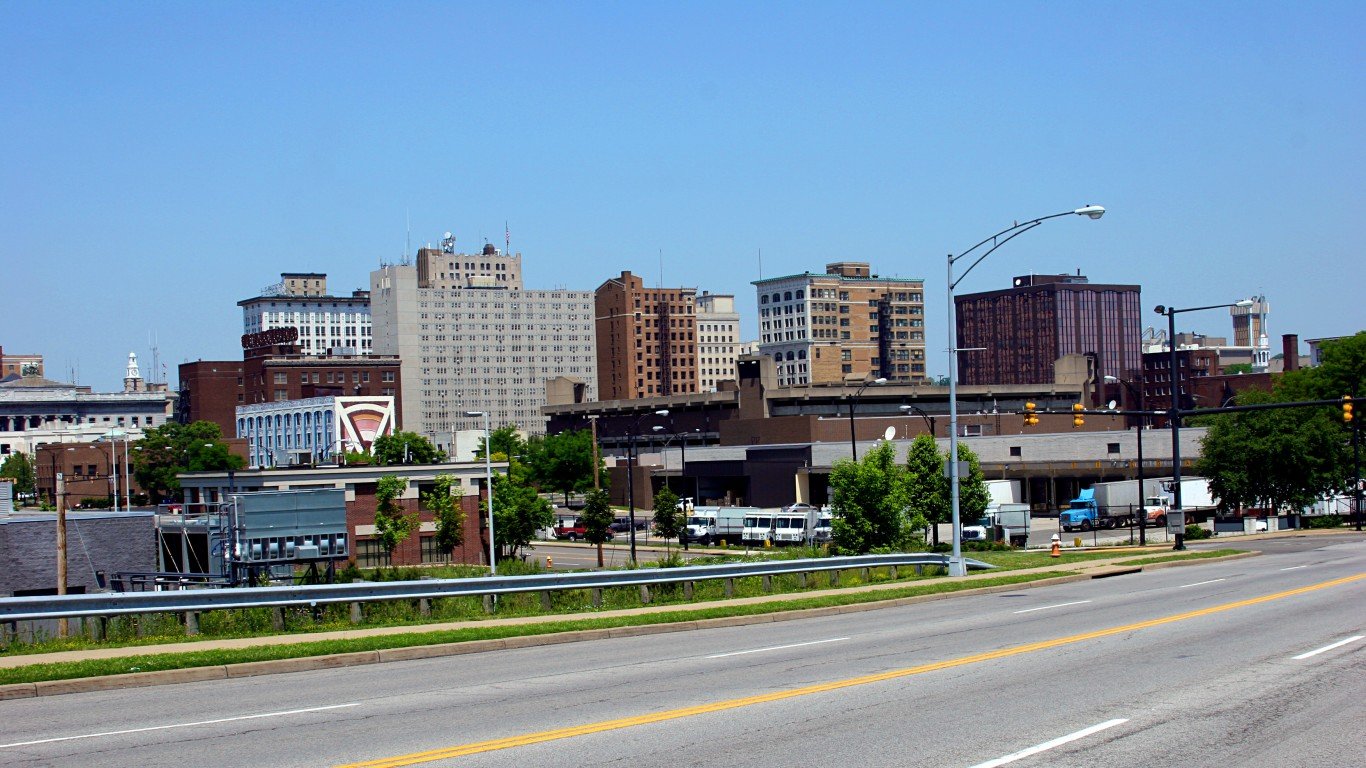
Source: Brandon W. Holmes / Wikimedia Commons
15. Wheeling, West Virginia
> July 2018 unemployment: 5.6%
> Labor force: 64,385
> Number unemployed: 3,598
> 1-year employment change: -1.1%
[in-text-ad]
Source: ftwitty / Getty Images
14. Youngstown-Warren-Boardman, Ohio
> July 2018 unemployment: 5.8%
> Labor force: 241,002
> Number unemployed: 14,031
> 1-year employment change: -0.9%
 24/7 Wall St.
Source: DMartinez-Photo / Getty Images
13. Fairbanks, Alaska
> July 2018 unemployment: 5.7%
> Labor force: 45,892
> Number unemployed: 2,600
> 1-year employment change: -1.1%
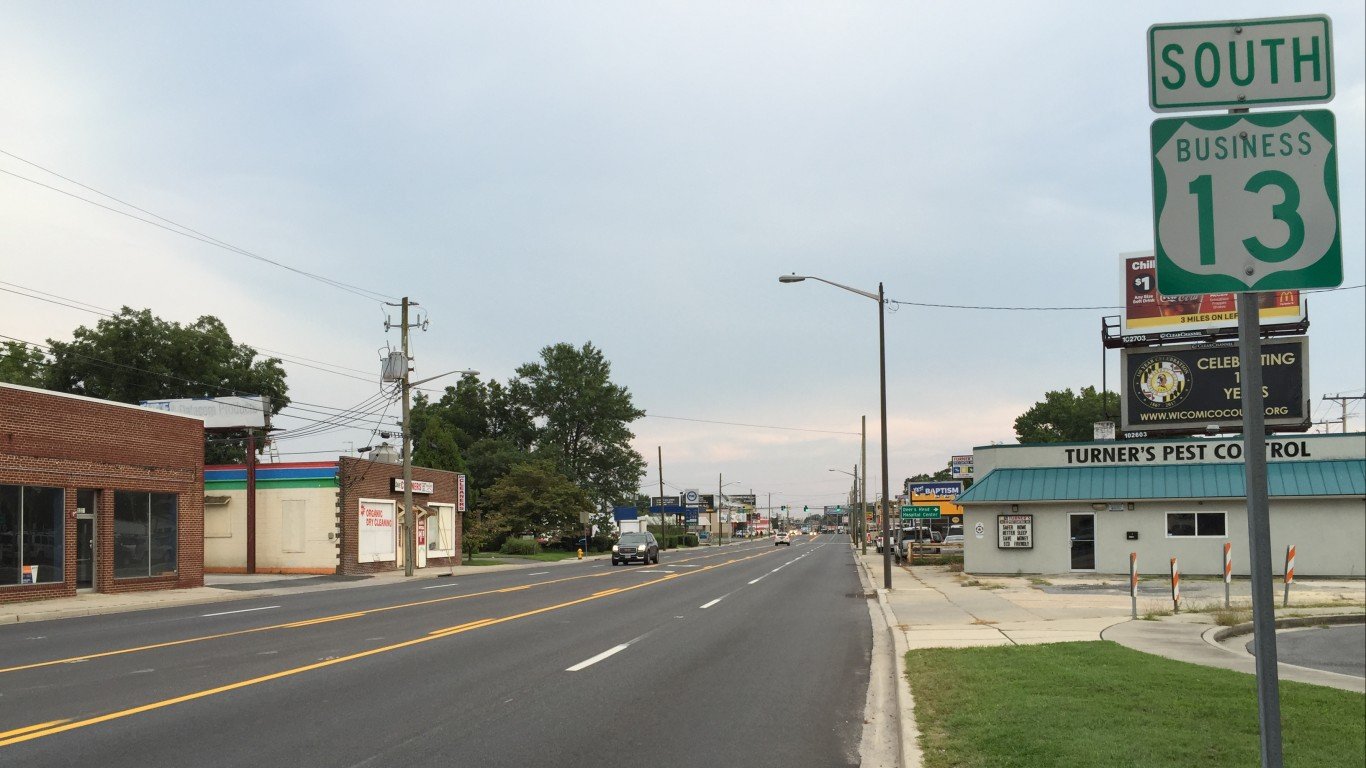
Source: Famartin / Wikimedia Commons
12. Salisbury, Maryland
> July 2018 unemployment: 5.3%
> Labor force: 187,247
> Number unemployed: 9,994
> 1-year employment change: -1.5%
[in-text-ad-2]
Source: VISALIA2010 / Wikimedia Commons
11. Visalia-Porterville, California
> July 2018 unemployment: 9.5%
> Labor force: 207,430
> Number unemployed: 19,788
> 1-year employment change: 2.2%
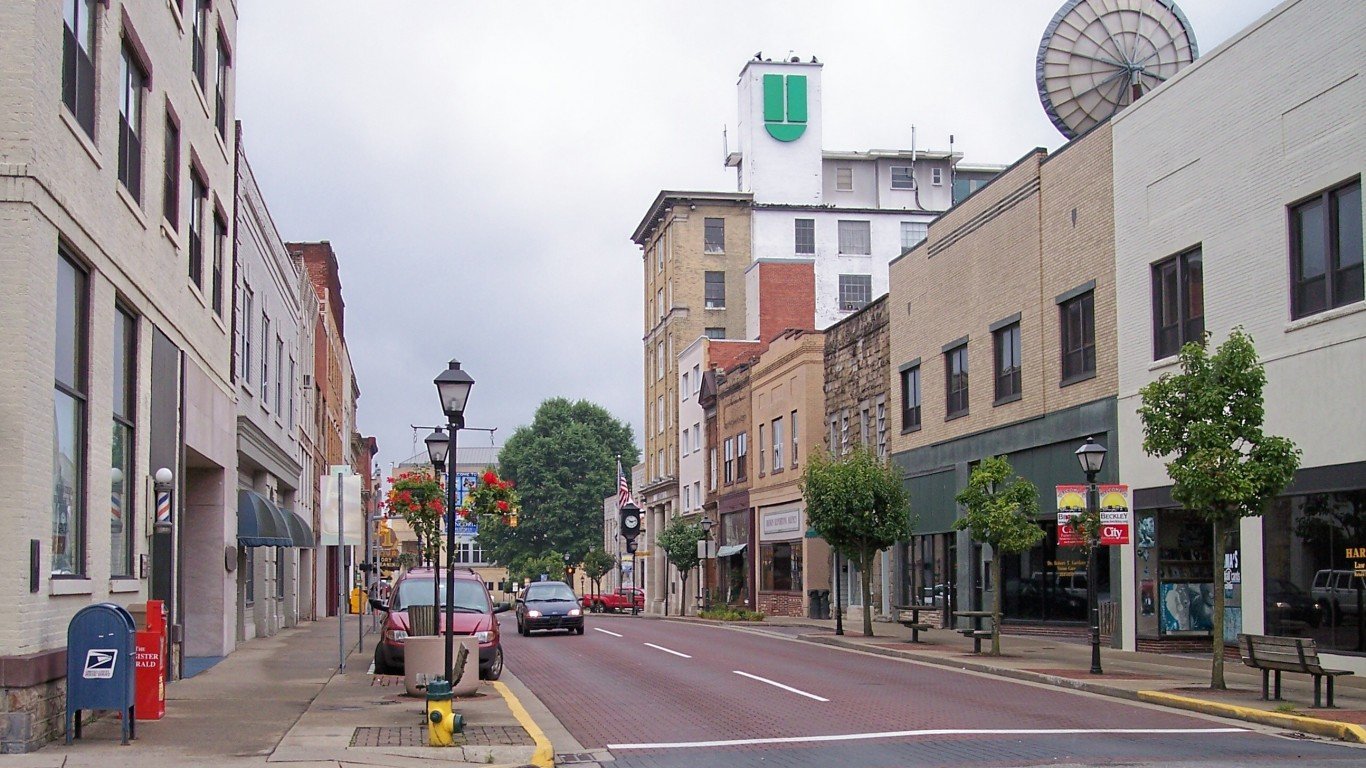
Source: Tim Kiser (w:User:Malepheasant) / Wikimedia Commons
10. Beckley, West Virginia
> July 2018 unemployment: 6.0%
> Labor force: 45,148
> Number unemployed: 2,715
> 1-year employment change: -1.0%
[in-text-ad]

Source: digidreamgrafix / Getty Images
9. Spokane-Spokane Valley, Washington
> July 2018 unemployment: 5.3%
> Labor force: 259,617
> Number unemployed: 13,694
> 1-year employment change: -1.6%
Source: Justin Sullivan / Getty Images
8. Yuba City, California
> July 2018 unemployment: 7.2%
> Labor force: 74,018
> Number unemployed: 5,303
> 1-year employment change: 0.1%
Source: Public Domain / Wikimedia Commons
7. Weirton-Steubenville, West Virginia
> July 2018 unemployment: 6.4%
> Labor force: 50,497
> Number unemployed: 3,231
> 1-year employment change: -1.0%
[in-text-ad-2]
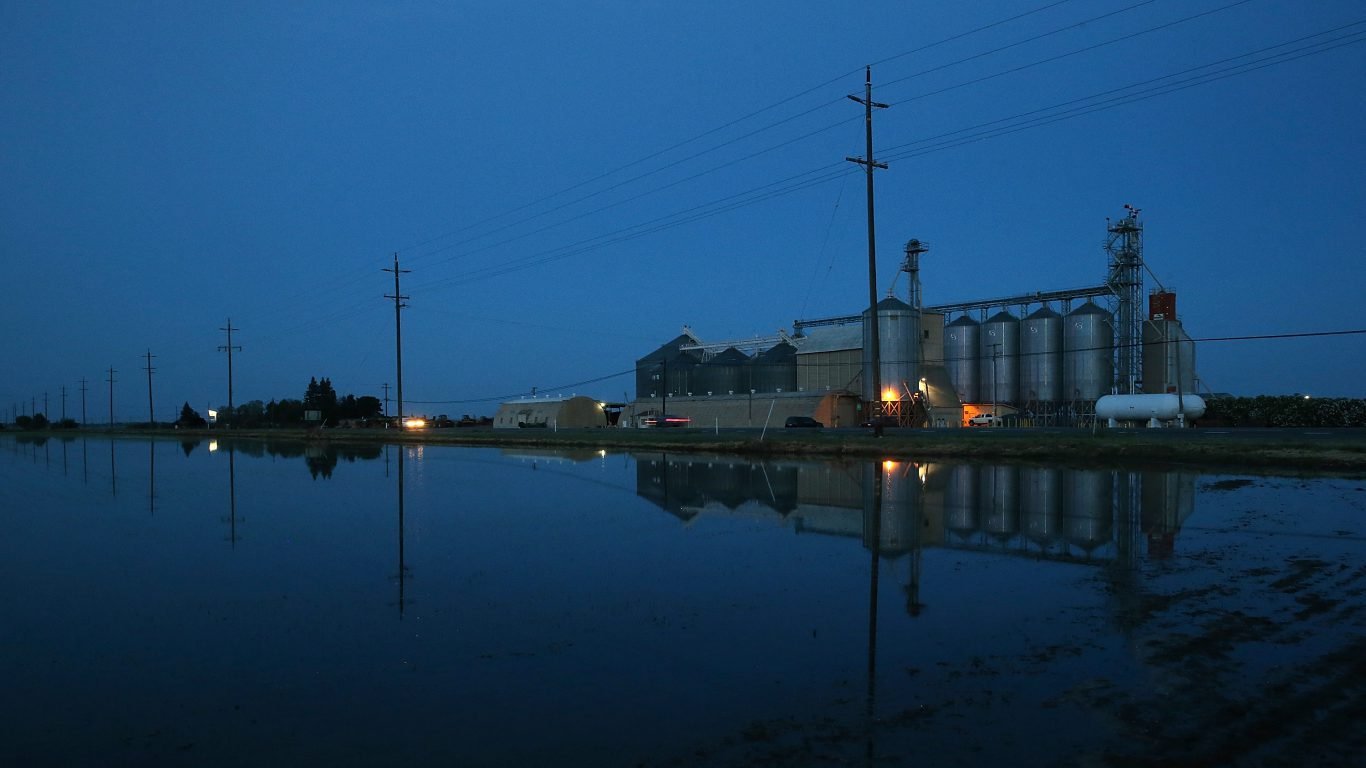
Source: Wikimedia Commons
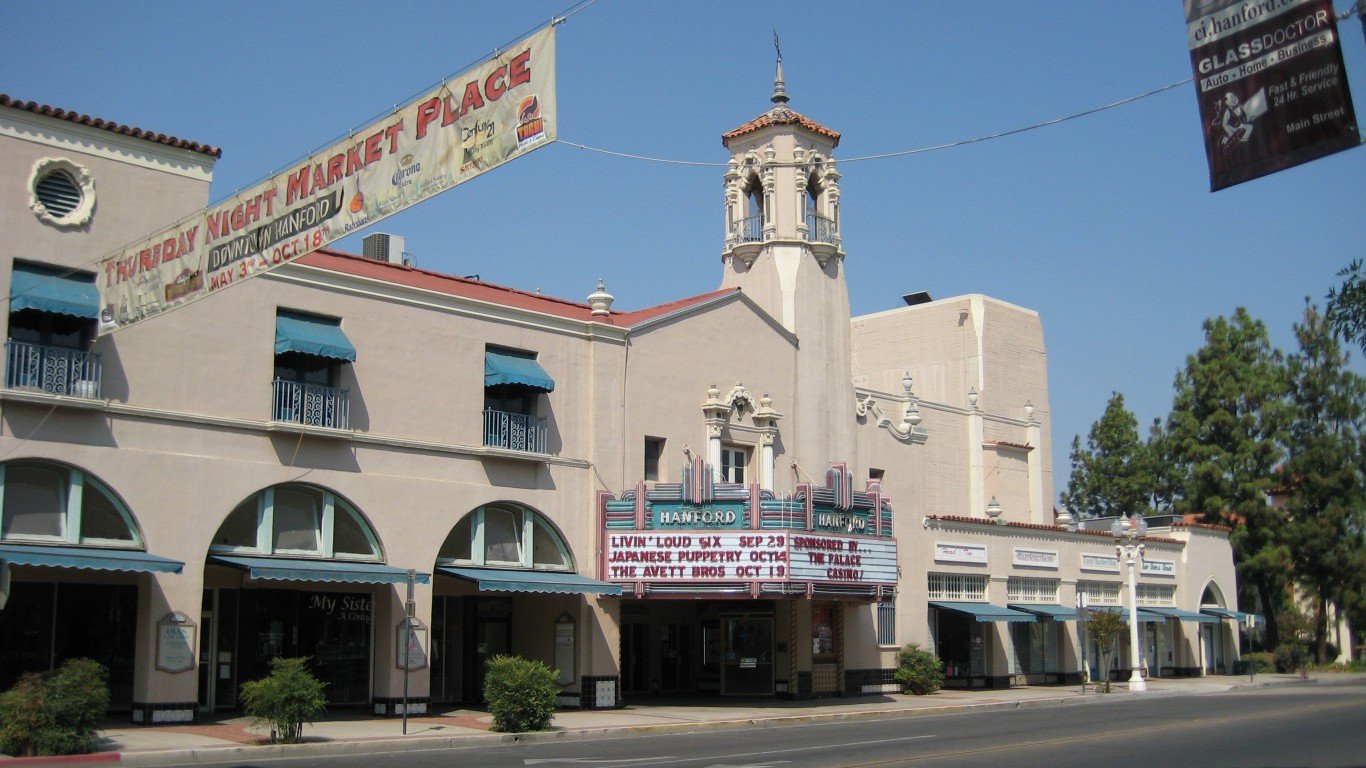
6. Hanford-Corcoran, California
> July 2018 unemployment: 8.0%
> Labor force: 57,184
> Number unemployed: 4,594
> 1-year employment change: -0.1%

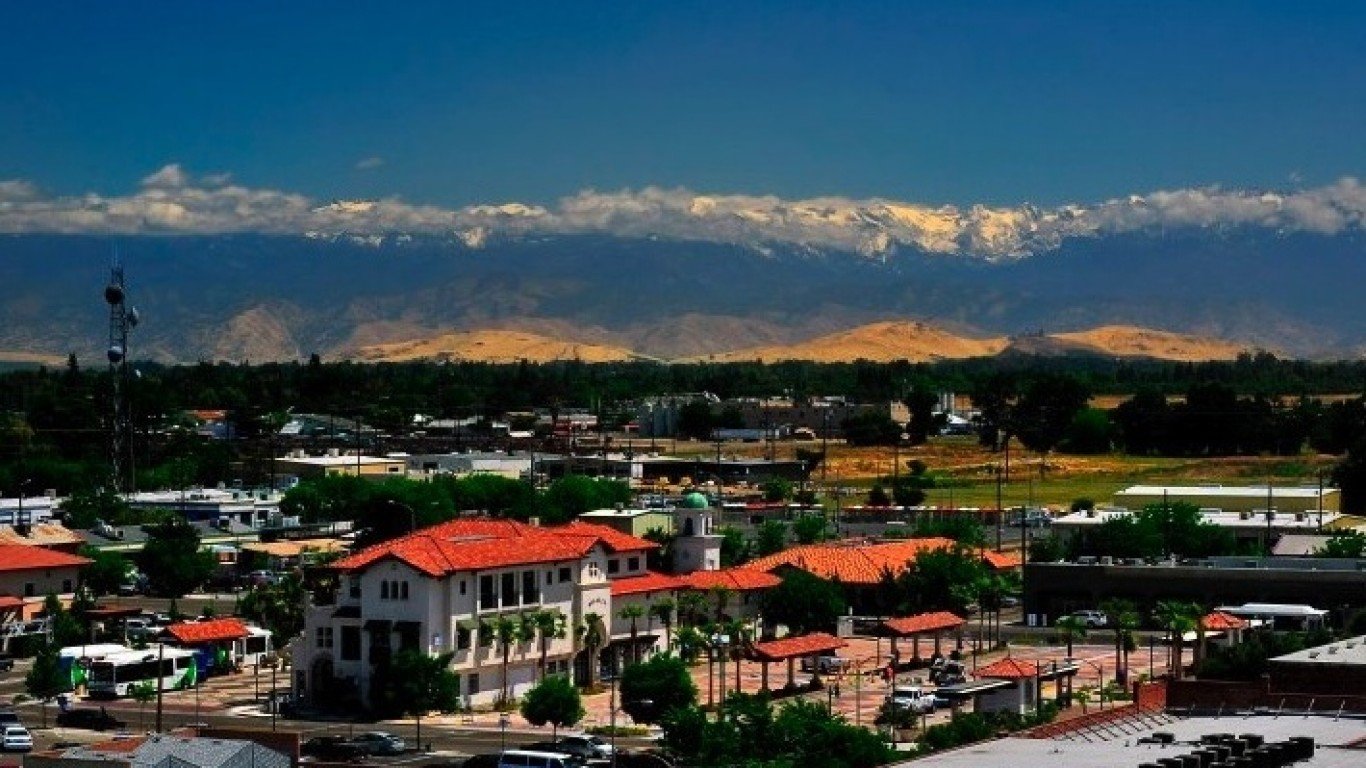
Source: Thinkstock
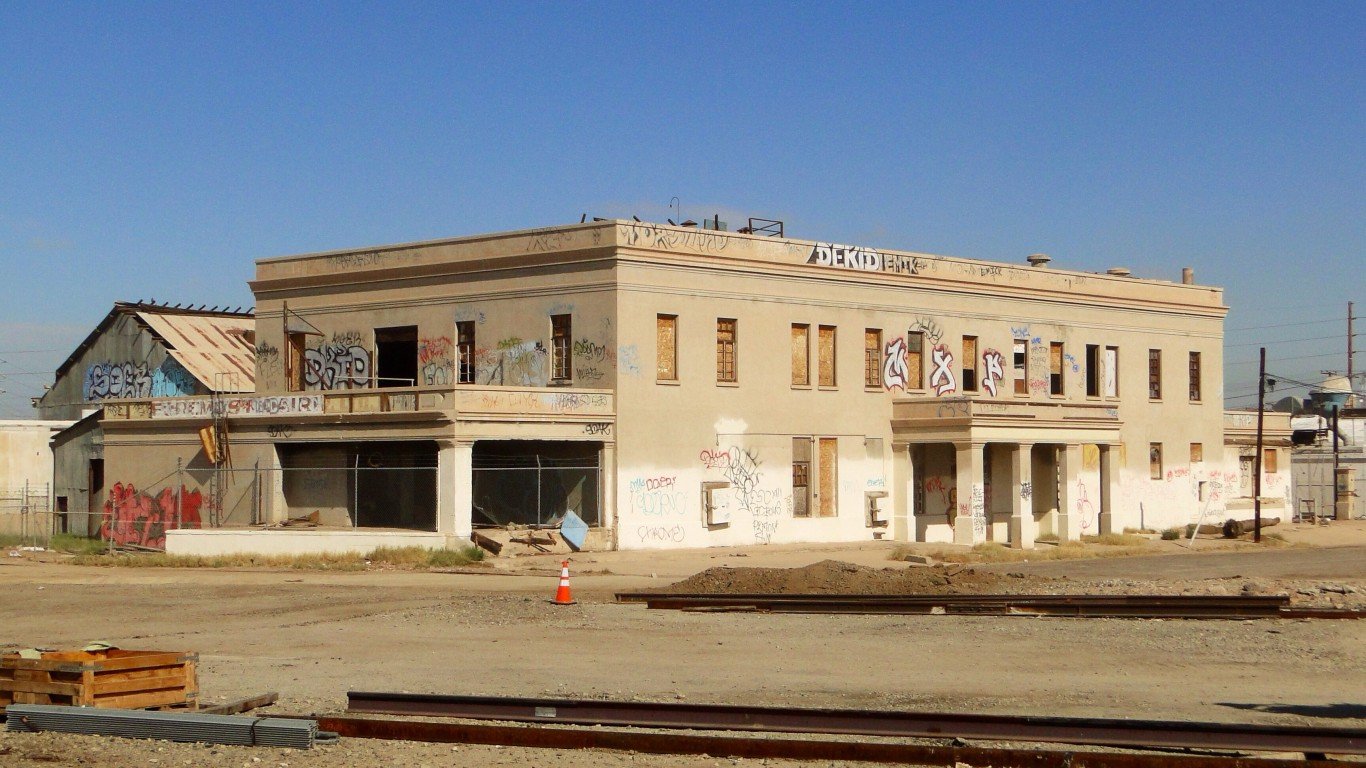
5. Bakersfield, California
> July 2018 unemployment: 8.3%
> Labor force: 381,055
> Number unemployed: 31,715
> 1-year employment change: 0.2%
[in-text-ad]
Source: Aneese / Getty Images
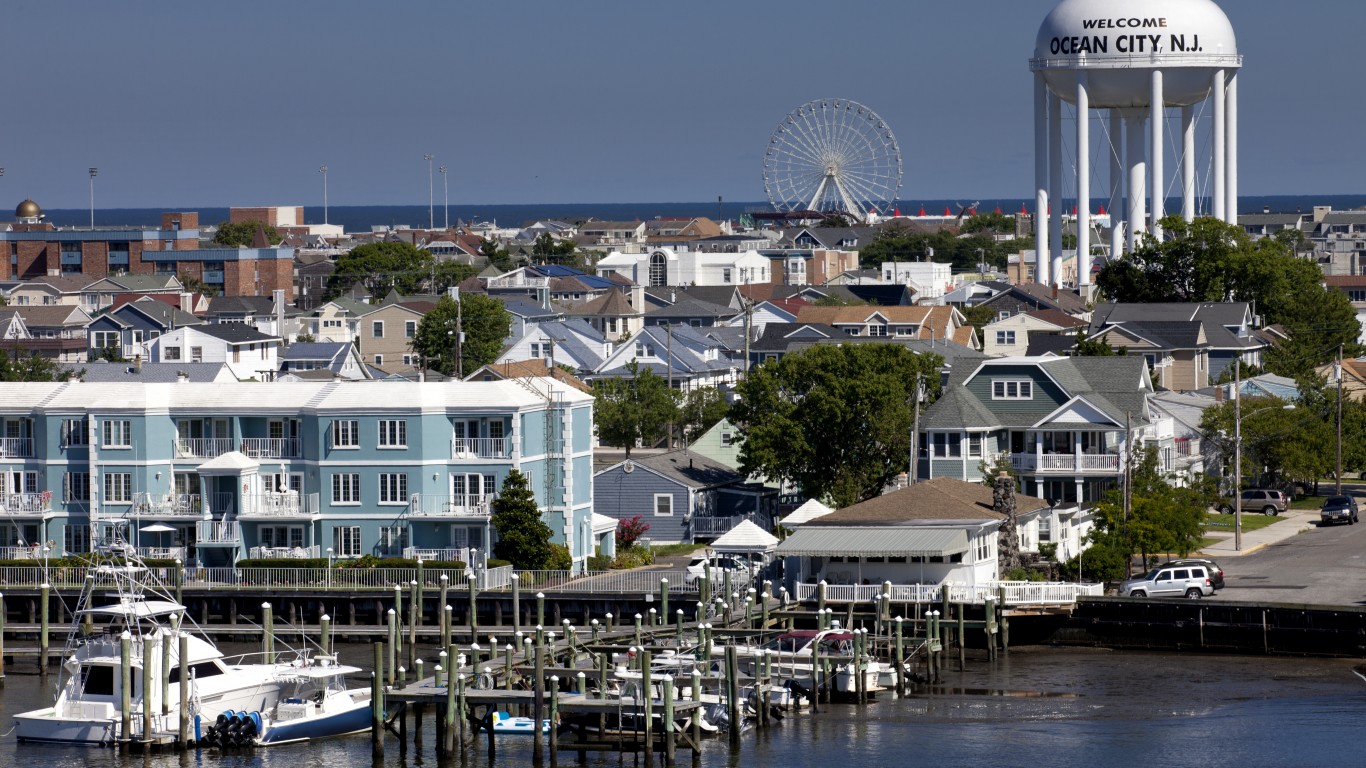
4. Ocean City, New Jersey
> July 2018 unemployment: 8.7%
> Labor force: 46,793
> Number unemployed: 4,069
> 1-year employment change: -0.1%

Source: Yahala / Wikimedia Commons
3. Bloomington, Indiana
> July 2018 unemployment: 3.9%
> Labor force: 73,622
> Number unemployed: 2,865
> 1-year employment change: -4.7%

Source: Ken Lund / Wikimedia Commons
2. Yuma, Arizona
> July 2018 unemployment: 16.6%
> Labor force: 93,424
> Number unemployed: 15,505
> 1-year employment change: -0.4%
[in-text-ad-2]
Source: Cbl62 / Wikimedia Commons
1. El Centro, California
> July 2018 unemployment: 17.1%
> Labor force: 72,171
> Number unemployed: 12,339
> 1-year employment change: -0.1%
Detailed findings:
Unemployment rates are useful economic indicators. However, without the context of broader employment trends, they do not tell the full story. A 5% unemployment rate could represent a considerable improvement in one part of the country but an alarming deterioration in another.
In every metro on this list, the unemployment rate is as high or higher than the comparable 3.9% U.S. rate. Similarly, only one metro area on this list had a greater increase in total employment in the last year than the 1.6% national increase — and all but three cities on this list reported a net decrease in jobs over the same period.
In the metro areas on this list adding jobs, unemployment rates are among the highest in the nation, ranging from 7.2% to 9.5%. Similarly, cities on this list with relatively low unemployment rates, below 5%, are shedding jobs at or near nation-leading pace, with employment declines ranging from 1.2% to 4.7%.
The scarcity — or growing scarcity — of work in these metro areas may be forcing residents to look elsewhere for jobs. Visalia-Porterville, California, is the only metro area on this list where the size of the workforce increased in the last year. In every other metro area, workforces contracted by anywhere from 0.5% to 4.4%.
Widespread joblessness and limited hiring are indicative of longer-term trends in most metro areas on this list. Though one reported faster five-year employment growth than the nation as a whole, the majority shed jobs in the last five years. Similarly, of the 23 metro areas with higher unemployment rates than the U.S. a whole, 18 also had higher than average unemployment half a decade ago.
Cities where it is most difficult to find work often share other similar patterns, such as industrial composition, as they tend to have relatively high concentrations of workers in farming and resource extraction. While nationwide, just 1.9% of workers are employed in agriculture and resource extraction, in most of these metro areas, the industry accounts for a larger share of employment. In Visalia-Porterville, California, nearly one in every five workers are employed in farming or a related occupation.
Similarly, 11.2% of workers nationwide are employed in the generally higher paying professional services, scientific, and management sector. In every metro area on this list, this industry accounts for a smaller share of overall employment.
Methodology:
To determine the worst cities to find a job, 24/7 Wall St. created an index of both unemployment rates for July 2018 and changes in total civilian employment from July 2017 through July 2018 for 382 U.S. metropolitan areas using min-max normalization. Both data points are from the U.S. Bureau of Labor Statistics and are seasonally adjusted. Employment by industry are for 2016 and are five year estimates from the U.S. Census Bureau’s American Community Survey.
Sponsored: Find a Qualified Financial Advisor
Finding a qualified financial advisor doesn’t have to be hard. SmartAsset’s free tool matches you with up to 3 fiduciary financial advisors in your area in 5 minutes. Each advisor has been vetted by SmartAsset and is held to a fiduciary standard to act in your best interests. If you’re ready to be matched with local advisors that can help you achieve your financial goals, get started now.
Thank you for reading! Have some feedback for us?
Contact the 24/7 Wall St. editorial team.
Editors' Picks

