
The U.S. Census Bureau released its annual report on income and poverty in the United States earlier this week. Encouragingly, income of the typical American household climbed in 2017.
The latest Census release also confirmed the continuation of a longer-term trend: the increasing concentration of wealth at the top of the income distribution. According research conducted by the Economic Policy Institute, a nonprofit nonpartisan think tank, incomes for the top 5% of earners climbed six times faster than incomes for the bottom 20%.
The negative effects of this trend are evident in many of America’s poorest cities.
24/7 Wall St. reviewed 2017 data from the U.S. Census Bureau to identify the 42 metro areas where the typical household earns less than $45,000 annually. In over half of these cities, the median household income declined in 2017, a stark break from the broader U.S. trend.
The cities on this list share several characteristics, including high unemployment, low property values, and low educational attainment. While a handful are in the Midwest and western United States, they are largely confined to the South. None of the cities on this list are in the Northeast.
Click here to see America’s poorest cities.
Click here to read our detailed findings and methodology.

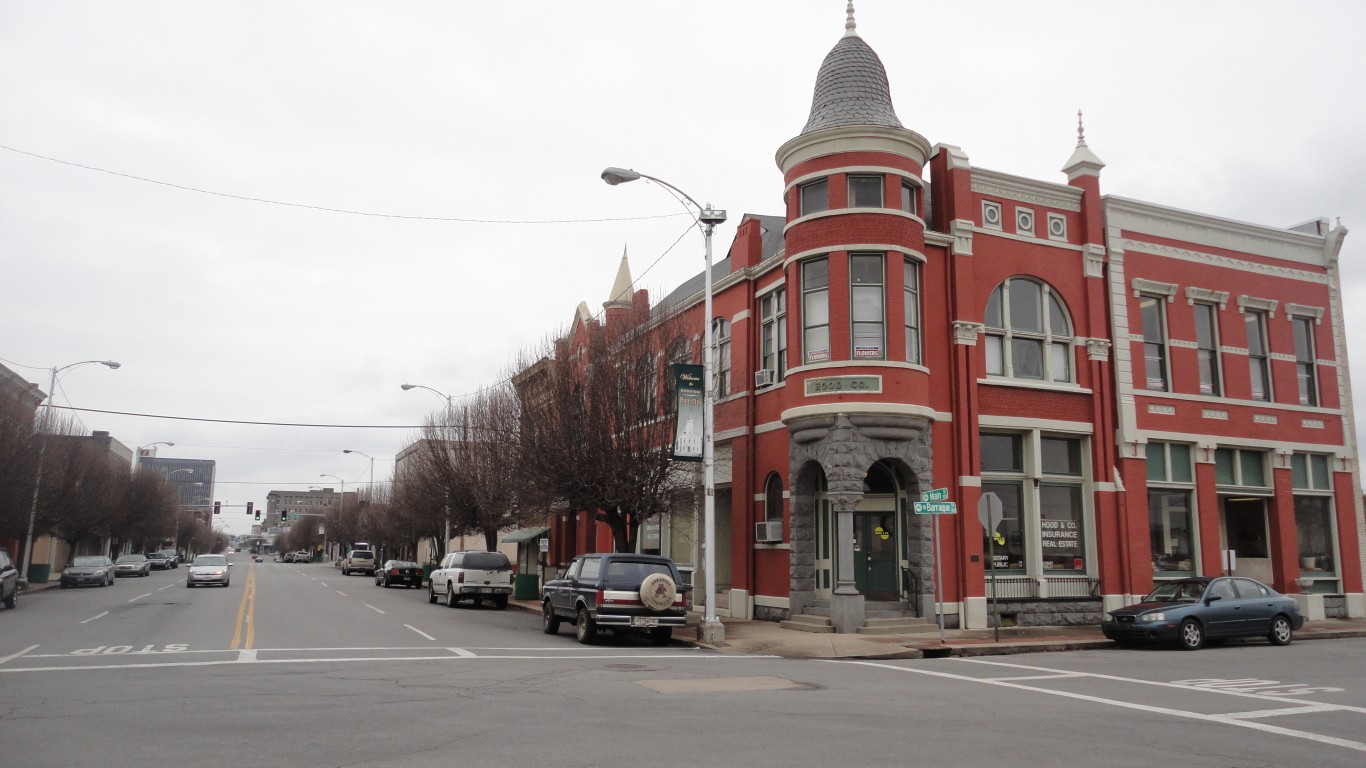
Source: Richard David Ramsey / Wikimedia Commons
42. Hammond, LA
> Median household income: $44,861
> Median income change 2016-2017: -$3,301 (-6.9%)
> Median home value: $157,500
> Adults with a bachelor’s degree: 19.1% (bottom 20%)
> July unemployment: 5.8% (top 10%)
[in-text-ad]

Source: Bravidos / Wikimedia Commons
41. Morristown, TN
> Median household income: $44,840
> Median income change 2016-2017: +$492 (+1.1%)
> Median home value: $142,700
> Adults with a bachelor’s degree: 14.9% (bottom 10%)
> July unemployment: 4.0%
Source: Public Domain / Wikimedia Commons
40. Bay City, MI
> Median household income: $44,770
> Median income change 2016-2017: +$14 (+0.0%)
> Median home value: $102,800 (bottom 10%)
> Adults with a bachelor’s degree: 21.9%
> July unemployment: 4.6%
Source: DenisTangneyJr / Getty Images
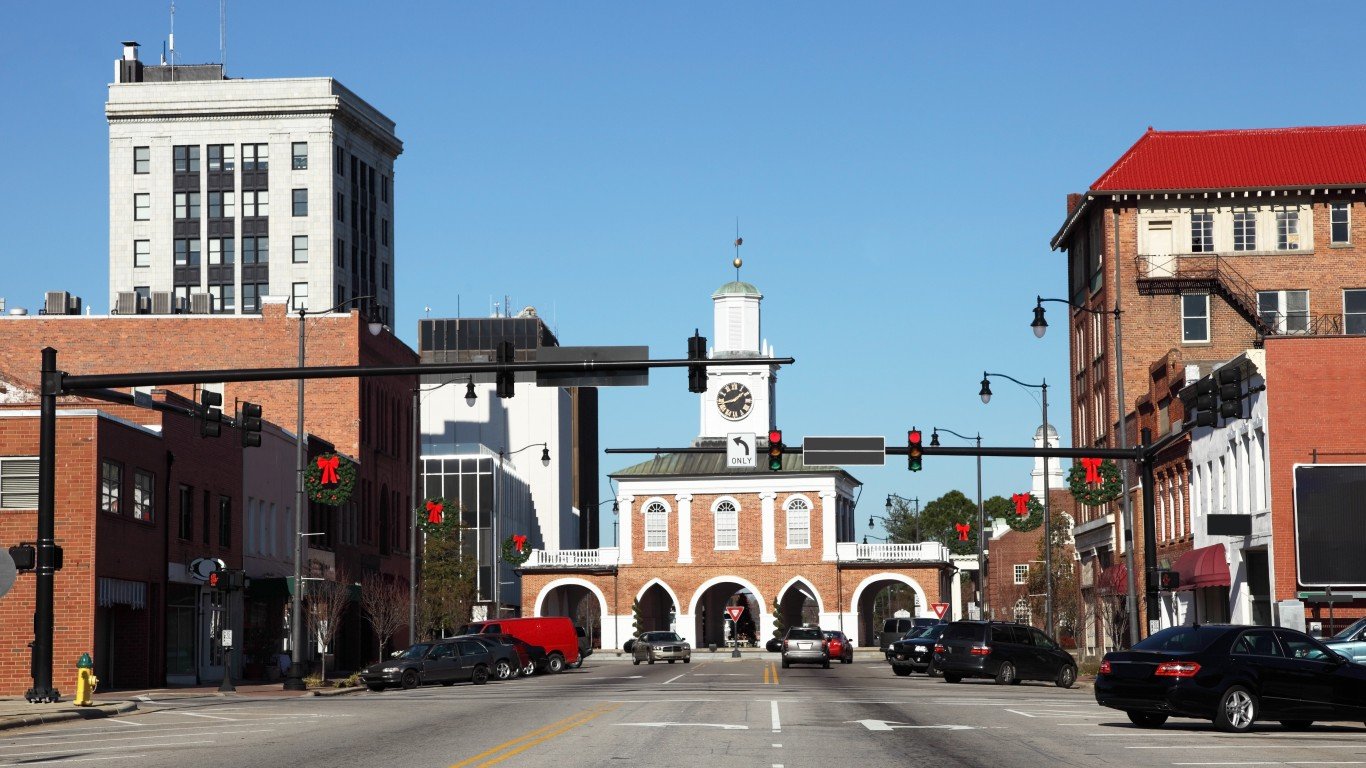
39. Fayetteville, NC
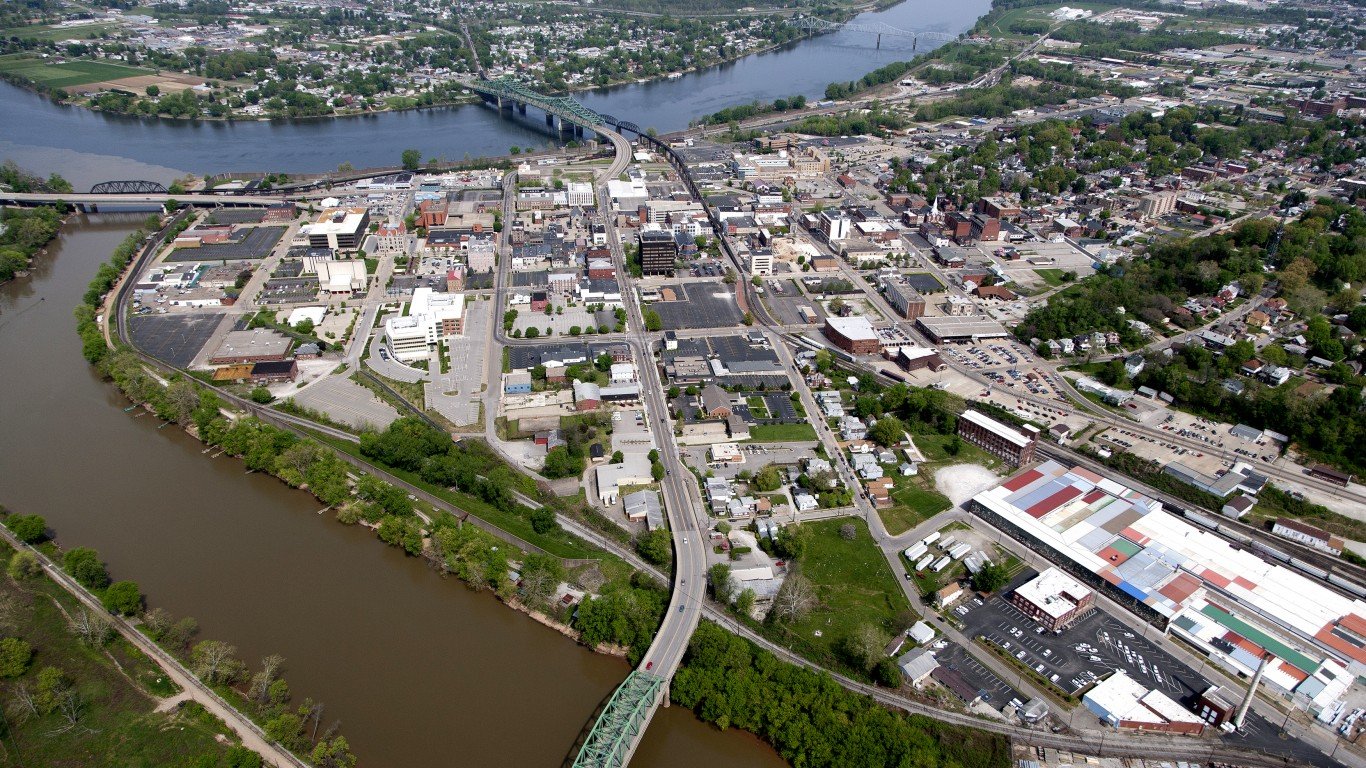
> Median household income: $44,757
> Median income change 2016-2017: -$536 (-1.2%)
> Median home value: $138,100
> Adults with a bachelor’s degree: 23.6%
> July unemployment: 5.0% (top 20%)
[in-text-ad-2]

Source: Sean Pavone / Getty Images
38. Gainesville, FL
> Median household income: $44,548
> Median income change 2016-2017: -$731 (-1.6%)
> Median home value: $170,700
> Adults with a bachelor’s degree: 38.7% (top 20%)
> July unemployment: 3.2%

Source: kenlund / Flickr
37. Grants Pass, OR
> Median household income: $44,426
> Median income change 2016-2017: +$7,954 (+21.8%)
> Median home value: $278,000 (top 20%)
> Adults with a bachelor’s degree: 18.9% (bottom 20%)
> July unemployment: 5.2% (top 20%)
[in-text-ad]
Source: DenisTangneyJr / Getty Images
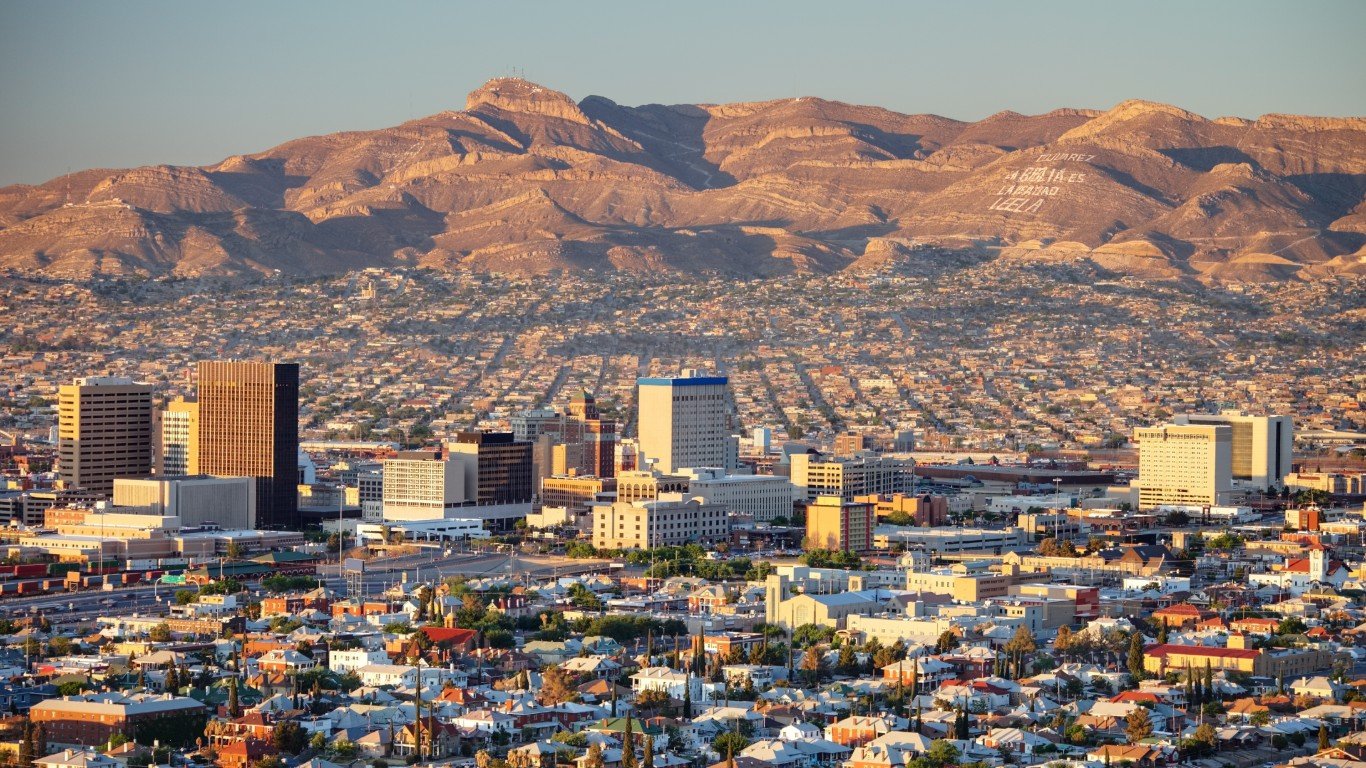
36. El Paso, TX
> Median household income: $44,416
> Median income change 2016-2017: +$2,300 (+5.5%)
> Median home value: $122,200 (bottom 20%)
> Adults with a bachelor’s degree: 22.8%
> July unemployment: 4.2%
 24/7 Wall St.
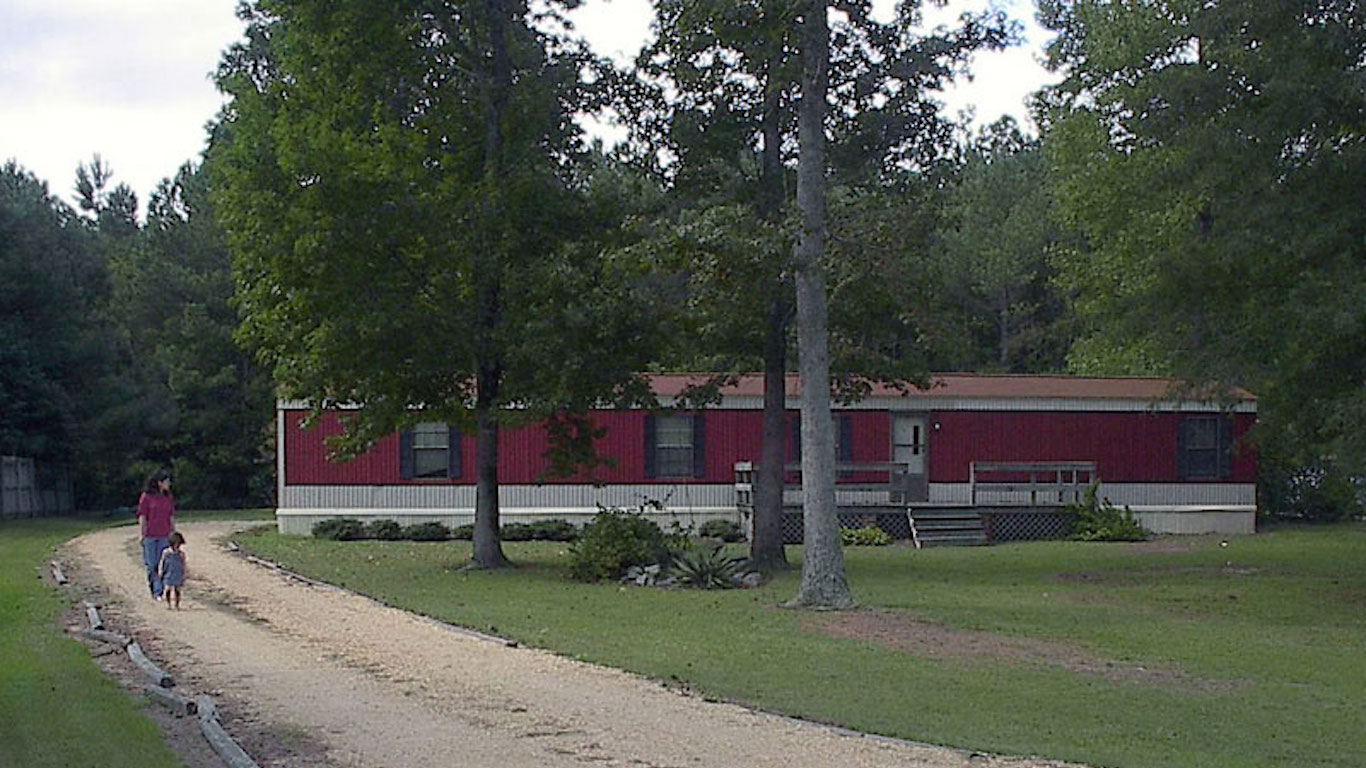
Source: oddharmonic / Flickr
35. Goldsboro, NC
> Median household income: $44,347
> Median income change 2016-2017: +$2,636 (+6.3%)
> Median home value: $117,600 (bottom 10%)
> Adults with a bachelor’s degree: 20.3% (bottom 20%)
> July unemployment: 4.0%

Source: MichaelWarrenPix / Getty Images
34. Ocala, FL
> Median household income: $43,910
> Median income change 2016-2017: +$4,527 (+11.5%)
> Median home value: $137,300
> Adults with a bachelor’s degree: 21.9%
> July unemployment: 4.4%
[in-text-ad-2]

Source: Explorecdale / Wikimedia Commons
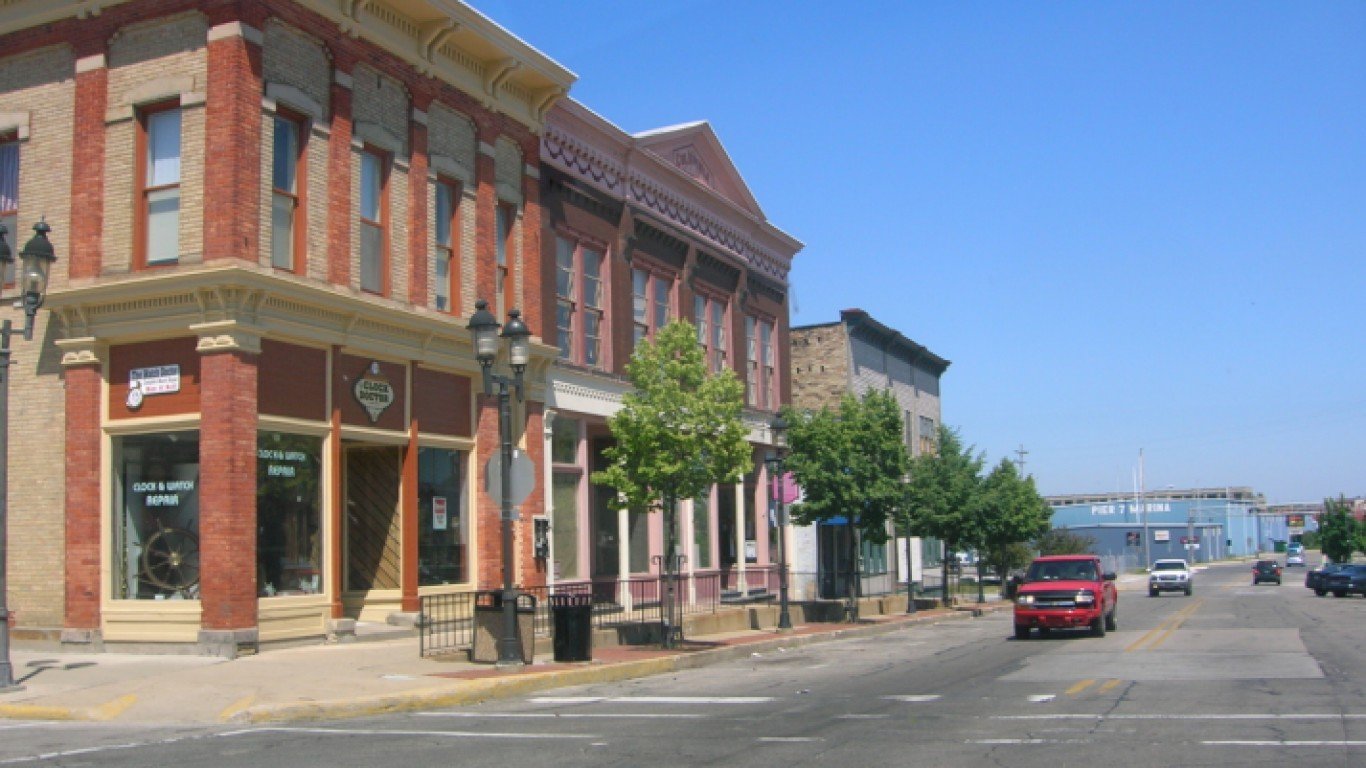
33. Carbondale-Marion, IL
> Median household income: $43,892
> Median income change 2016-2017: +$2,289 (+5.5%)
> Median home value: $120,600 (bottom 20%)
> Adults with a bachelor’s degree: 27.1%
> July unemployment: 4.5%

Source: Public Domain / Wikimedia Commons
32. Terre Haute, IN
> Median household income: $43,843
> Median income change 2016-2017: -$3,108 (-6.6%)
> Median home value: $88,800 (bottom 10%)
> Adults with a bachelor’s degree: 19.3% (bottom 20%)
> July unemployment: 4.7%
[in-text-ad]
Source: 6381380 / Getty Images
31. Parkersburg-Vienna, WV
> Median household income: $43,648
> Median income change 2016-2017: -$2,946 (-6.3%)
> Median home value: $129,100 (bottom 20%)
> Adults with a bachelor’s degree: 21.1% (bottom 20%)
> July unemployment: 5.6% (top 10%)
 24/7 Wall St.
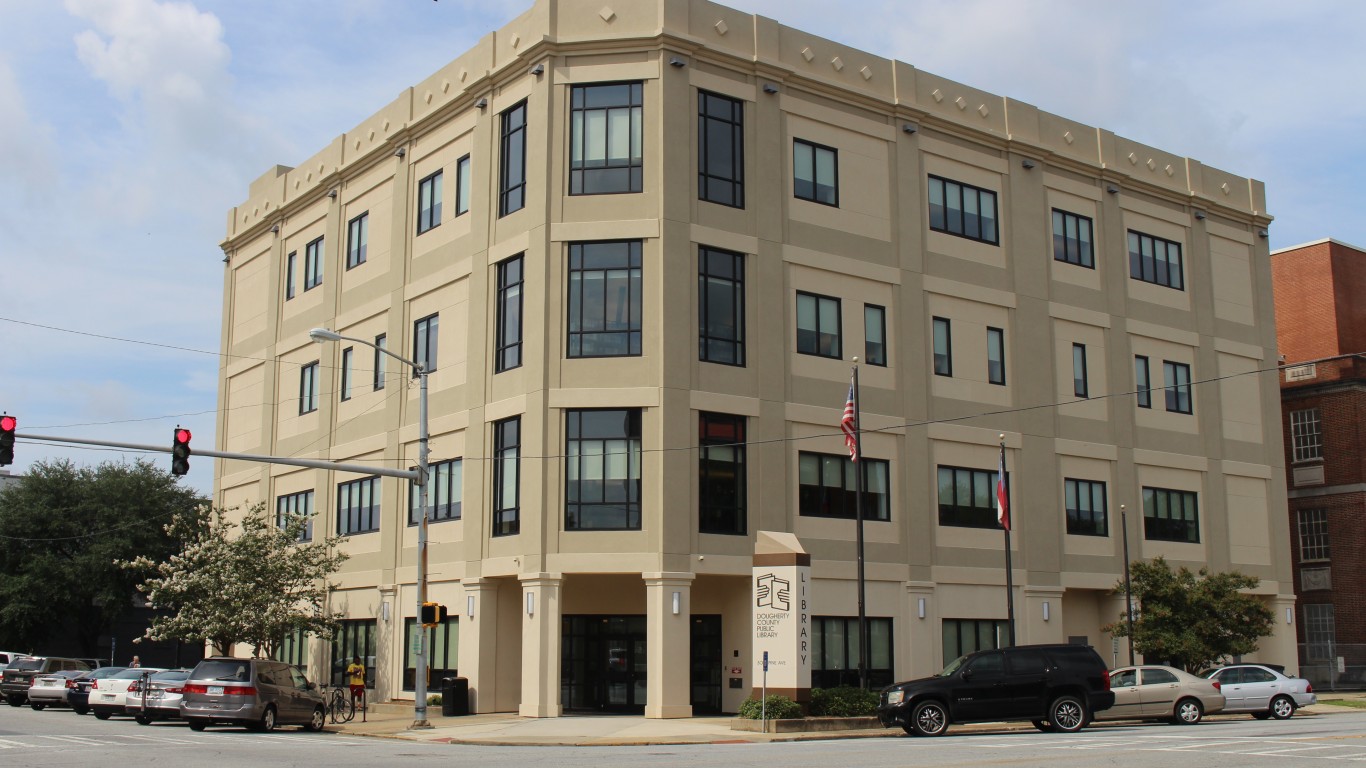
Source: Michael Rivera / Wikimedia Commons
30. Albany, GA
> Median household income: $43,614
> Median income change 2016-2017: +$2,947 (+7.2%)
> Median home value: $115,900 (bottom 10%)
> Adults with a bachelor’s degree: 21.2% (bottom 20%)
> July unemployment: 4.5%
Source: Public Domain / Wikimedia Commons
29. Jackson, TN
> Median household income: $43,570
> Median income change 2016-2017: +$1,197 (+2.8%)
> Median home value: $121,900 (bottom 20%)
> Adults with a bachelor’s degree: 23.4%
> July unemployment: 3.9%
[in-text-ad-2]
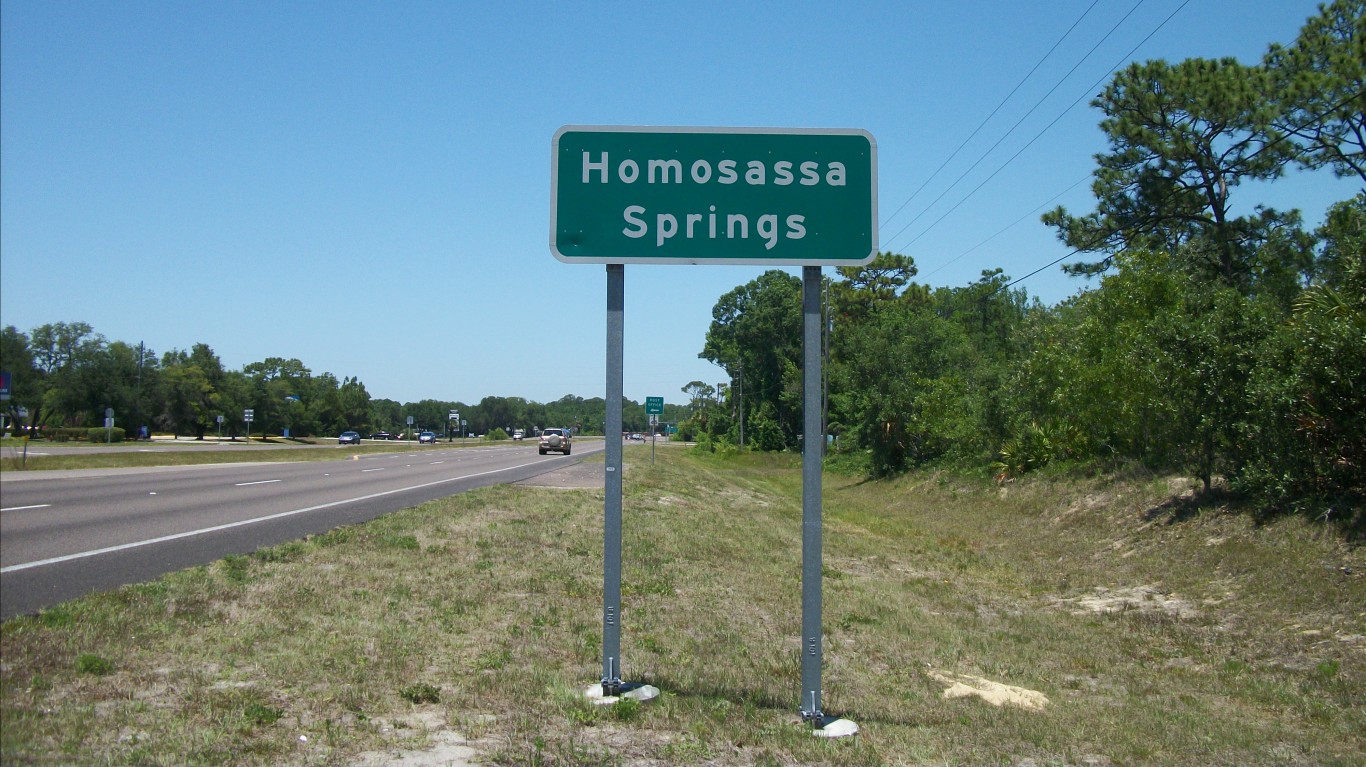
Source: DanTD / Wikimedia Commons
28. Homosassa Springs, FL
> Median household income: $43,548
> Median income change 2016-2017: +$4,342 (+11.1%)
> Median home value: $128,900 (bottom 20%)
> Adults with a bachelor’s degree: 16.8% (bottom 10%)
> July unemployment: 5.2% (top 20%)

Source: Kagenmi / Getty Images
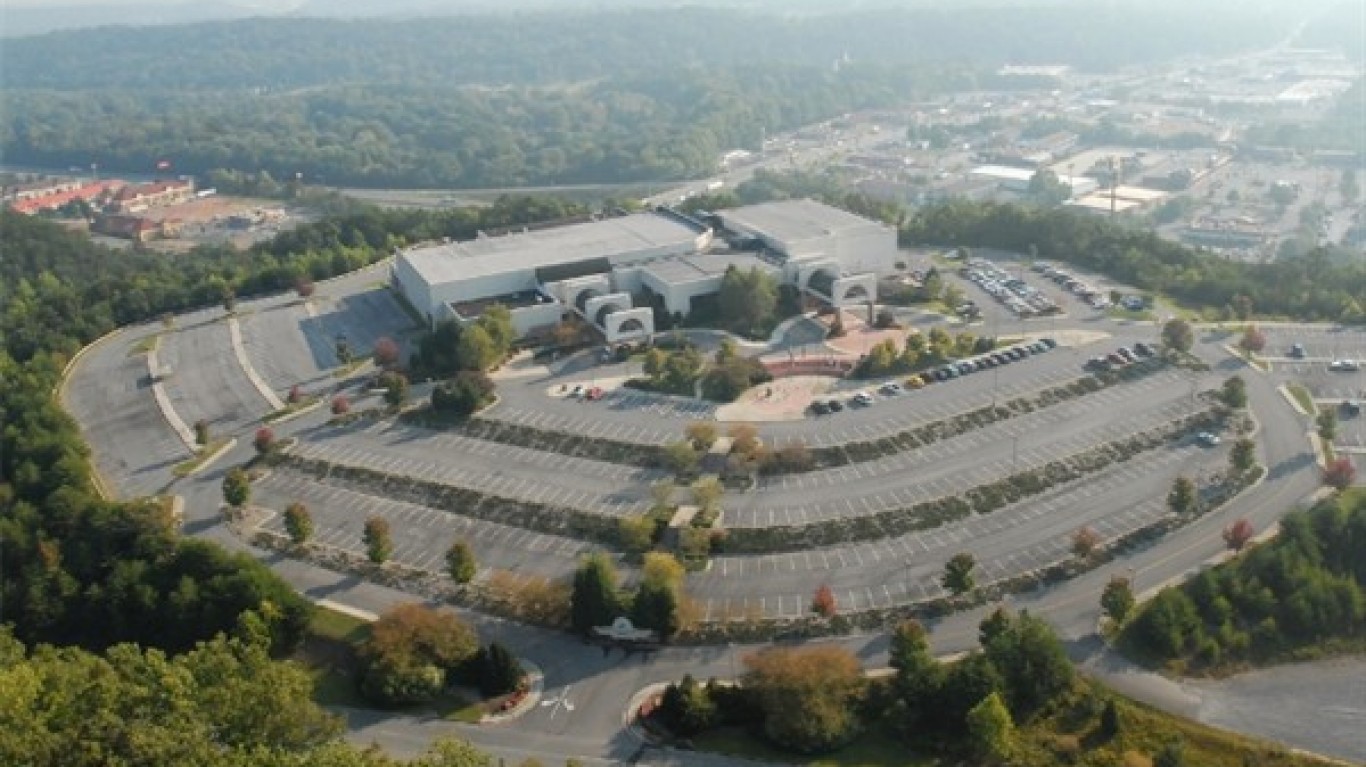
27. Kingsport-Bristol-Bristol, TN-VA
> Median household income: $43,516
> Median income change 2016-2017: +$2,705 (+6.6%)
> Median home value: $136,700
> Adults with a bachelor’s degree: 20.5% (bottom 20%)
> July unemployment: 3.7%
[in-text-ad]

Source: artiste9999 / Getty Images
26. Laredo, TX
> Median household income: $43,408
> Median income change 2016-2017: +$7,749 (+21.7%)
> Median home value: $133,200 (bottom 20%)
> Adults with a bachelor’s degree: 17.1% (bottom 10%)
> July unemployment: 3.7%

Source: Bob Weston / iStock
25. Pueblo, CO
> Median household income: $43,148
> Median income change 2016-2017: -$1,529 (-3.4%)
> Median home value: $163,300
> Adults with a bachelor’s degree: 22.2%
> July unemployment: 4.5%

Source: SeanPavonePhoto / Getty Images
24. Columbus, GA-AL
> Median household income: $43,051
> Median income change 2016-2017: -$361 (-0.8%)
> Median home value: $137,000
> Adults with a bachelor’s degree: 24.3%
> July unemployment: 4.5%
[in-text-ad-2]

Source: Leonard J. DeFrancisci / Wikimedia Commons
23. Rocky Mount, NC
> Median household income: $42,784
> Median income change 2016-2017: +$3,812 (+9.8%)
> Median home value: $115,800 (bottom 10%)
> Adults with a bachelor’s degree: 19.2% (bottom 20%)
> July unemployment: 5.7% (top 10%)
Source: Tim Kiser (w:User:Malepheasant) / Wikimedia Commons
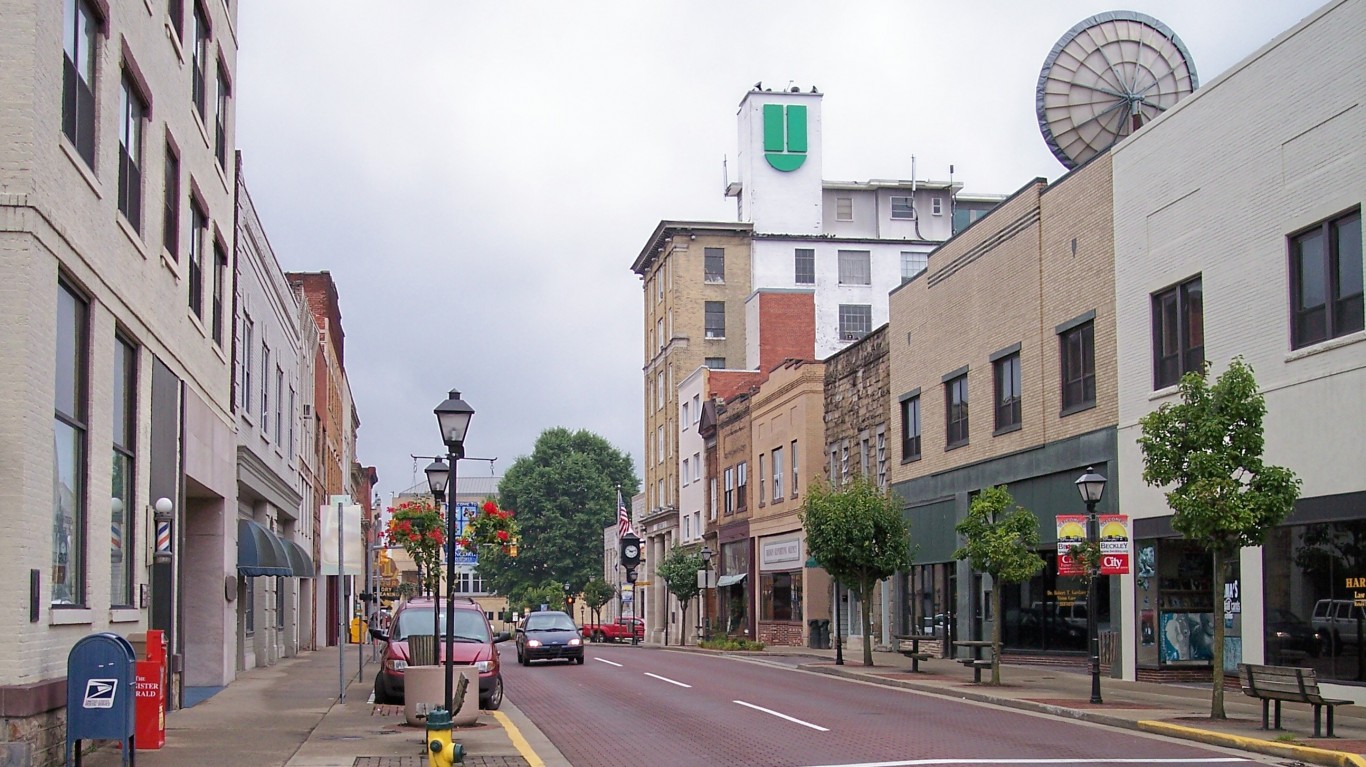
22. Beckley, WV
> Median household income: $42,493
> Median income change 2016-2017: -$1,685 (-3.8%)
> Median home value: $98,500 (bottom 10%)
> Adults with a bachelor’s degree: 19.2% (bottom 20%)
> July unemployment: 6.0% (top 10%)
[in-text-ad]
Source: Daniel Schwen / Wikimedia Commons
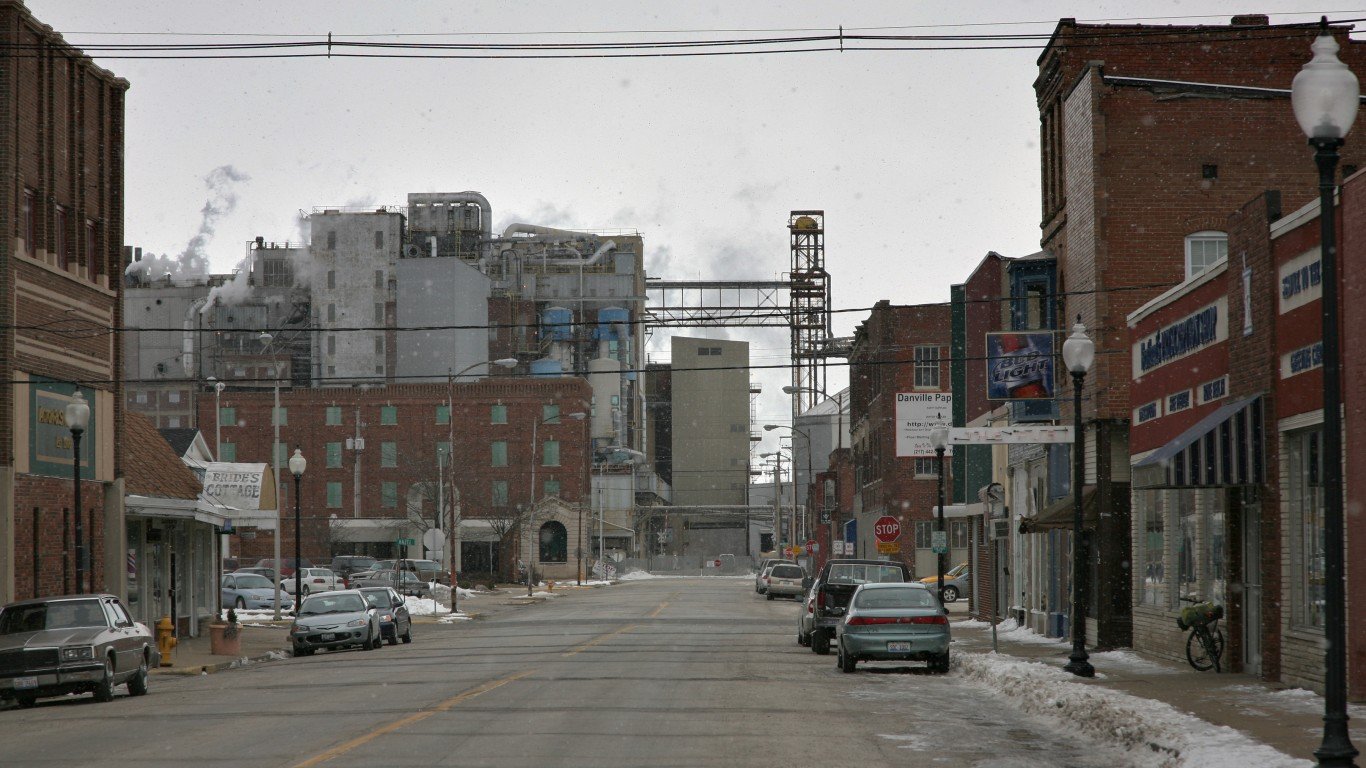
21. Danville, IL
> Median household income: $42,345
> Median income change 2016-2017: -$3,136 (-6.9%)
> Median home value: $77,900 (bottom 10%)
> Adults with a bachelor’s degree: 16.8% (bottom 10%)
> July unemployment: 5.6% (top 10%)
 24/7 Wall St.
Source: AngelMcNallphotography / Getty Images
20. Lake Havasu City-Kingman, AZ
> Median household income: $42,311
> Median income change 2016-2017: -$112 (-0.3%)
> Median home value: $157,100
> Adults with a bachelor’s degree: 13.5% (bottom 10%)
> July unemployment: 5.5% (top 10%)

Source: Public Domain / Wikimedia Commons
19. Cumberland, MD-WV
> Median household income: $42,113
> Median income change 2016-2017: -$3,695 (-8.1%)
> Median home value: $128,700 (bottom 20%)
> Adults with a bachelor’s degree: 16.6% (bottom 10%)
> July unemployment: 6.0% (top 10%)
[in-text-ad-2]

Source: JNix / Shutterstock.com
18. Gadsden, AL
> Median household income: $41,576
> Median income change 2016-2017: +$424 (+1.0%)
> Median home value: $115,200 (bottom 10%)
> Adults with a bachelor’s degree: 19.3% (bottom 20%)
> July unemployment: 4.3%

Source: DenisTangneyJr / Getty Images
17. Charleston, WV
> Median household income: $41,558
> Median income change 2016-2017: -$131 (-0.3%)
> Median home value: $107,500 (bottom 10%)
> Adults with a bachelor’s degree: 23.3%
> July unemployment: 5.4% (top 20%)
[in-text-ad]
Source: Public Domain / Wikimedia Commons
16. Dalton, GA
> Median household income: $41,441
> Median income change 2016-2017: -$1,907 (-4.4%)
> Median home value: $126,400 (bottom 20%)
> Adults with a bachelor’s degree: 13.5% (bottom 10%)
> July unemployment: 4.7%
 24/7 Wall St.
Source: SeanPavonePhoto / Getty Images
15. Macon-Bibb County, GA
> Median household income: $41,303
> Median income change 2016-2017: +$1,330 (+3.3%)
> Median home value: $118,600 (bottom 10%)
> Adults with a bachelor’s degree: 22.3%
> July unemployment: 3.9%

Source: lydiabilby / Getty Images
14. Muncie, IN
> Median household income: $41,255
> Median income change 2016-2017: +$214 (+0.5%)
> Median home value: $92,100 (bottom 10%)
> Adults with a bachelor’s degree: 24.7%
> July unemployment: 3.7%
[in-text-ad-2]

Source: Joel Carillet / Getty Images
13. Johnson City, TN
> Median household income: $40,663
> Median income change 2016-2017: -$280 (-0.7%)
> Median home value: $146,500
> Adults with a bachelor’s degree: 26.7%
> July unemployment: 4.1%

Source: Wvfunnyman / Wikimedia Commons
12. Huntington-Ashland, WV-KY-OH
> Median household income: $40,646
> Median income change 2016-2017: -$1,774 (-4.2%)
> Median home value: $118,600 (bottom 10%)
> Adults with a bachelor’s degree: 18.9% (bottom 20%)
> July unemployment: 5.7% (top 10%)
[in-text-ad]

Source: Rex_Wholster / Getty Images
11. Alexandria, LA
> Median household income: $40,585
> Median income change 2016-2017: -$1,551 (-3.7%)
> Median home value: $139,700
> Adults with a bachelor’s degree: 19.1% (bottom 20%)
> July unemployment: 5.7% (top 10%)
Source: Florence Conventions and Visitors Bureau / Wikimedia Commons
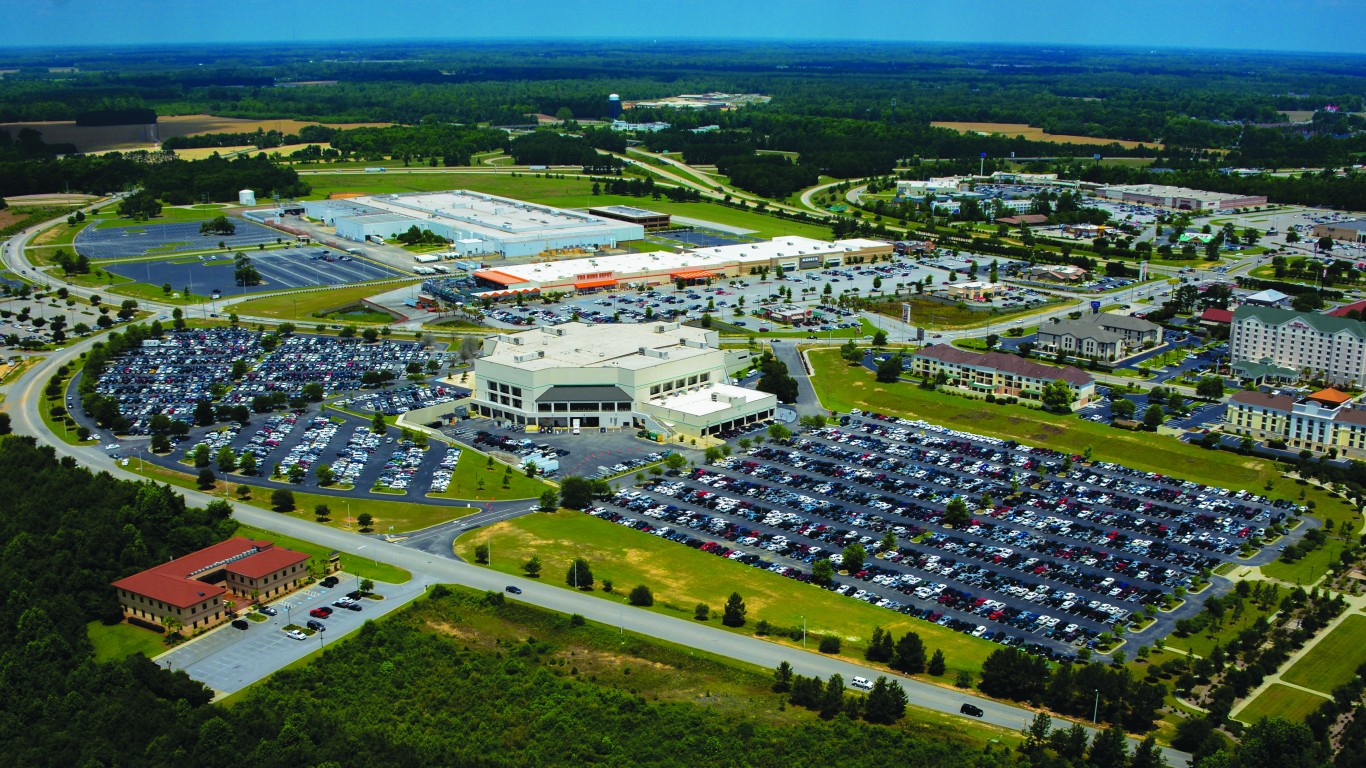
10. Florence, SC
> Median household income: $40,562
> Median income change 2016-2017: -$1,638 (-3.9%)
> Median home value: $114,900 (bottom 10%)
> Adults with a bachelor’s degree: 24.1%
> July unemployment: 3.7%

Source: talentbender / Getty Images
9. Valdosta, GA
> Median household income: $40,391
> Median income change 2016-2017: +$657 (+1.7%)
> Median home value: $123,600 (bottom 20%)
> Adults with a bachelor’s degree: 25.7%
> July unemployment: 3.8%
[in-text-ad-2]

Source: mcpuckette / Getty Images
8. Fort Smith, AR-OK
> Median household income: $40,282
> Median income change 2016-2017: -$688 (-1.7%)
> Median home value: $114,800 (bottom 10%)
> Adults with a bachelor’s degree: 18.1% (bottom 10%)
> July unemployment: 3.8%
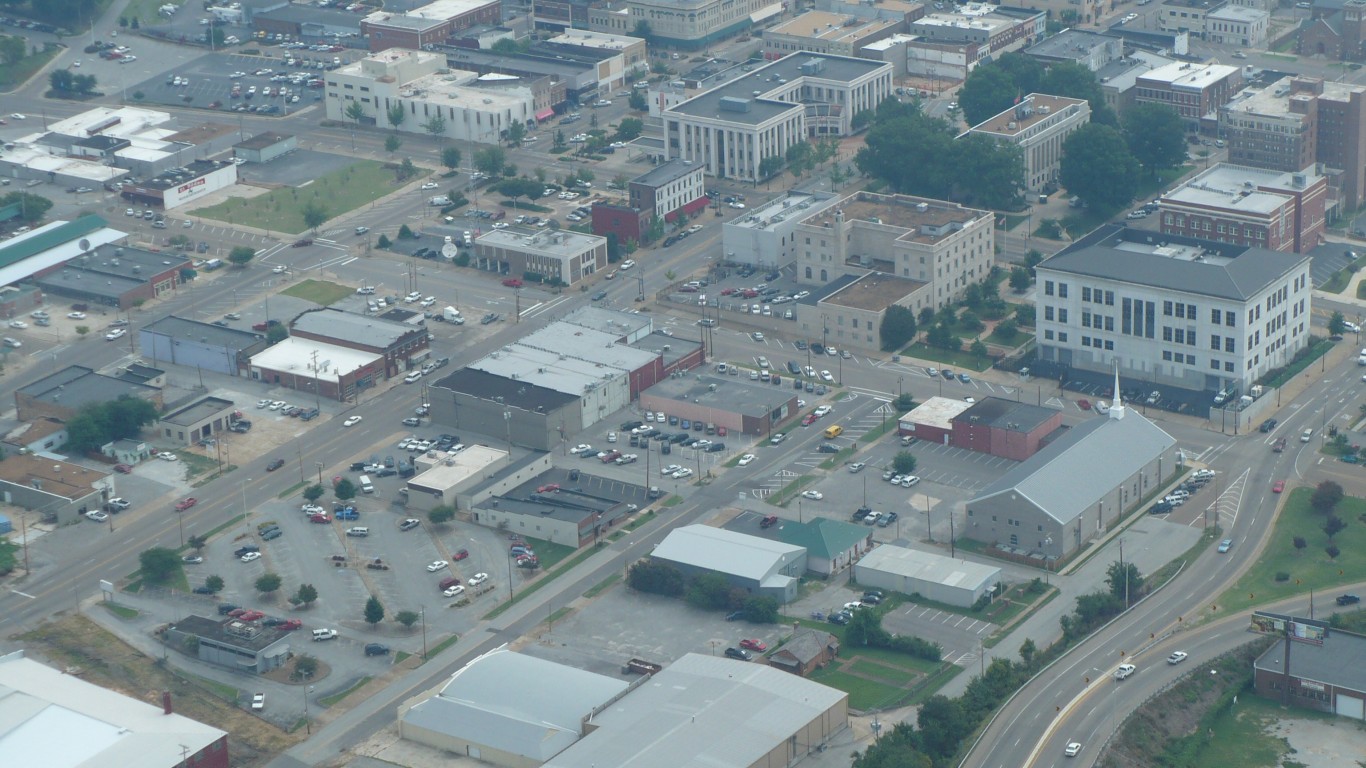
Source: Paul Sableman (Flickr user: pasa47) / Wikimedia Commons
7. Pine Bluff, AR
> Median household income: $39,914
> Median income change 2016-2017: +$2,838 (+7.7%)
> Median home value: $82,400 (bottom 10%)
> Adults with a bachelor’s degree: 16.4% (bottom 10%)
> July unemployment: 4.8%
[in-text-ad]
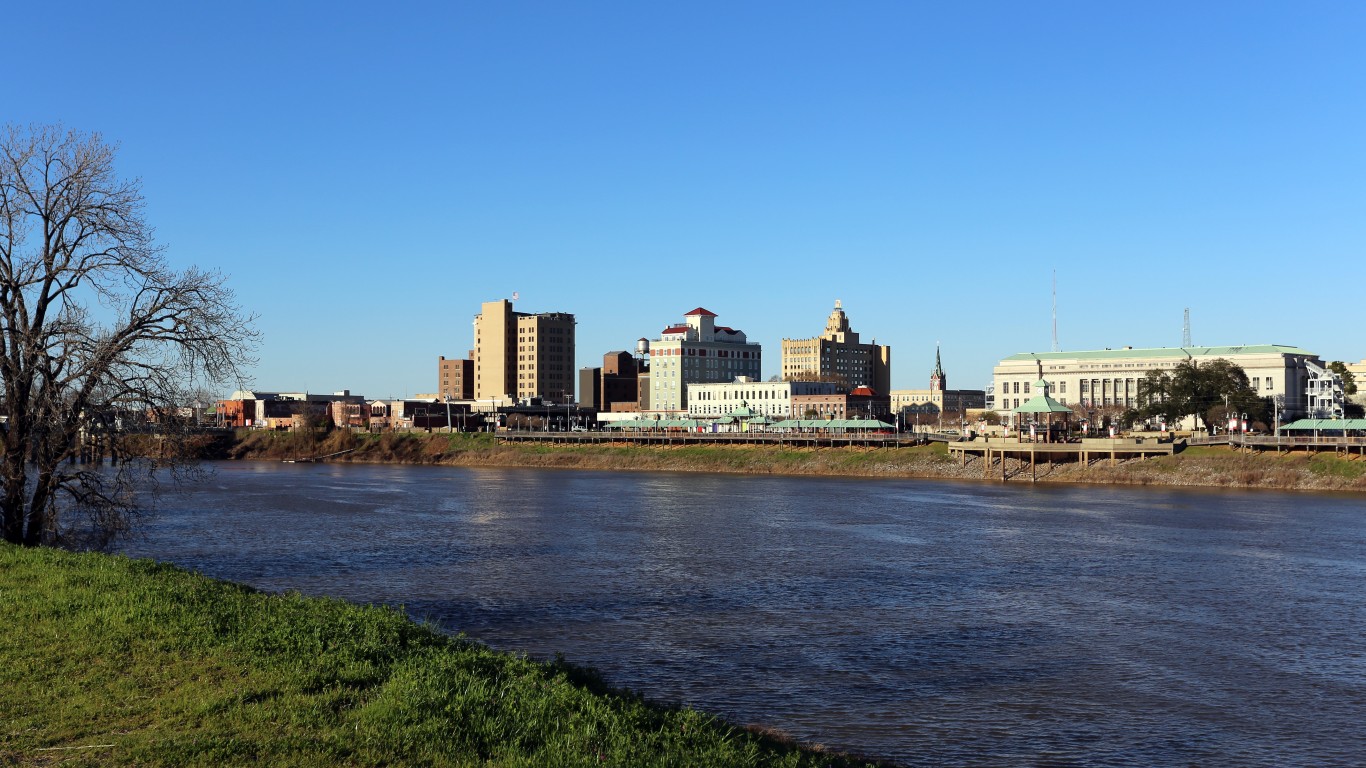
Source: wellesenterprises / Getty Images
6. Monroe, LA
> Median household income: $39,610
> Median income change 2016-2017: +$1,606 (+4.2%)
> Median home value: $136,600
> Adults with a bachelor’s degree: 22.1%
> July unemployment: 5.5% (top 10%)
 24/7 Wall St.
Source: SeanPavonePhoto / Getty Images
5. Shreveport-Bossier City, LA
> Median household income: $38,627
> Median income change 2016-2017: -$1,818 (-4.5%)
> Median home value: $149,400
> Adults with a bachelor’s degree: 22.1%
> July unemployment: 5.6% (top 10%)
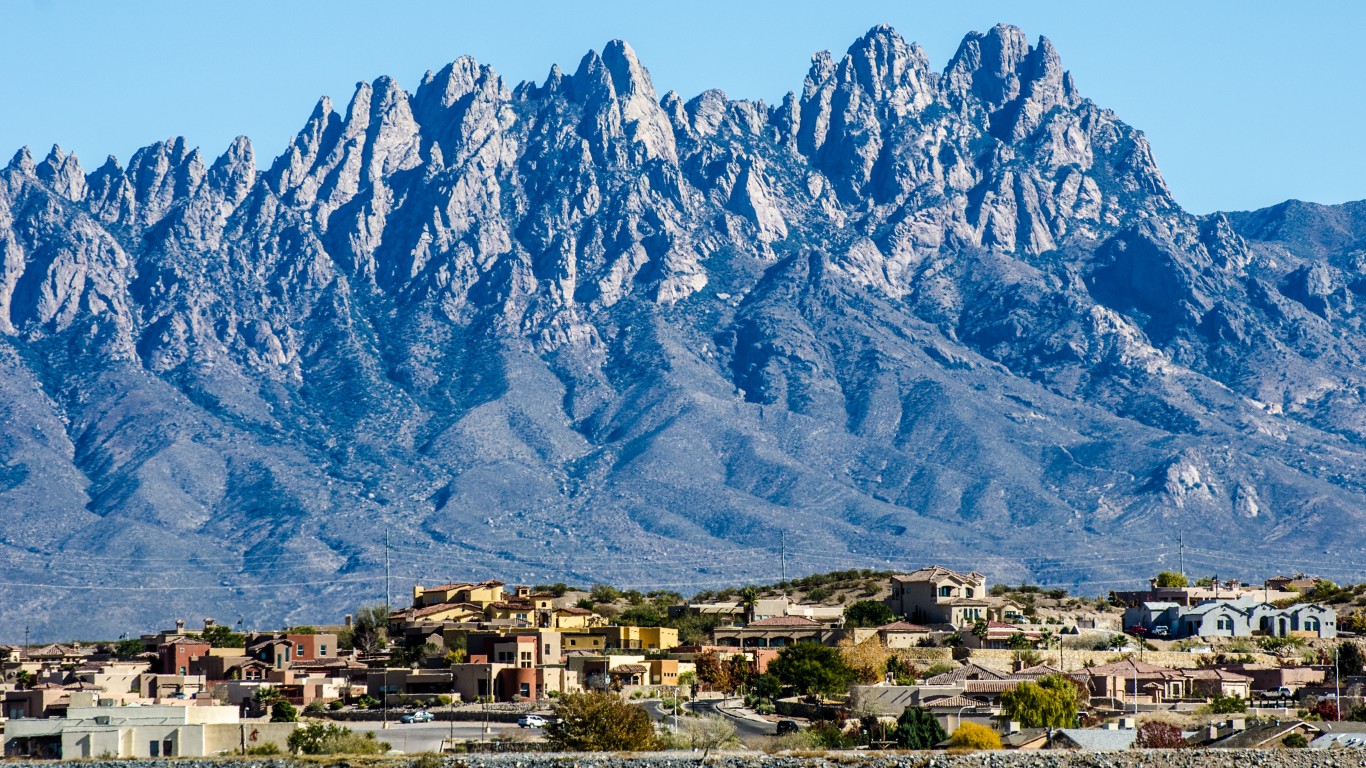
Source: SWCargill / Getty Images
4. Las Cruces, NM
> Median household income: $37,144
> Median income change 2016-2017: -$352 (-0.9%)
> Median home value: $145,200
> Adults with a bachelor’s degree: 24.9%
> July unemployment: 5.3% (top 20%)
[in-text-ad-2]
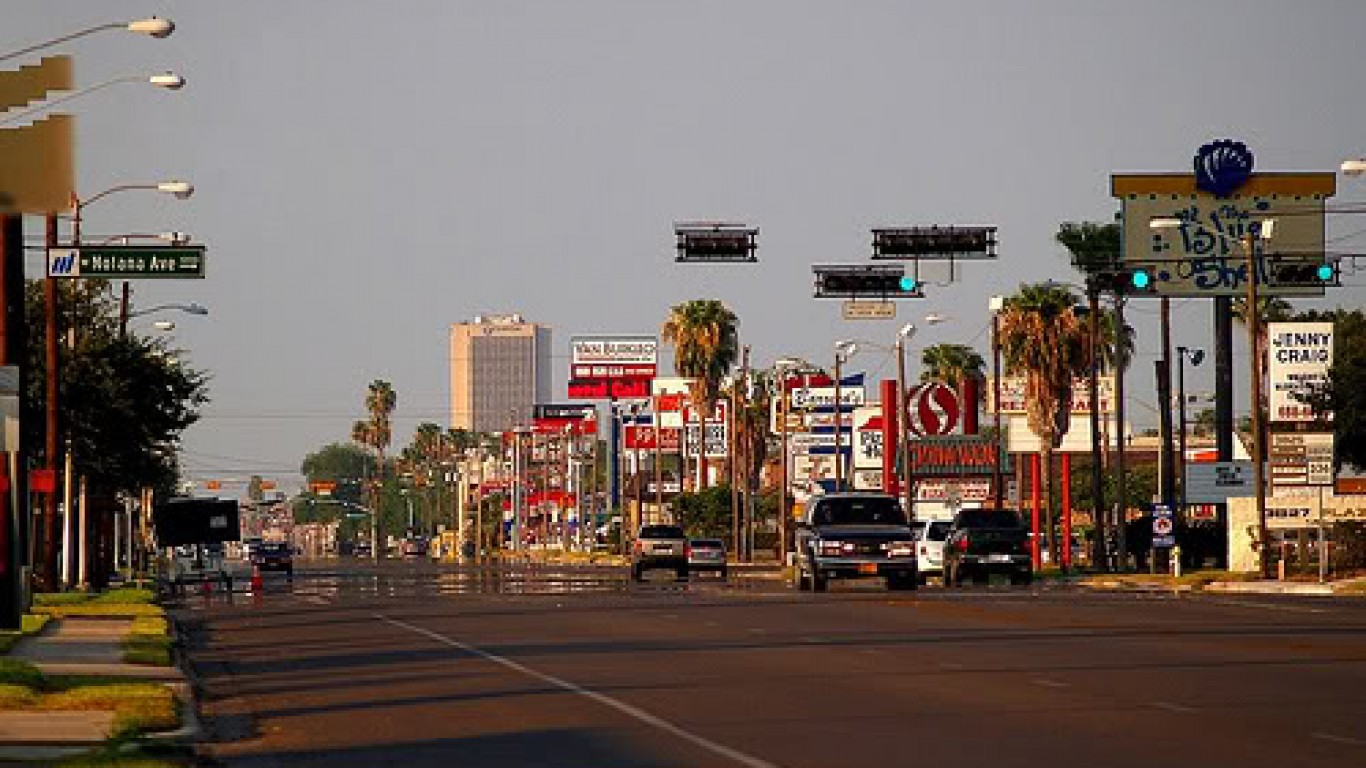
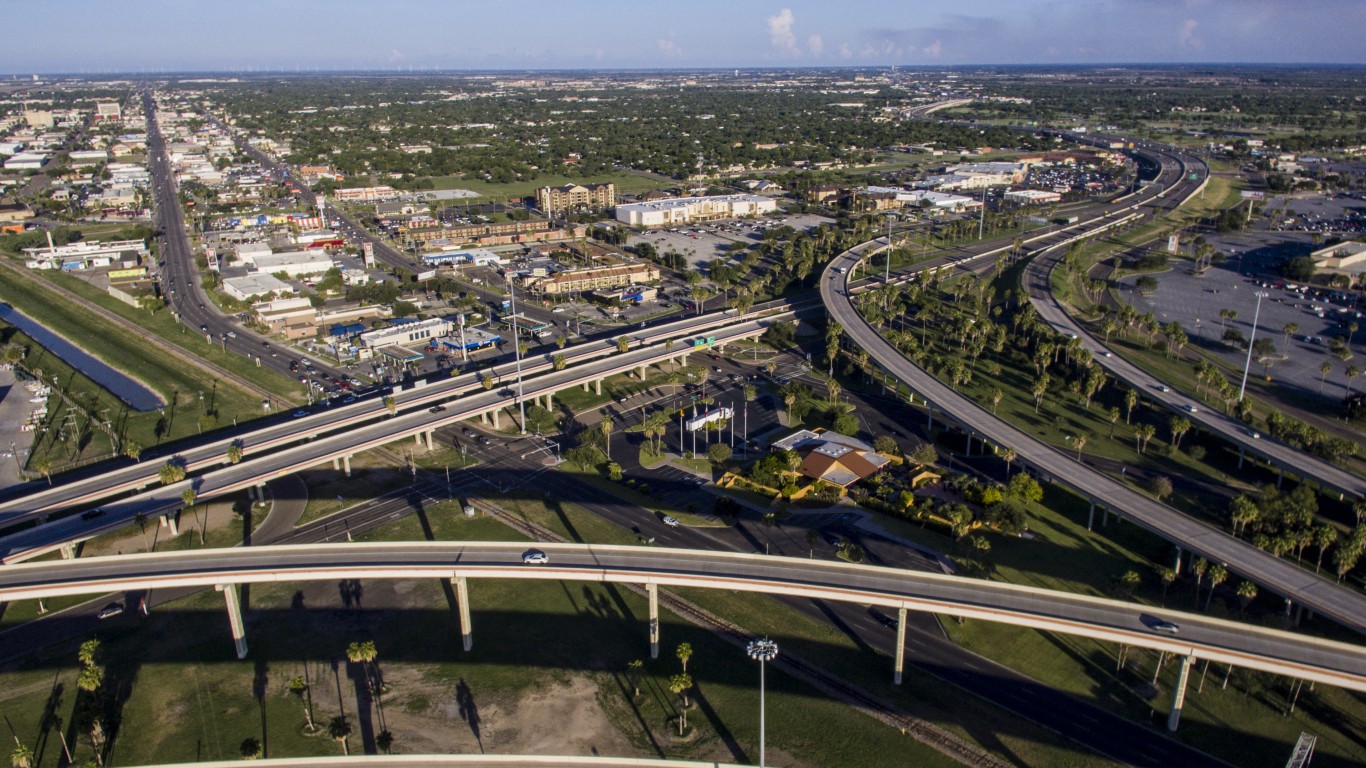
Source: Rgv17_956 / Wikimedia Commons
3. McAllen-Edinburg-Mission, TX
> Median household income: $37,106
> Median income change 2016-2017: +$930 (+2.6%)
> Median home value: $86,100 (bottom 10%)
> Adults with a bachelor’s degree: 18.7% (bottom 10%)
> July unemployment: 6.4% (top 10%)
Source: DavieJones13 / Getty Images
2. Brownsville-Harlingen, TX
> Median household income: $36,975
> Median income change 2016-2017: -$86 (-0.2%)
> Median home value: $92,000 (bottom 10%)
> Adults with a bachelor’s degree: 18.1% (bottom 10%)
> July unemployment: 6.2% (top 10%)
[in-text-ad]

Source: Chuck Schultz from Anniston, AL, USA, upload by Herrick / Wikimedia Commons
1. Sebring, FL
> Median household income: $35,543
> Median income change 2016-2017: -$947 (-2.6%)
> Median home value: $100,200 (bottom 10%)
> Adults with a bachelor’s degree: 17.8% (bottom 10%)
> July unemployment: 4.9% (top 20%)
Detailed Findings
While the unemployment rate is approaching record lows in the United States, joblessness remains high in many low-income American cities. Just seven metro areas on this list have a lower July unemployment rate than the 3.9% national rate.
The weak job market and low incomes in cities on this list are likely partially attributable to the cities’ low educational attainment rates. High-paying companies that offer high-skilled jobs will often establish operations in cities with a well-educated population, and are less likely to move to areas with low educational attainment. Gainesville, Florida — home to the University of Florida — is the only metro area on this list home to a larger share of college-educated adults than the national 32% college attainment rate. In almost half of the metro areas on this list, fewer than one in five adults have a four-year college education.
Cities with low median incomes also tend to have higher concentrations of residents facing serious financial hardship. The Department of Health and Human Services sets the poverty level at an annual income of $25,100 for a family of four in the contiguous 48 states. Every metro area on this list has a higher poverty rate than the 13.4% national rate.
A greater prevalence of serious financial hardship often means a greater need for government assistance. In 39 of the 42 metro areas on this list, a larger share of residents rely on SNAP benefits — also known as food stamps — than the 11.7% national share.
Property values tend to mirror income levels, and real estate is relatively inexpensive in America’s poorest cities. Grants Pass, Oregon is the only metro area with a median income below $45,000 where the typical home value exceeds the national median home value of $217,600. In seven metro areas on this list, over half of all homes are worth less than $100,000.
Methodology
To determine the poorest cities in America, 24/7 Wall St. reviewed data from the U.S. Census Bureau’s 2017 American Community Survey. We identified the 42 U.S. metropolitan statistical areas with median annual household incomes below $45,000. Poverty rates, median home values, SNAP recipiency rates, and educational attainment rates also came from the ACS. Unemployment rates are from the Bureau of Labor Statistics and are seasonally adjusted for July 2018, the most recent period for which data is available.
Sponsored: Find a Qualified Financial Advisor
Finding a qualified financial advisor doesn’t have to be hard. SmartAsset’s free tool matches you with up to 3 fiduciary financial advisors in your area in 5 minutes. Each advisor has been vetted by SmartAsset and is held to a fiduciary standard to act in your best interests. If you’re ready to be matched with local advisors that can help you achieve your financial goals, get started now.
Thank you for reading! Have some feedback for us?
Contact the 24/7 Wall St. editorial team.
Editors' Picks

