States With the Highest Voter Turnout
September 24, 2018 by Grant SunesonIn the 2016 U.S. presidential election, more than 137 million American adults, or 61.4% of those 18 years and older, went to the polls to cast their votes. However, voter turnout was not evenly distributed over the 50 states.
Maine had the highest voter turnout rate of any state at 72.7%. Hawaii had the lowest voter turnout by far, at just 47.3%. The voter turnout in the District of Columbia was higher than that of any state at 74.3%.
It is not entirely clear what drives voter turnout higher in some states, though people do seem to be more likely to vote in tight races. If one candidate is polling well ahead of another, voters may not feel their vote would make a difference.
In each of the five states with the highest voter turnout in 2016, the winning presidential candidate’s margin of victory was less than 3 percentage points. In the five states with the lowest turnout, the margin of victory was at least 8 percentage points, and often well above that.
Additionally, presidential elections have a much higher rate of voter turnout than midterm elections. Just 41.9% of voting age American adults cast a ballot in the 2014 midterm elections for congress. No midterm has had voter turnout over 50% since 1982. Meanwhile, all presidential elections have had voter turnout around 60% over the same period.
24/7 Wall St. reviewed U.S. Census Bureau data to determine the states with the highest and lowest voter participation rates in 2016.
Click here to see each state’s voter turnout.
Click here to read our detailed findings and methodology.

50. Hawaii
> 2016 voter turnout: 47.3%
> 2016 winning candidate’s party: Democrat, +32.2%
> 2014 midterm voter turnout: 41.8%
> Population 65+: 16.1%
> Poverty rate: 7.3%
[in-text-ad]
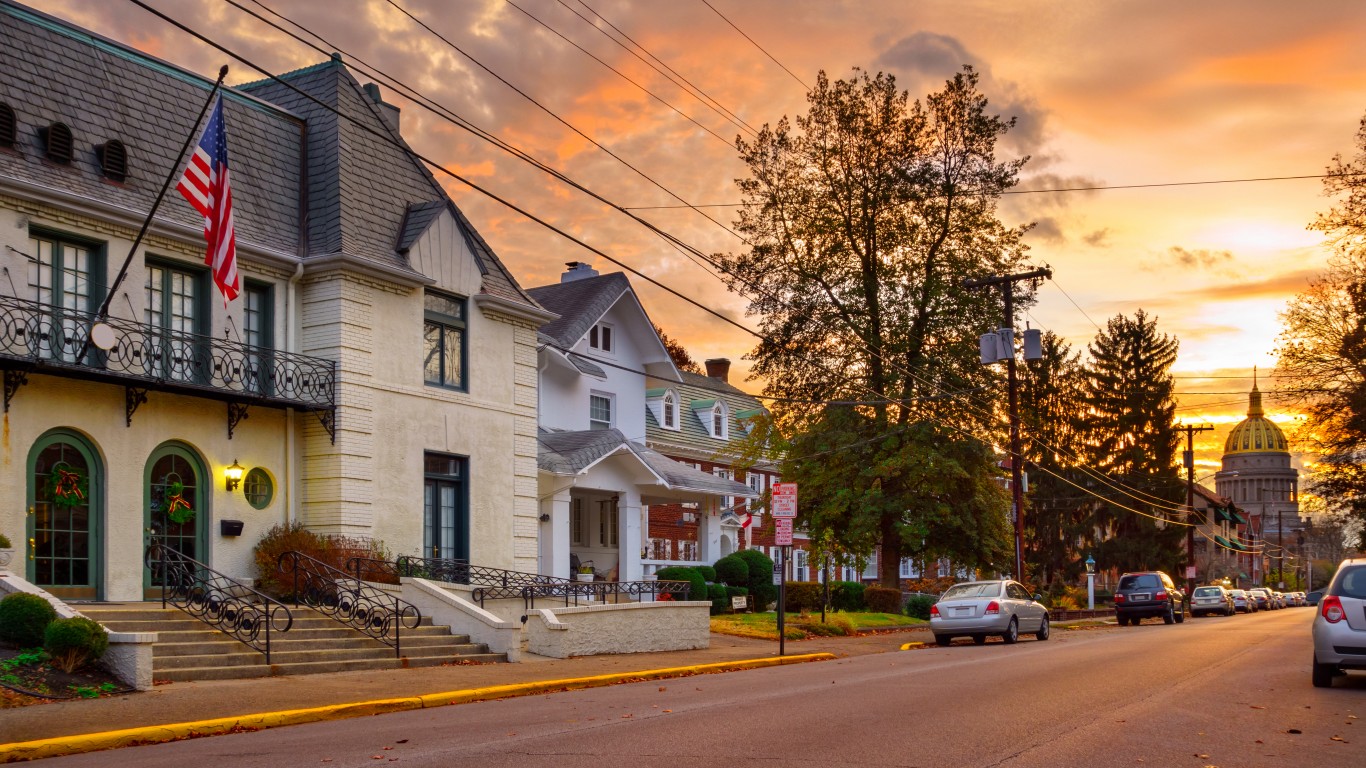
49. West Virginia
> 2016 voter turnout: 50.8%
> 2016 winning candidate’s party: Republican, +42.2%
> 2014 midterm voter turnout: 33.6%
> Population 65+: 17.8%
> Poverty rate: 12.9%

48. Tennessee
> 2016 voter turnout: 54.0%
> 2016 winning candidate’s party: Republican, +26.2%
> 2014 midterm voter turnout: 36.6%
> Population 65+: 15.0%
> Poverty rate: 12.9%
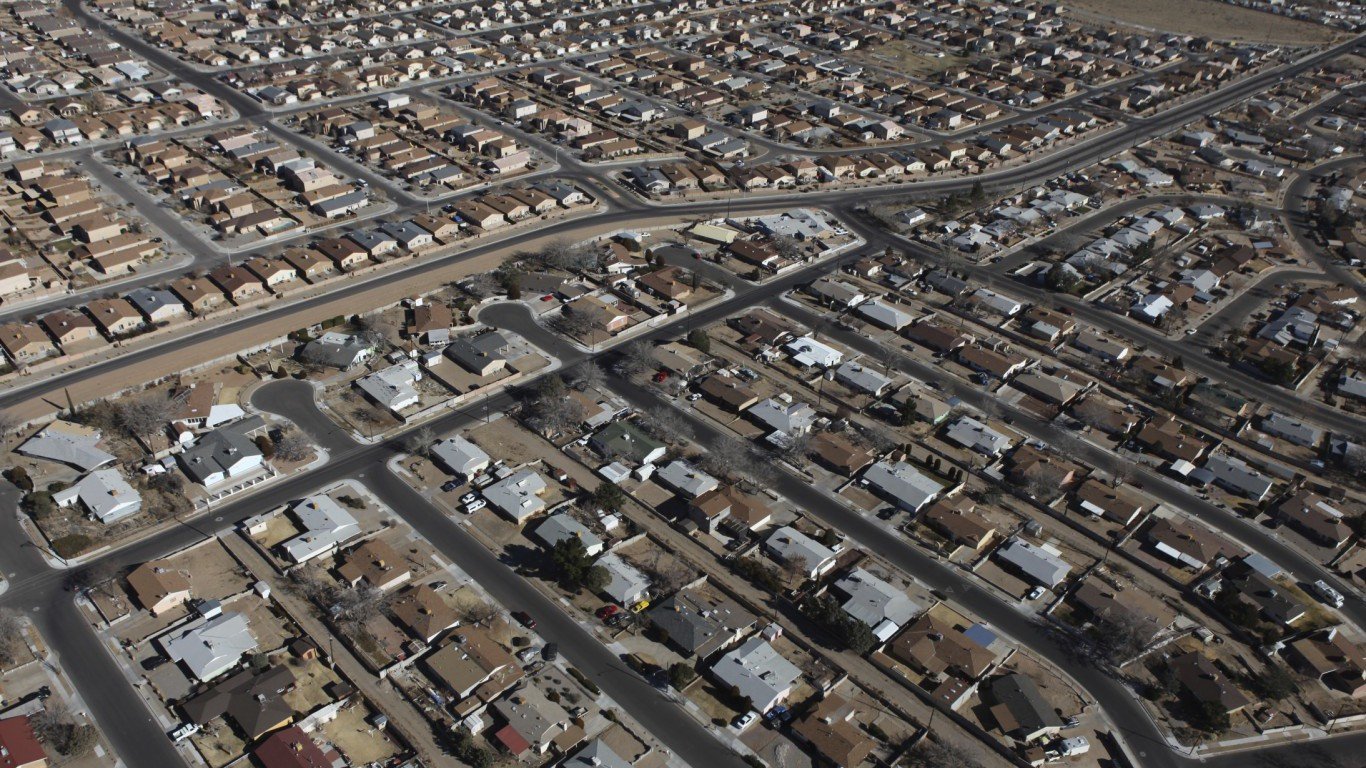
47. New Mexico
> 2016 voter turnout: 54.8%
> 2016 winning candidate’s party: Democrat, +8.3%
> 2014 midterm voter turnout: 45.6%
> Population 65+: 15.3%
> Poverty rate: 15.9%
[in-text-ad-2]

46. Texas
> 2016 voter turnout: 55.4%
> 2016 winning candidate’s party: Republican, +9.2%
> 2014 midterm voter turnout: 34.6%
> Population 65+: 11.5%
> Poverty rate: 13.0%
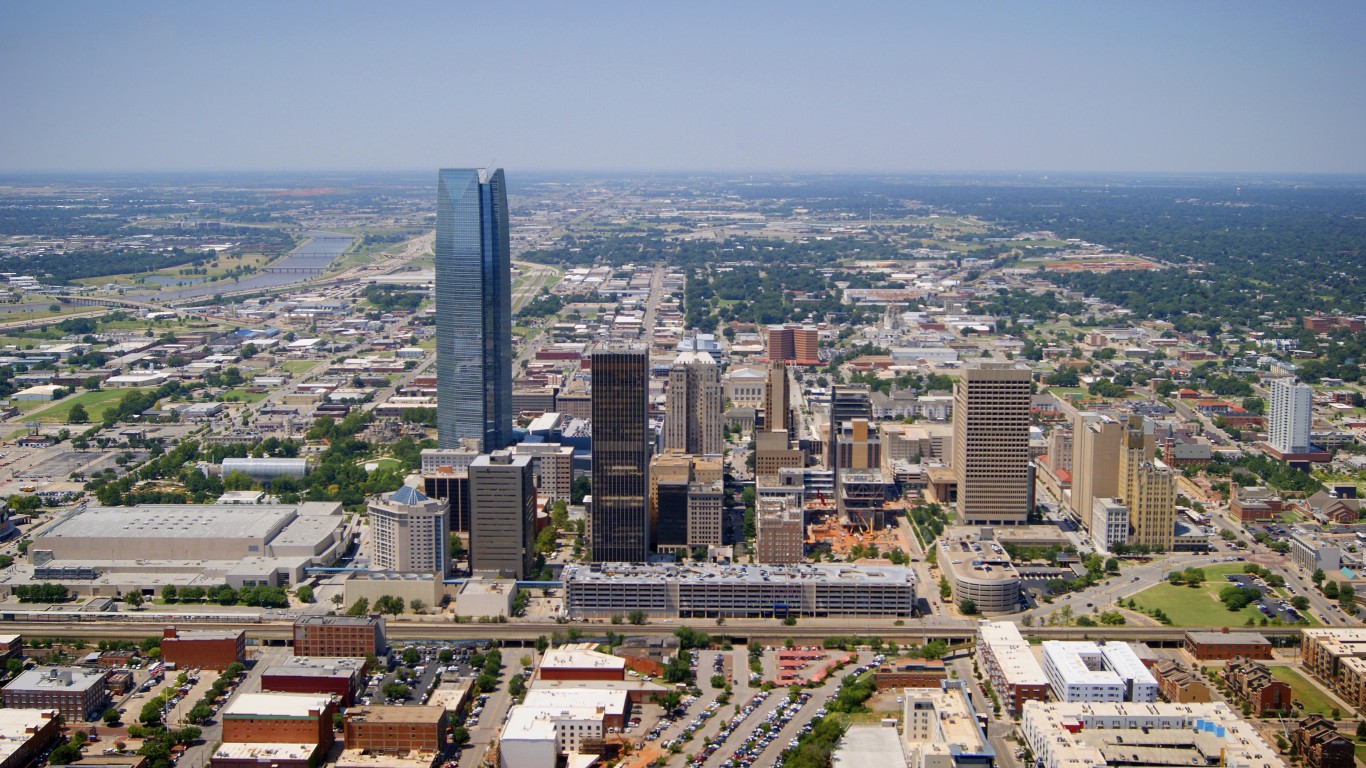
45. Oklahoma
> 2016 voter turnout: 56.6%
> 2016 winning candidate’s party: Republican, +36.4%
> 2014 midterm voter turnout: 34.2%
> Population 65+: 14.5%
> Poverty rate: 12.2%
[in-text-ad]

44. Kentucky
> 2016 voter turnout: 57.0%
> 2016 winning candidate’s party: Republican, +29.8%
> 2014 midterm voter turnout: 47.5%
> Population 65+: 14.8%
> Poverty rate: 14.3%
 24/7 Wall St.
43. New York
> 2016 voter turnout: 57.2%
> 2016 winning candidate’s party: Democrat, +21.3%
> 2014 midterm voter turnout: 34.4%
> Population 65+: 14.7%
> Poverty rate: 11.7%

42. Alabama
> 2016 voter turnout: 57.4%
> 2016 winning candidate’s party: Republican, +28.3%
> 2014 midterm voter turnout: 42.5%
> Population 65+: 15.3%
> Poverty rate: 14.0%
[in-text-ad-2]
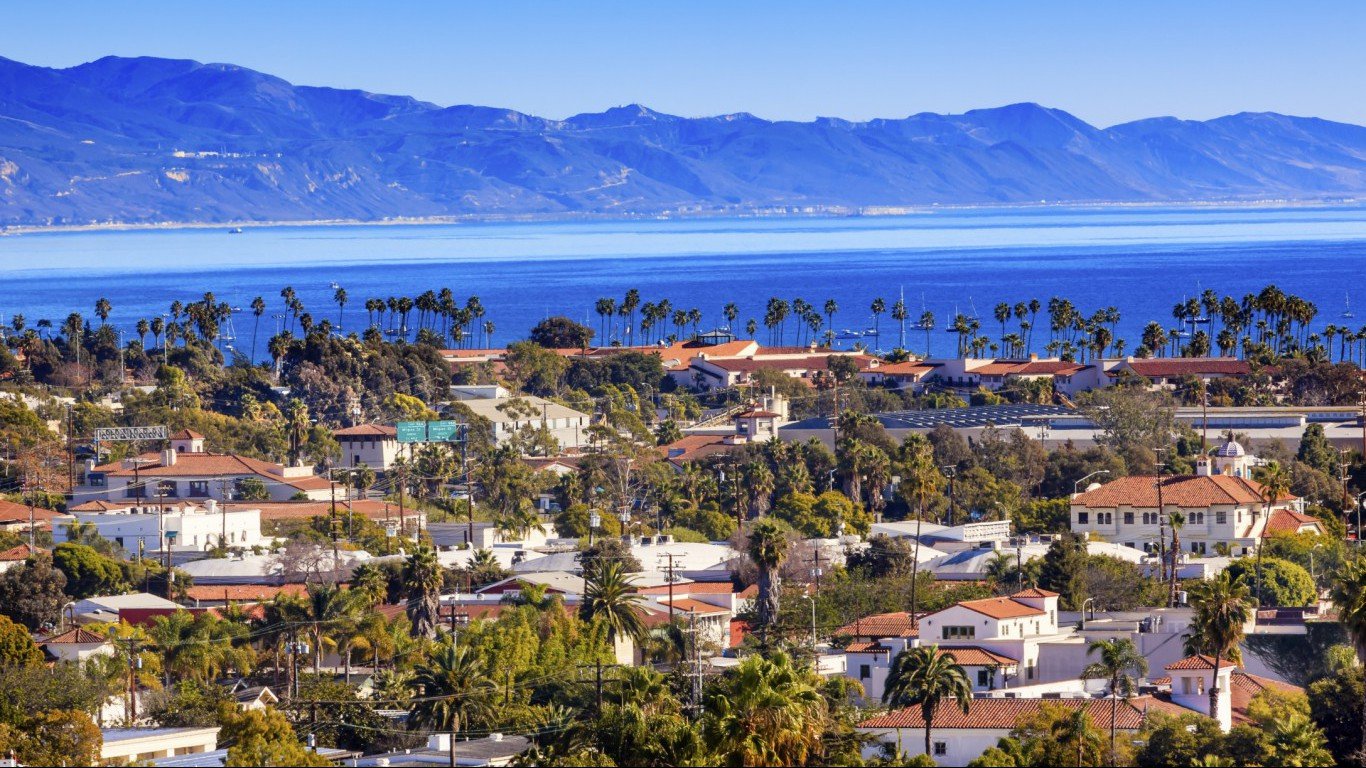
41. California
> 2016 voter turnout: 57.9%
> 2016 winning candidate’s party: Democrat, +28.8%
> 2014 midterm voter turnout: 36.6%
> Population 65+: 12.9%
> Poverty rate: 11.8%
40. Indiana
> 2016 voter turnout: 58.3%
> 2016 winning candidate’s party: Republican, +19.3%
> 2014 midterm voter turnout: 35.1%
> Population 65+: 14.3%
> Poverty rate: 10.7%
[in-text-ad]
39. Arkansas
> 2016 voter turnout: 58.7%
> 2016 winning candidate’s party: Republican, +26.6%
> 2014 midterm voter turnout: 38.8%
> Population 65+: 15.7%
> Poverty rate: 13.8%
38. South Dakota
> 2016 voter turnout: 59.1%
> 2016 winning candidate’s party: Republican, +29.8%
> 2014 midterm voter turnout: 44.1%
> Population 65+: 15.2%
> Poverty rate: 8.9%
37. Florida
> 2016 voter turnout: 59.5%
> 2016 winning candidate’s party: Republican, +1.3%
> 2014 midterm voter turnout: 44.8%
> Population 65+: 19.1%
> Poverty rate: 11.7%
[in-text-ad-2]

36. Georgia
> 2016 voter turnout: 60.2%
> 2016 winning candidate’s party: Republican, +5.7%
> 2014 midterm voter turnout: 43.2%
> Population 65+: 12.3%
> Poverty rate: 13.6%
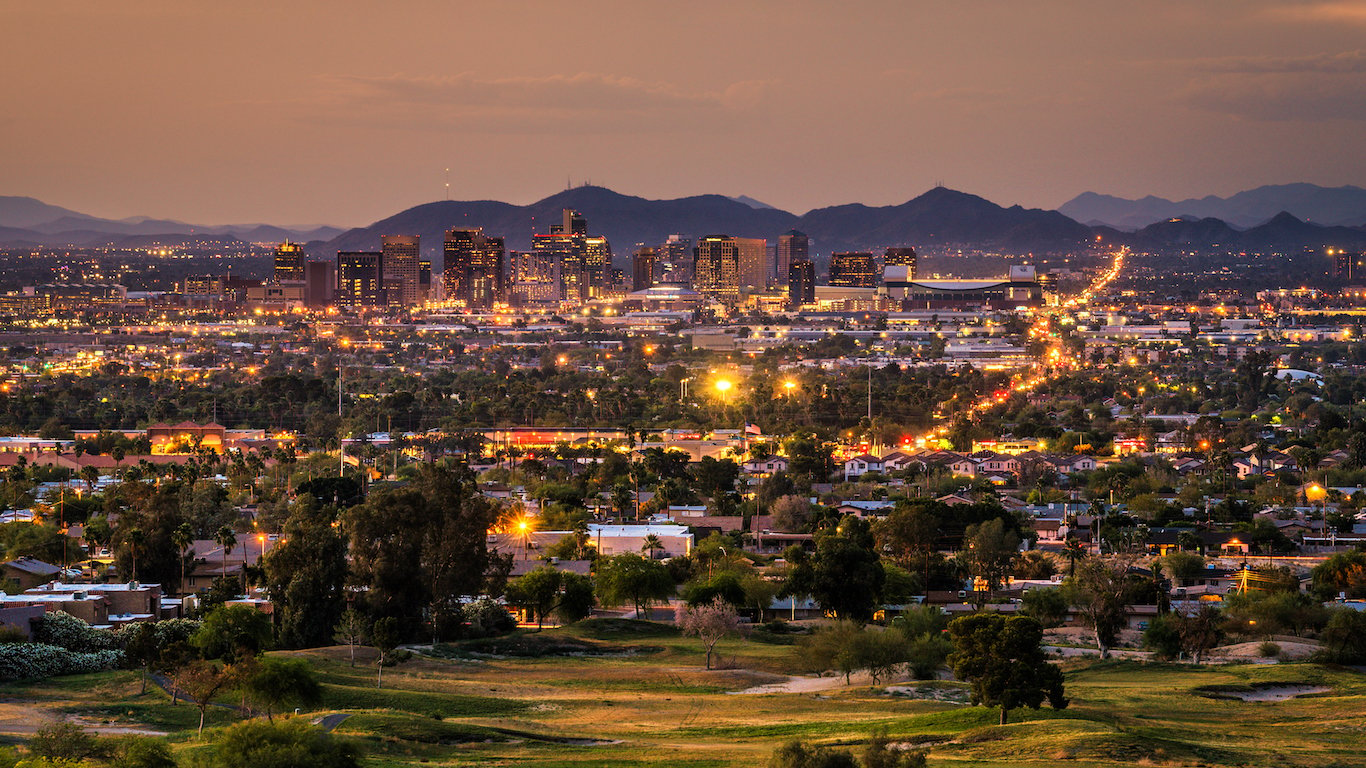
35. Arizona
> 2016 voter turnout: 60.4%
> 2016 winning candidate’s party: Republican, +4.1%
> 2014 midterm voter turnout: 40.6%
> Population 65+: 15.9%
> Poverty rate: 12.9%
[in-text-ad]
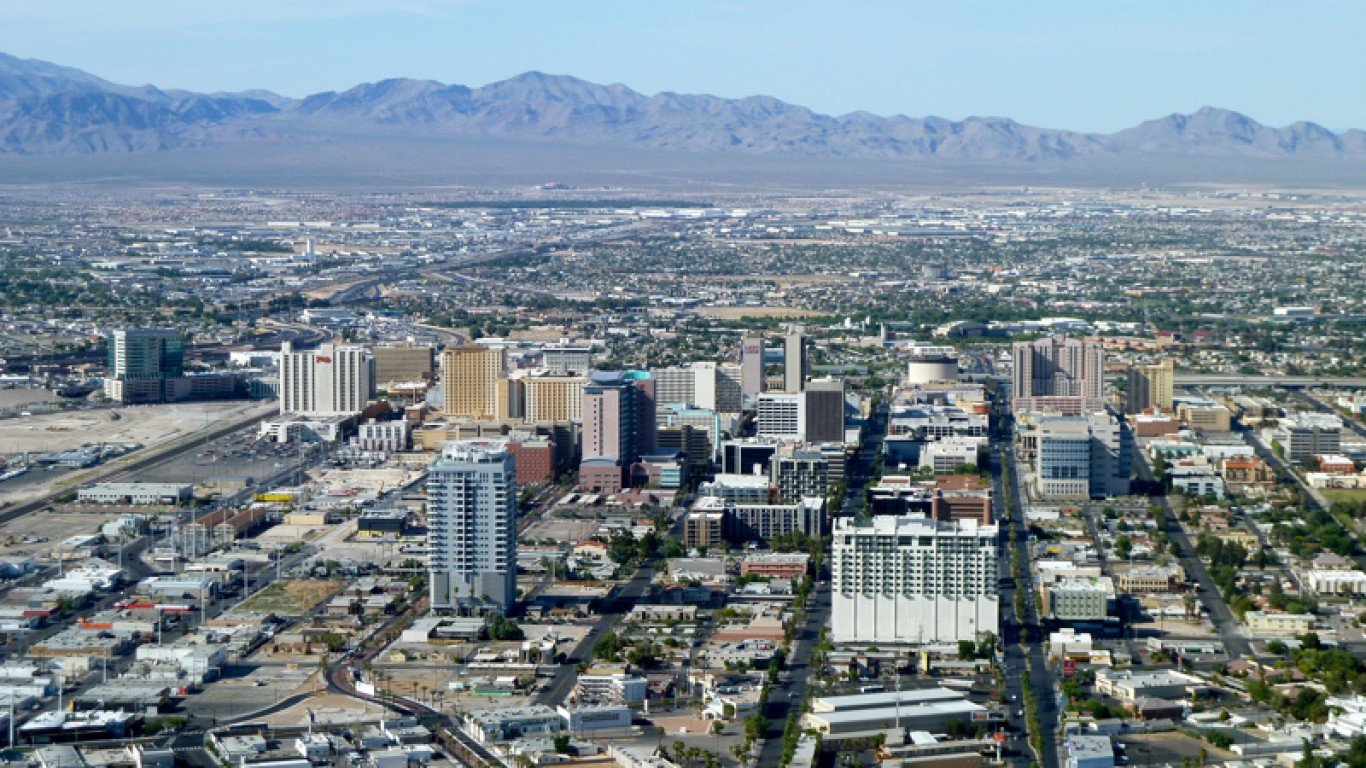
34. Nevada
> 2016 voter turnout: 60.5%
> 2016 winning candidate’s party: Democrat, +2.4%
> 2014 midterm voter turnout: 37.3%
> Population 65+: 14.1%
> Poverty rate: 11.0%

33. Rhode Island
> 2016 voter turnout: 60.6%
> 2016 winning candidate’s party: Democrat, +15.6%
> 2014 midterm voter turnout: 43.3%
> Population 65+: 15.8%
> Poverty rate: 9.8%

32. Kansas
> 2016 voter turnout: 61.3%
> 2016 winning candidate’s party: Republican, +21.0%
> 2014 midterm voter turnout: 48.3%
> Population 65+: 14.3%
> Poverty rate: 8.8%
[in-text-ad-2]
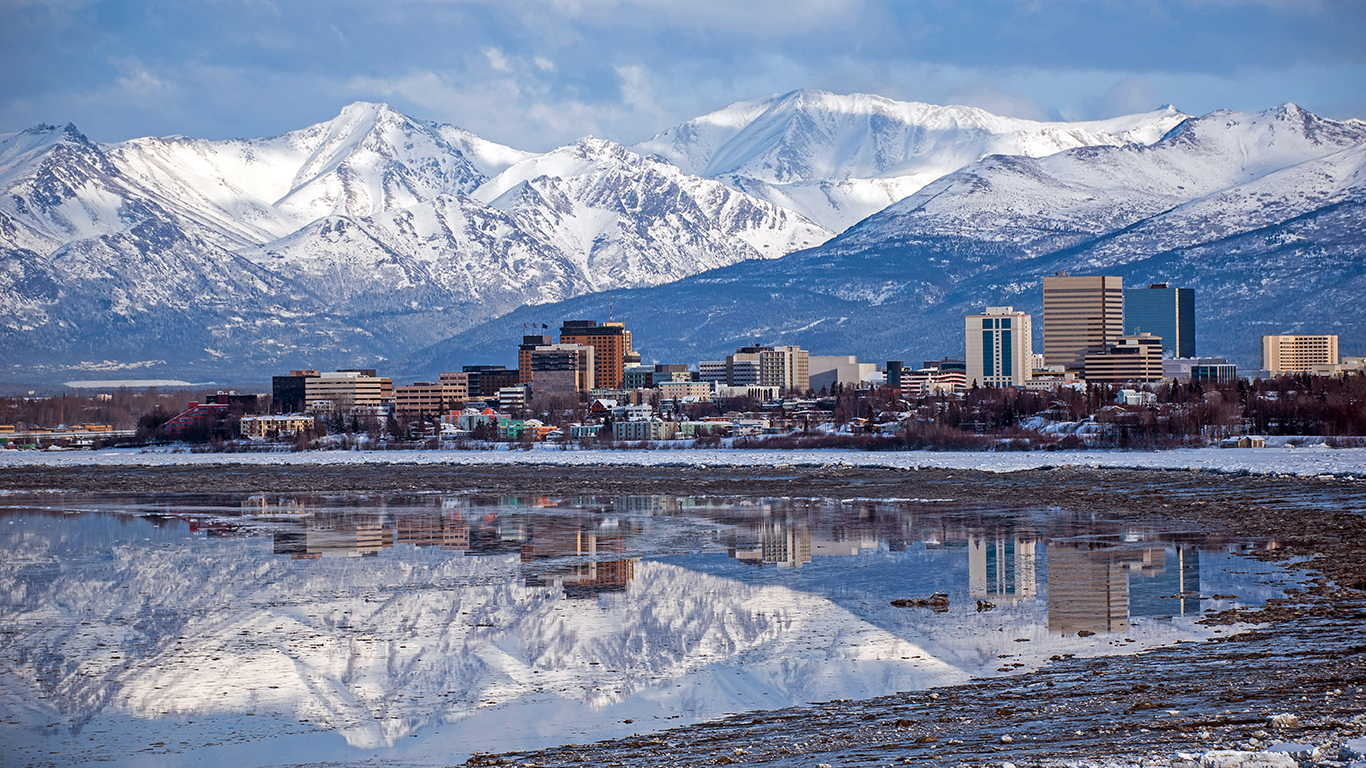
31. Alaska
> 2016 voter turnout: 61.3%
> 2016 winning candidate’s party: Republican, +15.2%
> 2014 midterm voter turnout: 50.7%
> Population 65+: 9.4%
> Poverty rate: 7.0%

30. New Jersey
> 2016 voter turnout: 61.5%
> 2016 winning candidate’s party: Democrat, +13.2%
> 2014 midterm voter turnout: 36.4%
> Population 65+: 14.7%
> Poverty rate: 8.1%
[in-text-ad]

29. Louisiana
> 2016 voter turnout: 61.6%
> 2016 winning candidate’s party: Republican, +19.7%
> 2014 midterm voter turnout: 50.2%
> Population 65+: 13.6%
> Poverty rate: 15.1%

28. South Carolina
> 2016 voter turnout: 62.1%
> 2016 winning candidate’s party: Republican, +14.1%
> 2014 midterm voter turnout: 42.4%
> Population 65+: 15.8%
> Poverty rate: 12.8%
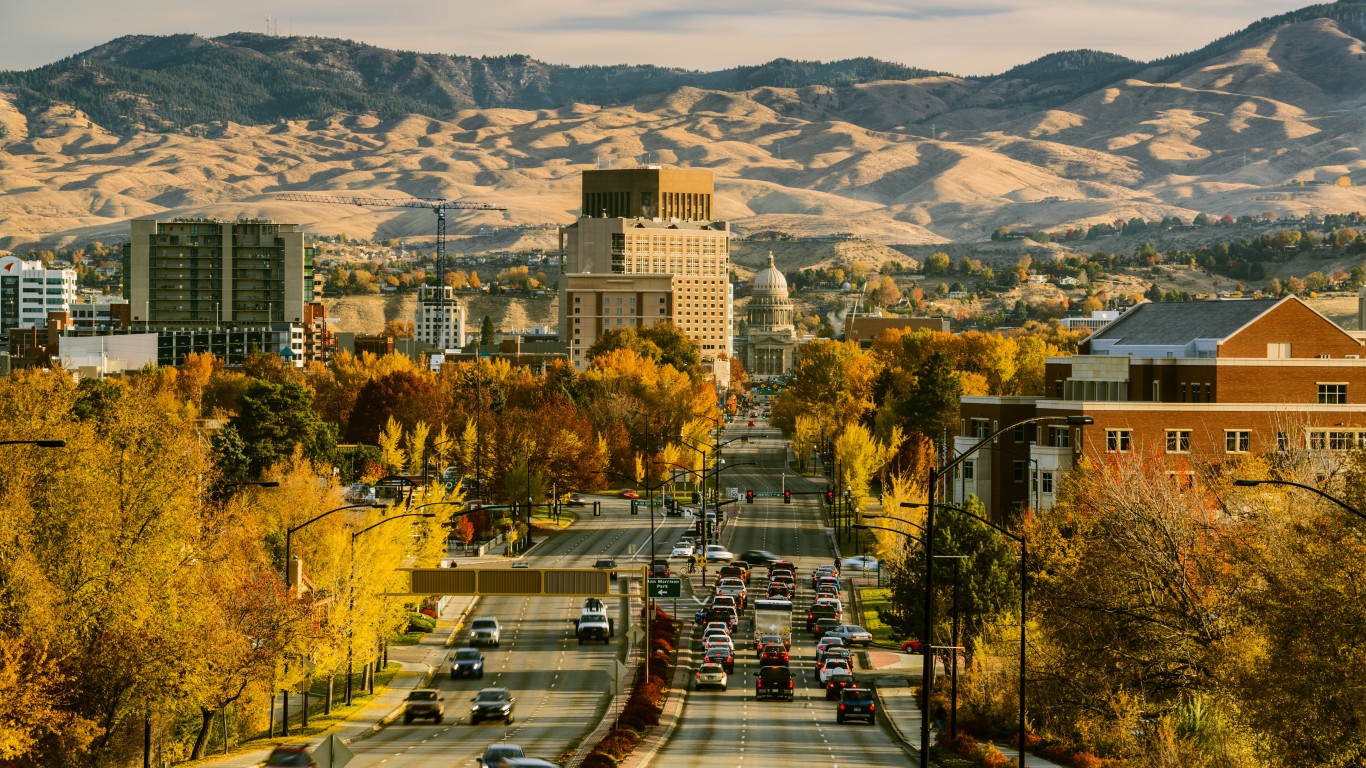
27. Idaho
> 2016 voter turnout: 62.1%
> 2016 winning candidate’s party: Republican, +31.6%
> 2014 midterm voter turnout: 41.8%
> Population 65+: 14.3%
> Poverty rate: 10.7%
[in-text-ad-2]

26. Delaware
> 2016 voter turnout: 62.3%
> 2016 winning candidate’s party: Democrat, +11.5%
> 2014 midterm voter turnout: 45.2%
> Population 65+: 16.5%
> Poverty rate: 8.2%
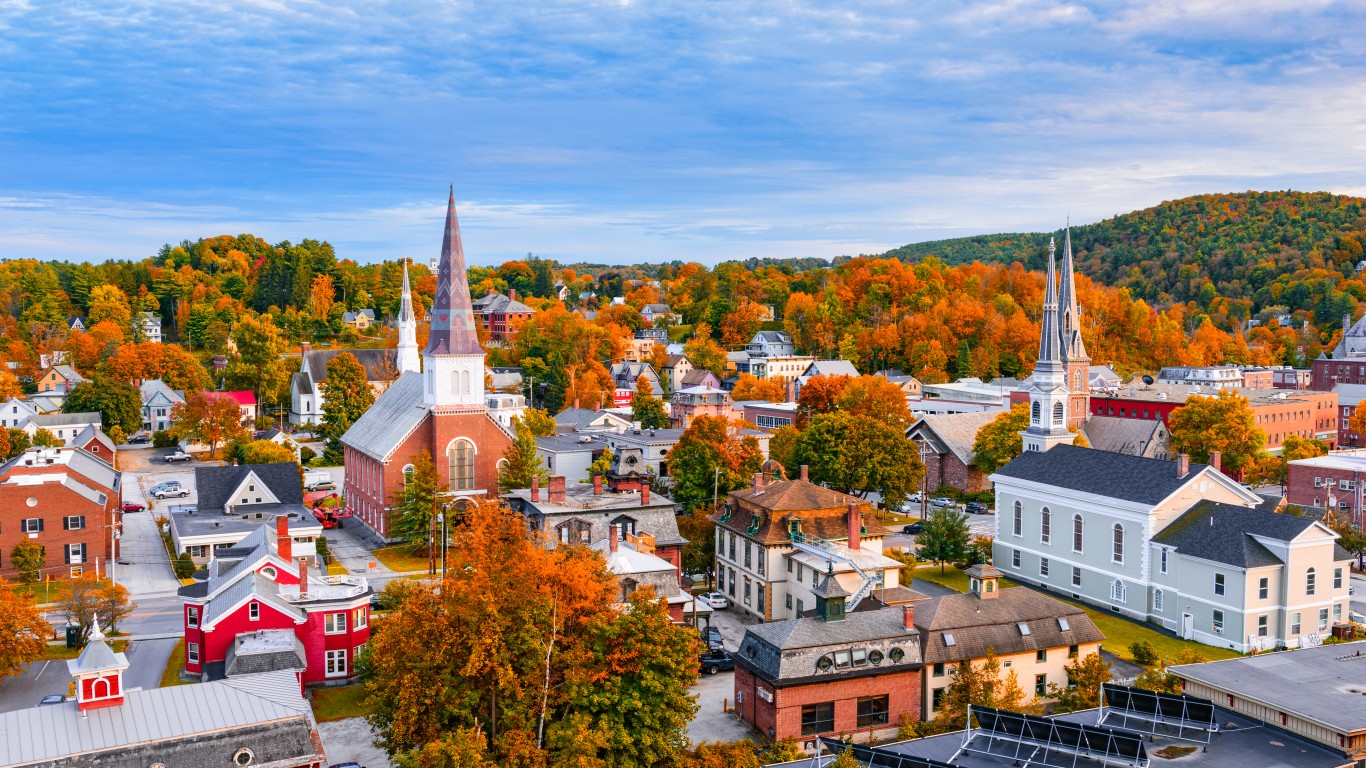
25. Vermont
> 2016 voter turnout: 62.5%
> 2016 winning candidate’s party: Democrat, +28.5%
> 2014 midterm voter turnout: 42.5%
> Population 65+: 17.0%
> Poverty rate: 7.5%
[in-text-ad]

24. Pennsylvania
> 2016 voter turnout: 62.6%
> 2016 winning candidate’s party: Republican, +1.2%
> 2014 midterm voter turnout: 40.0%
> Population 65+: 16.7%
> Poverty rate: 9.1%
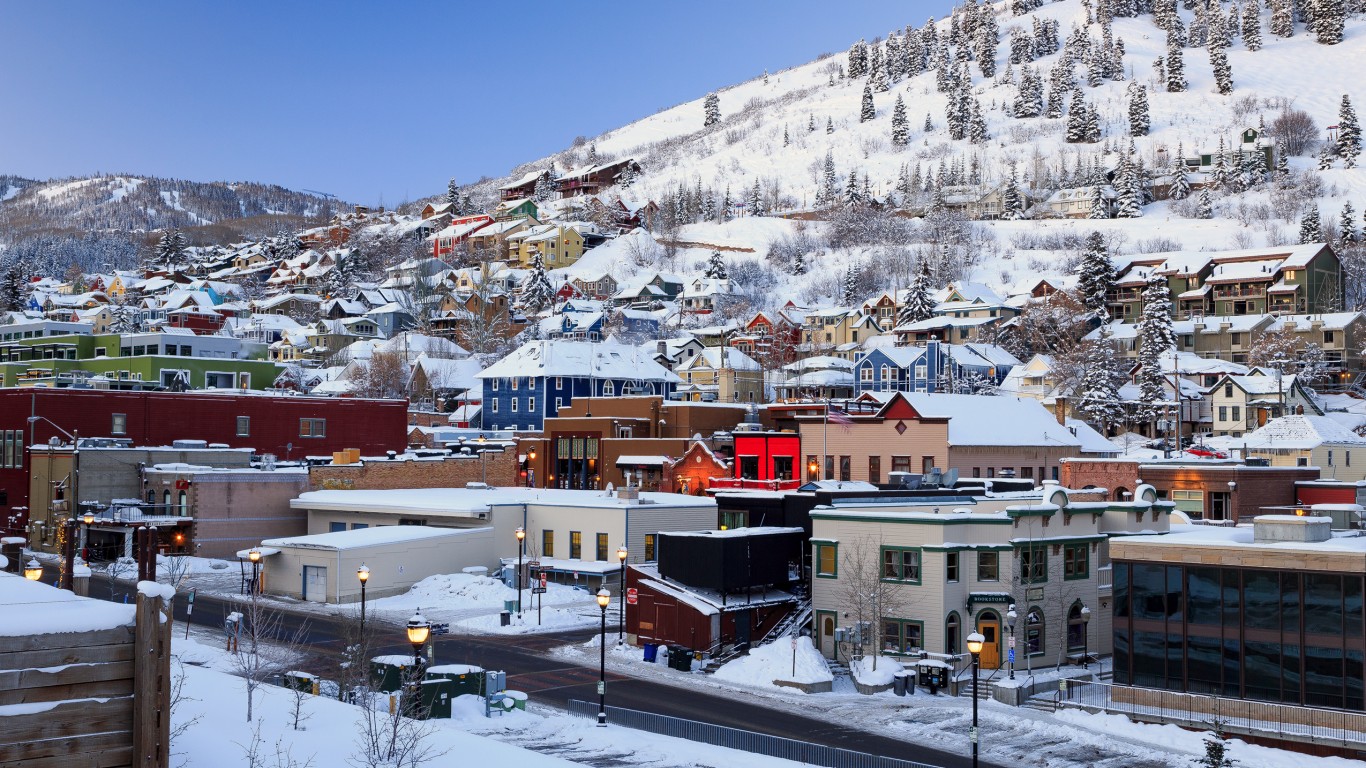
23. Utah
> 2016 voter turnout: 62.7%
> 2016 winning candidate’s party: Republican, +18.1%
> 2014 midterm voter turnout: 36.5%
> Population 65+: 10.0%
> Poverty rate: 8.4%
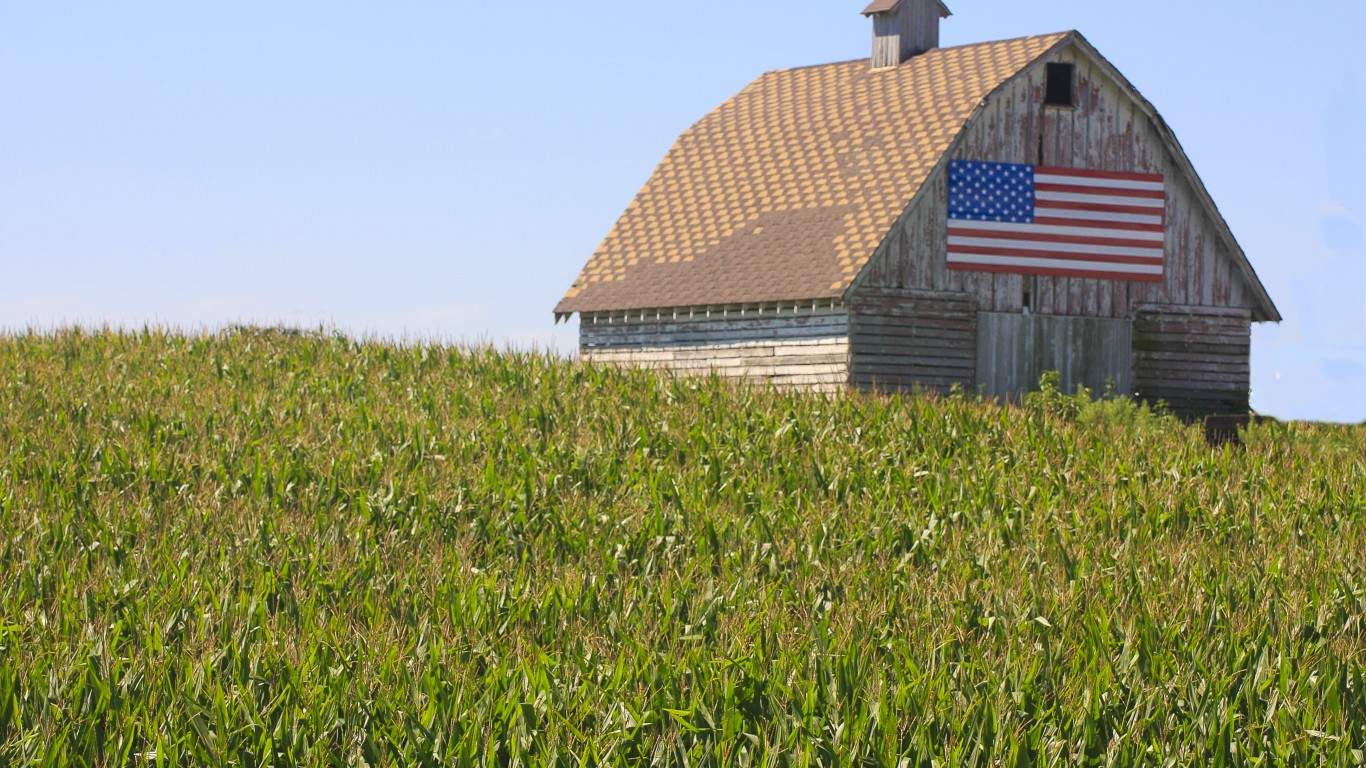
22. Iowa
> 2016 voter turnout: 63.4%
> 2016 winning candidate’s party: Republican, +9.6%
> 2014 midterm voter turnout: 52.9%
> Population 65+: 15.8%
> Poverty rate: 7.9%
[in-text-ad-2]
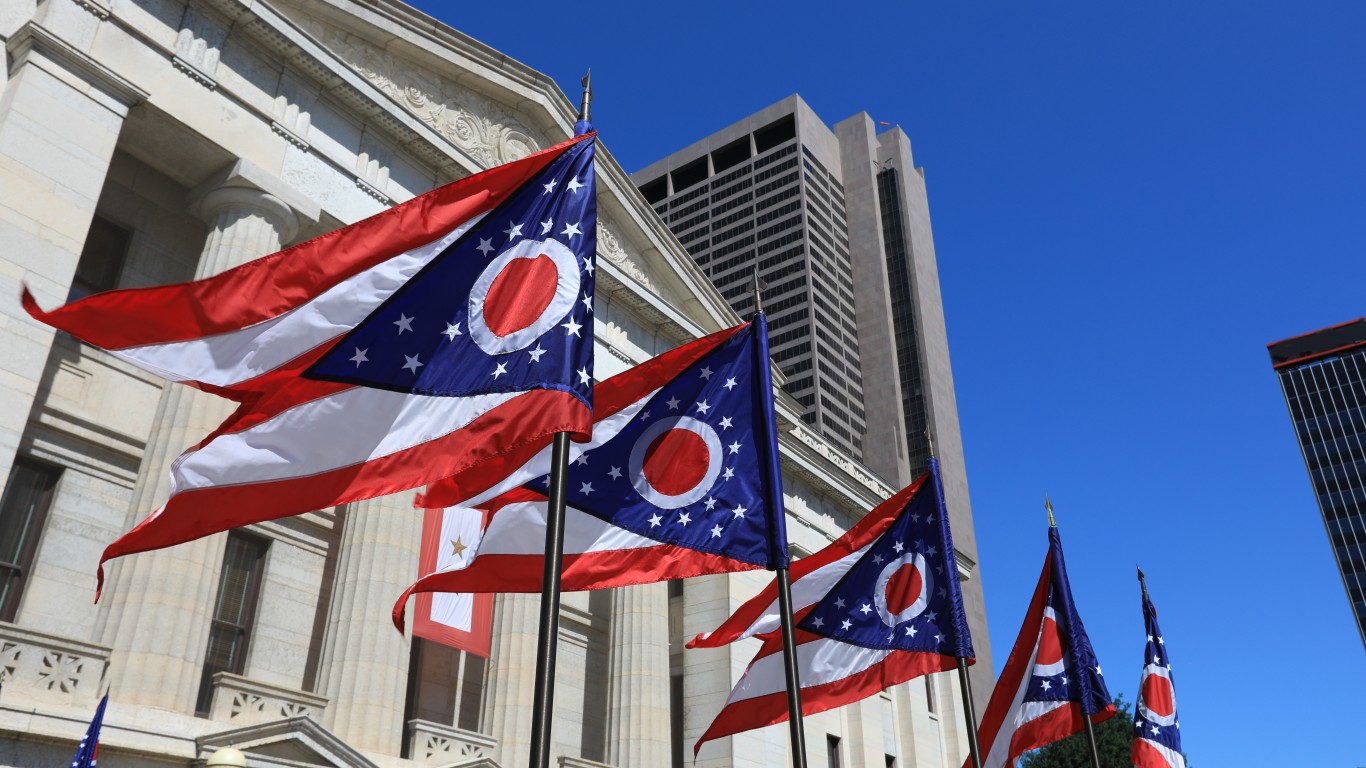
21. Ohio
> 2016 voter turnout: 63.6%
> 2016 winning candidate’s party: Republican, +8.6%
> 2014 midterm voter turnout: 39.7%
> Population 65+: 15.5%
> Poverty rate: 11.2%

20. Illinois
> 2016 voter turnout: 63.8%
> 2016 winning candidate’s party: Democrat, +16.0%
> 2014 midterm voter turnout: 41.7%
> Population 65+: 13.9%
> Poverty rate: 10.2%
[in-text-ad]

19. Connecticut
> 2016 voter turnout: 63.9%
> 2016 winning candidate’s party: Democrat, +13.3%
> 2014 midterm voter turnout: 46.7%
> Population 65+: 15.5%
> Poverty rate: 7.3%

18. North Dakota
> 2016 voter turnout: 64.2%
> 2016 winning candidate’s party: Republican, +36.3%
> 2014 midterm voter turnout: 51.0%
> Population 65+: 14.2%
> Poverty rate: 6.9%
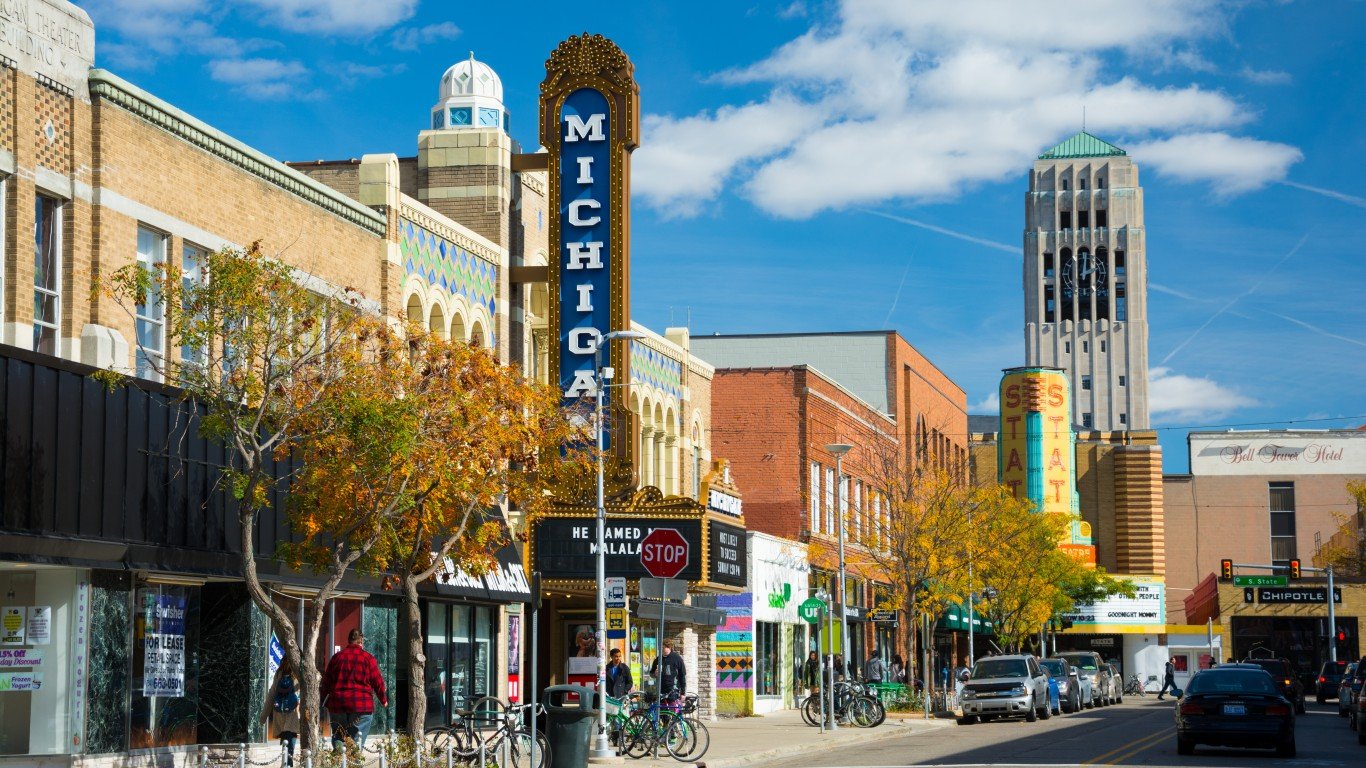
17. Michigan
> 2016 voter turnout: 64.3%
> 2016 winning candidate’s party: Republican, +0.3%
> 2014 midterm voter turnout: 47.1%
> Population 65+: 15.4%
> Poverty rate: 11.5%
[in-text-ad-2]

16. Missouri
> 2016 voter turnout: 64.8%
> 2016 winning candidate’s party: Republican, +19.1%
> 2014 midterm voter turnout: 38.7%
> Population 65+: 15.3%
> Poverty rate: 10.8%
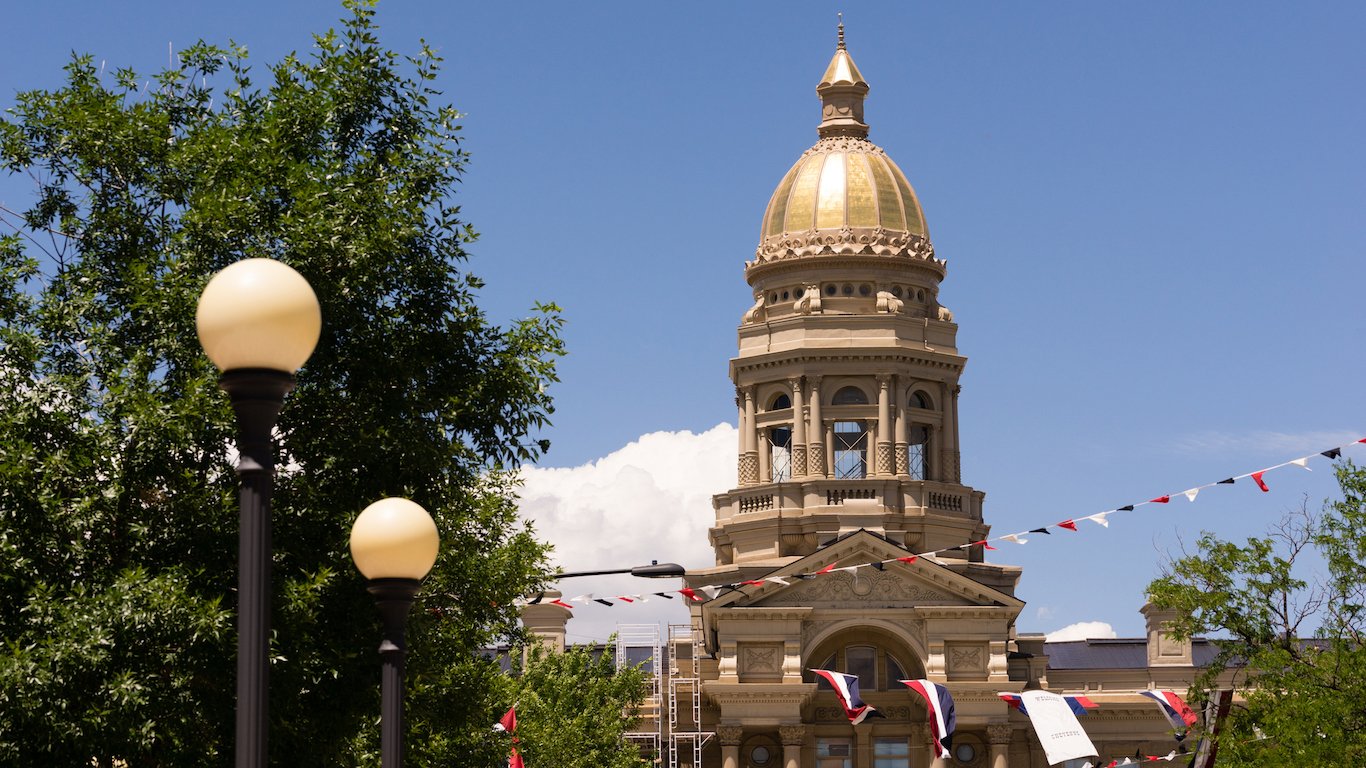
15. Wyoming
> 2016 voter turnout: 64.8%
> 2016 winning candidate’s party: Republican, +47.6%
> 2014 midterm voter turnout: 40.3%
> Population 65+: 13.8%
> Poverty rate: 7.6%
[in-text-ad]
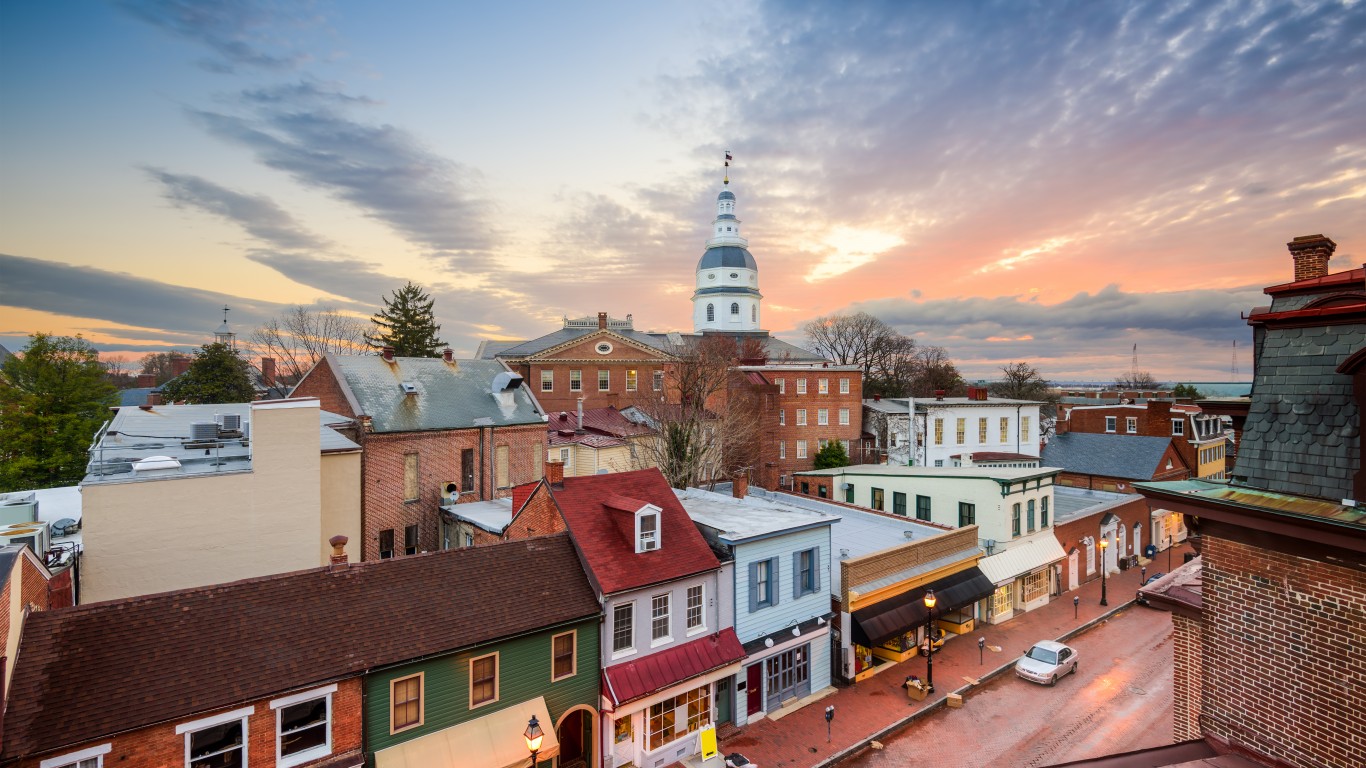
14. Maryland
> 2016 voter turnout: 65.8%
> 2016 winning candidate’s party: Democrat, +25.2%
> 2014 midterm voter turnout: 48.9%
> Population 65+: 13.8%
> Poverty rate: 6.8%
 24/7 Wall St.
13. Montana
> 2016 voter turnout: 65.9%
> 2016 winning candidate’s party: Republican, +20.5%
> 2014 midterm voter turnout: 50.1%
> Population 65+: 16.7%
> Poverty rate: 9.6%

12. Washington
> 2016 voter turnout: 66.3%
> 2016 winning candidate’s party: Democrat, +16.2%
> 2014 midterm voter turnout: 50.0%
> Population 65+: 14.0%
> Poverty rate: 8.4%
[in-text-ad-2]
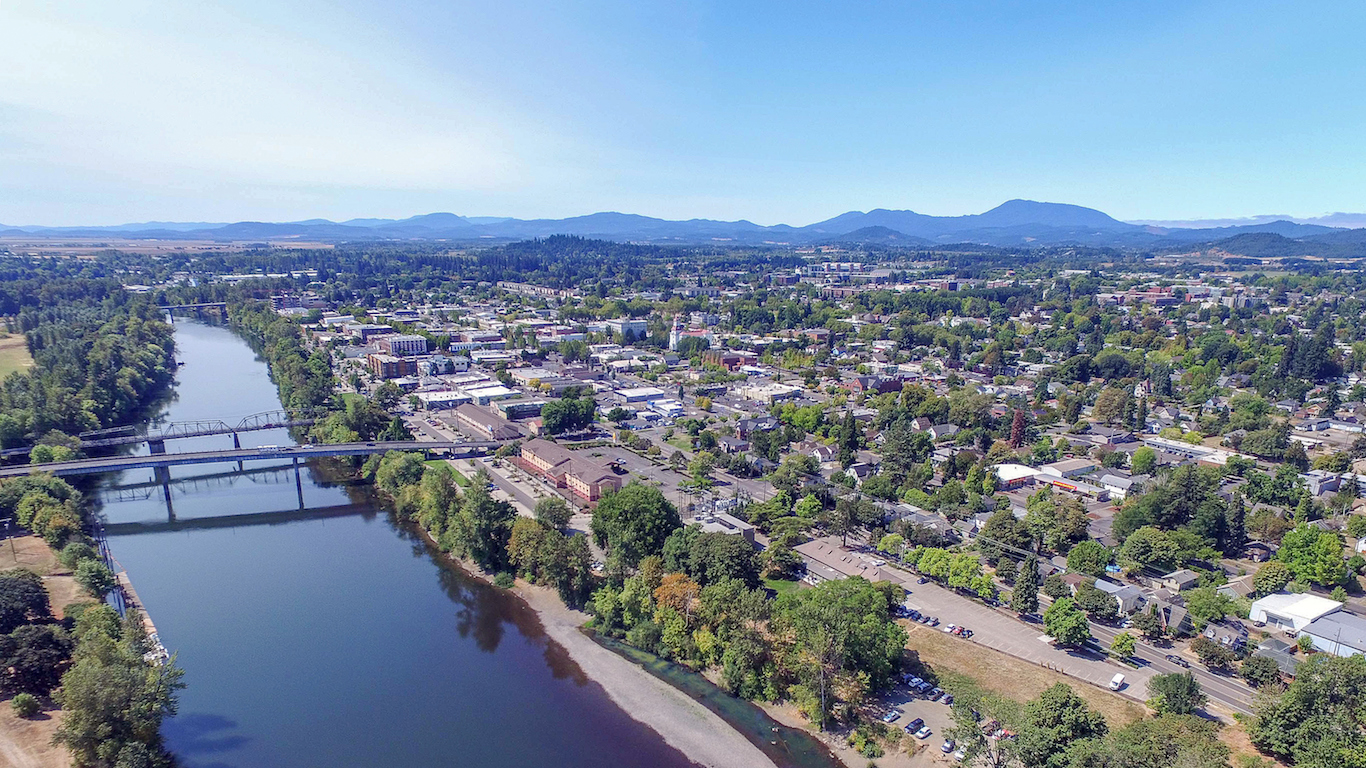
11. Oregon
> 2016 voter turnout: 66.3%
> 2016 winning candidate’s party: Democrat, +10.6%
> 2014 midterm voter turnout: 55.5%
> Population 65+: 15.9%
> Poverty rate: 10.5%

10. Massachusetts
> 2016 voter turnout: 66.7%
> 2016 winning candidate’s party: Democrat, +27.3%
> 2014 midterm voter turnout: 46.9%
> Population 65+: 15.1%
> Poverty rate: 8.0%
[in-text-ad]
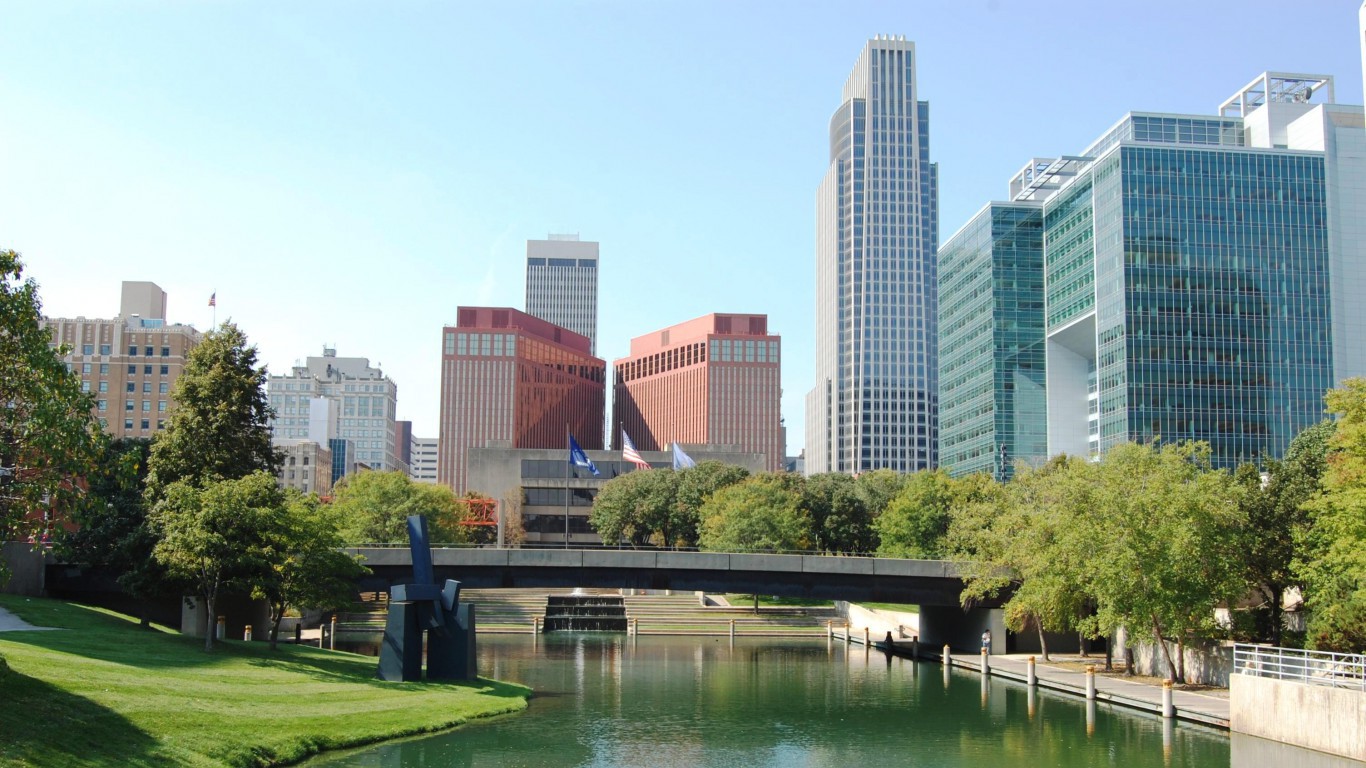
9. Nebraska
> 2016 voter turnout: 66.8%
> 2016 winning candidate’s party: Republican, +26.3%
> 2014 midterm voter turnout: 44.3%
> Population 65+: 14.4%
> Poverty rate: 8.4%
 24/7 Wall St.
8. North Carolina
> 2016 voter turnout: 67.5%
> 2016 winning candidate’s party: Republican, +3.8%
> 2014 midterm voter turnout: 46.2%
> Population 65+: 14.7%
> Poverty rate: 12.4%

7. Mississippi
> 2016 voter turnout: 67.7%
> 2016 winning candidate’s party: Republican, +18.6%
> 2014 midterm voter turnout: 42.3%
> Population 65+: 14.3%
> Poverty rate: 17.4%
[in-text-ad-2]

6. Virginia
> 2016 voter turnout: 68.2%
> 2016 winning candidate’s party: Democrat, +4.9%
> 2014 midterm voter turnout: 41.7%
> Population 65+: 13.8%
> Poverty rate: 8.1%

5. Minnesota
> 2016 voter turnout: 68.7%
> 2016 winning candidate’s party: Democrat, +1.5%
> 2014 midterm voter turnout: 52.0%
> Population 65+: 14.3%
> Poverty rate: 6.9%
[in-text-ad]
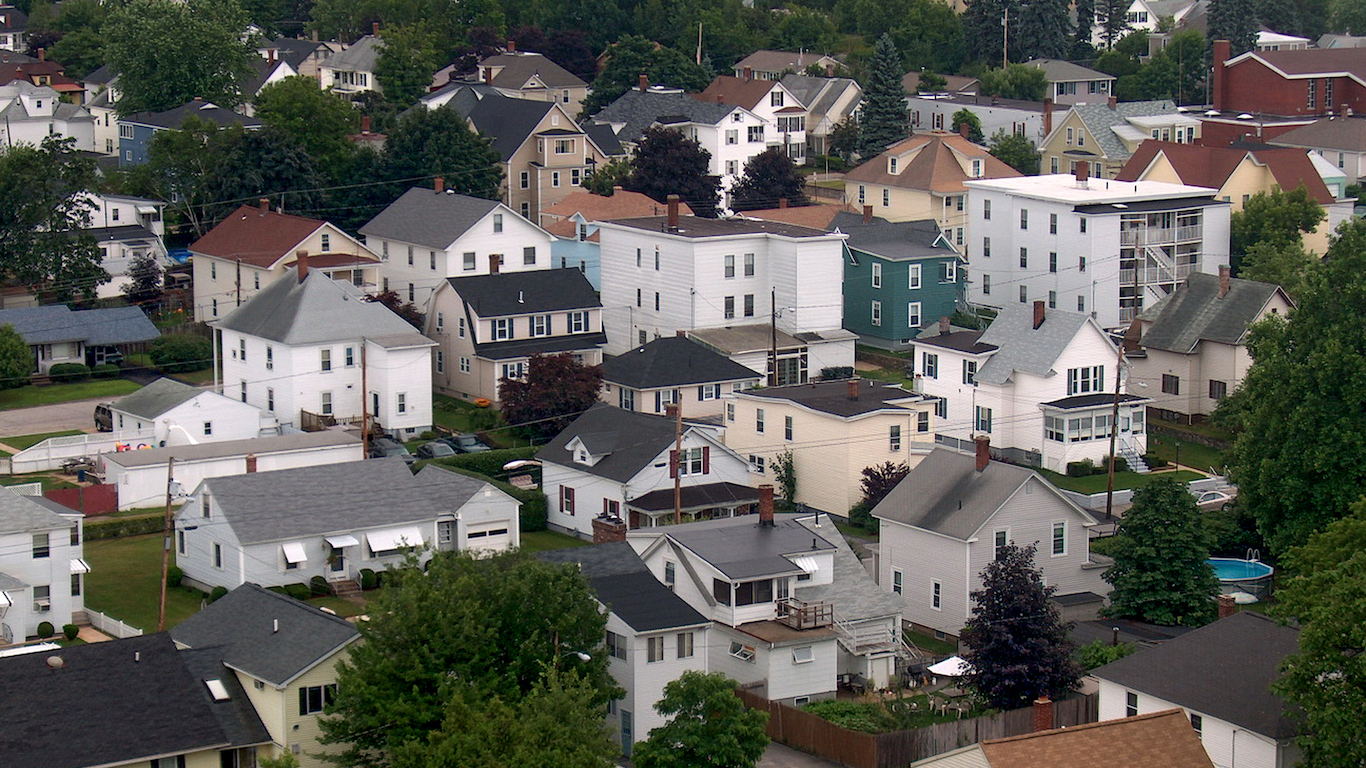
4. New Hampshire
> 2016 voter turnout: 69.0%
> 2016 winning candidate’s party: Democrat, +0.4%
> 2014 midterm voter turnout: 50.2%
> Population 65+: 15.8%
> Poverty rate: 5.3%
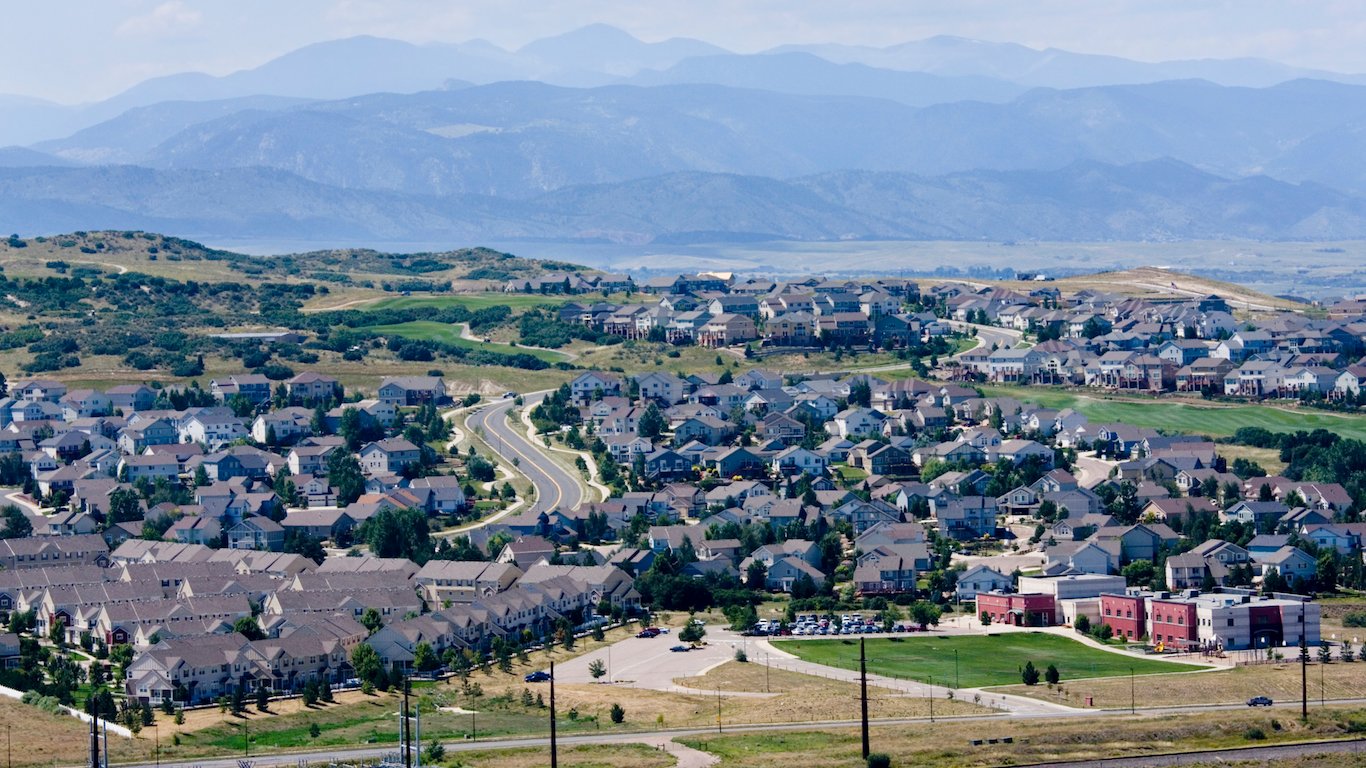
3. Colorado
> 2016 voter turnout: 69.5%
> 2016 winning candidate’s party: Democrat, +2.8%
> 2014 midterm voter turnout: 59.3%
> Population 65+: 12.7%
> Poverty rate: 8.1%
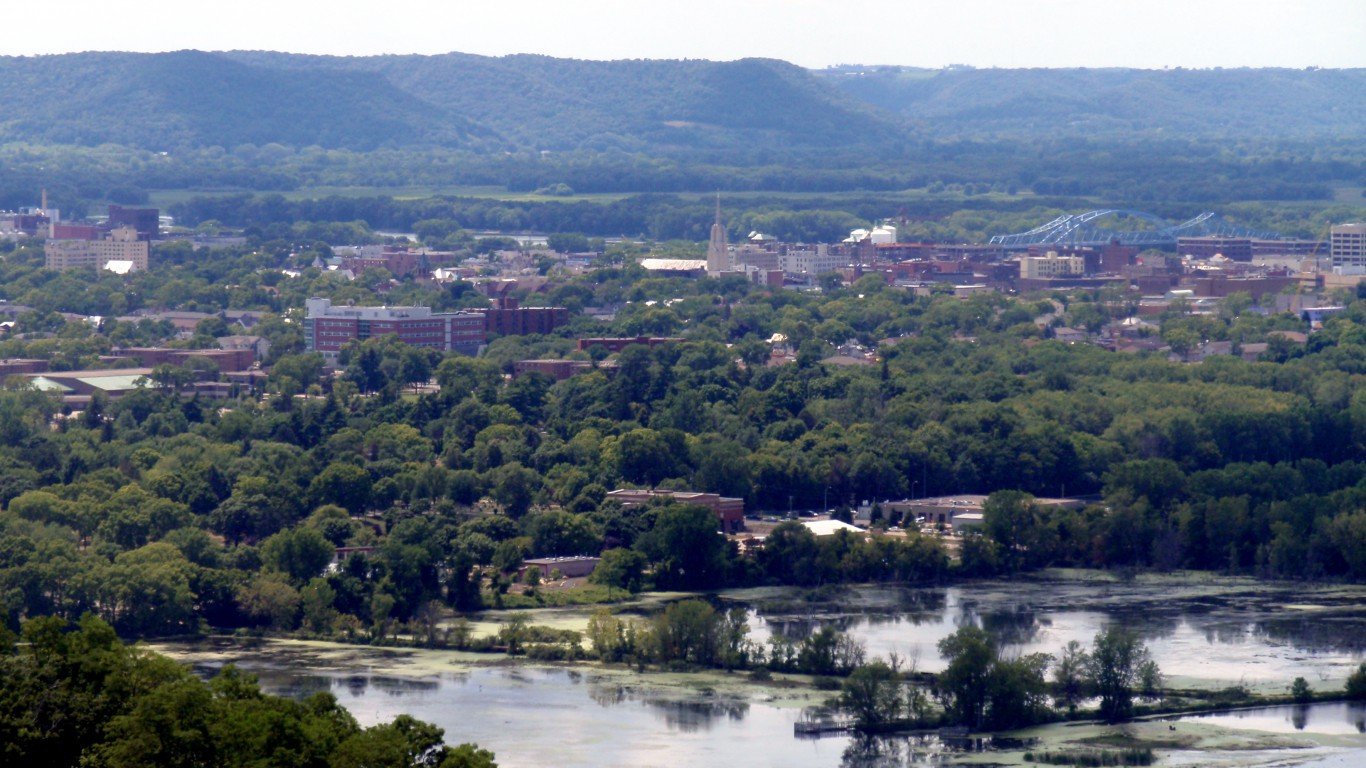
2. Wisconsin
> 2016 voter turnout: 70.5%
> 2016 winning candidate’s party: Republican, +1.0%
> 2014 midterm voter turnout: 55.4%
> Population 65+: 15.2%
> Poverty rate: 8.5%
[in-text-ad-2]

1. Maine
> 2016 voter turnout: 72.7%
> 2016 winning candidate’s party: Democrat, +2.7%
> 2014 midterm voter turnout: 61.5%
> Population 65+: 18.2%
> Poverty rate: 8.9%
Detailed findings & methodology:
The 2016 presidential election, won by Donald Trump over Hillary Clinton, was very closely contested on a national level. But it still had the lowest voter turnout of any election since 2000. This could be due to the fact that neither candidate was particularly well liked. Political analysis outlet RealClearPolitics determined that just 41.8% of likely voters had a favorable view of Hillary Clinton, and 37.5% had a favorable view of Donald Trump leading up to the election.
Older people are much more likely to vote. Just 43.0% of Americans age 18-24 voted in 2016. Among those in the 25-34 age group, 53.1% voted. Voter turnout was even higher among older Americans — 72.6% of those age 65-74 voted, the highest turnout of any age range. Turnout among Americans 75 and older was slightly lower, at 68.4%, in 2016.
Socioeconomic status can also make a difference. Wealthier people are more likely to vote than low-income Americans. People who do not have a typical 9-to-5 job or who work multiple jobs may not find the time to get to the polls. Also, obligations such as child care might prevent lower income Americans from going to vote. Wealthier people, on the other hand, are more likely to be able to take time off of work or afford child care.
U.S. national elections occur on a Tuesday, a day when most people work. This is different from many other countries around the world that hold their elections on the weekend or make election day a national holiday to boost participation.
The United States has one of the lowest voter turnout rates among wealthy, developed countries. According to a Pew Research Center study, the United States ranked 26th in national election voter turnout among the 32 countries in the Organization for Economic Cooperation and Development, all of which are developed and democratic. In Belgium, where voting is compulsory, 87.2% of the voting age population turned out to the polls in the country’s 2014 national election, the largest share of any OECD country.
Many academic studies have also claimed that voter suppression has caused lower turnout in American elections. These studies indicate that certain election laws, such as voter identification requirements, make it more difficult for some Americans to exercise their right to vote.
To identify the states with the highest and lowest voter turnout rates, 24/7 Wall St. reviewed the percentage of voting-age citizens in each state who cast a ballot in the 2016 presidential election. All voter turnout data came from the Current Population Survey (CPS), conducted by the U.S. Census Bureau every month. The percentage of the population that is 65 and older and the poverty rate came from the U.S. Census Bureau’s American Community Survey.
Sponsored: Attention Savvy Investors: Speak to 3 Financial Experts – FREE
Ever wanted an extra set of eyes on an investment you’re considering? Now you can speak with up to 3 financial experts in your area for FREE. By simply
clicking here you can begin to match with financial professionals who can help guide you through the financial decisions you’re making. And the best part? The first conversation with them is free.
Click here to match with up to 3 financial pros who would be excited to help you make financial decisions.