Poverty might mean different things in different parts of the world and to different people, but it is largely defined as being unable to afford a minimum standard of living. The United States has come a long way in addressing the problem, but progress seems to have slowed despite the recent years of economic recovery.
In many ways, the problem has even escalated. Though the economy has added millions of jobs since the recession ended, many of the jobs created are not the same as jobs that were lost. In many areas, the problem of poverty has worsened during the recovery.
Poverty is perhaps the most persistent of problems, with consequences that can span a lifetime, be transferred across generations, and loom in the minds of individuals and families living at the edge of poverty.
Click here to see how poverty is measured.
Click here to see alternative measures of poverty.
Click here to see root causes of poverty.
Click here to see who lives in poverty.
Click here to see what it means to live in poverty.
Click here to see solutions.
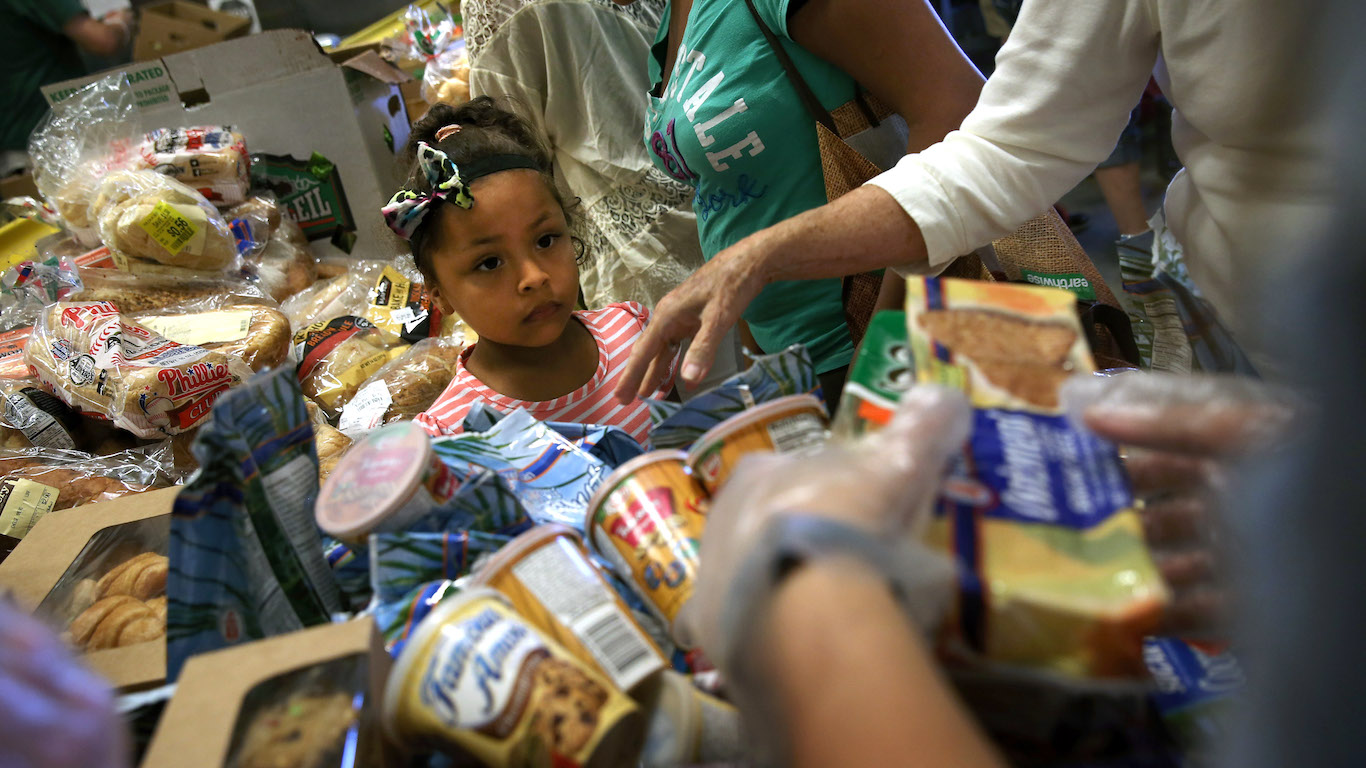
Most people, in one way or another, are familiar with poverty or the concept of poverty. From the nation’s largely uncounted homeless population to unemployed Americans looking for work to low-wage service industry workers to single parents working multiple jobs, for millions Americans, poverty is a daily struggle that often results in deprivation and requires sacrifice. Though the United States was built on the doctrine that financial status is the result of personal merit, religious teachings encourage helping the poor and the work of alleviating poverty has become woven into the fabric of U.S. society.
Poverty extends to practically all aspects of U.S. society, and yet, despite the many anti-poverty policies, it remains largely unaddressed. It is also relatively undiscussed in public discourse and incompletely understood by the public and academics alike.
A study published in July 2015 in the journal PLOS ONE found that 60% of people will experience at least 1 year of poverty in their lifetimes. The Urban Institute’s Well-Being and Basic Needs Survey found that nearly 40% of non-elderly adults report difficulty meeting basic needs such as food, health care, housing, and utilities.
The U.S. Census Bureau’s long-standing official poverty measure created in 1963 currently helps determine eligibility for 82 federal programs. Research has shown the benefits of these programs are greater than was previously thought, especially for elderly Americans and children. Despite the effectiveness of these programs, however, the official poverty rate is widely believed to grossly underestimate the true level of economic deprivation in the United States.
Regular discussions about poverty are largely brushed aside in an age where the media is dominated by partisan politics, entertainment, sports, and daily news. Media outlets and publications devote entire business sections to what people running big companies do. Every day, countless hours and pages of information focus on gossip about celebrities and wealthy sports figures. There is virtually no regular coverage of America’s poor.
24/7 Wall St. analyzed data from government and private sources, interviewed experts, and studied the latest research examining the problem. We have endeavored to connect the dots in a gallery of 17 charts covering various aspects of poverty in America.
How Poverty is Measured
The U.S. government determines who lives in poverty by calculating a threshold income level. Anyone not meeting that threshold is said to live below the poverty line. There are different poverty thresholds depending on the size of the family.
The way the government calculates this threshold was determined in 1963 — and it has not changed since. The calculation defines the poverty level for a family of four at three times a typical family’s food budget. It was based on the 1955 Household Food Consumption Survey, which found that the average low-income family of three or more persons spent one-third of its total after-tax income on food.
[in-text-ad]
Today, based on this calculation and adjusted to inflation, a family of four (two adults and two children) is considered to be living in poverty if it has a pre-tax annual household income of $24,858 or lower. The annual income poverty threshold for an individual is $12,488.
According to this measurement, there were 39.7 million Americans living in poverty last year. The official poverty rate in 2017 stood at 12.3%, a slight improvement from the 2016 rate of 12.7%. Since 2014, the poverty rate has fallen 2.5 percentage points, from 14.8%. While this was the third consecutive year poverty has declined significantly, the poverty rate remains above the 2000 low of 11.3%.
Federal poverty thresholds do not take into account a range of important factors:
1) Because pre-tax income is used, amounts paid in taxes or received in tax credits, as well as state variations in tax burdens, are not accounted for;
2) Federal and local non-cash social assistance programs such as the Supplemental Nutrition Assistance Program (SNAP) formerly known as food stamps, housing programs providing rent subsidies, and care received through Medicaid are not factored into the measurement;
3) Child support payments, work expenses such as transportation costs, and out-of-pocket medical expenses are not considered in the measurement;
4) The only basic household expense considered in the official rate is food. This means the costs of education, health care, furniture, appliances, recreation, alcohol and tobacco, and other items — and the proportion of a typical budget each represents — do not currently have any effect on the official poverty level.
[in-text-ad-2]
5) The differences in costs of living also are not considered in the official poverty rate. Though there are significant regional price differences, especially in housing costs, a family of four is considered poor whether it earns less than $24,000 in San Jose, California, or in Akron, Ohio.
Even if these factors were taken into account, large groups of U.S. residents living in economic hardship would be left uncounted. Homeless individuals, undocumented migrant workers, children under 15 living with unrelated family-members, and prisoners, to name just a few, are each groups of people at high risk of material deprivation completely absent from official poverty counts.
Click here to see how poverty is measured in charts.
Alternative Measures of Poverty
The official poverty measure is a flawed reflection of how differences in the economy, policy, and behavior, both over time and between geographical areas, affect low-income households in the United States.
To help account for these missing factors, a variety of alternative methods of calculating poverty-level incomes have been proposed. These include the government’s 2011 release of the Supplemental Poverty Measure, which takes into account resources received through non-cash government assistance programs; food, clothing, shelter, and utilities expenditures; income after tax payments and credits; work expenses and medical expenses; and child support payments.
[in-text-ad]
Under the supplemental measure, the U.S. poverty rate was 13.9% in 2017.
Other alternative measures of poverty include the National Academy of Science’s and Economic Policy Institute’s family budget-based measurements. To determine the income level needed to secure a “safe and decent, yet modest, living standard,” the EPI determines the costs of basic family budget items such as housing, food, child care, transportation, health care, and taxes.
According to an analysis of alternative poverty measurements by the Brookings Institution’s Hamilton Project, family budget approaches generally result in poverty thresholds about twice the official poverty level. The EPI does not calculate a national poverty threshold. However, looking at local area data used in the think tank’s family budget calculator, a family of four would require at least three times the federal poverty annual income threshold of around $24,000 to attain a modest yet adequate standard of living in the majority of urban areas analyzed.
Another approach to determining financial need is a relative poverty threshold, pegged to a percentage of current median income levels. Across the European Union, poverty rates are determined by counting all those living in households with incomes that are equal to or less than 60% of the respective national median income.
To better reflect the needs of their community, some localities have devised their own, more effective, poverty measures. For example, the New York City government poverty measure considers the higher cost of housing in New York City as well as other factors. Under this measure, the poverty threshold in New York City for a two-adult, two-child family in 2015 was $31,756, versus the comparable official threshold of $24,036. New York’s poverty rate by this measure was 19.9% in 2015, versus the official rate of 18.4% that year.
[in-text-ad-2]
Another reason the official measure likely grossly underestimates poverty in the United States is that a great deal has changed since the benchmark for family expenses was set in the 1960s.
Since then, a range of necessary expenses have reduced the resources available to families. Out-of-pocket medical care costs rose rapidly in the 1990s, especially for elderly and disabled individuals. In the late 1990s and early 2000s, and again in the late 2010s, housing prices rose rapidly. These factors have had a limited effect on the poverty threshold in the current measure.
While the Household Food Consumption Survey found in 1955 that a typical family spends approximately one-third of its budget on food, today the Consumer Expenditure Survey and the USDA’s Economic Research Service show that a family spends between 9.7% (ERS) and 12.6% (CES) on food.
Click here to see alternative measures of poverty in charts.
Root Causes of Poverty
To better deal with the problem of poverty first we need to understand its causes. The reasons for poverty can generally be divided into individual factors — such as certain behaviors and life choices — and structural factors beyond the control of individuals, such as the economy. There is much debate about whether personal or external factors are the main reason Americans live in poverty today.
It is important to acknowledge the role certain behaviors and life choices play in a person’s likelihood of entering or remaining in poverty as there are innumerable examples of Americans overcoming the disadvantages that often lead to poverty.
[in-text-ad]
But individual choices alone cannot explain the level of material deprivation in America today. Compared to previous generations, upward income mobility today is becoming increasingly less common, and in some areas it is close to zero. According to recent research on intergenerational mobility, the percentage of children who earn more than their parents is down from approximately 90% of children born in 1940 to roughly 50% of children born in the 1980s.
Upward mobility is easier to achieve when segregation and inequality are low, when the school system is of higher quality, and young people are supported to obtain an education. These have all worsened or changed, however, due largely to widening gaps in income and community resources.
Richard Rothstein, a senior researcher and segregation expert at the Economic Policy Institute, has in his analyses of socioeconomic disparities shown that groups with greater disadvantage will necessarily have lower average educational achievement than more affluent groups.
A lack of health insurance, low-weight births, fewer preventive doctor visits, school absences, frequent moves and school switches, greater exposure to crime and drug use, job layoffs, financial distress, and a host of other factors are more common in low-income communities and contribute to worse outcomes for children in school as well as for adults who may be trying to improve their standards of living.
In such communities, the impact of structural factors is clear due to the failure of individual choices to remedy a family’s economic precarity, according to Tim Smeeding, Lee Rainwater distinguished professor of Public Affairs and Economics at the University of Wisconsin’s LaFollette School of Public Affairs. In an email to 24/7 Wall St. Smeeding added, “The combination of low wages and intermittent work, especially amongst single parents, most of whom are working to some degree won’t by themselves bring the family from poverty.”
Scheduling changes, need for child care, unexpected expenses such as a high medical bill or sudden losses of income, as well as simply the characteristics of where a person was born, also contribute to the problem of poverty in the United States.
[in-text-ad-2]
While some areas have unbroken histories of economic disadvantage, there are new areas, notably in the nation’s once economically vibrant industrial hubs, where the chance of obtaining a decent standard of living has fallen precipitously.
Places like Dayton, Ohio; Gary, Indiana; Detroit, Michigan, and other former industry hubs and innovation centers had broad based prosperity during the 1930s to 1970s. More patents were recorded per capita in Dayton — the city where the Wright Brothers started working on bicycles — during that time than any other U.S. city.
Today, Dayton has a 30.7% poverty rate and is struggling with an opioid epidemic. Officials of Montgomery County, which contains Dayton, estimated that Ohio as a whole would see 10,000 overdoses by the end of 2017.
Click here to see the root causes of poverty in charts.
Who Lives in Poverty
Some groups of Americans are at a significantly higher risk of living in poverty. There are differences along gender, age, racial, and geographical lines.
Women are more likely to live in poverty than men, as are working-age adults compared to elderly Americans. Poverty rates are highest in the West and South and lowest in the Midwest and Northeast. Veterans, single mothers, those without a high school education, the disabled, and city-dwellers, are all at higher risk of living in poverty.
[in-text-ad]
Children are at a particularly high risk — especially young children. Based on the supplemental poverty rate, close to one in five children under 5 years old, about 19.5 million in all, live in households reporting poverty-level incomes.
There are also clear differences along racial and ethnic lines. Black Americans, as well as Hispanic and Latino Americans, are each about twice as likely to live in poverty as white Americans. Native Americans and Alaskan natives are at an even higher risk — more than one in four live in poverty.
For individuals who belong into more than one of these groups, the risks can be compounded. Young black Americans, for example, are one of the most at risk groups, with a poverty rate in excess of 30%. Among single black mothers, the poverty rate exceeds 40%.
An individual’s profession also changes the likelihood of living in poverty. Farming in general and dairy farming in particular are notable examples. The USDA reported in January that approximately 17,000 dairy farm operations have closed down over the last decade. According to the latest data from the Bureau of Labor Statistics, Americans employed in the farming, fishing, and forestry industry are the most likely to live in poverty. Americans working service jobs are also among the most impoverished.
[in-text-ad-2]
It is important to note that while certain groups are more likely to live in poverty, no one is immune to being poor. One survey by the Associated Press found that four out of five U.S. adults have limited economic security, which can lead to poverty at some point in their lives. People move in and out of poverty over the course of their lives, and many from middle- and upper-class backgrounds with years of steady employment can fall into poverty and not recover.
Click here to see who lives in poverty in charts.
What it Means to Live in Poverty
Individuals and families in poverty regularly face serious immediate and long-term concerns, such as paying this month’s rent or heating bill, supporting a child’s education, affording health care and nutritious food, and more.
The most extreme and recognizable form of poverty is homelessness. According to the U.S. Department of Housing and Urban Development, more than half a million Americans lack permanent shelter. Many homeless individuals are in dire need of medical attention and suffer from mental illnesses. Homelessness carries health risks from exposure to weather and disease, it can lead to social isolation and self esteem issues, and it increases the risk of substance use disorders. A large share of the country’s homeless population are children. Children living in shelters face serious impediments to their development.
[in-text-ad]
Though the most obvious form of poverty might be homelessness, there are tens of millions of Americans — many of whom have a job and a place to live — who experience serious problems associated with low incomes.
One of these is a lack of immediate access to food. According to the U.S. Department of Agriculture, more than 13 million children — about one in six — in the United States live in families with inconsistent access to food. These children can experience hunger on a regular basis.
One of the clearest determinants of health is income, and people living in poverty are more likely to lead less healthy and shorter lives compared with affluent Americans. According to a recent MIT study, the poorest 1% of American men live, on average, nearly 15 years less than the richest 1% of men.
There are many reasons for this disparity in health outcomes. Americans in poverty tend to have less healthy diets, higher smoking rates, and higher stress levels. Americans in poverty also tend to have worse health outcomes because they are less likely to receive medical care. This is to a large extent due to lack of health insurance among low-income populations. People who live in poverty or near poverty represent the vast majority of those who lack health insurance, despite the existence of federal programs like Medicaid.
Low-income individuals are much more vulnerable to addiction. The opioid crisis has worsened in recent years. Since 2006, over half a million Americans have died from drug overdoses, and the vast majority of these have been in low-income areas.
Receiving a quality education is one of the surest ways to exit and stay out of poverty. Yet poor people are among the least likely to receive such an education. Public school systems are funded largely by local property tax dollars, which means people who live in lower-income neighborhoods are less likely to attend well-funded schools. According to the U.S. Department of Education, public school spending in high-income school districts is 15.6% higher than in low-income districts. Children in poverty also are less likely to be engaged in the classroom and more likely to have poorly educated parents, a factor which has been shown to curb development. About one in four adults living poverty do not have a high school diploma.
[in-text-ad-2]
Even when children of poorer families have overcome these obstacles to obtaining a quality K-12 education, attending college remains elusive due to the high costs as needs-based scholarships are often insufficient. Just 4.8% of adults living in poverty have a bachelor’s degree.
The geographical grouping of poor Americans in low-income neighborhoods means that many poor Americans face amplified effects of poverty by living in highly poor places. An estimated 14.1% of Americans who live below the poverty line live in neighborhoods where more than 40% of households also live in poverty.
In addition to less well-funded public school systems, low-income neighborhoods also have lower-quality public infrastructure. They also tend to have high crime rates, which can have wide-reaching effects on all neighborhood residents, causing unhealthy stress levels and depression. Also, businesses are less likely to locate in poor neighborhoods and neighborhoods with high crime. This means residents are less likely to have access to amenities and less likely to find well-paying employment nearby.\
Click here to see what it means to live in poverty in charts.
Solutions
1) Government programs
Social assistance programs such as EITC and SNAP, and especially Social Security, have significantly reduced poverty levels for low-income Americans and their families. A 2018 Urban Institute analysis estimated SNAP lifted 8.4 million people out of poverty in 2015 and reduced child poverty by 28%.
According to the U.S. Census Bureau, 21.3% of Americans receive some form of state or federal income assistance, such as unemployment insurance, SNAP benefits, Medicaid, TANF, and Supplemental Security Income.
[in-text-ad]
Based on U.S. Census data released in September 2018, Social Security continues to be the most important social assistance program — it helped move 27 million individuals out of poverty in 2017. The program was implemented as part of the New Deal measures enacted in 1935, and later rolled out nationally with increased investment in the early 1960. It helped reduce poverty considerably, especially among elderly Americans.
Because of the relatively high likelihood of underreporting among program recipients, the benefits of these programs is likely underestimated. “Adjusting for underreporting increases the effects of SNAP especially on poverty,” wrote Smeeding. It shows “that these programs are even more important than we thought in reducing poverty especially amongst children.”
2) Charities
Government assistance programs help alleviate poverty for millions of Americans every year, but they are not enough. Private aid programs help make up the difference.
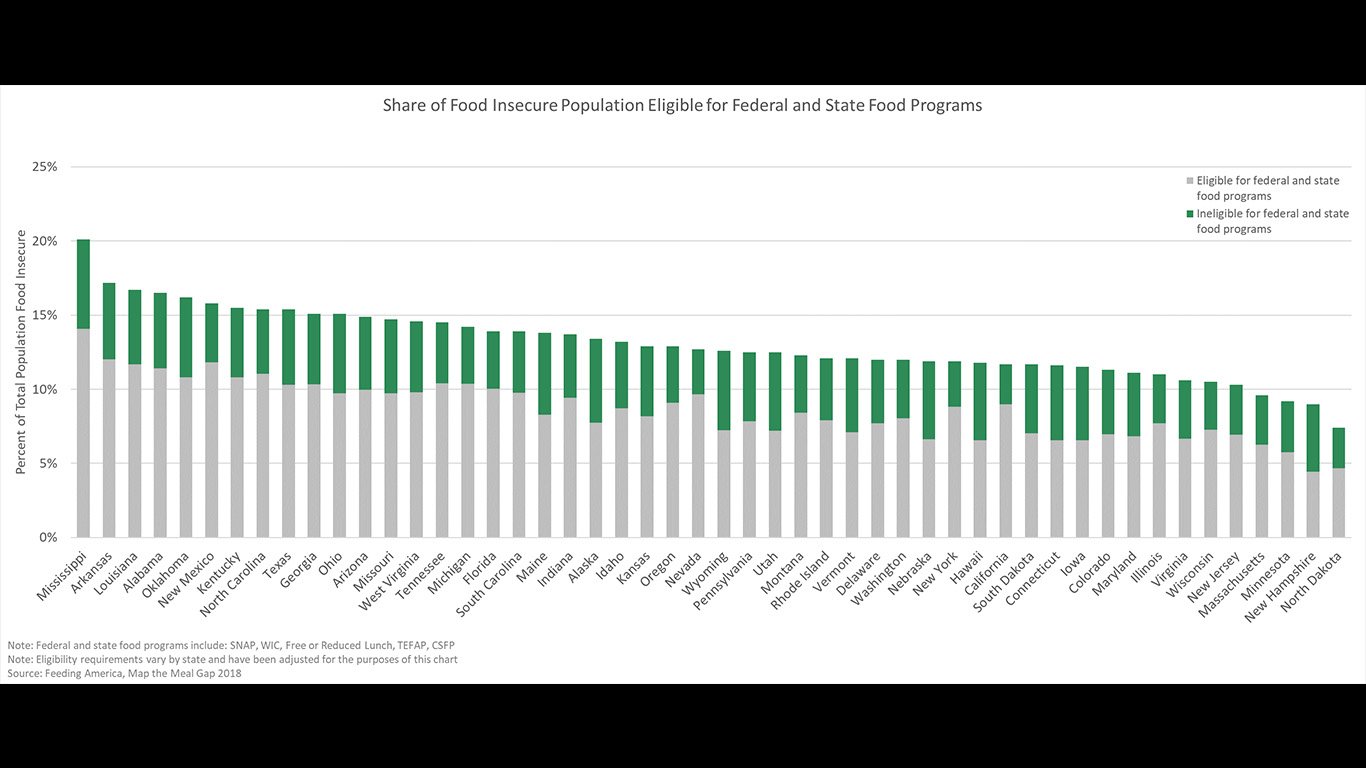
According to statistics by food pantry network and nonprofit group Feeding America, about 73% of food-insecure individuals are eligible for at least one of the major federal food assistance programs. This leaves about 27% of food-insecure individuals who do not qualify for federal assistance, many of whom must turn to charitable organizations.
Charities play a critical role in American society, helping answer needs unmet by public assistance programs. The government spent $2.7 trillion on public assistance programs in its fiscal 2016. The charity data and research group Giving USA estimated in its annual report that charitable donations totaled $410 billion in 2017.
Though the resources charities direct to the injustice of poverty are considerable, it can be difficult to gauge their value. Not all charities do as much good as donors likely believe they do. The charity world is dominated by private organizations that do not disclose all of their activities, so it is very hard for donors to know which groups have the most impact.
3) Economic factors
Poverty remains a serious problem in the United States despite nine years of economic recovery. Commenting on this observation, Smeeding said, “The lack of progress over the last few years of strong recovery means that the economy alone will not solve poverty.”
For most Americans, wages are their sole source of income, and employment is one of the surest ways to escape poverty. Emphasizing the connection between less time spent working and greater reliance on welfare in its July 2018 report, the U.S. Executive Branch’s Council of Economic Advisors proposed to expand work requirements in welfare programs to encourage recipients to join the workforce.
[in-text-ad-2]
Finding work is not always a matter of choice, however. The likelihood of obtaining gainful employment relies heavily on local economic factors. In an interview with 24/7 Wall St., Elise Gould, senior economist with the EPI, said, “The labor market can serve as an anti-poverty vehicle.” For instance, in tight labor markets — while not always advantageous for business owners who may wish to more freely replace workers — lower-wage people frequently get raises and more hours of work. As the U.S. labor market has tightened, the nationwide poverty rate has declined.
Similarly, Gould explained, “[Minimum wage policies] that set labor standards will disproportionately impact low-income folks and therefore are more likely to pull them out of poverty.” Many states and cities have indeed increased the minimum wage well above the federally mandated $7.25 per hour set in 2009.
Alaska, Florida, Minnesota, Missouri, Montana, New Jersey, Ohio, and South Dakota regularly increase the minimum wage base on the cost of living. Arizona, California, Colorado, Hawaii, Maine, Michigan, New York, Rhode Island, Vermont, and Washington have enacted legislation the increased minimum wages this year. Massachusetts and Delaware enacted measures to increase state minimum wages over several years.
Click here to see the solutions in charts.
Click image to enlarge
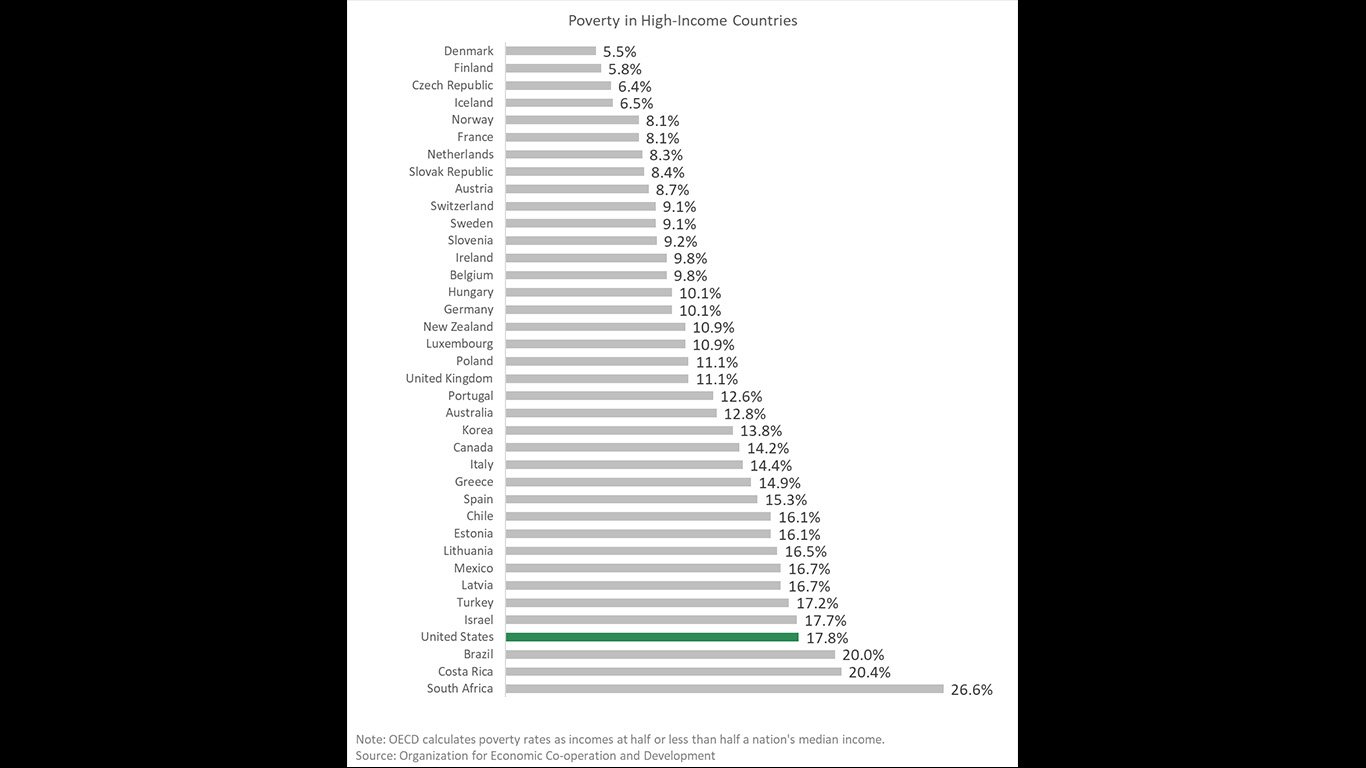
Poverty in High-Income Countries
Even after years of improvement, poverty is more prevalent in the U.S. than most industrialized nations. In this chart, poverty is measured as the percentage of people earning incomes at or below 50% the median income.

Click image to enlarge
How Poverty is Measured: 3 Measures of Income Needed for Life’s Essentials
The poverty level is intended to be the income above which a family or an individual is able to afford life’s essentials. Rather than a poverty threshold, the EPI’s family budget calculator estimates the income needed for a “modest yet adequate” living standard.
[in-text-ad]
Click image to enlarge
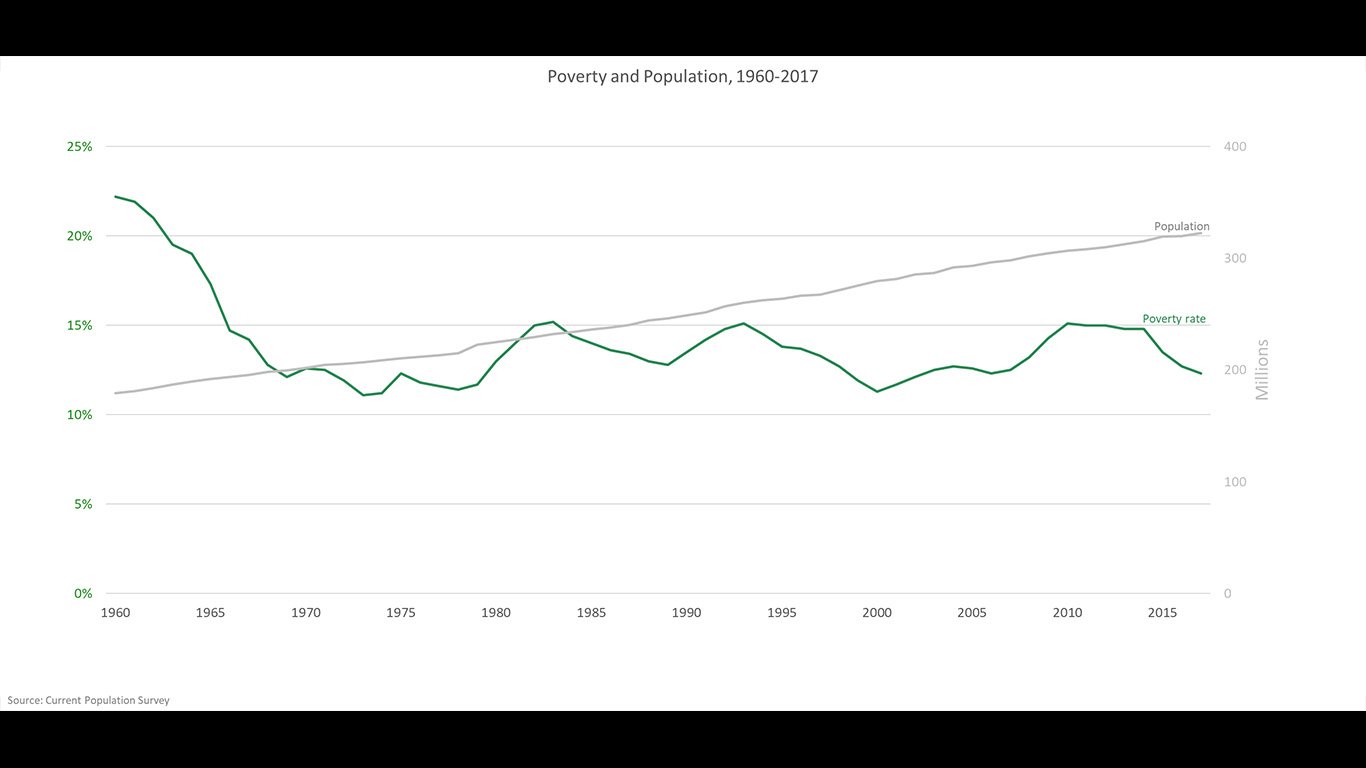
How Poverty is Measured: Poverty and Population, 1960-2017
The poverty rate has fallen only modestly since its steep drop in the 1950s and 1960s — the period in which President Johnson enacted a set of social programs as part of his “War on Poverty.” For reference, the gray line represents the change in the U.S. population.
Click image to enlarge
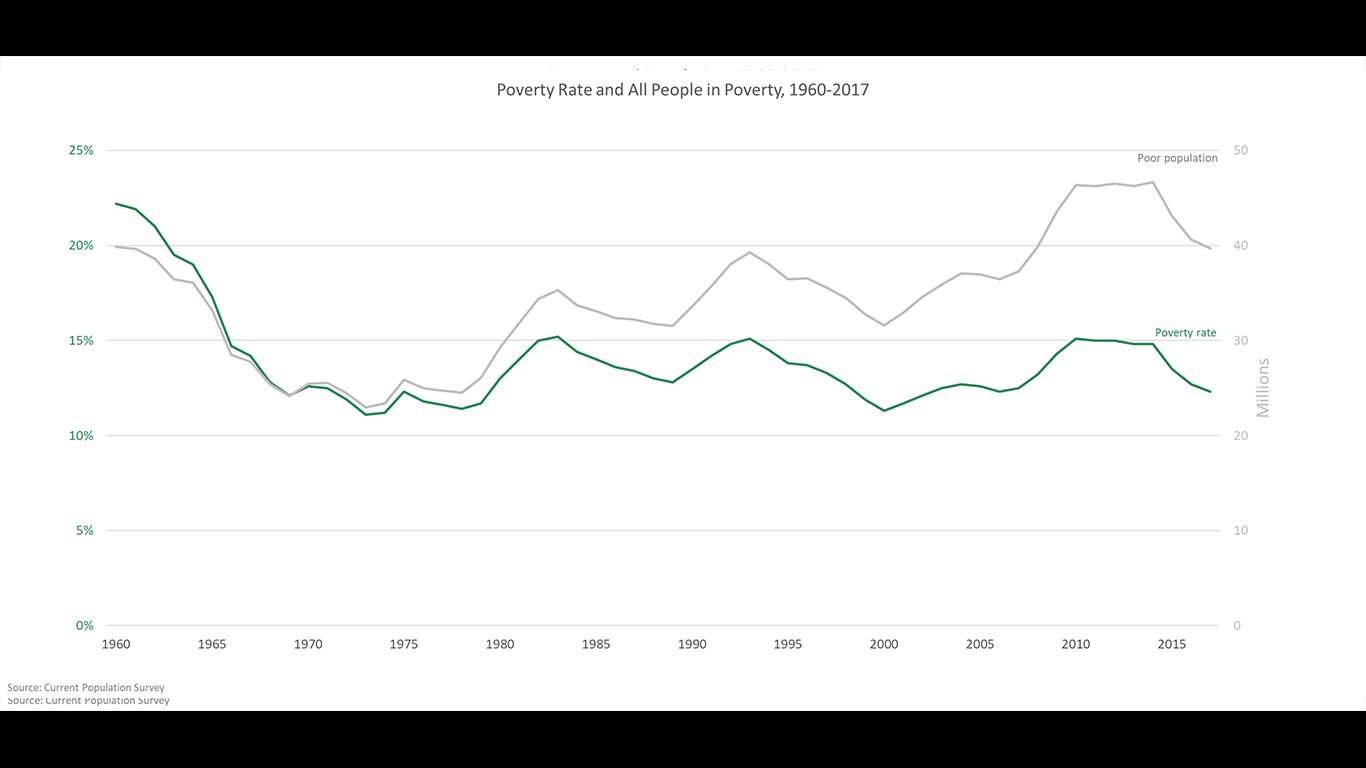
How Poverty is Measured: Poverty Rate and All People in Poverty, 1960-2017
The official poverty rate has remained between 11% and 15% since 1980. However, due to population growth, the number of people in poverty has risen over time. Nearly 40 million Americans currently live below the poverty line.
Click image to enlarge
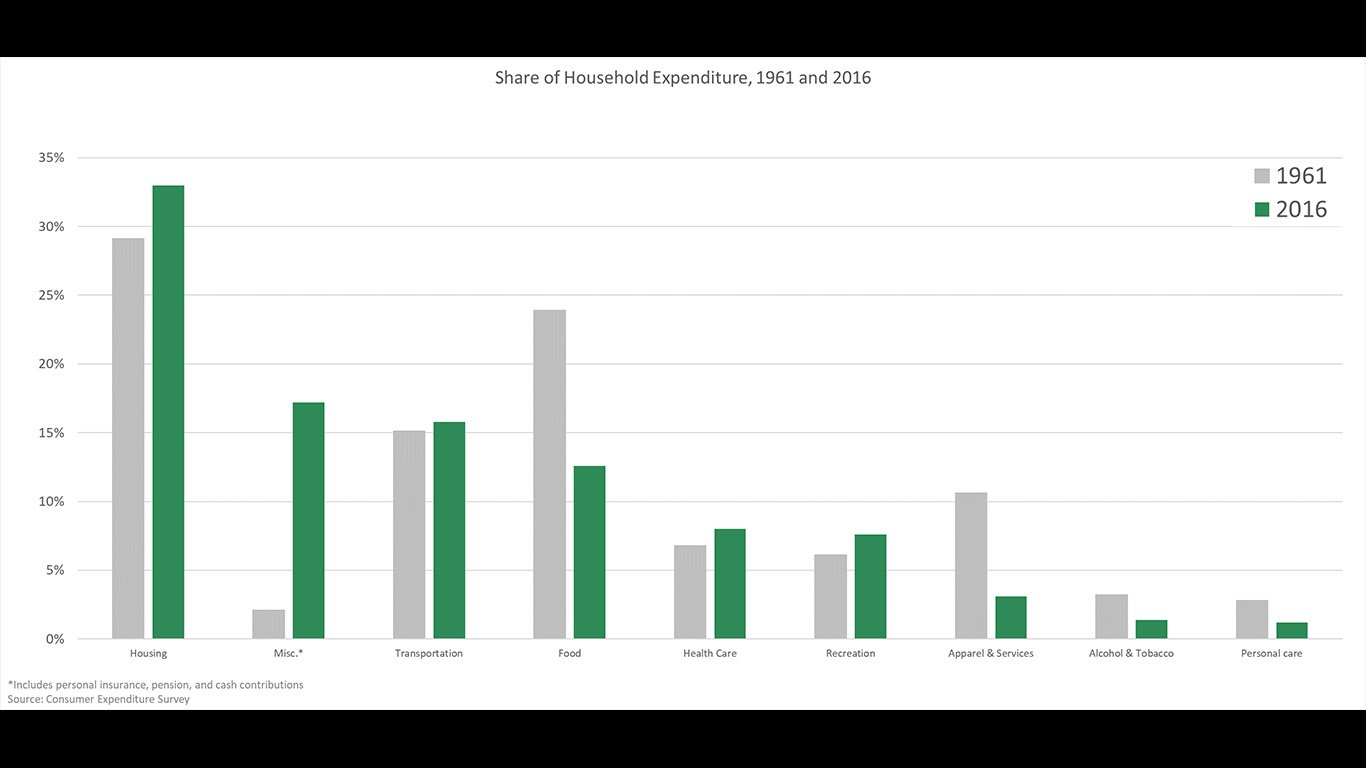
How Poverty is Measured: Share of Household Expenditure, 1961 and 2016
Though housing prices rose rapidly in the late 1990s and early 2000s, the official poverty threshold has changed little as housing prices are not considered in the calculation. Had the measure taken housing prices and other expenses into account, the poverty threshold might have been higher — and with it the poverty rate.
[in-text-ad-2]

Click image to enlarge
How Poverty is Measured: Share of Disposable Income Spent on Food, 1930-2014
Food used to comprise a much larger share of a family’s budget compared to today. According to a 1955 government survey, a typical low-income family spent about one-third of its budget on food. The average household of that time spent between 15% and 20% on food. More current surveys find that today a typical family spends between 9.7% and 12.6% on food.
Click image to enlarge
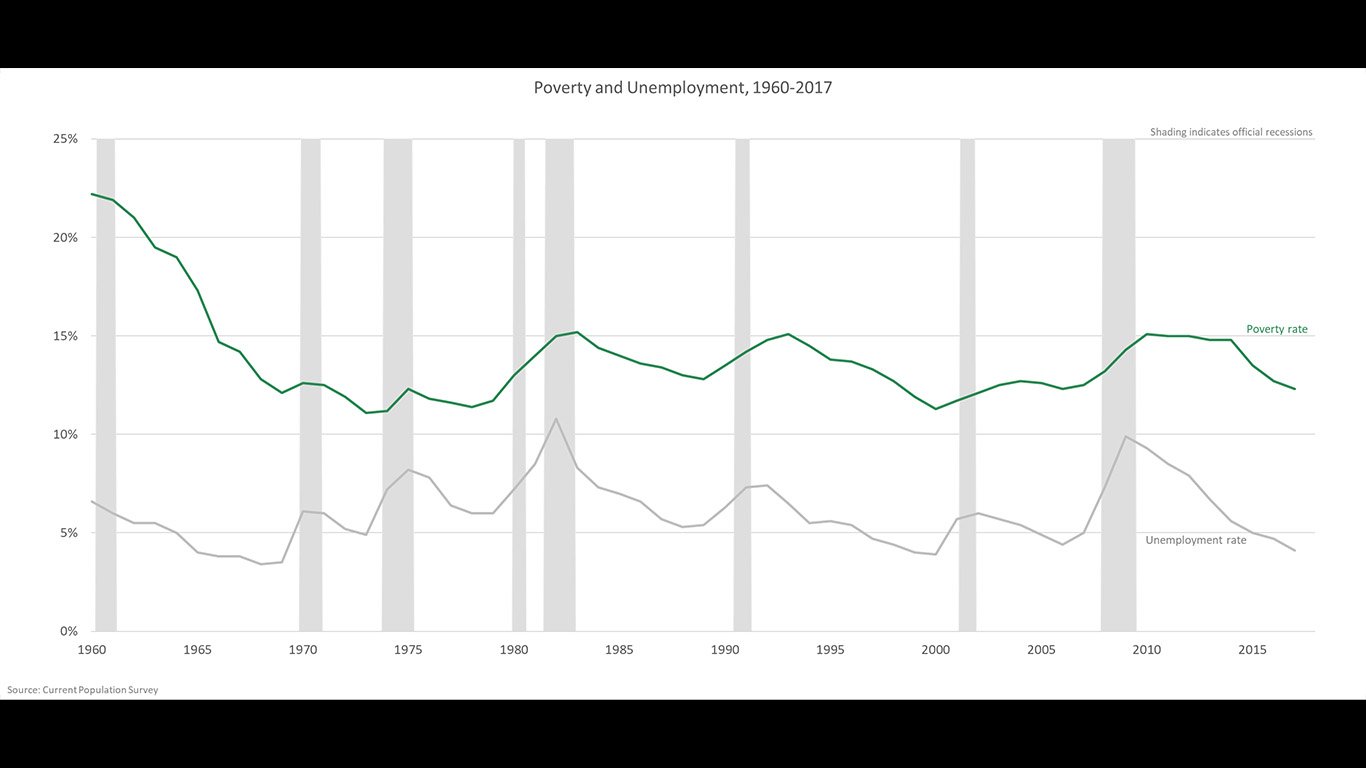
Root Causes of Poverty: Poverty and Unemployment, 1960-2017
Rising unemployment and the resulting income declines, especially during economic recessions, have closely tracked with changes in the U.S. poverty rate. In this chart shaded regions represent periods of economic recession.
[in-text-ad]
Click image to enlarge
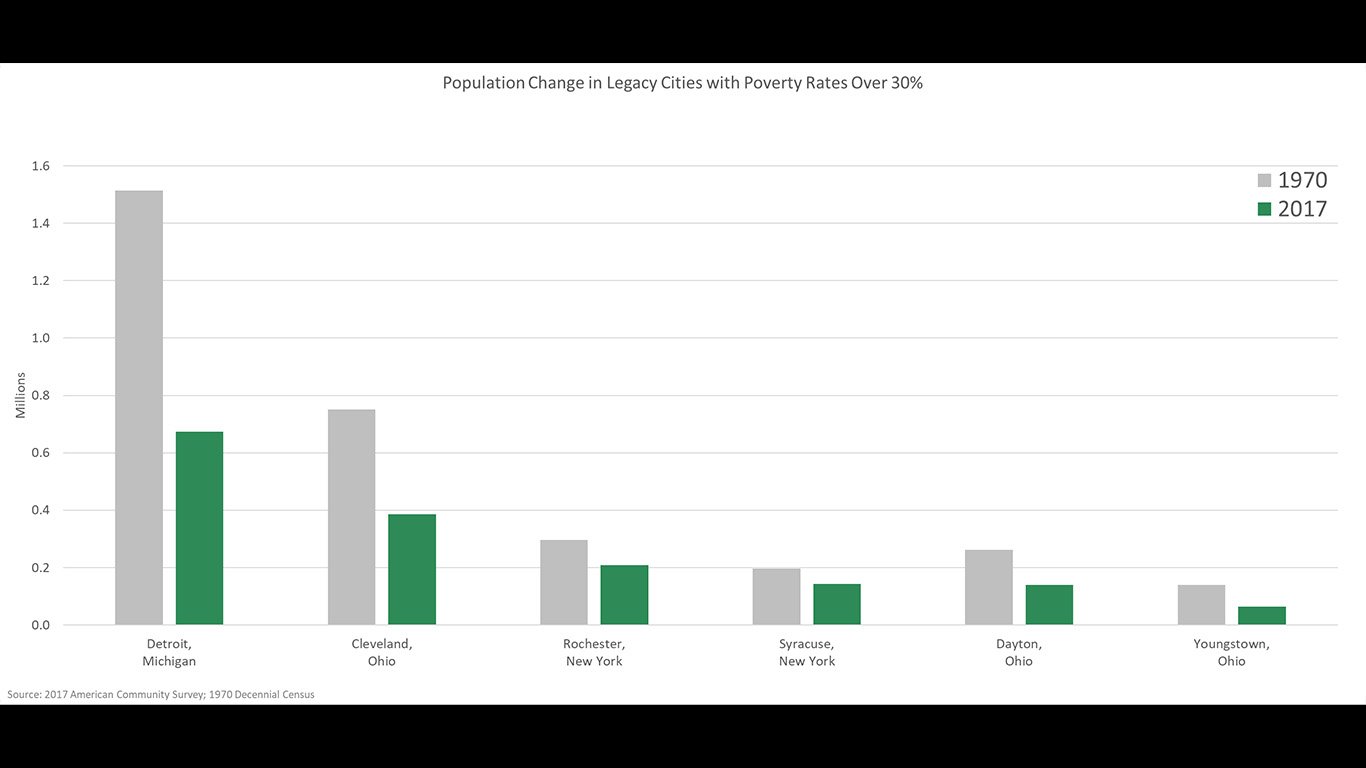
Root Causes of Poverty: Population Change in Legacy Cities with Poverty Rates Over 30%
Some of America’s highest poverty rates are in legacy cities, major metropolitan areas that were once innovation centers and major manufacturing hubs but have since suffered decades of economic decline. There have been significant population and job losses in these cities in recent decades.
 24/7 Wall St.
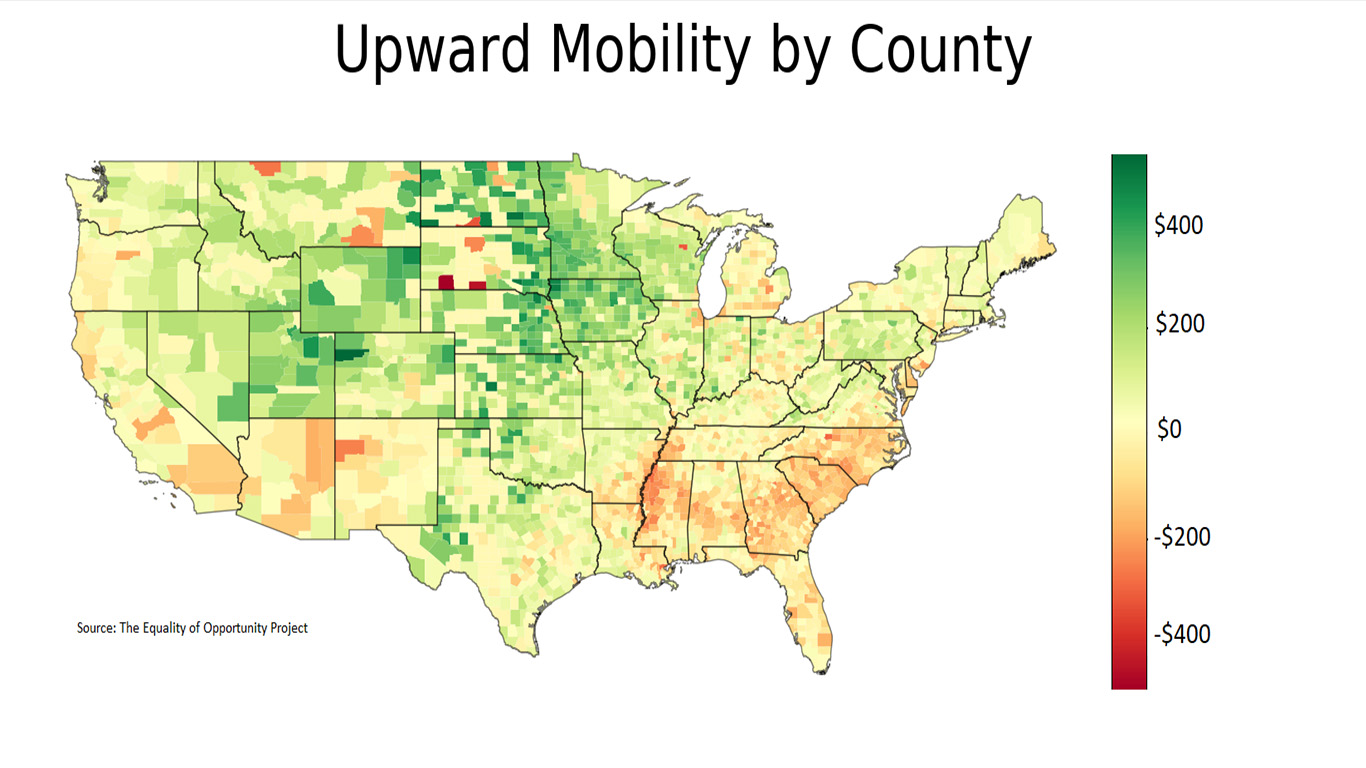
Click image to enlarge
Root Causes of Poverty: Upward Mobility by County
This chart shows the long-term effects of living in poverty. For every year a child grows up in a high-poverty county, his or her expected annual income drops by as much as several hundred dollars.
Click image to enlarge
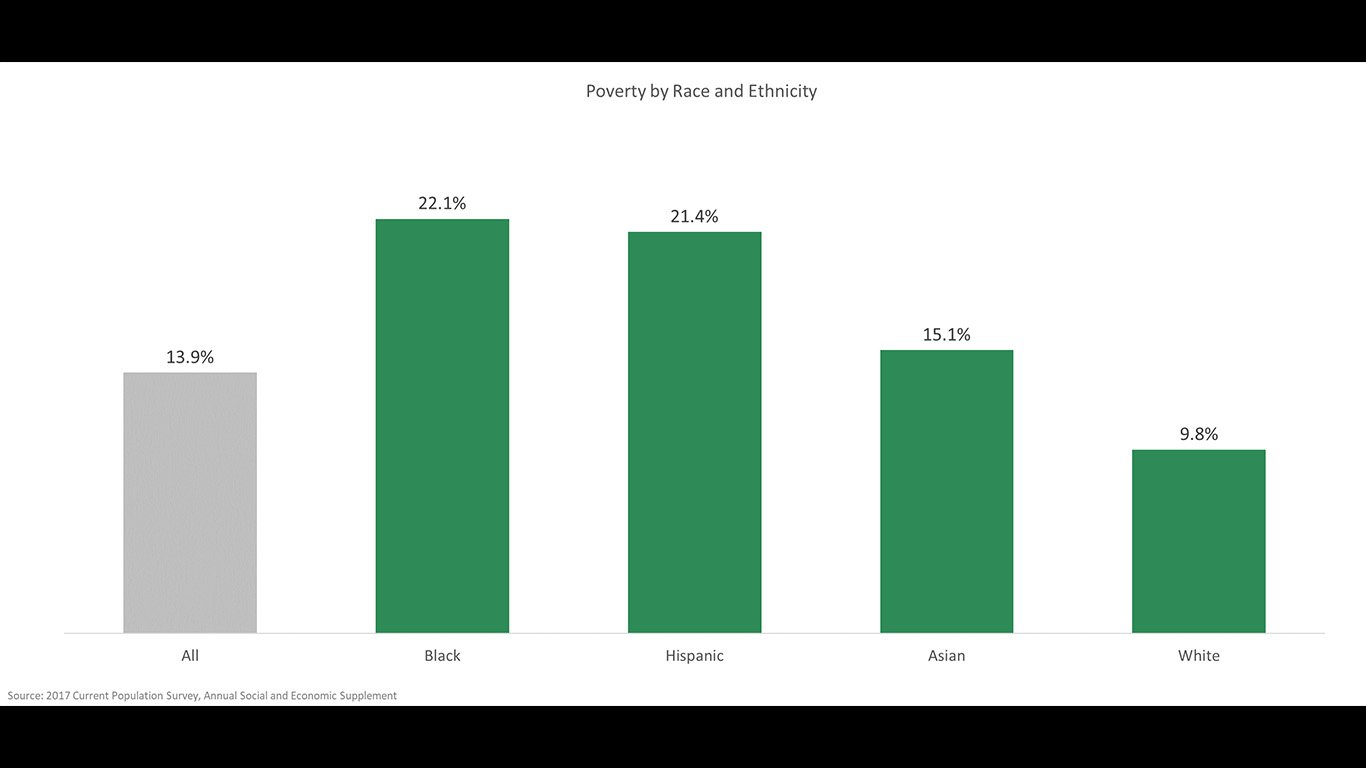
Who Lives in Poverty?: Poverty by Race and Ethnicity
Black and Hispanic Americans are more than twice as likely to live in poverty as white Americans. These figures are based on the more accurate Supplemental Poverty Rate.
[in-text-ad-2]

Click image to enlarge
Who Lives in Poverty?: Poverty by Residence and Region
Education, employment, and income are all closely related to one another. College-educated Americans and adults working full-time are far less vulnerable to the prospect of poverty than other groups.
 24/7 Wall St.
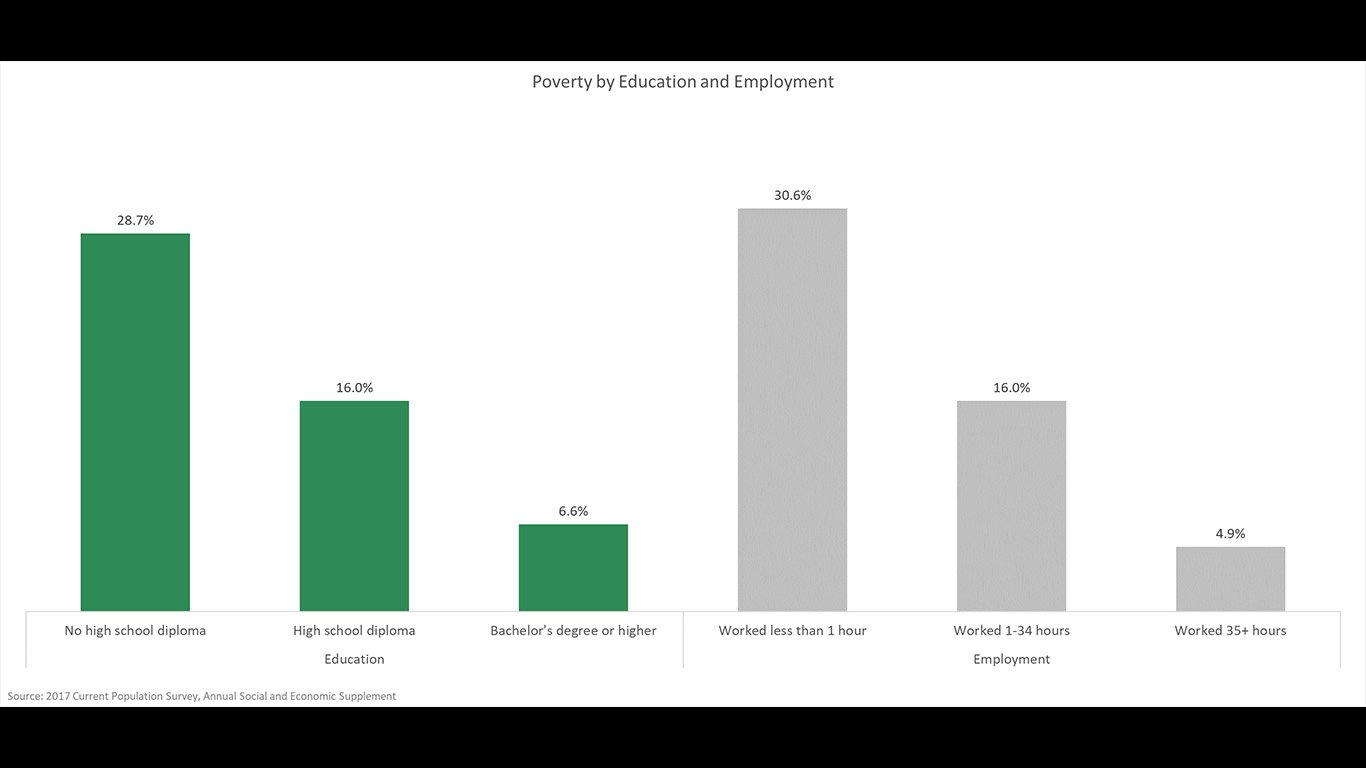
Click image to enlarge
Who Lives in Poverty?: Poverty by Education and Employment
While suburban poverty is on the rise, populations earning low incomes remain relatively concentrated in cities. The West and South have higher poverty rates, but there are pockets of extreme poverty in every U.S. region.
[in-text-ad]
Click image to enlarge
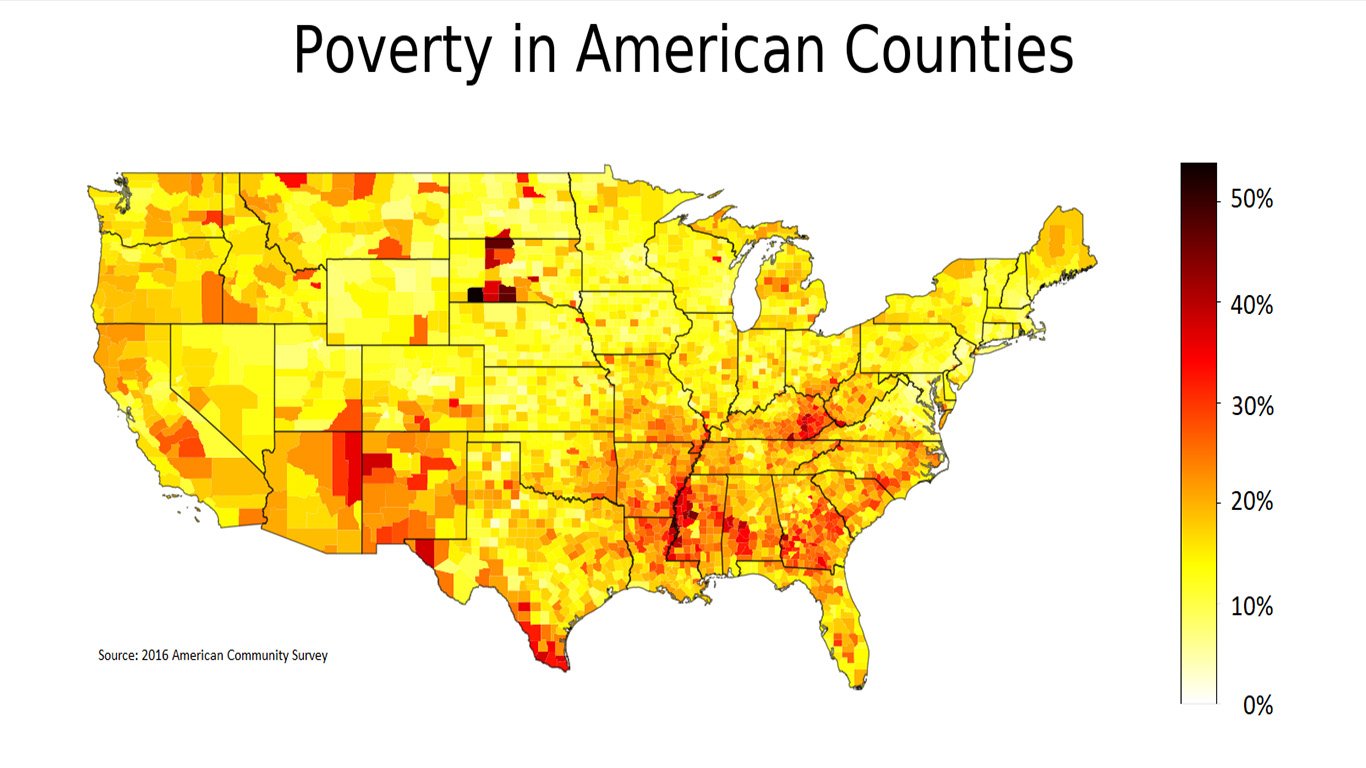
Who Lives in Poverty?: Poverty in American Counties
While poverty exists everywhere in America, it is highly concentrated in certain areas, particularly the South, Southwest, and Appalachian regions.
Click image to enlarge
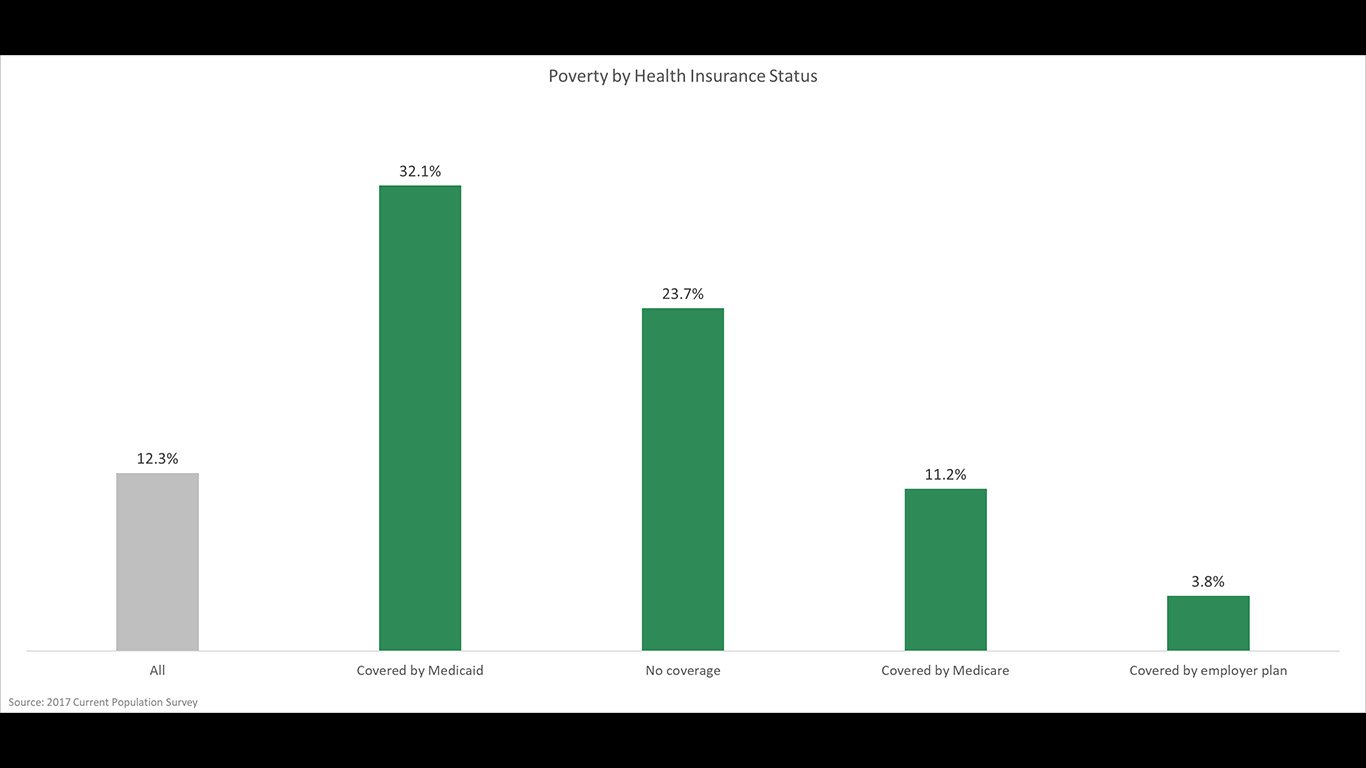
What it Means to Live in Poverty: Poverty by Health Insurance States
Despite the fact that programs like Medicaid ensure health coverage for very poor Americans, close to 25% of uninsured Americans earn incomes below the poverty line. According to the Kaiser Foundation, low-income individuals and families account for roughly 8 in 10 uninsured Americans.
[in-text-ad-2]

Click image to enlarge
What it Means to Live in Poverty: Outcomes in US vs. High-Poverty Counties
There is no better predictor of health than income, and people living in poverty are the most likely to live less healthy and shorter lives. Poverty is closely linked with many of the leading causes of preventable death, including stress, obesity, and smoking.

Click image to enlarge
Solutions: How Federal Programs and Expenses Affect the Poverty Rate
Social Security has been by far the most effective anti-poverty program the U.S. government implemented. Out-of-pocket medical expenses significantly reduce resources available to families.

Click image to enlarge
Solutions: Share of Donations by Charity Type
Charitable giving by Americans and U.S. organizations totaled $410 billion in 2017.
[in-text-ad]
Click image to enlarge
Solutions: Share of Food Insecure Eligible for Federal and State Food Programs
Millions of American families are food insecure, meaning they regularly struggle to put food on the table. Nationwide, about one in four food-insecure individuals do not qualify for federal nutrition assistance programs.
Take This Retirement Quiz To Get Matched With A Financial Advisor (Sponsored)
Take the quiz below to get matched with a financial advisor today.
Each advisor has been vetted by SmartAsset and is held to a fiduciary standard to act in your best interests.
Here’s how it works:
1. Answer SmartAsset advisor match quiz
2. Review your pre-screened matches at your leisure. Check out the
advisors’ profiles.
3. Speak with advisors at no cost to you. Have an introductory call on the phone or introduction in person and choose whom to work with in the future
Take the retirement quiz right here.
Thank you for reading! Have some feedback for us?
Contact the 24/7 Wall St. editorial team.
Editors' Picks

