
As of September 2018, America’s job market was doing better than it had in decades. Unemployment dropped to 3.7%, the lowest rate since 1969. And the economy added 134,000 jobs in September, marking 96 months of consecutive job growth in the United States.
In reality, there is no one, single U.S. economy. Martin Kohli, chief regional economist for the U.S. Bureau of Labor Statistics, told 24/7 Wall St. that “the national economy really is an agglomeration of very different regional economies.” Reviewing metropolitan employment growth figures highlights the differences in economic outcomes across the country.
In some metropolitan areas, the number of people employed is about the same as or lower than it was five years ago. In others, employment is much higher as these cities have been successful in increasing the number of jobs.
In some major metropolitan areas, employment growth has exceeded 20% in the past five years, far outpacing growth in their respective states. For instance, the number of workers in Lake Charles, Louisiana, increased by more than 28% from August 2013 to August 2018. During the same time period, Louisiana’s state employment grew 7.7%.
A number of educational, economic, and environmental factors, among others, contribute to the level of employment in an area, and the causes of job growth vary among each metro area that experienced significant employment growth. According to Kohli, places in the South and West, such as Austin and Phoenix, derived much of their job growth from the construction industry. In eastern states like New York, New Jersey, and Pennsylvania, the warehousing and transportation sector contributed heavily to job growth.
24/7 Wall St. reviewed changes in total employment in 381 metro areas from August 2013 to August 2018 to identify the cities adding the most jobs in every state.
Click here to see the city adding the most jobs in every state.
Click here to see our detailed findings and methodology.

Source: Public Domain / Wikimedia Commons
1. Alabama: Daphne-Fairhope-Foley
> Employment chg. 2013-2018: +13.9% (81,295 to 92,583)
> State employment chg. 2013-2018: +9.8% (2.0 million to 2.2 million)
> August unemployment: 3.7%
> Industry with largest employment increase: Government, 2.2%
> Median household income: $55,342
[in-text-ad]

Source: Didier Moïse / Wikimedia Commons
2. Alaska: Anchorage
> Employment chg. 2013-2018: -1.7% (189,159 to 185,955)
> State employment chg. 2013-2018: +3.2% (349,454 to 360,804)
> August unemployment: 5.1%
> Industry with largest employment increase: Transportation and Utilities, 11.0%
> Median household income: $76,871

Source: J. Miers - User: (WT-shared) Jtesla16 at wts wikivoyage / Wikimedia Commons
3. Arizona: Phoenix-Mesa-Scottsdale
> Employment chg. 2013-2018: +17.7% (1,906,027 to 2,243,524)
> State employment chg. 2013-2018: +20.9% (2.8 million to 3.4 million)
> August unemployment: 4.5%
> Industry with largest employment increase: Mining, Logging, and Construction, 32.8%
> Median household income: $61,506

Source: BlazenImages / Getty Images
4. Arkansas: Fayetteville-Springdale-Rogers
> Employment chg. 2013-2018: +20.0% (223,069 to 267,652)
> State employment chg. 2013-2018: +9.4% (1.2 million to 1.3 million)
> August unemployment: 2.5%
> Industry with largest employment increase: Mining, Logging, and Construction, 50.6%
> Median household income: $56,038
[in-text-ad-2]

Source: Doc Searls / Wikimedia Commons
5. California: Riverside-San Bernardino-Ontario
> Employment chg. 2013-2018: +14.9% (1,694,630 to 1,946,726)
> State employment chg. 2013-2018: +13.8% (17.0 million to 19.4 million)
> August unemployment: 4.5%
> Industry with largest employment increase: Transportation and Utilities, 62.0%
> Median household income: $61,994

Source: Bbean32 / Wikimedia Commons
6. Colorado: Greeley
> Employment chg. 2013-2018: +21.1% (131,450 to 159,208)
> State employment chg. 2013-2018: +19.3% (2.6 million to 3.1 million)
> August unemployment: 3.2%
> Industry with largest employment increase: Mining, Logging, and Construction, 34.4%
> Median household income: $68,884
[in-text-ad]

Source: nancykennedy / Getty Images
7. Connecticut: Danbury
> Employment chg. 2013-2018: +6.6% (98,096 to 104,586)
> State employment chg. 2013-2018: +10.2% (1.7 million to 1.9 million)
> August unemployment: 3.4%
> Industry with largest employment increase: N/A
> Median household income: N/A

Source: JERRYE & ROY KLOTZ MD / Wikimedia Commons
8. Delaware: Dover
> Employment chg. 2013-2018: +11.9% (67,383 to 75,388)
> State employment chg. 2013-2018: +17.6% (415,708 to 488,689)
> August unemployment: 4.9%
> Industry with largest employment increase: Professional and Business Services, 25.6%
> Median household income: $57,608

Source: laynabowers / Getty Images
9. Florida: Cape Coral-Fort Myers
> Employment chg. 2013-2018: +17.8% (273,886 to 322,615)
> State employment chg. 2013-2018: +15.8% (8.8 million to 10.2 million)
> August unemployment: 3.7%
> Industry with largest employment increase: Mining, Logging, and Construction, 61.2%
> Median household income: $53,928
[in-text-ad-2]

Source: Public Domain / Wikimedia Commons
10. Georgia: Gainesville
> Employment chg. 2013-2018: +20.9% (83,395 to 100,818)
> State employment chg. 2013-2018: +17.8% (4.4 million to 5.1 million)
> August unemployment: 3.0%
> Industry with largest employment increase: Retail Trade, 19.0%
> Median household income: $61,977

Source: Eric Broder Van Dyke / Getty Images
11. Hawaii: Kahului-Wailuku-Lahaina
> Employment chg. 2013-2018: +11.6% (77,043 to 85,996)
> State employment chg. 2013-2018: +10.1% (621,030 to 683,846)
> August unemployment: 2.1%
> Industry with largest employment increase: Education and Health Services, 37.5%
> Median household income: $80,183
[in-text-ad]

Source: Charles Knowles / Wikimedia Commons
12. Idaho: Boise City
> Employment chg. 2013-2018: +18.6% (293,439 to 348,021)
> State employment chg. 2013-2018: +16.9% (730,880 to 854,464)
> August unemployment: 2.3%
> Industry with largest employment increase: Mining, Logging, and Construction, 45.0%
> Median household income: $55,324

Source: Chris Light / Wikimedia Commons
13. Illinois: Kankakee
> Employment chg. 2013-2018: +10.5% (50,392 to 55,672)
> State employment chg. 2013-2018: +8.2% (6.0 million to 6.5 million)
> August unemployment: 4.7%
> Industry with largest employment increase: Professional and Business Services, 78.8%
> Median household income: $58,539

Source: Publichall / Wikimedia Commons
14. Indiana: Elkhart-Goshen
> Employment chg. 2013-2018: +24.0% (93,272 to 115,671)
> State employment chg. 2013-2018: +15.1% (3.0 million to 3.4 million)
> August unemployment: 2.9%
> Industry with largest employment increase: Manufacturing, 32.4%
> Median household income: $58,960
[in-text-ad-2]

Source: Stephen Matthew Milligan / Wikimedia Commons
15. Iowa: Des Moines-West Des Moines
> Employment chg. 2013-2018: +9.2% (320,933 to 350,352)
> State employment chg. 2013-2018: +4.7% (1.6 million to 1.7 million)
> August unemployment: 2.2%
> Industry with largest employment increase: Mining, Logging, and Construction, 40.0%
> Median household income: $68,649

Source: Bhall87 / Wikimedia Commons
16. Kansas: Lawrence
> Employment chg. 2013-2018: +8.7% (58,052 to 63,092)
> State employment chg. 2013-2018: +5.4% (1.4 million to 1.5 million)
> August unemployment: 3.2%
> Industry with largest employment increase: Government, 27.0%
> Median household income: $55,646
[in-text-ad]

Source: DenisTangneyJr / Getty Images
17. Kentucky: Bowling Green
> Employment chg. 2013-2018: +9.6% (73,606 to 80,675)
> State employment chg. 2013-2018: +9.0% (1.9 million to 2.1 million)
> August unemployment: 3.7%
> Industry with largest employment increase: Manufacturing, 29.4%
> Median household income: $46,478
 24/7 Wall St.
Source: Meinzahn / Getty Images
18. Louisiana: Lake Charles
> Employment chg. 2013-2018: +28.3% (86,643 to 111,125)
> State employment chg. 2013-2018: +7.7% (2.0 million to 2.1 million)
> August unemployment: 4.2%
> Industry with largest employment increase: Mining, Logging, and Construction, 118.0%
> Median household income: $52,314

Source: Stefan Hillebrand / Wikimedia Commons
19. Maine: Portland-South Portland
> Employment chg. 2013-2018: +7.1% (197,676 to 211,664)
> State employment chg. 2013-2018: +6.1% (681,209 to 722,902)
> August unemployment: 2.4%
> Industry with largest employment increase: N/A
> Median household income: $68,570
[in-text-ad-2]

Source: DenisTangneyJr / Getty Images
20. Maryland: Salisbury
> Employment chg. 2013-2018: +7.7% (174,666 to 188,131)
> State employment chg. 2013-2018: +10.3% (2.9 million to 3.2 million)
> August unemployment: 4.4%
> Industry with largest employment increase: N/A
> Median household income: N/A

Source: realz / Flickr
21. Massachusetts: Barnstable Town
> Employment chg. 2013-2018: +13.7% (122,529 to 139,279)
> State employment chg. 2013-2018: +16.4% (3.3 million to 3.9 million)
> August unemployment: 3.2%
> Industry with largest employment increase: N/A
> Median household income: $71,235
[in-text-ad]

Source: justfuchs / Getty Images
22. Michigan: Grand Rapids-Wyoming
> Employment chg. 2013-2018: +12.4% (497,887 to 559,609)
> State employment chg. 2013-2018: +12.2% (4.3 million to 4.9 million)
> August unemployment: 2.7%
> Industry with largest employment increase: Mining, Logging, and Construction, 35.6%
> Median household income: $61,298
 24/7 Wall St.
Source: AlexiusHoratius / Wikimedia Commons
23. Minnesota: Minneapolis-St. Paul-Bloomington
> Employment chg. 2013-2018: +8.6% (1,817,772 to 1,973,241)
> State employment chg. 2013-2018: +9.0% (2.8 million to 3.1 million)
> August unemployment: 2.5%
> Industry with largest employment increase: Mining, Logging, and Construction, 25.9%
> Median household income: $76,856

Source: csfotoimages / Getty Images
24. Mississippi: Hattiesburg
> Employment chg. 2013-2018: +11.8% (58,557 to 65,473)
> State employment chg. 2013-2018: +10.9% (1.2 million to 1.3 million)
> August unemployment: 4.2%
> Industry with largest employment increase: Leisure and Hospitality, 15.1%
> Median household income: $46,167
[in-text-ad-2]

Source: Public Domain / Wikimedia Commons
25. Missouri: Kansas City
> Employment chg. 2013-2018: +7.9% (1,021,656 to 1,102,408)
> State employment chg. 2013-2018: +8.2% (2.8 million to 3.0 million)
> August unemployment: 3.6%
> Industry with largest employment increase: Mining, Logging, and Construction, 29.0%
> Median household income: $63,404

Source: wfryer / Flickr
26. Montana: Missoula
> Employment chg. 2013-2018: +6.5% (56,166 to 59,816)
> State employment chg. 2013-2018: +7.7% (492,652 to 530,353)
> August unemployment: 2.8%
> Industry with largest employment increase: Leisure and Hospitality, 15.3%
> Median household income: $54,311
[in-text-ad]

Source: Willjay / Wikimedia Commons
27. Nebraska: Omaha-Council Bluffs
> Employment chg. 2013-2018: +4.3% (458,460 to 478,318)
> State employment chg. 2013-2018: +3.5% (983,535 to 1.0 million)
> August unemployment: 2.7%
> Industry with largest employment increase: Mining, Logging, and Construction, 28.8%
> Median household income: $65,619
 24/7 Wall St.
Source: prayitnophotography / Flickr
28. Nevada: Reno
> Employment chg. 2013-2018: +18.0% (204,696 to 241,488)
> State employment chg. 2013-2018: +20.6% (1.3 million to 1.5 million)
> August unemployment: 3.7%
> Industry with largest employment increase: Mining, Logging, and Construction, 69.4%
> Median household income: $61,360

Source: SeanPavonePhoto / Getty Images
29. New Hampshire: Portsmouth
> Employment chg. 2013-2018: +10.1% (70,977 to 78,144)
> State employment chg. 2013-2018: +8.1% (712,980 to 771,044)
> August unemployment: 2.3%
> Industry with largest employment increase: N/A
> Median household income: N/A
[in-text-ad-2]

Source: benkrut / Getty Images
30. New Jersey: Trenton
> Employment chg. 2013-2018: +7.5% (180,852 to 194,460)
> State employment chg. 2013-2018: +7.8% (4.2 million to 4.5 million)
> August unemployment: 4.1%
> Industry with largest employment increase: Transportation and Utilities, 148.0%
> Median household income: $79,173
Source: Ron Reiring / Wikimedia Commons
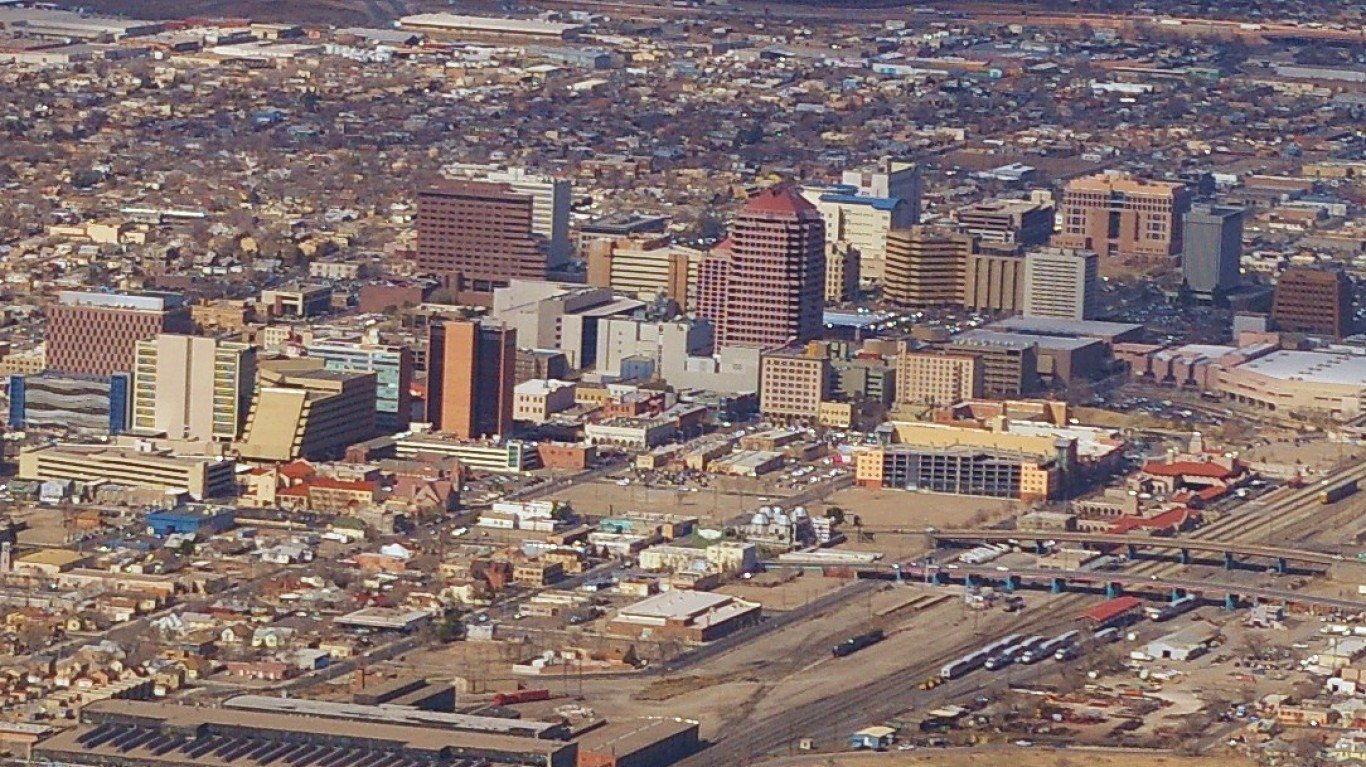
31. New Mexico: Albuquerque
> Employment chg. 2013-2018: +6.6% (384,597 to 410,142)
> State employment chg. 2013-2018: +9.3% (856,296 to 935,881)
> August unemployment: 4.7%
> Industry with largest employment increase: Mining, Logging, and Construction, 18.7%
> Median household income: $50,906
[in-text-ad]

Source: TomasSereda / Getty Images
32. New York: New York-Newark-Jersey City
> Employment chg. 2013-2018: +5.3% (9,230,861 to 9,723,683)
> State employment chg. 2013-2018: +8.5% (9.0 million to 9.8 million)
> August unemployment: 4.2%
> Industry with largest employment increase: Transportation and Utilities, 21.0%
> Median household income: $75,368

Source: Digidreamgrafix / Wikimedia Commons
33. North Carolina: Charlotte-Concord-Gastonia
> Employment chg. 2013-2018: +17.9% (1,088,468 to 1,282,790)
> State employment chg. 2013-2018: +15.0% (4.3 million to 5.0 million)
> August unemployment: 3.7%
> Industry with largest employment increase: Transportation and Utilities, 29.5%
> Median household income: $61,156
Source: Public Domain / Wikimedia Commons
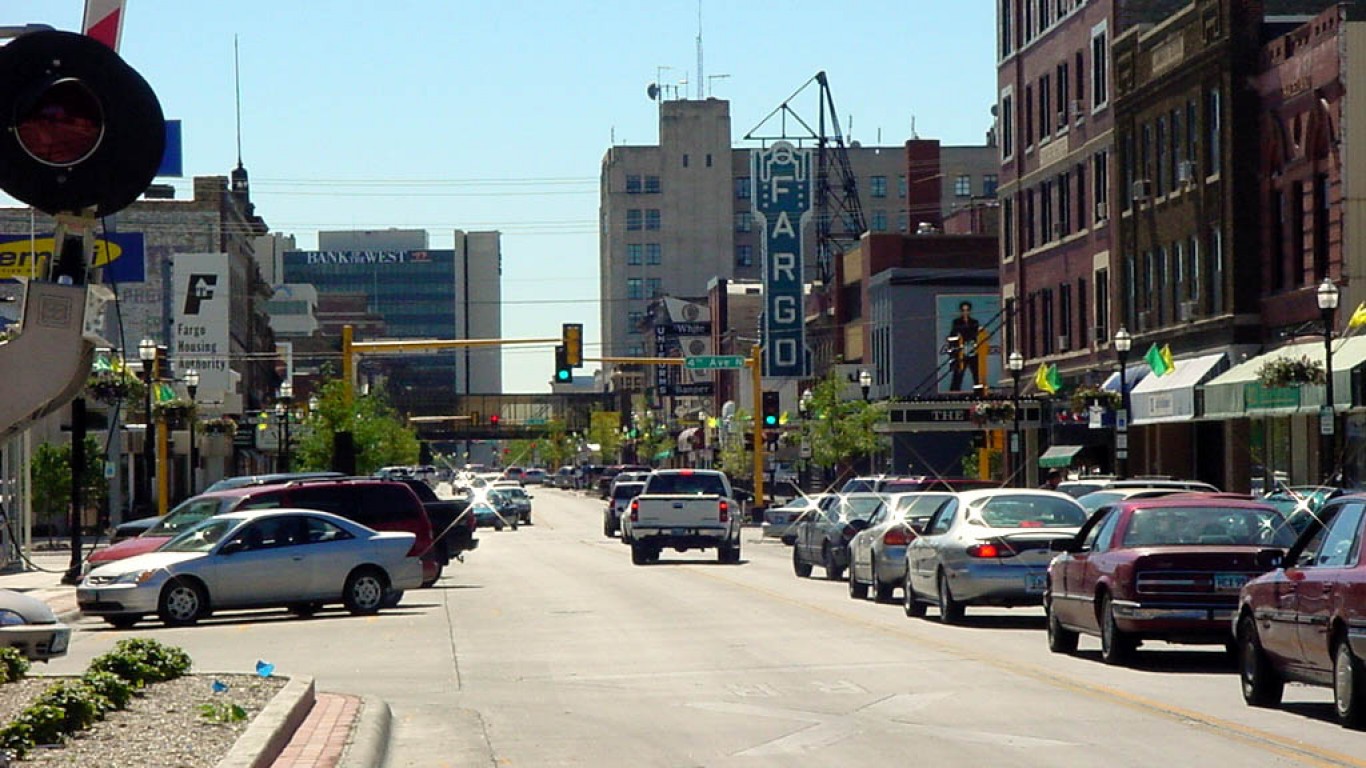
34. North Dakota: Fargo
> Employment chg. 2013-2018: +9.0% (123,198 to 134,236)
> State employment chg. 2013-2018: +1.1% (402,894 to 407,132)
> August unemployment: 2.1%
> Industry with largest employment increase: Transportation and Utilities, 21.3%
> Median household income: $63,353
[in-text-ad-2]

Source: Public Domain / Wikimedia Commons
35. Ohio: Columbus
> Employment chg. 2013-2018: +8.1% (957,800 to 1,034,941)
> State employment chg. 2013-2018: +7.7% (5.3 million to 5.8 million)
> August unemployment: 3.8%
> Industry with largest employment increase: Transportation and Utilities, 22.6%
> Median household income: $63,764

Source: Urbanative / Wikimedia Commons
36. Oklahoma: Oklahoma City
> Employment chg. 2013-2018: +7.1% (619,787 to 663,765)
> State employment chg. 2013-2018: +8.8% (1.7 million to 1.9 million)
> August unemployment: 3.2%
> Industry with largest employment increase: Other Services, 27.3%
> Median household income: $56,260
[in-text-ad]
Source: Another Believer / Wikimedia Commons
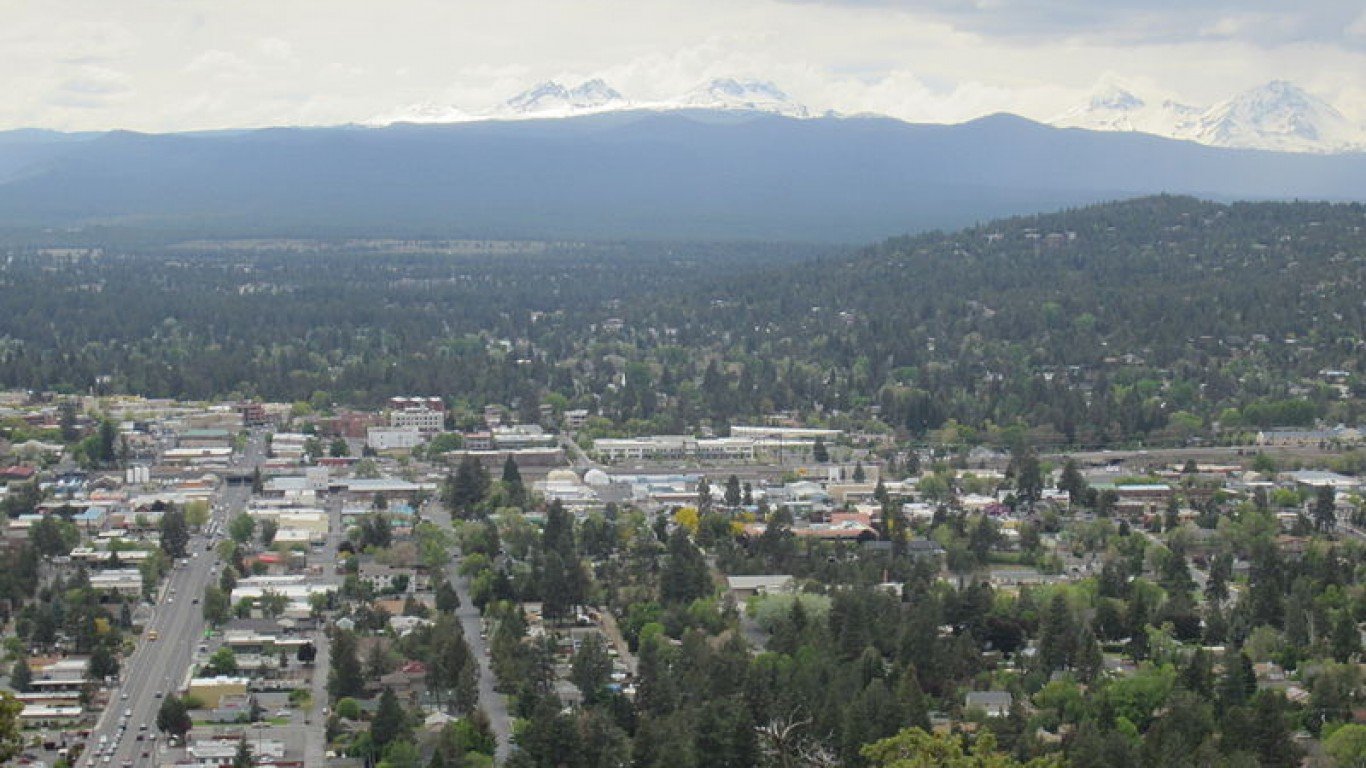
37. Oregon: Bend-Redmond
> Employment chg. 2013-2018: +26.6% (73,677 to 93,298)
> State employment chg. 2013-2018: +19.2% (1.8 million to 2.1 million)
> August unemployment: 3.6%
> Industry with largest employment increase: Mining, Logging, and Construction, 90.2%
> Median household income: $66,273
 24/7 Wall St.
Source: Smallbones / Wikimedia Commons
38. Pennsylvania: Lancaster
> Employment chg. 2013-2018: +6.5% (257,749 to 274,380)
> State employment chg. 2013-2018: +7.3% (6.0 million to 6.4 million)
> August unemployment: 3.5%
> Industry with largest employment increase: Transportation and Utilities, 38.5%
> Median household income: $63,407

Source: Macaolards / Wikimedia Commons
39. Rhode Island: Providence-Warwick
> Employment chg. 2013-2018: +7.7% (624,862 to 672,970)
> State employment chg. 2013-2018: +11.0% (509,804 to 565,648)
> August unemployment: 3.9%
> Industry with largest employment increase: N/A
> Median household income: $65,226
[in-text-ad-2]

Source: Photoartel / Wikimedia Commons
40. South Carolina: Charleston-North Charleston
> Employment chg. 2013-2018: +12.7% (325,799 to 367,247)
> State employment chg. 2013-2018: +13.5% (2.0 million to 2.3 million)
> August unemployment: 3.1%
> Industry with largest employment increase: Mining, Logging, and Construction, 40.6%
> Median household income: $60,546

Source: LiHotShots / Getty Images
41. South Dakota: Sioux Falls
> Employment chg. 2013-2018: +10.3% (134,964 to 148,872)
> State employment chg. 2013-2018: +6.9% (431,676 to 461,548)
> August unemployment: 2.3%
> Industry with largest employment increase: Professional and Business Services, 23.0%
> Median household income: $64,882
[in-text-ad]

Source: Bantosh / Wikimedia Commons
42. Tennessee: Nashville-Davidson–Murfreesboro–Franklin
> Employment chg. 2013-2018: +17.7% (845,920 to 995,414)
> State employment chg. 2013-2018: +15.0% (2.8 million to 3.2 million)
> August unemployment: 3.1%
> Industry with largest employment increase: Transportation and Utilities, 40.7%
> Median household income: $63,939
 24/7 Wall St.
Source: Larry D. Moore / Wikimedia Commons
43. Texas: Austin-Round Rock
> Employment chg. 2013-2018: +18.4% (965,999 to 1,143,407)
> State employment chg. 2013-2018: +14.1% (12.1 million to 13.8 million)
> August unemployment: 3.0%
> Industry with largest employment increase: Mining, Logging, and Construction, 44.0%
> Median household income: $73,800

Source: kenlund / Flickr
44. Utah: St. George
> Employment chg. 2013-2018: +23.4% (57,344 to 70,791)
> State employment chg. 2013-2018: +17.6% (1.3 million to 1.6 million)
> August unemployment: 4.0%
> Industry with largest employment increase: Mining, Logging, and Construction, 65.2%
> Median household income: $54,842
[in-text-ad-2]

Source: Mfwills / Wikimedia Commons
45. Vermont: Burlington-South Burlington
> Employment chg. 2013-2018: +0.8% (121,513 to 122,541)
> State employment chg. 2013-2018: +2.8% (338,851 to 348,360)
> August unemployment: 2.5%
> Industry with largest employment increase: N/A
> Median household income: $63,160

Source: garytog / Getty Images
46. Virginia: Charlottesville
> Employment chg. 2013-2018: +11.3% (104,921 to 116,745)
> State employment chg. 2013-2018: +8.4% (4.0 million to 4.3 million)
> August unemployment: 2.9%
> Industry with largest employment increase: Leisure and Hospitality, 22.0%
> Median household income: $66,853
[in-text-ad]

Source: Joshuography / Getty Images
47. Washington: Wenatchee
> Employment chg. 2013-2018: +16.1% (58,006 to 67,371)
> State employment chg. 2013-2018: +16.7% (3.2 million to 3.8 million)
> August unemployment: 4.0%
> Industry with largest employment increase: Mining, Logging, and Construction, 57.1%
> Median household income: $58,990

Source: Jae69376 / Wikimedia Commons
48. West Virginia: Morgantown
> Employment chg. 2013-2018: +6.6% (60,581 to 64,592)
> State employment chg. 2013-2018: +3.9% (747,974 to 777,064)
> August unemployment: 4.2%
> Industry with largest employment increase: Professional and Business Services, 17.7%
> Median household income: $49,475

Source: Michael-Tatman / Getty Images
49. Wisconsin: Wausau
> Employment chg. 2013-2018: +9.6% (67,568 to 74,060)
> State employment chg. 2013-2018: +9.5% (2.9 million to 3.2 million)
> August unemployment: 2.7%
> Industry with largest employment increase: Professional and Business Services, 48.0%
> Median household income: $58,173
[in-text-ad-2]

Source: DenisTangneyJr / Getty Images
50. Wyoming: Cheyenne
> Employment chg. 2013-2018: -3.6% (46,862 to 45,186)
> State employment chg. 2013-2018: -3.3% (296,522 to 286,613)
> August unemployment: 3.7%
> Industry with largest employment increase: Professional and Business Services, 8.8%
> Median household income: $61,961
Detailed findings & methodology:
In most states, at least one metro area experienced significant employment growth. Of the 50 metro areas that top their state in job growth, 35 had employment growth that surpassed the national growth rate of 7.8% over the past five years.
Many of the metro areas included on the list were not affected harshly by the 2008 economic downturn, maintaining strong job markets throughout the recession. Kohli pointed out that many of these cities are college towns. Generally, college towns have higher educational attainment rates, and adults with a college degree are more likely to maintain steady employment in weak job markets.
In Delaware and Rhode Island, there is only one place with a large enough population to qualify as a major metropolitan area, so the Providence, Rhode Island; and Dover, Delaware, areas topped their states in job creation by default.
Wyoming and Alaska were the only two states with no metro areas that had a net increase in employment over the past five years. Both have just two metro areas, and each reported employment declines during that time.
Many Americans are concerned that automation could make certain jobs like manufacturing obsolete, or at least much less common. While improvements in technology may hinder growth in manufacturing employment, it could help increase productivity, and potentially add jobs, in other sectors.
In some industries, like health care, tech innovation may have many possible benefits to the job market. Over the past five years, the health care sector grew more quickly than most other industries. Kohli noted that “part of the job growth in health care reflects the existence of new procedures like knee replacements and hip replacement that weren’t that widespread 20 years ago.”
To determine the cities adding the most jobs in every state, 24/7 Wall St. reviewed employment growth for 381 metropolitan statistical areas for the period of August 2013 to August 2018 with data from the Bureau of Labor Statistics. Supplementary data on unemployment and employment by industry also came from the BLS. Median household income came from the U.S. Census Bureau’s American Community Survey for 2017.
Sponsored: Want to Retire Early? Here’s a Great First Step
Want retirement to come a few years earlier than you’d planned? Or are you ready to retire now, but want an extra set of eyes on your finances?
Now you can speak with up to 3 financial experts in your area for FREE. By simply clicking here you can begin to match with financial professionals who can help you build your plan to retire early. And the best part? The first conversation with them is free.
Click here to match with up to 3 financial pros who would be excited to help you make financial decisions.
Thank you for reading! Have some feedback for us?
Contact the 24/7 Wall St. editorial team.
Editors' Picks

