
The U.S. manufacturing sector is a shadow of its former self. Cheap foreign labor and increased automation — in addition to several recessions — have chipped away at demand for American manufacturing workers for decades. Ultimately, the total number of Americans employed in the sector bottomed out at 11.5 million in February 2010, a 41% decline from the peak of 19.6 million in 1979.
The industry’s downturn gutted the economic core of more than a dozen once-great American cities. These cities, concentrated in the mid-Atlantic and Midwest, are sometimes collectively referred to, pejoratively, as the Rust Belt.
Rust Belt cities, themselves symbols of American industrial decline, include Baltimore, Cleveland, Detroit, and Pittsburgh.
Though the manufacturing sector has added over a million jobs since the employment trough immediately following the Great Recession, the industry’s growth is not keeping pace with overall national employment growth.
Encouragingly, several U.S. cities are bucking this trend. In certain pockets of the country, manufacturing jobs are surging, often more than tripling the sector’s employment growth nationwide.
24/7 Wall St. reviewed the percent change in manufacturing employment over the last five years in U.S. metro areas to identify the cities where manufacturing is making a comeback. To limit the list to manufacturing hubs, only cities with greater than typical employment concentration in the sector half a decade ago were considered.
In addition to the iconic steel and automaking jobs once common in many Rust Belt cities, the manufacturing sector includes a range of other industries, from food to medicine production. Many of today’s new manufacturing jobs bear little resemblance to those of the previous century.
Click here to see the cities where manufacturing is making a come back.
Click here to read our detailed findings and methodology.

Source: Thinkstock
28. Greenville-Anderson-Mauldin, SC
> 5-yr. change in manufacturing employment: +14.8% (+7,500)
> 2017 manufacturing employment: 58,200 (14.0% of total)
> 2012 manufacturing employment: 50,700 (13.8% of total)
> Value of manufacturing exports: $5.0 billion
> August unemployment: 2.9%
[in-text-ad]

Source: SeanPavonePhoto / iStock
27. Savannah, GA
> 5-yr. change in manufacturing employment: +14.9% (+2,200)
> 2017 manufacturing employment: 17,000 (9.5% of total)
> 2012 manufacturing employment: 14,800 (9.5% of total)
> Value of manufacturing exports: $2.3 billion
> August unemployment: 3.4%

Source: vkbhat / Getty Images
26. Boise City, ID
> 5-yr. change in manufacturing employment: +15.0% (+3,600)
> 2017 manufacturing employment: 27,600 (8.7% of total)
> 2012 manufacturing employment: 24,000 (9.1% of total)
> Value of manufacturing exports: $1.2 billion
> August unemployment: 2.5%
Source: Phillip L. Hofmeister / Wikimedia Commons
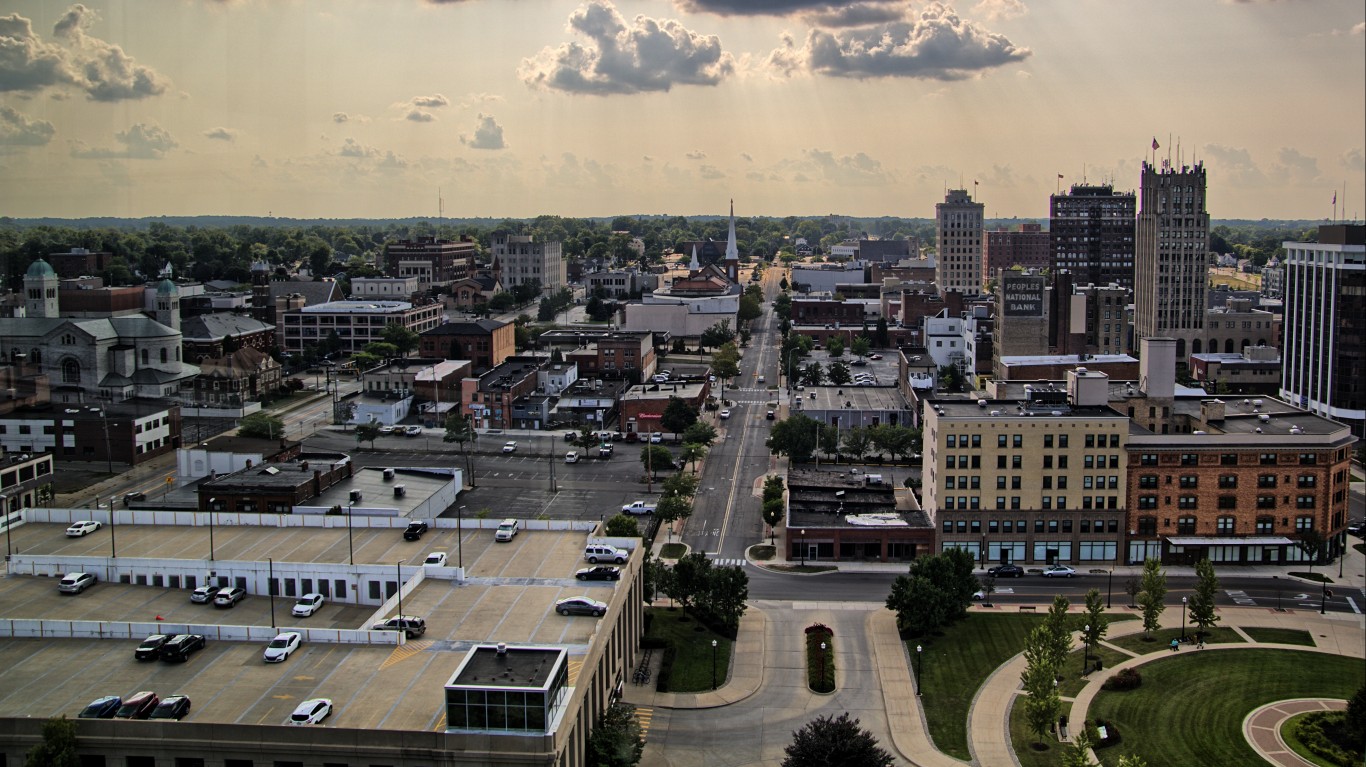
25. Jackson, MI
> 5-yr. change in manufacturing employment: +15.1% (+1,300)
> 2017 manufacturing employment: 9,900 (17.0% of total)
> 2012 manufacturing employment: 8,600 (15.9% of total)
> Value of manufacturing exports: $984.8 million
> August unemployment: 3.5%
[in-text-ad-2]

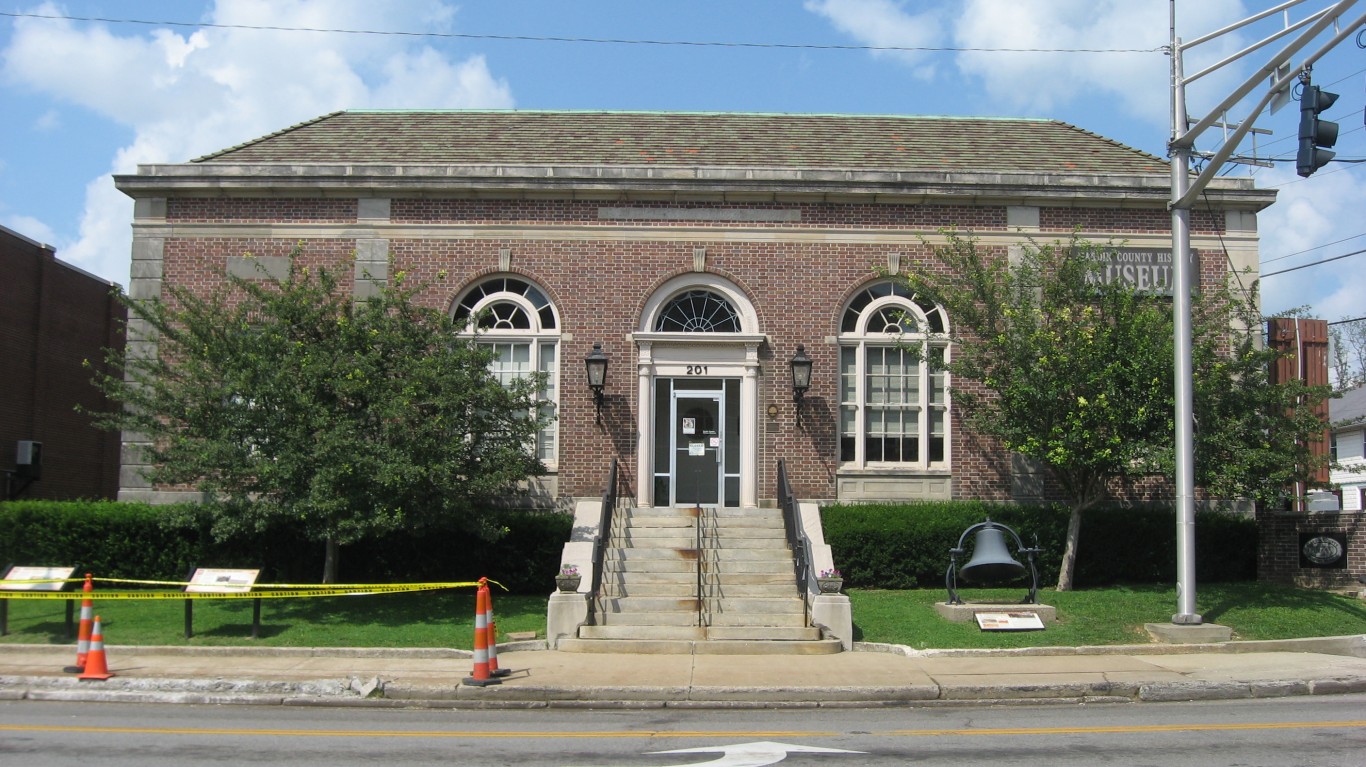
Source: Mjramsey1 / Wikimedia Commons
24. Morristown, TN
> 5-yr. change in manufacturing employment: +15.3% (+1,500)
> 2017 manufacturing employment: 11,300 (24.6% of total)
> 2012 manufacturing employment: 9,800 (23.1% of total)
> Value of manufacturing exports: $908.4 million
> August unemployment: 4.0%
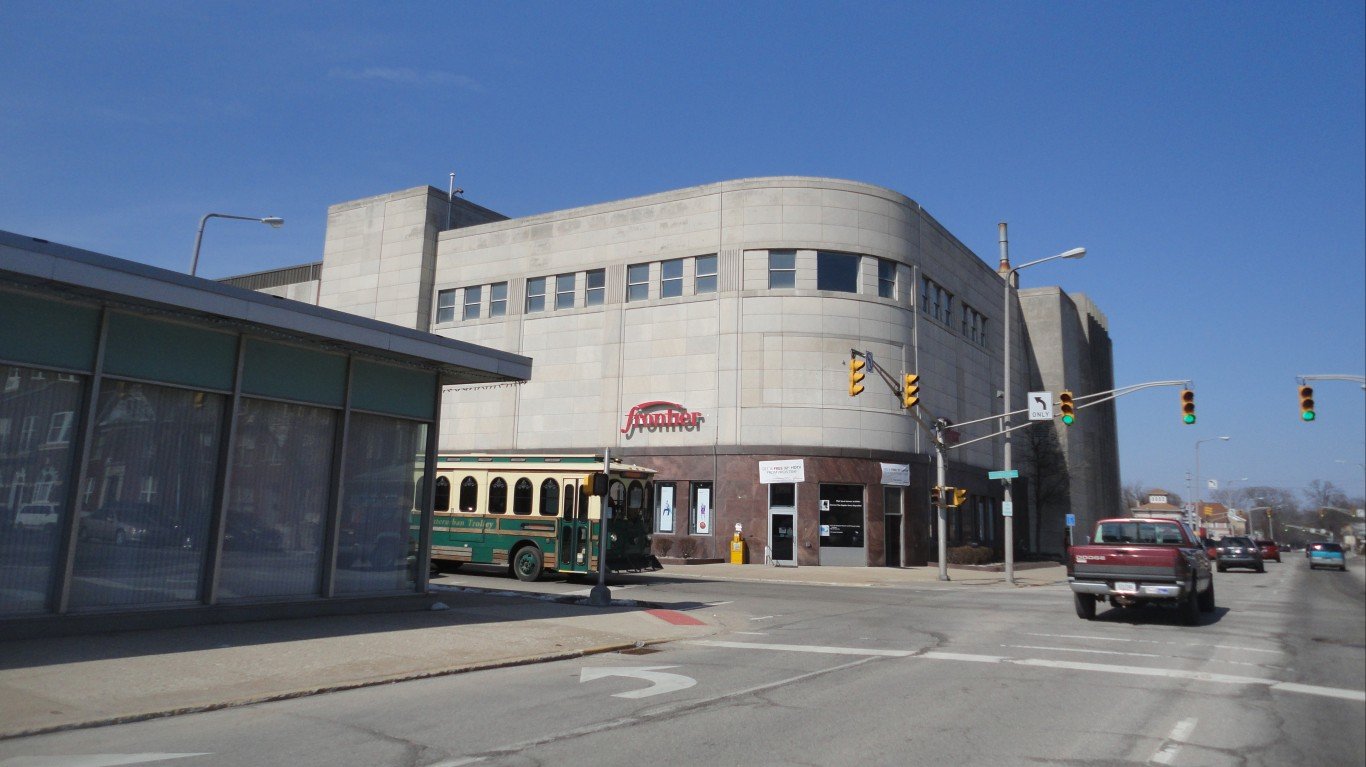
Source: JTGrafix / Getty Images
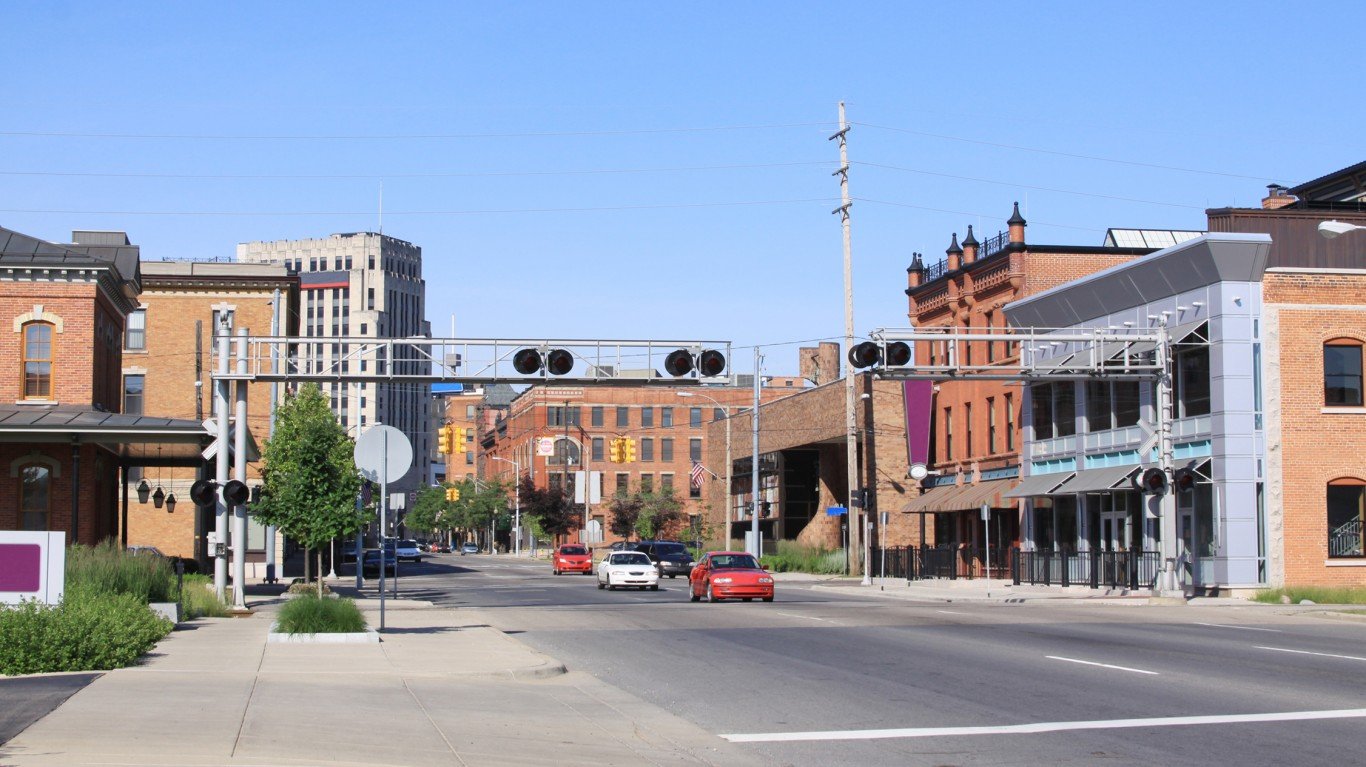
23. Kalamazoo-Portage, MI
> 5-yr. change in manufacturing employment: +15.4% (+2,900)
> 2017 manufacturing employment: 21,700 (14.7% of total)
> 2012 manufacturing employment: 18,800 (13.8% of total)
> Value of manufacturing exports: $1.7 billion
> August unemployment: 3.3%
[in-text-ad]
Source: Ron Johnson / Wikimedia Commons
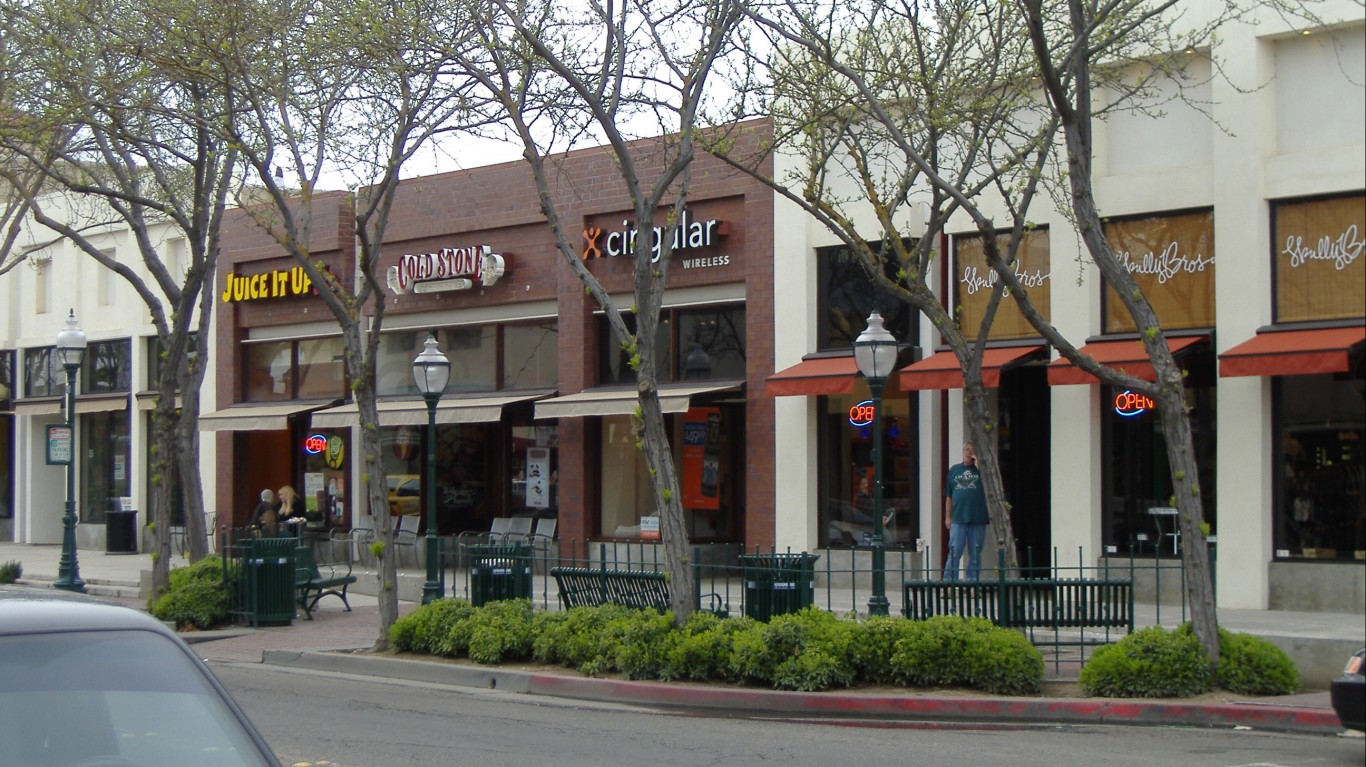
22. Merced, CA
> 5-yr. change in manufacturing employment: +15.5% (+1,300)
> 2017 manufacturing employment: 9,700 (14.4% of total)
> 2012 manufacturing employment: 8,400 (14.2% of total)
> Value of manufacturing exports: $458.9 million
> August unemployment: 8.1%

Source: shakzu / Getty Images
21. Vineland-Bridgeton, NJ
> 5-yr. change in manufacturing employment: +16.0% (+1,300)
> 2017 manufacturing employment: 9,400 (16.0% of total)
> 2012 manufacturing employment: 8,100 (14.1% of total)
> Value of manufacturing exports: $354.7 million
> August unemployment: 6.6%

Source: Public Domain / Wikimedia Commons
20. Albany, OR
> 5-yr. change in manufacturing employment: +16.2% (+1,100)
> 2017 manufacturing employment: 7,900 (17.8% of total)
> 2012 manufacturing employment: 6,800 (17.4% of total)
> Value of manufacturing exports: $722.0 million
> August unemployment: 4.3%
[in-text-ad-2]

Source: Billy Hathorn / Wikimedia Commons
18. Spartanburg, SC
> 5-yr. change in manufacturing employment: +16.7% (+4,400)
> 2017 manufacturing employment: 30,800 (20.1% of total)
> 2012 manufacturing employment: 26,400 (20.0% of total)
> Value of manufacturing exports: $2.8 billion
> August unemployment: 3.0%

Source: Bbean32 / Wikimedia Commons
19. Greeley, CO
> 5-yr. change in manufacturing employment: +16.7% (+1,900)
> 2017 manufacturing employment: 13,300 (12.7% of total)
> 2012 manufacturing employment: 11,400 (13.3% of total)
> Value of manufacturing exports: $796.0 million
> August unemployment: 3.2%
[in-text-ad]

Source: Thinkstock
17. Clarksville, TN-KY
> 5-yr. change in manufacturing employment: +17.0% (+1,700)
> 2017 manufacturing employment: 11,700 (13.0% of total)
> 2012 manufacturing employment: 10,000 (12.0% of total)
> Value of manufacturing exports: $826.5 million
> August unemployment: 4.5%
 24/7 Wall St.
Source: Thinkstock
16. Santa Rosa, CA
> 5-yr. change in manufacturing employment: +17.3% (+3,400)
> 2017 manufacturing employment: 23,100 (11.2% of total)
> 2012 manufacturing employment: 19,700 (11.4% of total)
> Value of manufacturing exports: $1.4 billion
> August unemployment: 2.5%
Source: Davel5957 / Getty Images
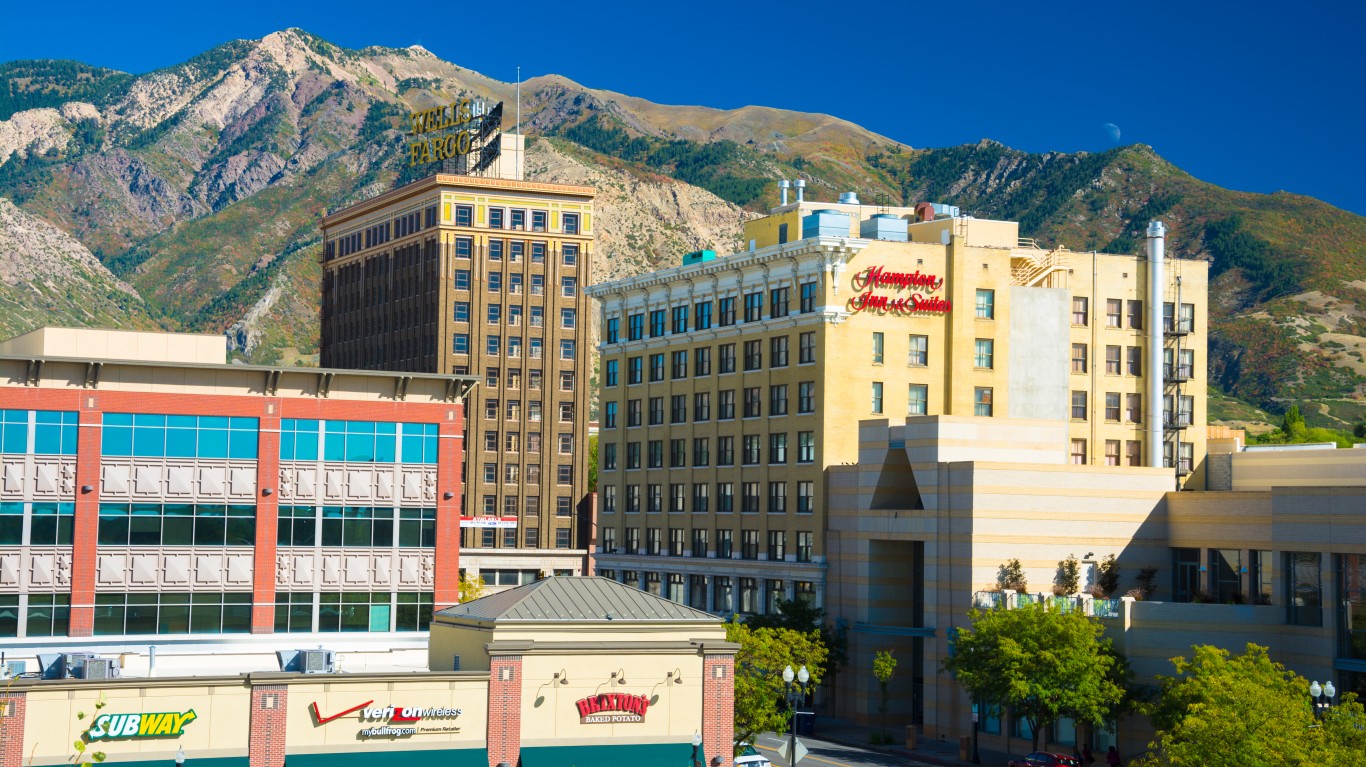
15. Ogden-Clearfield, UT
> 5-yr. change in manufacturing employment: +17.6% (+4,900)
> 2017 manufacturing employment: 32,700 (12.9% of total)
> 2012 manufacturing employment: 27,800 (12.7% of total)
> Value of manufacturing exports: $3.2 billion
> August unemployment: 3.3%
[in-text-ad-2]

Source: Jburge123 / Wikimedia Commons
14. Lake Charles, LA
> 5-yr. change in manufacturing employment: +18.2% (+1,600)
> 2017 manufacturing employment: 10,400 (9.0% of total)
> 2012 manufacturing employment: 8,800 (9.7% of total)
> Value of manufacturing exports: $6.4 billion
> August unemployment: 3.9%
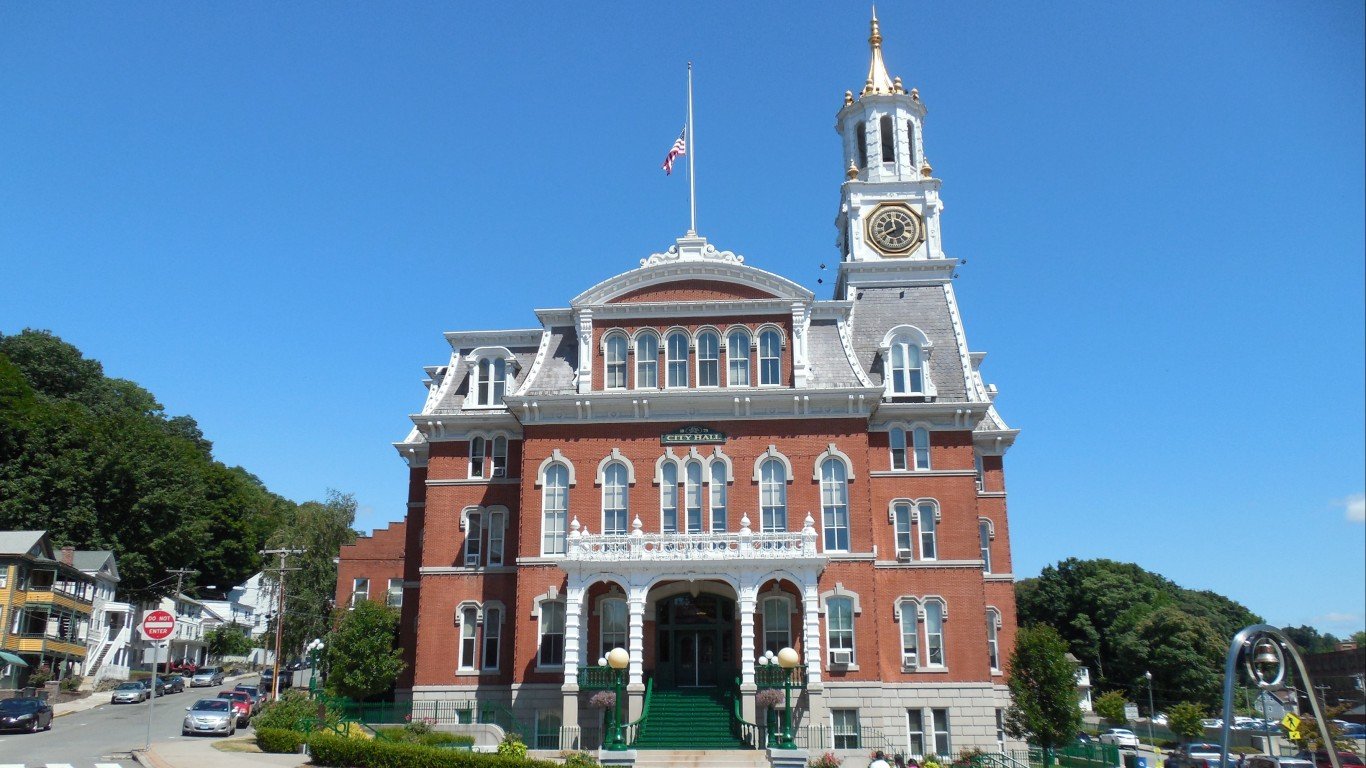
Source: John Phelan / Wikimedia Commons
13. Norwich-New London, CT
> 5-yr. change in manufacturing employment: +18.5% (+2,700)
> 2017 manufacturing employment: 17,300 (13.3% of total)
> 2012 manufacturing employment: 14,600 (11.3% of total)
> Value of manufacturing exports: $1.9 billion
> August unemployment: 3.7%
[in-text-ad]

Source: Public Domain / Wikimedia Commons
12. Kankakee, IL
> 5-yr. change in manufacturing employment: +18.5% (+1,000)
> 2017 manufacturing employment: 6,400 (13.8% of total)
> 2012 manufacturing employment: 5,400 (12.3% of total)
> Value of manufacturing exports: $572.4 million
> August unemployment: 4.8%

Source: Thinkstock
11. Louisville/Jefferson County, KY-IN
> 5-yr. change in manufacturing employment: +19.2% (+13,200)
> 2017 manufacturing employment: 81,900 (12.3% of total)
> 2012 manufacturing employment: 68,700 (11.5% of total)
> Value of manufacturing exports: $7.0 billion
> August unemployment: 3.9%

Source: Thinkstock
10. Detroit-Warren-Dearborn, MI
> 5-yr. change in manufacturing employment: +19.6% (+41,500)
> 2017 manufacturing employment: 253,100 (12.6% of total)
> 2012 manufacturing employment: 211,600 (11.5% of total)
> Value of manufacturing exports: $28.8 billion
> August unemployment: 4.2%
[in-text-ad-2]

Source: kenlund / Flickr
9. Grants Pass, OR
> 5-yr. change in manufacturing employment: +20.8% (+500)
> 2017 manufacturing employment: 2,900 (11.1% of total)
> 2012 manufacturing employment: 2,400 (10.5% of total)
> Value of manufacturing exports: $180.2 million
> August unemployment: 5.4%

Source: DenisTangneyJr / Getty Images
8. Grand Rapids-Wyoming, MI
> 5-yr. change in manufacturing employment: +21.8% (+20,600)
> 2017 manufacturing employment: 115,200 (20.8% of total)
> 2012 manufacturing employment: 94,600 (19.5% of total)
> Value of manufacturing exports: $7.4 billion
> August unemployment: 2.7%
[in-text-ad]

Source: DXR / Wikimedia Commons
7. Tuscaloosa, AL
> 5-yr. change in manufacturing employment: +23.9% (+3,200)
> 2017 manufacturing employment: 16,600 (15.4% of total)
> 2012 manufacturing employment: 13,400 (13.6% of total)
> Value of manufacturing exports: $2.2 billion
> August unemployment: 3.8%
 24/7 Wall St.
Source: Rivers A. Langley; SaveRivers / Wikimedia Commons
6. Auburn-Opelika, AL
> 5-yr. change in manufacturing employment: +25.0% (+1,400)
> 2017 manufacturing employment: 7,000 (10.8% of total)
> 2012 manufacturing employment: 5,600 (10.3% of total)
> Value of manufacturing exports: $588.1 million
> August unemployment: 3.6%

Source: Katherine Welles / Shutterstock.com
5. Bowling Green, KY
> 5-yr. change in manufacturing employment: +28.3% (+2,800)
> 2017 manufacturing employment: 12,700 (16.7% of total)
> 2012 manufacturing employment: 9,900 (14.4% of total)
> Value of manufacturing exports: $1.1 billion
> August unemployment: 3.9%
[in-text-ad-2]
Source: Public Domain / Wikimedia Commons
4. Elizabethtown-Fort Knox, KY
> 5-yr. change in manufacturing employment: +28.6% (+1,800)
> 2017 manufacturing employment: 8,100 (14.4% of total)
> 2012 manufacturing employment: 6,300 (12.0% of total)
> Value of manufacturing exports: $696.7 million
> August unemployment: 4.2%
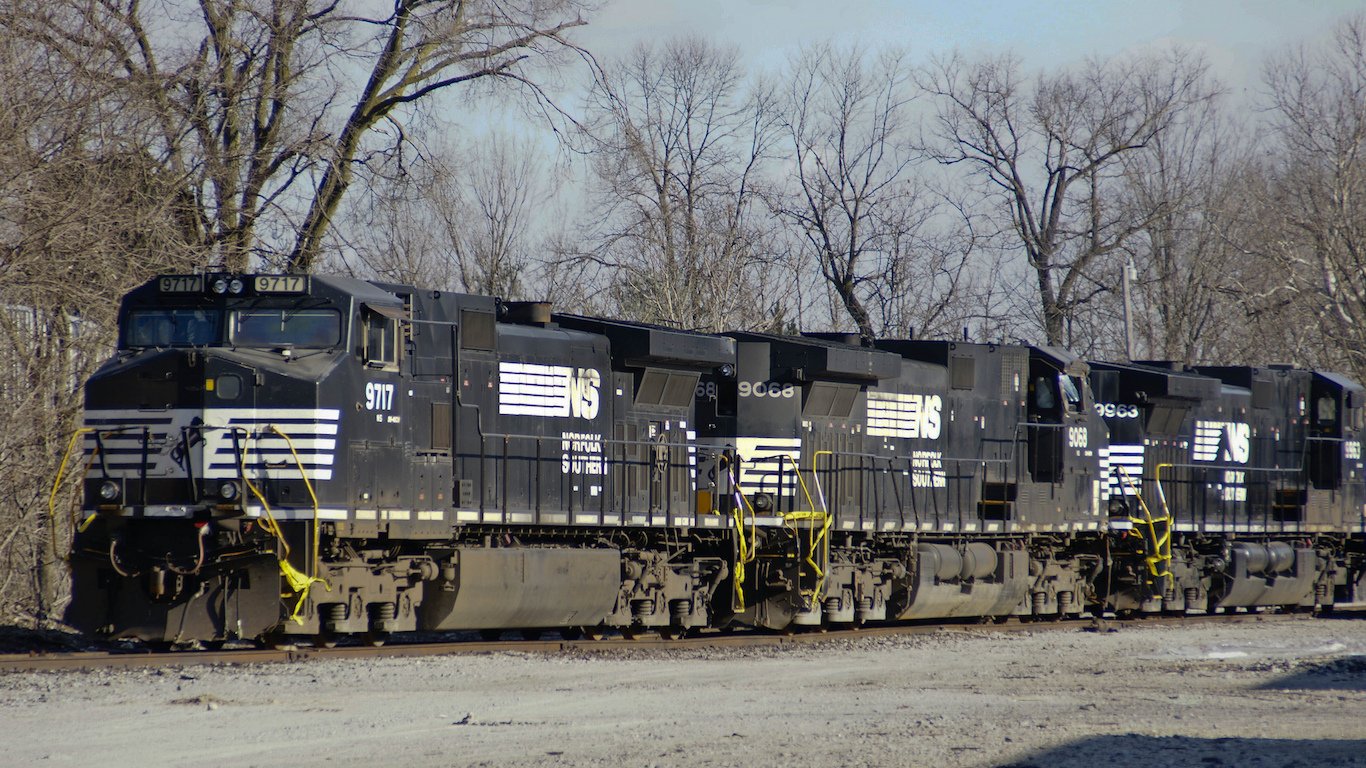
Source: Valerie Everett / Flickr
3. Kokomo, IN
> 5-yr. change in manufacturing employment: +30.5% (+2,900)
> 2017 manufacturing employment: 12,400 (29.7% of total)
> 2012 manufacturing employment: 9,500 (24.8% of total)
> Value of manufacturing exports: $1.8 billion
> August unemployment: 3.4%
[in-text-ad]
Source: pasa / Flickr
2. Elkhart-Goshen, IN
> 5-yr. change in manufacturing employment: +33.7% (+17,100)
> 2017 manufacturing employment: 67,900 (49.3% of total)
> 2012 manufacturing employment: 50,800 (44.6% of total)
> Value of manufacturing exports: $4.5 billion
> August unemployment: 2.7%
 24/7 Wall St.
Source: gsagi / Getty Images
1. Lewiston, ID-WA
> 5-yr. change in manufacturing employment: +40.6% (+1,300)
> 2017 manufacturing employment: 4,500 (15.6% of total)
> 2012 manufacturing employment: 3,200 (12.4% of total)
> Value of manufacturing exports: $236.6 million
> August unemployment: 3.0%
Detailed Findings
Among metro areas on this list, five-year surges in manufacturing employment levels range from 14.8% in Greenville, South Carolina, to 40.6% in Lewiston, Idaho. For reference, employment in manufacturing grew by 4.3% nationwide over the same time.
In almost every metro area on this list, manufacturing growth is outpacing overall job growth. In 24 of the 28 cities on this list, manufacturing now accounts for a larger share of total employment than it did five years ago. Nationwide, manufacturing accounts for 8.5% of total employment, down from 8.9% in 2012.
Manufacturing’s resurgence in parts of the United States is due largely to a reversal of the offshoring production trend that initially contributed to the sector’s decline. More and more, companies are choosing to open production plants in the United States as rising labor costs abroad, high transportation costs, and longer order cycles are reducing the financial benefit of outsourcing production.
Companies can also reduce exposure to risk by concentrating production domestically. Risks associated with foreign manufacturing include potentially inadequate quality control, cultural and language barriers, and reputation damage.
One company bringing manufacturing jobs back is automobile parts maker Gentex. The company shut down its plants in China and Mexico in recent years to consolidate production in Zeeland, Michigan. Zeeland lies within the Grand Rapids metro area, which has reported a 21.8% increase in manufacturing employment in the last half decade, five times the comparable national growth.
Similarly, multinational conglomerate General Electric recently shifted production of high-end refrigerators from Mexico to its Appliance Park facility in Louisville, Kentucky. Even more recently, the same plant expanded its dishwasher and laundry appliance production capacity, adding yet another 400 jobs. Due in part to GE’s Appliance Park facility, the Louisville metro area netted a manufacturing employment increase of 13,200 in the last five years, a 19.2% increase.
Other examples of major corporate expansions and relocations in progress in the cities on this list include a $1 billion investment in a new battery plant at the Mercedes Benz production facility in Tuscaloosa, Alabama, a new Briggs & Stratton engine production facility in Auburn, Alabama, and a $1 billion Fiat Chrysler factory in Warren, Michigan.
While jobs in manufacturing are coming back in these cities, they have changed considerably from the stereotypical assembly line factory job of the 20th century. Technological advancements in recent decades have impacted the production process in countless manufacturing jobs, and unskilled manufacturing jobs have largely been replaced by machines.
Maintaining and repairing those machines and overseeing production requires certain skill sets. While requirements vary depending on the job, it is not uncommon for manufacturing jobs to require licenses, certificates, or some level of college or technical school.
Methodology
To identify the cities where manufacturing is making a comeback, 24/7 Wall St. reviewed the percent increase in manufacturing employment from 2012 through 2017. To limit our list to manufacturing hubs, only metro areas where manufacturing accounted for a larger share of total employment in 2012 than the comparable 8.9% national concentration were considered. Sector level employment data and August unemployment data came from the Bureau of Labor Statistics. Total value of manufacturing exports came from the Brookings Institute’s “Export Monitor: 2018” report, which is based on 2017 data.
Sponsored: Find a Qualified Financial Advisor
Finding a qualified financial advisor doesn’t have to be hard. SmartAsset’s free tool matches you with up to 3 fiduciary financial advisors in your area in 5 minutes. Each advisor has been vetted by SmartAsset and is held to a fiduciary standard to act in your best interests. If you’re ready to be matched with local advisors that can help you achieve your financial goals, get started now.
Thank you for reading! Have some feedback for us?
Contact the 24/7 Wall St. editorial team.
Editors' Picks

