
Getting paid to do what you love every day is a dream relatively few Americans are able to realize. Many of us manage to be content with our work, especially when receiving livable wages. Of course, there is also plenty of unenjoyable work — at low wages — that still needs to be done.
At one time in the United States, being employed was enough to stay out of poverty. From jobs programs implemented during President Lyndon Johnson’s “War on Poverty” in the 1960s to work subsidies and incentives introduced during President Bill Clinton’s welfare reform programs in the 1990s, the labor market has long been viewed as an anti-poverty vehicle.
However, in many parts of the country adding jobs, being employed is no longer enough to alleviate financial challenges. There were 7.6 million Americans in the labor force living in poverty in 2016. That level of in-work poverty has fluctuated over the years, but it remains roughly at the same level reported a decade ago.
The economy has added millions of jobs since the recession ended, but many of these jobs are not the same as those that were lost. Without looking at wages or in-work poverty statistics, strong employment growth does not tell the whole story.
Nationwide, retail trade and the accommodation and food services industry added over one million jobs over the past three years, accounting for 21.7% of total employment growth. In all but two of the cities on this list, these relatively low-paying industries accounted for a larger share of jobs added. But individuals working in these industries are among the most likely to earn poverty wages.
“If a job doesn’t pay enough to get you out of poverty, it’s not a desirable job,” said Marty Kohli, chief regional economist with the Bureau of Labor Statistics.
To find the cities adding mostly low-wage jobs, 24/7 Wall St. reviewed three-year employment level changes in the relatively low-paying industries of retail trade and food and accommodation, as well as the percentage of the labor force living in poverty in U.S. metropolitan statistical areas.
To be considered, a metro area’s retail trade and accommodation and food services industry employment growth between 2014 and 2017 needed to exceed the national average employment growth for those industries. Individuals working in these industries are among the most likely to earn poverty wages. Out of the nearly 100 MSAs that met this criteria, the 30 listed have the highest labor force poverty rates (the share of an area’s labor force earning below poverty level incomes). Data was obtained from the U.S. Bureau of Labor Statistics.
Click here to see the cities adding jobs nobody wants.

Source: Thinkstock
30. San Luis Obispo-Paso Robles-Arroyo Grande, CA
> Retail trade employment growth 2014-2017: 3.6%
> Accommodation & food services employment growth 2014-2017: 14.1%
> Total employment growth 2014-2017: 6.4%
> Labor force in poverty: 8.9%
> Average annual wage: $45,796
[in-text-ad]

Source: benedek / Getty Images
29. Prescott, AZ
> Retail trade employment growth 2014-2017: 5.4%
> Accommodation & food services employment growth 2014-2017: 18.4%
> Total employment growth 2014-2017: 9.3%
> Labor force in poverty: 9.0%
> Average annual wage: $38,564
 24/7 Wall St.
Source: MichaelWarrenPix / Getty Images
28. Ocala, FL
> Retail trade employment growth 2014-2017: 5.9%
> Accommodation & food services employment growth 2014-2017: 12.9%
> Total employment growth 2014-2017: 6.9%
> Labor force in poverty: 9.0%
> Average annual wage: $37,240

Source: Craig McCausland / Getty Images
27. Boulder, CO
> Retail trade employment growth 2014-2017: 6.0%
> Accommodation & food services employment growth 2014-2017: 9.9%
> Total employment growth 2014-2017: 6.4%
> Labor force in poverty: 9.0%
> Average annual wage: $64,820
[in-text-ad-2]

Source: Leadinglights / Getty Images
26. Jackson, TN
> Retail trade employment growth 2014-2017: 3.7%
> Accommodation & food services employment growth 2014-2017: 14.0%
> Total employment growth 2014-2017: 5.9%
> Labor force in poverty: 9.1%
> Average annual wage: $41,776

Source: KingWu / Getty Images
25. Salem, OR
> Retail trade employment growth 2014-2017: 9.0%
> Accommodation & food services employment growth 2014-2017: 13.4%
> Total employment growth 2014-2017: 9.3%
> Labor force in poverty: 9.1%
> Average annual wage: $43,769
[in-text-ad]

Source: Tobias Kleinlercher / Wikimedia Commons
24. Grants Pass, OR
> Retail trade employment growth 2014-2017: 12.1%
> Accommodation & food services employment growth 2014-2017: 18.5%
> Total employment growth 2014-2017: 11.6%
> Labor force in poverty: 9.2%
> Average annual wage: $35,921
Source: marekuliasz / Getty Images
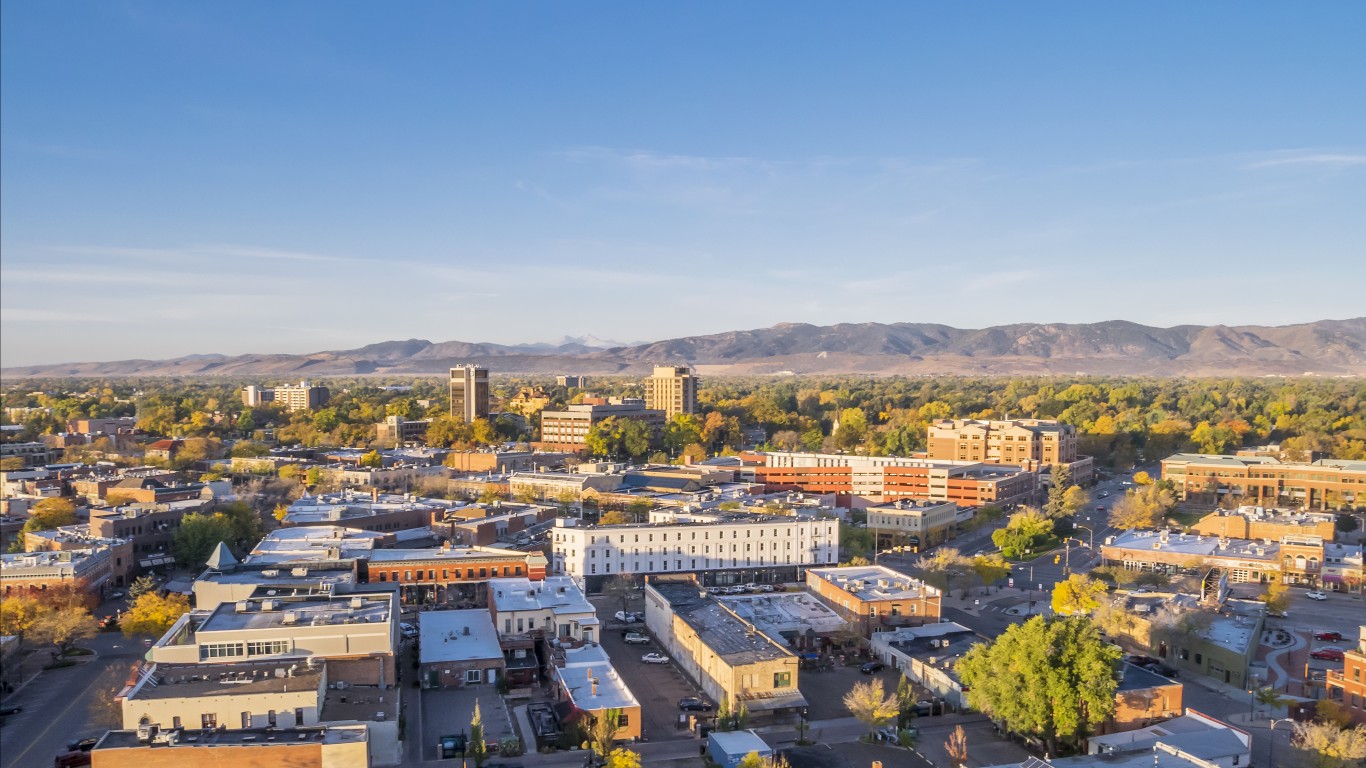
23. Fort Collins, CO
> Retail trade employment growth 2014-2017: 9.6%
> Accommodation & food services employment growth 2014-2017: 11.1%
> Total employment growth 2014-2017: 11.3%
> Labor force in poverty: 9.4%
> Average annual wage: $50,236

Source: Thinkstock
22. Gulfport-Biloxi-Pascagoula, MS
> Retail trade employment growth 2014-2017: 6.2%
> Accommodation & food services employment growth 2014-2017: 19.7%
> Total employment growth 2014-2017: 1.5%
> Labor force in poverty: 9.5%
> Average annual wage: $42,407
[in-text-ad-2]

Source: Thinkstock
21. Myrtle Beach-Conway-North Myrtle Beach, SC-NC
> Retail trade employment growth 2014-2017: 6.9%
> Accommodation & food services employment growth 2014-2017: 11.1%
> Total employment growth 2014-2017: 9.9%
> Labor force in poverty: 9.7%
> Average annual wage: $34,194

Source: Thinkstock
20. Lexington-Fayette, KY
> Retail trade employment growth 2014-2017: 5.2%
> Accommodation & food services employment growth 2014-2017: 10.7%
> Total employment growth 2014-2017: 6.0%
> Labor force in poverty: 9.8%
> Average annual wage: $47,156
[in-text-ad]

Source: Omegaforest / Getty Images
19. Yakima, WA
> Retail trade employment growth 2014-2017: 7.8%
> Accommodation & food services employment growth 2014-2017: 14.0%
> Total employment growth 2014-2017: 6.6%
> Labor force in poverty: 9.9%
> Average annual wage: $38,333
 24/7 Wall St.
Source: peeterv / Getty Images
18. Wilmington, NC
> Retail trade employment growth 2014-2017: 5.1%
> Accommodation & food services employment growth 2014-2017: 13.5%
> Total employment growth 2014-2017: 8.6%
> Labor force in poverty: 9.9%
> Average annual wage: $43,633
Source: Ildar Sagdejev / Wikimedia Commons
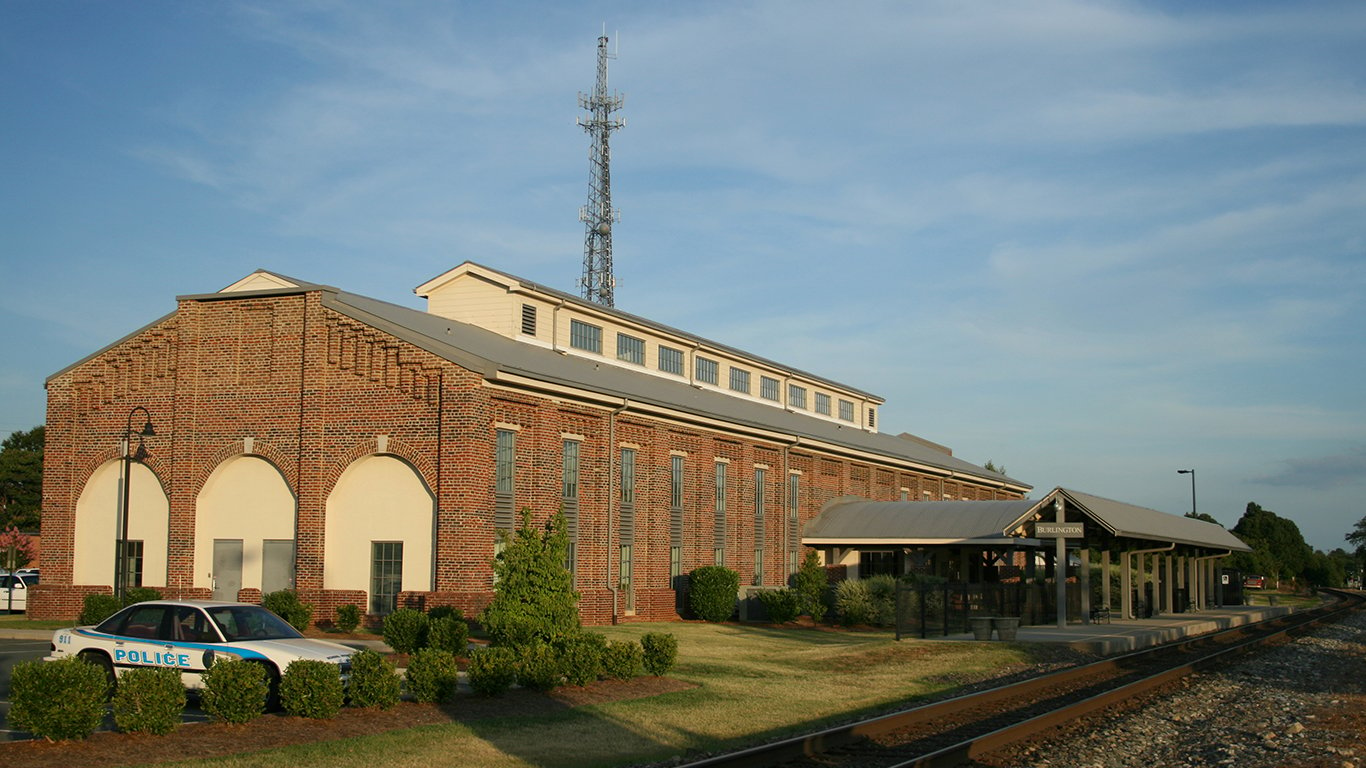
17. Burlington, NC
> Retail trade employment growth 2014-2017: 10.6%
> Accommodation & food services employment growth 2014-2017: 12.3%
> Total employment growth 2014-2017: 4.2%
> Labor force in poverty: 10.0%
> Average annual wage: $40,038
[in-text-ad-2]

Source: benedek / Getty Images
16. Ithaca, NY
> Retail trade employment growth 2014-2017: 3.7%
> Accommodation & food services employment growth 2014-2017: 8.8%
> Total employment growth 2014-2017: 3.0%
> Labor force in poverty: 10.0%
> Average annual wage: $52,901
Source: Thomson200 / Wikimedia Commons
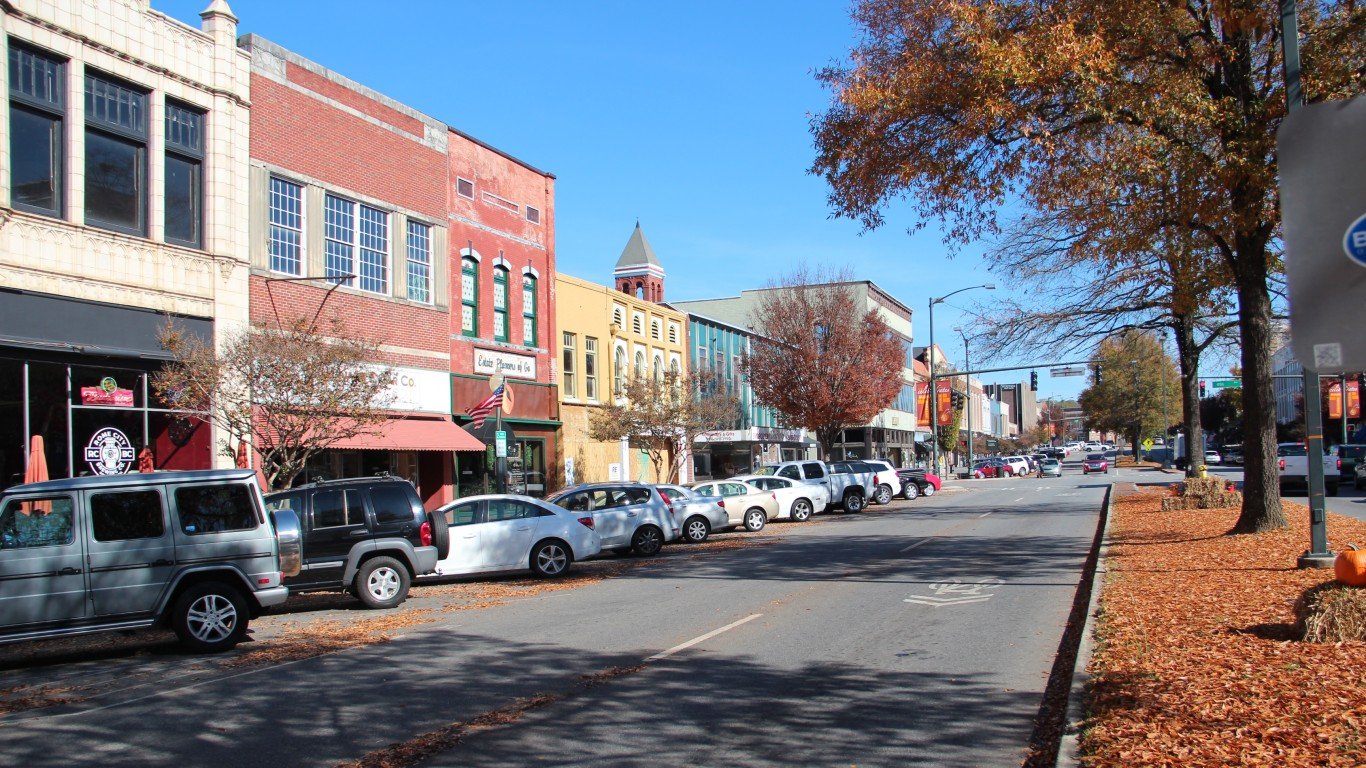
15. Rome, GA
> Retail trade employment growth 2014-2017: 3.4%
> Accommodation & food services employment growth 2014-2017: 11.3%
> Total employment growth 2014-2017: 3.7%
> Labor force in poverty: 10.3%
> Average annual wage: $41,629
[in-text-ad]

Source: ginton / Getty Images
14. Lake Havasu City-Kingman, AZ
> Retail trade employment growth 2014-2017: 6.7%
> Accommodation & food services employment growth 2014-2017: 35.8%
> Total employment growth 2014-2017: 7.1%
> Labor force in poverty: 10.5%
> Average annual wage: $37,274

Source: Jcarrello / Wikimedia Commons
13. Madera, CA
> Retail trade employment growth 2014-2017: 5.3%
> Accommodation & food services employment growth 2014-2017: 11.6%
> Total employment growth 2014-2017: 1.4%
> Labor force in poverty: 10.6%
> Average annual wage: $42,212
Source: Public Domain / Wikimedia Commons
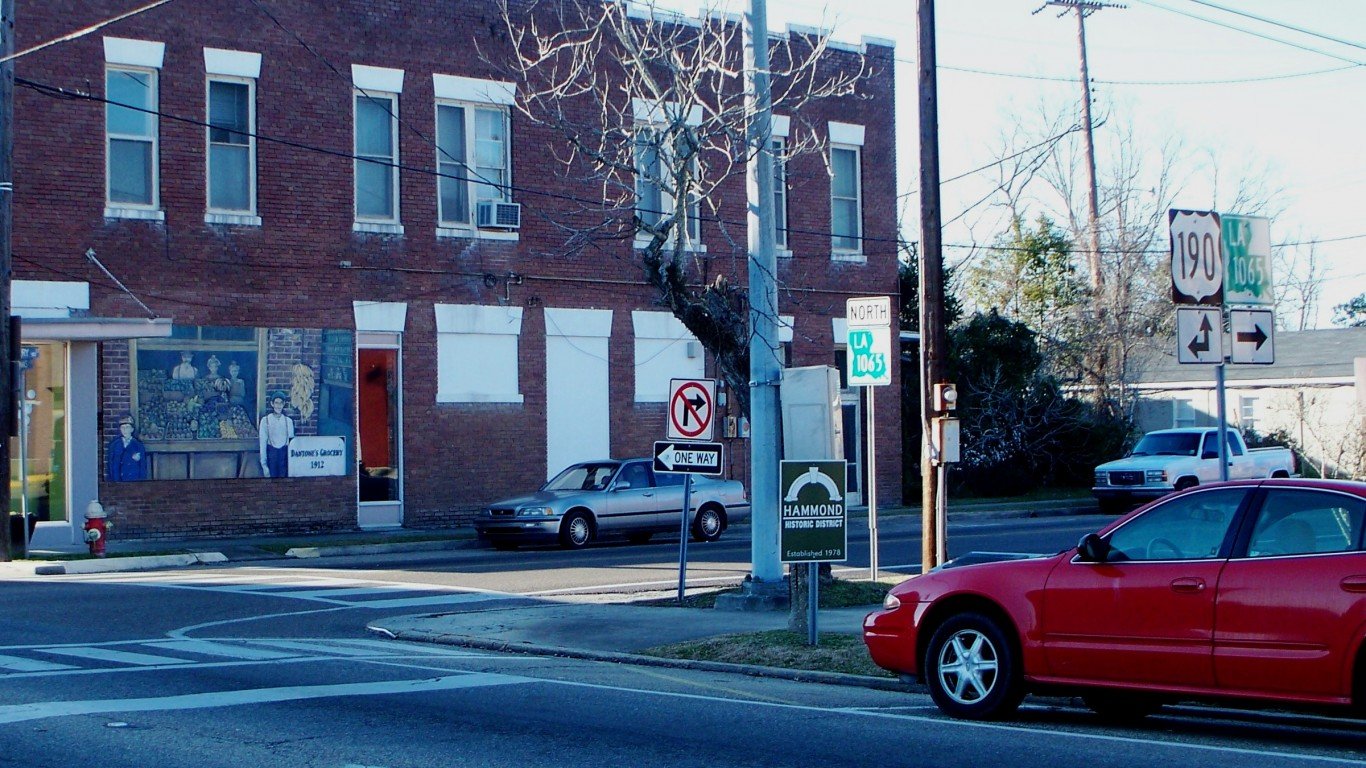
12. Hammond, LA
> Retail trade employment growth 2014-2017: 4.8%
> Accommodation & food services employment growth 2014-2017: 13.4%
> Total employment growth 2014-2017: 5.1%
> Labor force in poverty: 11.1%
> Average annual wage: $35,353
[in-text-ad-2]

Source: Dina_Stauter / Getty Images
11. Medford, OR
> Retail trade employment growth 2014-2017: 10.1%
> Accommodation & food services employment growth 2014-2017: 15.5%
> Total employment growth 2014-2017: 9.6%
> Labor force in poverty: 11.3%
> Average annual wage: $41,404

Source: garytog / Getty Images
10. Bakersfield, CA
> Retail trade employment growth 2014-2017: 7.6%
> Accommodation & food services employment growth 2014-2017: 9.1%
> Total employment growth 2014-2017: 1.4%
> Labor force in poverty: 11.4%
> Average annual wage: $45,031
[in-text-ad]
Source: oddharmonic / Flickr
9. Goldsboro, NC
> Retail trade employment growth 2014-2017: 5.7%
> Accommodation & food services employment growth 2014-2017: 11.2%
> Total employment growth 2014-2017: -0.5%
> Labor force in poverty: 11.7%
> Average annual wage: $36,348

Source: Thinkstock
8. Yuma, AZ
> Retail trade employment growth 2014-2017: 10.2%
> Accommodation & food services employment growth 2014-2017: 9.5%
> Total employment growth 2014-2017: 3.5%
> Labor force in poverty: 12.0%
> Average annual wage: $38,021

Source: akpakp / Getty Images
7. Missoula, MT
> Retail trade employment growth 2014-2017: 5.4%
> Accommodation & food services employment growth 2014-2017: 10.6%
> Total employment growth 2014-2017: 5.8%
> Labor force in poverty: 12.1%
> Average annual wage: $40,886
[in-text-ad-2]

Source: Warren-Pender / Getty Images
6. Sebring, FL
> Retail trade employment growth 2014-2017: 8.5%
> Accommodation & food services employment growth 2014-2017: 11.2%
> Total employment growth 2014-2017: 5.2%
> Labor force in poverty: 12.4%
> Average annual wage: $33,824

Source: Sean Pavone / Getty Images
5. Eugene, OR
> Retail trade employment growth 2014-2017: 7.2%
> Accommodation & food services employment growth 2014-2017: 11.7%
> Total employment growth 2014-2017: 8.8%
> Labor force in poverty: 12.6%
> Average annual wage: $42,667
[in-text-ad]

Source: Thinkstock
4. Auburn-Opelika, AL
> Retail trade employment growth 2014-2017: 8.2%
> Accommodation & food services employment growth 2014-2017: 15.6%
> Total employment growth 2014-2017: 8.6%
> Labor force in poverty: 13.4%
> Average annual wage: $38,574
 24/7 Wall St.
Source: Spondylolithesis / Getty Images
3. Fresno, CA
> Retail trade employment growth 2014-2017: 6.1%
> Accommodation & food services employment growth 2014-2017: 11.0%
> Total employment growth 2014-2017: 7.7%
> Labor force in poverty: 13.4%
> Average annual wage: $42,900

Source: jgreesonarts / Getty Images
2. Chico, CA
> Retail trade employment growth 2014-2017: 11.2%
> Accommodation & food services employment growth 2014-2017: 9.8%
> Total employment growth 2014-2017: 8.3%
> Labor force in poverty: 14.1%
> Average annual wage: $41,099
[in-text-ad-2]

Source: Earthly-Halo / Getty Images
1. Corvallis, OR
> Retail trade employment growth 2014-2017: 10.1%
> Accommodation & food services employment growth 2014-2017: 9.5%
> Total employment growth 2014-2017: 7.3%
> Labor force in poverty: 16.0%
> Average annual wage: $50,089
Take This Retirement Quiz To Get Matched With An Advisor Now (Sponsored)
Are you ready for retirement? Planning for retirement can be overwhelming, that’s why it could be a good idea to speak to a fiduciary financial advisor about your goals today.
Start by taking this retirement quiz right here from SmartAsset that will match you with up to 3 financial advisors that serve your area and beyond in 5 minutes. Smart Asset is now matching over 50,000 people a month.
Click here now to get started.
Thank you for reading! Have some feedback for us?
Contact the 24/7 Wall St. editorial team.
Editors' Picks

