
As members of the baby boom generation age into retirement — approximately 10,000 Americans turn 65 every day — more and more are relying on pension benefits as their main source of income.
Public pension plans typically require employees to contribute a share of their salaries to a pool of funds that is invested on the employee’s behalf to be paid out to them in retirement. Teachers, firefighters, sanitation workers, and other public sector employees count on the various employment benefits of public sector work, including receiving in retirement a steady pension payout.
Mismanagement of the funds at the state and local levels as well as market volatility, however, may put pension benefits at risk for many workers entering retirement in the near future.
Every state has an underfunded pension. The smallest pension funding gap — the difference between a state’s pension assets and its retirement benefit obligations — sits at more than $335 million. Pension funding is largely a function of government policy, and failure by lawmakers to adequately manage risk, forecast return on investment, and budget for demographic changes can create large pension funding shortfalls.
To rank the severity of each state’s pension crisis, 24/7 Wall St. reviewed the average pension funding ratio — the market value of a pension fund as a share of the total benefits owed to current or retired public employees — for all 50 states as of 2016 with data from nongovernmental organization The Pew Charitable Trusts.
Click here to see the full list of pension crises in every state, ranked.
Click here to see our detailed findings and methodology.
Correction: An earlier version of this story incorrectly expressed pension debts in billions and trillions. In fact, state-level pension debts range from the hundred millions to the hundred billions, and are reflected accurately in the current version of this story.
Source: csfotoimages / Getty Images
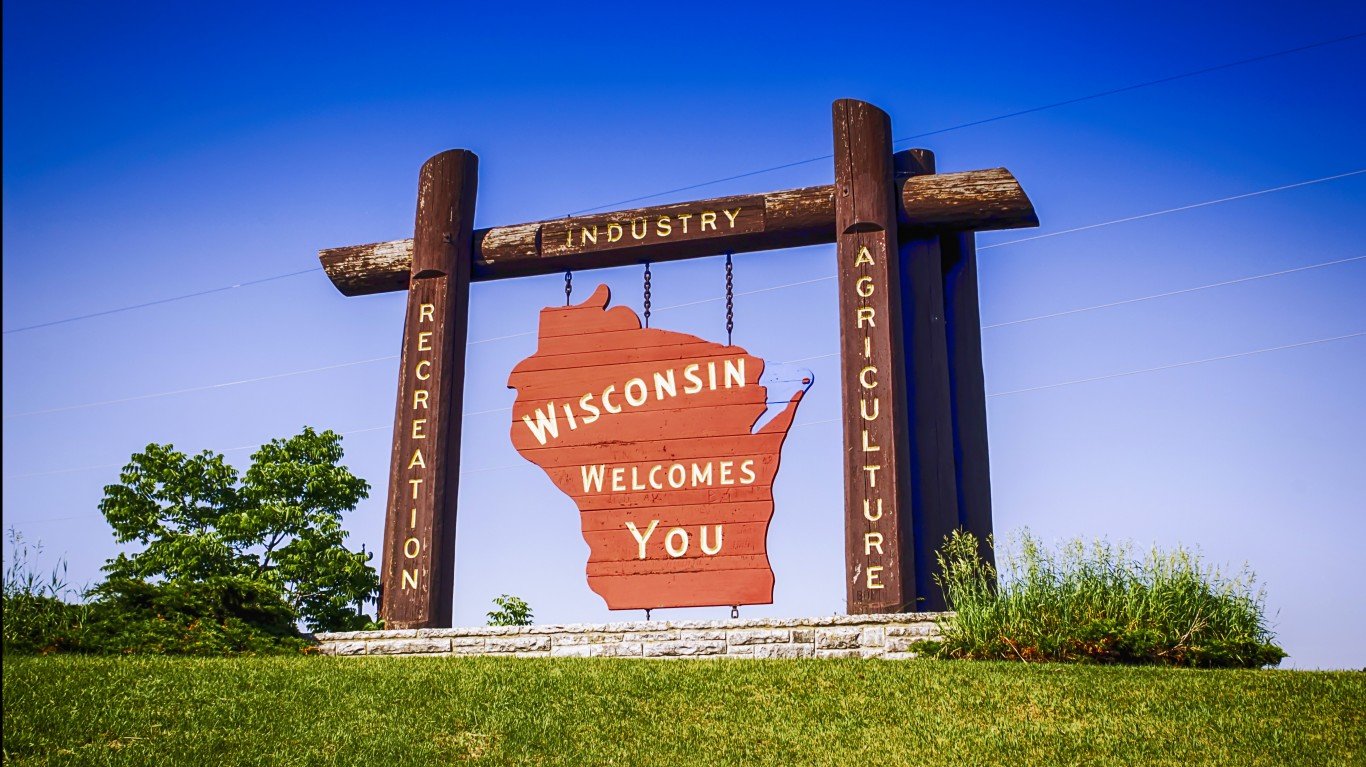
50. Wisconsin
> Funded ratio: 99.1%
> Total pension shortfall: $852.9 million (2nd smallest)
> Gov’t workers as share of total workforce: 12.9% (13th lowest)
> Avg. annual payout per public retiree: $24,897 (17th highest)
[in-text-ad]
Source: JMichl / Getty Images
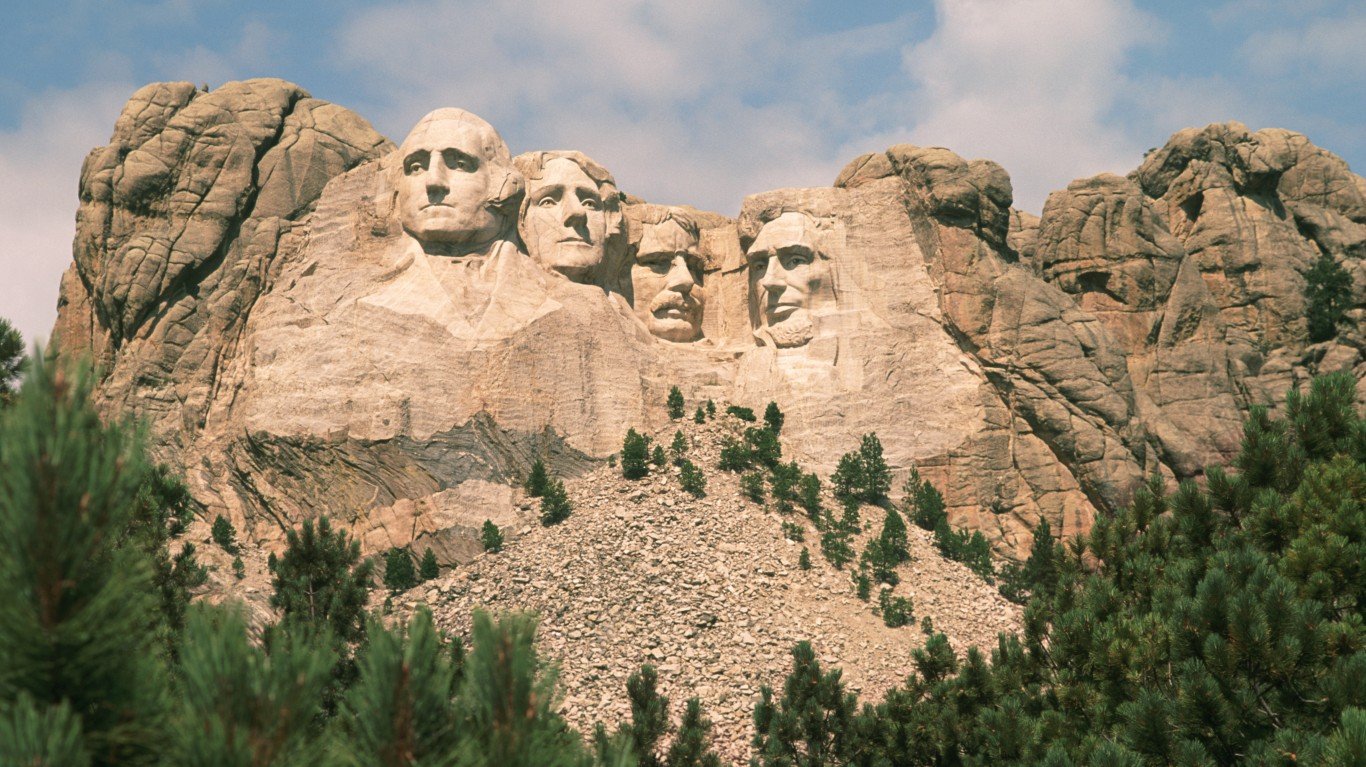
49. South Dakota
> Funded ratio: 96.9%
> Total pension shortfall: $337.8 million (the smallest)
> Gov’t workers as share of total workforce: 15.7% (12th highest)
> Avg. annual payout per public retiree: $19,649 (13th lowest)

Source: SeanPavonePhoto / Getty Images
48. Tennessee
> Funded ratio: 94.1%
> Total pension shortfall: $2.7 billion (8th smallest)
> Gov’t workers as share of total workforce: 12.7% (10th lowest)
> Avg. annual payout per public retiree: $17,714 (6th lowest)

Source: spyarm / Getty Images
47. New York
> Funded ratio: 90.6%
> Total pension shortfall: $19.0 billion (20th largest)
> Gov’t workers as share of total workforce: 14.0% (24th lowest)
> Avg. annual payout per public retiree: $32,487 (8th highest)
[in-text-ad-2]

Source: marekuliasz / Getty Images
46. Nebraska
> Funded ratio: 88.8%
> Total pension shortfall: $1.5 billion (3rd smallest)
> Gov’t workers as share of total workforce: 15.3% (18th highest)
> Avg. annual payout per public retiree: $25,577 (14th highest)

Source: Thinkstock
45. North Carolina
> Funded ratio: 88.3%
> Total pension shortfall: $11.5 billion (21st smallest)
> Gov’t workers as share of total workforce: 15.0% (21st highest)
> Avg. annual payout per public retiree: $19,429 (11th lowest)
[in-text-ad]
Source: vkbhat / Getty Images
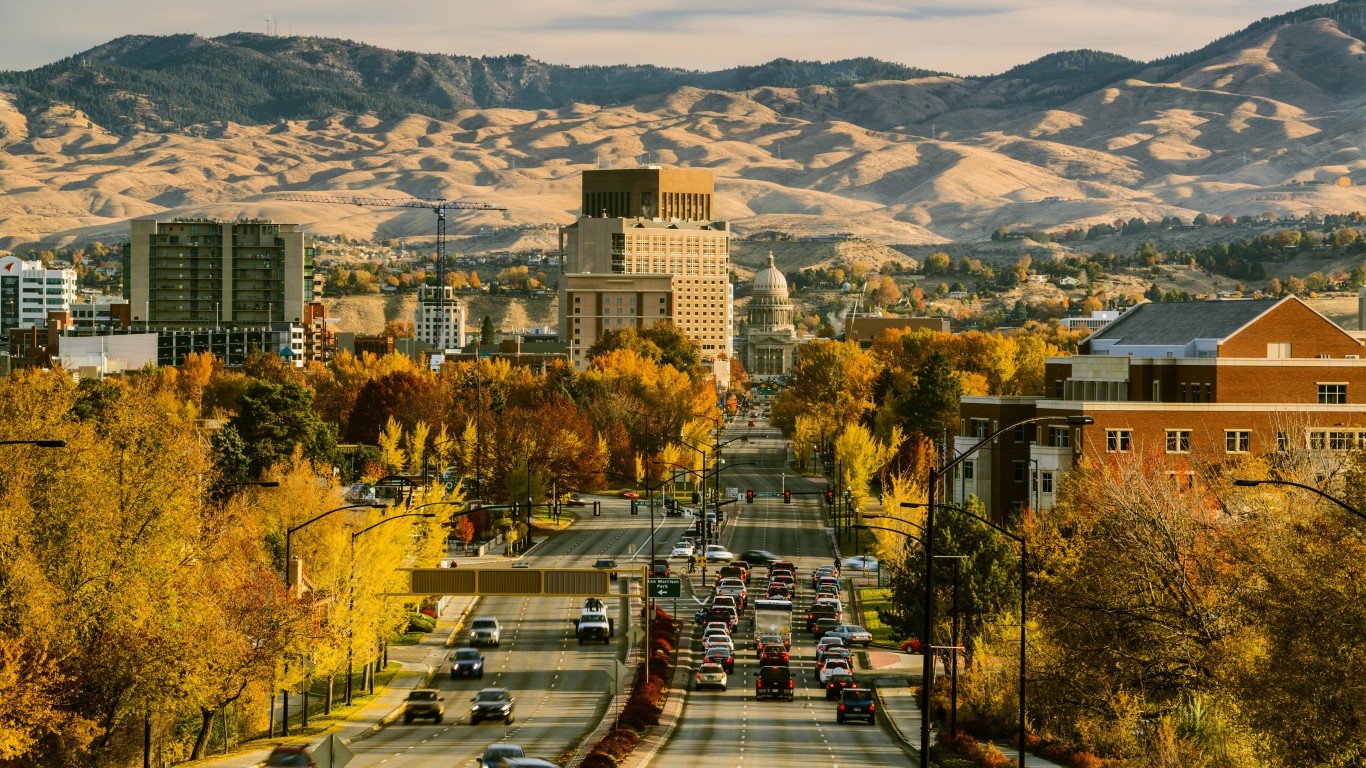
44. Idaho
> Funded ratio: 87.7%
> Total pension shortfall: $2.0 billion (4th smallest)
> Gov’t workers as share of total workforce: 15.4% (16th highest)
> Avg. annual payout per public retiree: $18,714 (10th lowest)
 24/7 Wall St.
Source: johnnya123 / Getty Images
43. Utah
> Funded ratio: 86.0%
> Total pension shortfall: $4.7 billion (12th smallest)
> Gov’t workers as share of total workforce: 14.1% (25th lowest)
> Avg. annual payout per public retiree: $23,733 (23rd highest)

Source: Thinkstock
42. Washington
> Funded ratio: 84.0%
> Total pension shortfall: $14.4 billion (25th smallest)
> Gov’t workers as share of total workforce: 15.4% (17th highest)
> Avg. annual payout per public retiree: $21,943 (20th lowest)
[in-text-ad-2]

Source: Maksymowicz / Getty Images
41. Iowa
> Funded ratio: 81.6%
> Total pension shortfall: $6.5 billion (16th smallest)
> Gov’t workers as share of total workforce: 15.4% (15th highest)
> Avg. annual payout per public retiree: $17,019 (5th lowest)

Source: DenisTangneyJr / Getty Images
40. Delaware
> Funded ratio: 81.1%
> Total pension shortfall: $2.1 billion (5th smallest)
> Gov’t workers as share of total workforce: 13.3% (18th lowest)
> Avg. annual payout per public retiree: $21,171 (19th lowest)
[in-text-ad]

Source: doraartem / Getty Images
39. Oregon
> Funded ratio: 80.5%
> Total pension shortfall: $15.0 billion (25th largest)
> Gov’t workers as share of total workforce: 15.0% (20th highest)
> Avg. annual payout per public retiree: $32,957 (7th highest)
 24/7 Wall St.
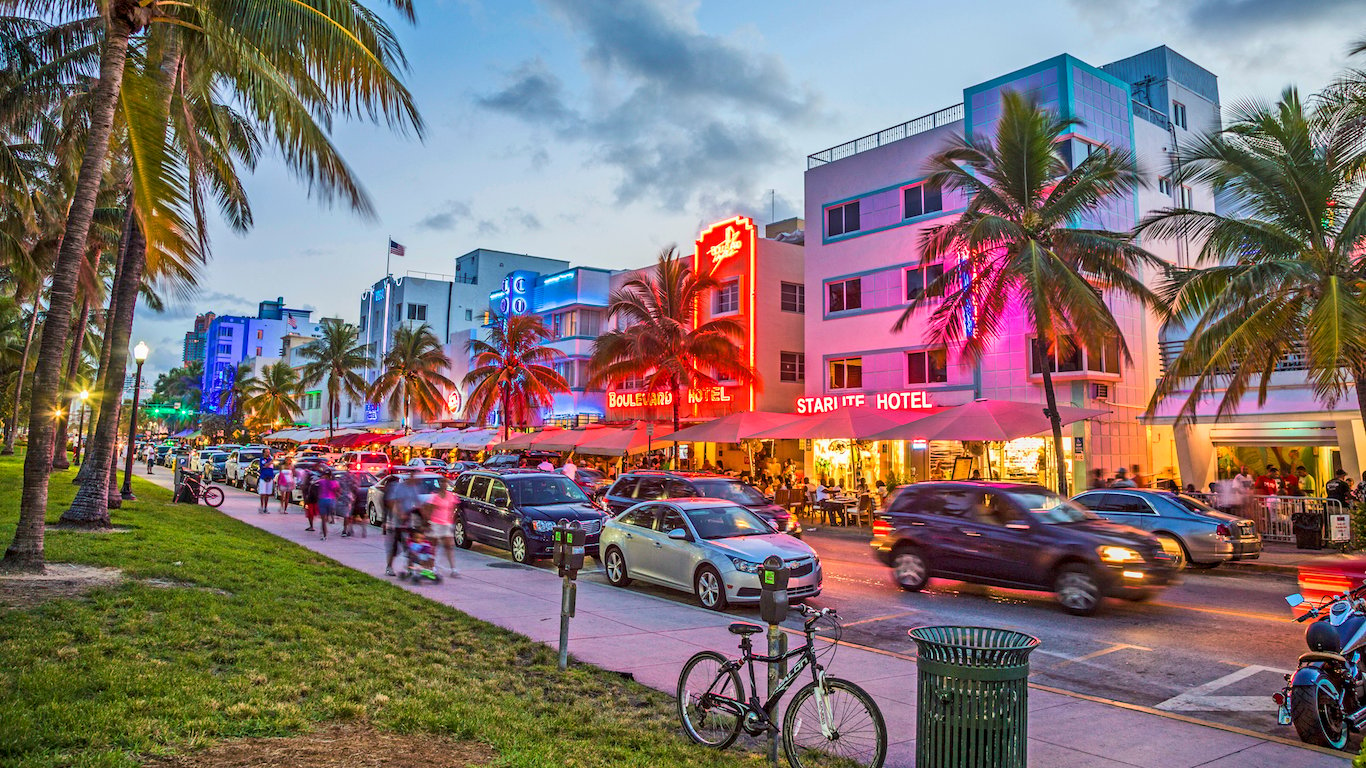
Source: Meinzahn / iStock
38. Florida
> Funded ratio: 79.4%
> Total pension shortfall: $36.9 billion (12th largest)
> Gov’t workers as share of total workforce: 11.3% (5th lowest)
> Avg. annual payout per public retiree: $23,349 (25th highest)

Source: sara_winter / Getty Images
37. Maine
> Funded ratio: 77.3%
> Total pension shortfall: $3.6 billion (10th smallest)
> Gov’t workers as share of total workforce: 13.6% (20th lowest)
> Avg. annual payout per public retiree: $20,006 (15th lowest)
[in-text-ad-2]

Source: Sean Pavone / Getty Images
36. Arkansas
> Funded ratio: 76.9%
> Total pension shortfall: $7.2 billion (17th smallest)
> Gov’t workers as share of total workforce: 15.4% (14th highest)
> Avg. annual payout per public retiree: $19,463 (12th lowest)

Source: DenisTangneyJr / Getty Images
35. Missouri
> Funded ratio: 76.7%
> Total pension shortfall: $15.7 billion (24th largest)
> Gov’t workers as share of total workforce: 13.2% (17th lowest)
> Avg. annual payout per public retiree: $23,074 (23rd lowest)
[in-text-ad]

Source: SeanPavonePhoto / Getty Images
34. Georgia
> Funded ratio: 75.8%
> Total pension shortfall: $25.8 billion (15th largest)
> Gov’t workers as share of total workforce: 13.2% (16th lowest)
> Avg. annual payout per public retiree: $27,752 (12th highest)

Source: aoldman / Getty Images
33. Wyoming
> Funded ratio: 73.3%
> Total pension shortfall: $2.8 billion (9th smallest)
> Gov’t workers as share of total workforce: 22.3% (the highest)
> Avg. annual payout per public retiree: $18,305 (8th lowest)

Source: SeanPavonePhoto / Getty Images
32. Texas
> Funded ratio: 73.0%
> Total pension shortfall: $59.0 billion (5th largest)
> Gov’t workers as share of total workforce: 14.2% (24th highest)
> Avg. annual payout per public retiree: $23,236 (24th lowest)
[in-text-ad-2]

Source: Xavier_Ascanio / Getty Images
31. Virginia
> Funded ratio: 72.4%
> Total pension shortfall: $25.3 billion (16th largest)
> Gov’t workers as share of total workforce: 13.6% (21st lowest)
> Avg. annual payout per public retiree: $22,544 (22nd lowest)

Source: f11photo / Getty Images
30. Nevada
> Funded ratio: 72.3%
> Total pension shortfall: $13.5 billion (23rd smallest)
> Gov’t workers as share of total workforce: 10.6% (3rd lowest)
> Avg. annual payout per public retiree: $36,028 (3rd highest)
[in-text-ad]
Source: Sean Pavone / Getty Images
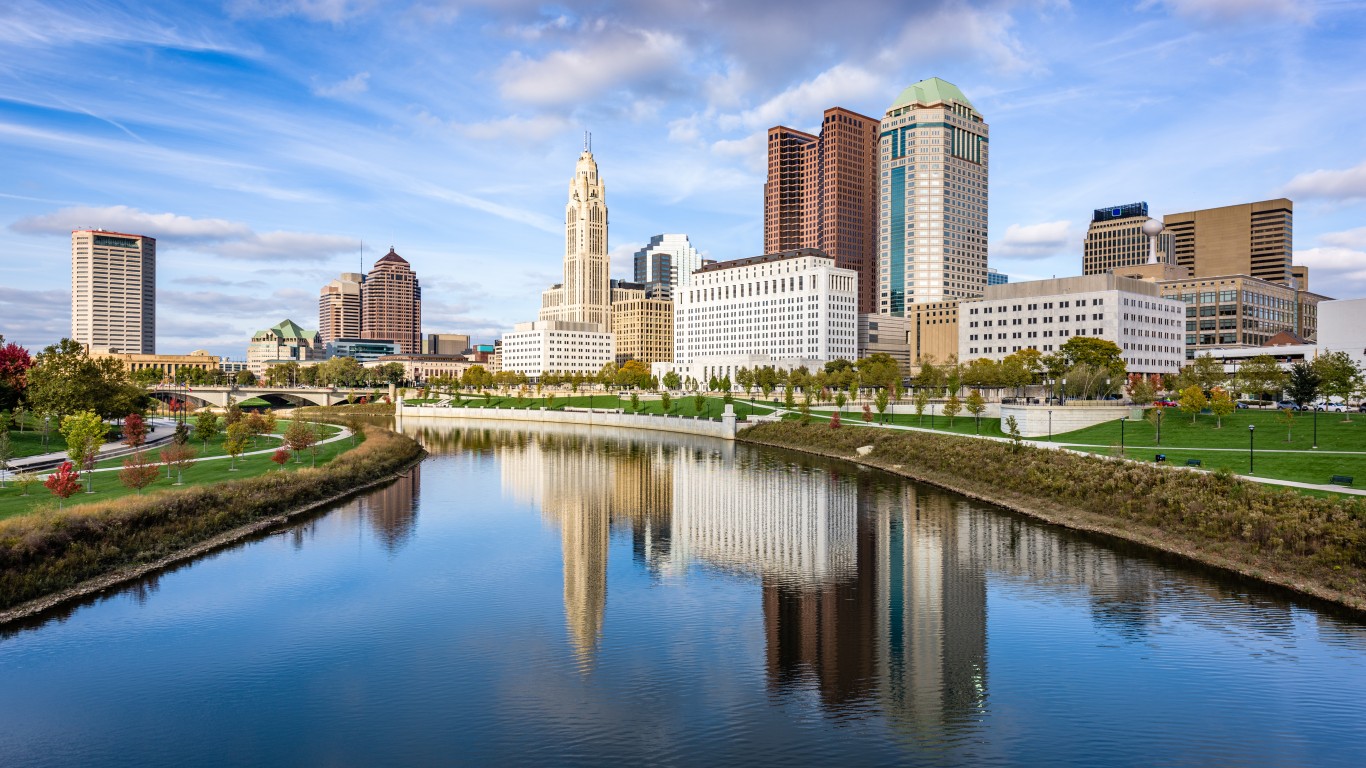
29. Ohio
> Funded ratio: 72.0%
> Total pension shortfall: $56.5 billion (6th largest)
> Gov’t workers as share of total workforce: 12.7% (11th lowest)
> Avg. annual payout per public retiree: $32,333 (9th highest)
 24/7 Wall St.
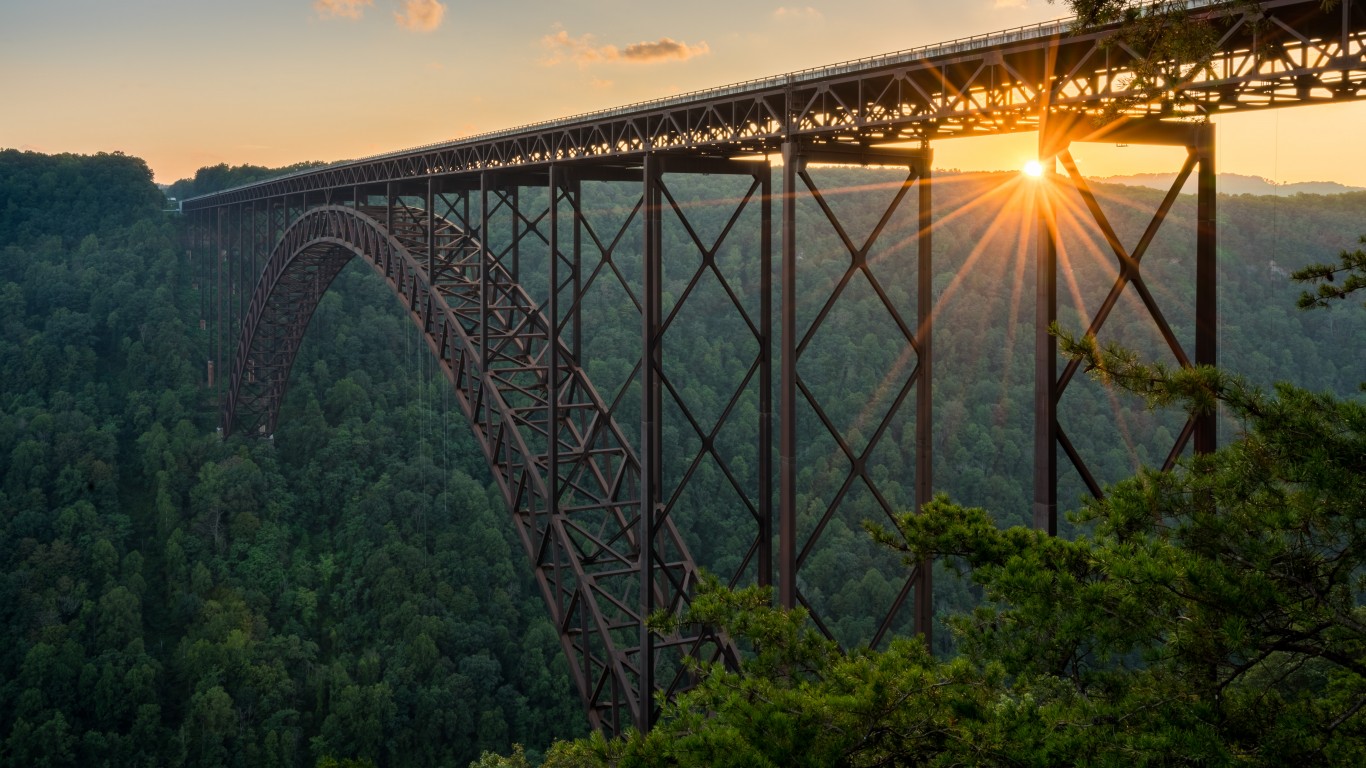
Source: BackyardProduction / Getty Images
28. West Virginia
> Funded ratio: 71.9%
> Total pension shortfall: $5.1 billion (13th smallest)
> Gov’t workers as share of total workforce: 17.5% (6th highest)
> Avg. annual payout per public retiree: $16,441 (the lowest)
Source: Davel5957 / Getty Images
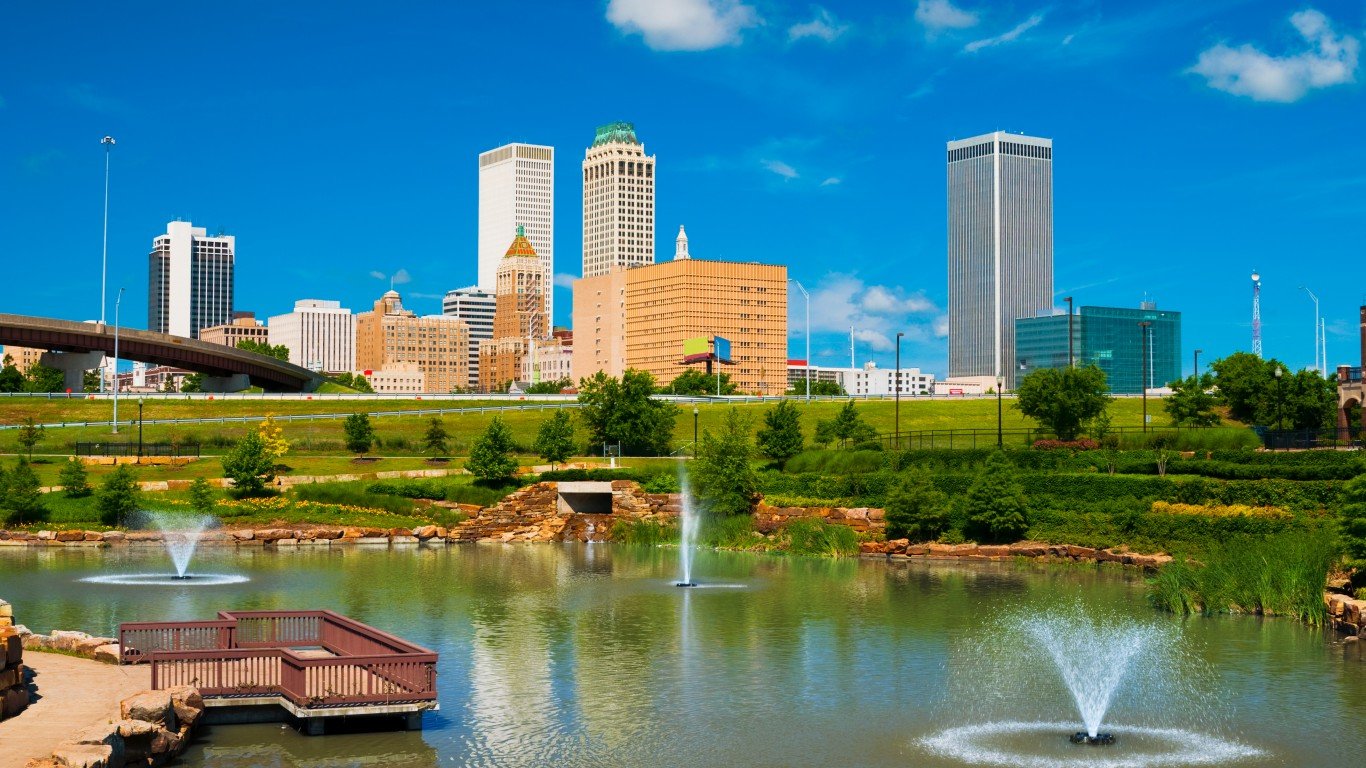
27. Oklahoma
> Funded ratio: 71.9%
> Total pension shortfall: $10.9 billion (20th smallest)
> Gov’t workers as share of total workforce: 18.1% (5th highest)
> Avg. annual payout per public retiree: $20,054 (16th lowest)
[in-text-ad-2]

Source: Srongkrod / Getty Images
26. Montana
> Funded ratio: 71.2%
> Total pension shortfall: $4.1 billion (11th smallest)
> Gov’t workers as share of total workforce: 16.5% (8th highest)
> Avg. annual payout per public retiree: $18,322 (9th lowest)

Source: stellalevi / Getty Images
25. California
> Funded ratio: 69.5%
> Total pension shortfall: $168.0 billion (2nd largest)
> Gov’t workers as share of total workforce: 13.7% (23rd lowest)
> Avg. annual payout per public retiree: $37,618 (2nd highest)
[in-text-ad]

Source: SeanPavonePhoto / Getty Images
24. Alabama
> Funded ratio: 67.2%
> Total pension shortfall: $16.8 billion (23rd largest)
> Gov’t workers as share of total workforce: 16.5% (10th highest)
> Avg. annual payout per public retiree: $23,795 (21st highest)

Source: rruntsch / Getty Images
23. North Dakota
> Funded ratio: 65.9%
> Total pension shortfall: $2.4 billion (7th smallest)
> Gov’t workers as share of total workforce: 17.0% (7th highest)
> Avg. annual payout per public retiree: $18,014 (7th lowest)

Source: Dean_Fikar / Getty Images
22. New Mexico
> Funded ratio: 65.4%
> Total pension shortfall: $13.5 billion (24th smallest)
> Gov’t workers as share of total workforce: 18.9% (3rd highest)
> Avg. annual payout per public retiree: $25,174 (16th highest)
[in-text-ad-2]
Source: sframephoto / Getty Images
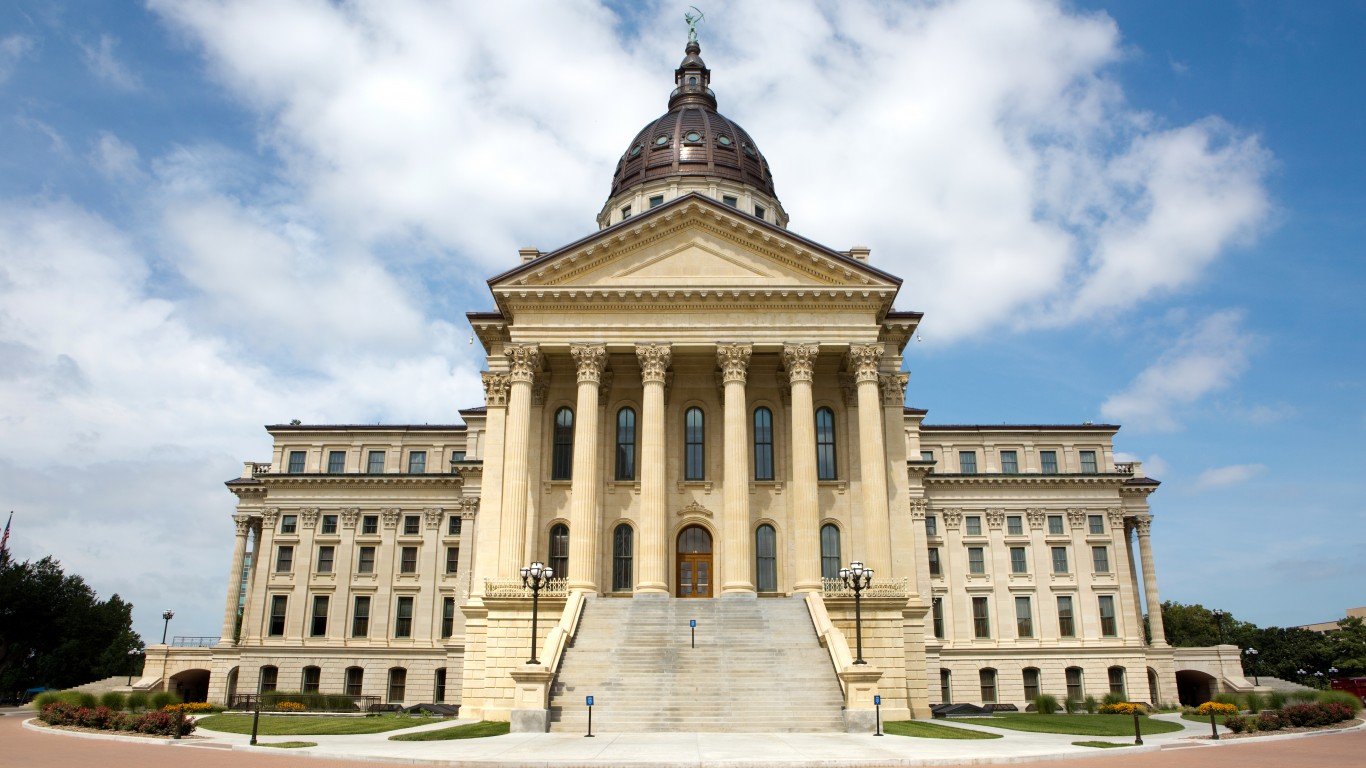
21. Kansas
> Funded ratio: 65.1%
> Total pension shortfall: $9.2 billion (19th smallest)
> Gov’t workers as share of total workforce: 16.5% (9th highest)
> Avg. annual payout per public retiree: $16,958 (4th lowest)

Source: Thinkstock
20. Maryland
> Funded ratio: 64.9%
> Total pension shortfall: $24.7 billion (17th largest)
> Gov’t workers as share of total workforce: 13.1% (15th lowest)
> Avg. annual payout per public retiree: $24,771 (18th highest)
[in-text-ad]

Source: Sean Pavone / iStock
19. Vermont
> Funded ratio: 64.3%
> Total pension shortfall: $2.1 billion (6th smallest)
> Gov’t workers as share of total workforce: 15.5% (13th highest)
> Avg. annual payout per public retiree: $16,847 (3rd lowest)
Source: benkrut / Getty Images
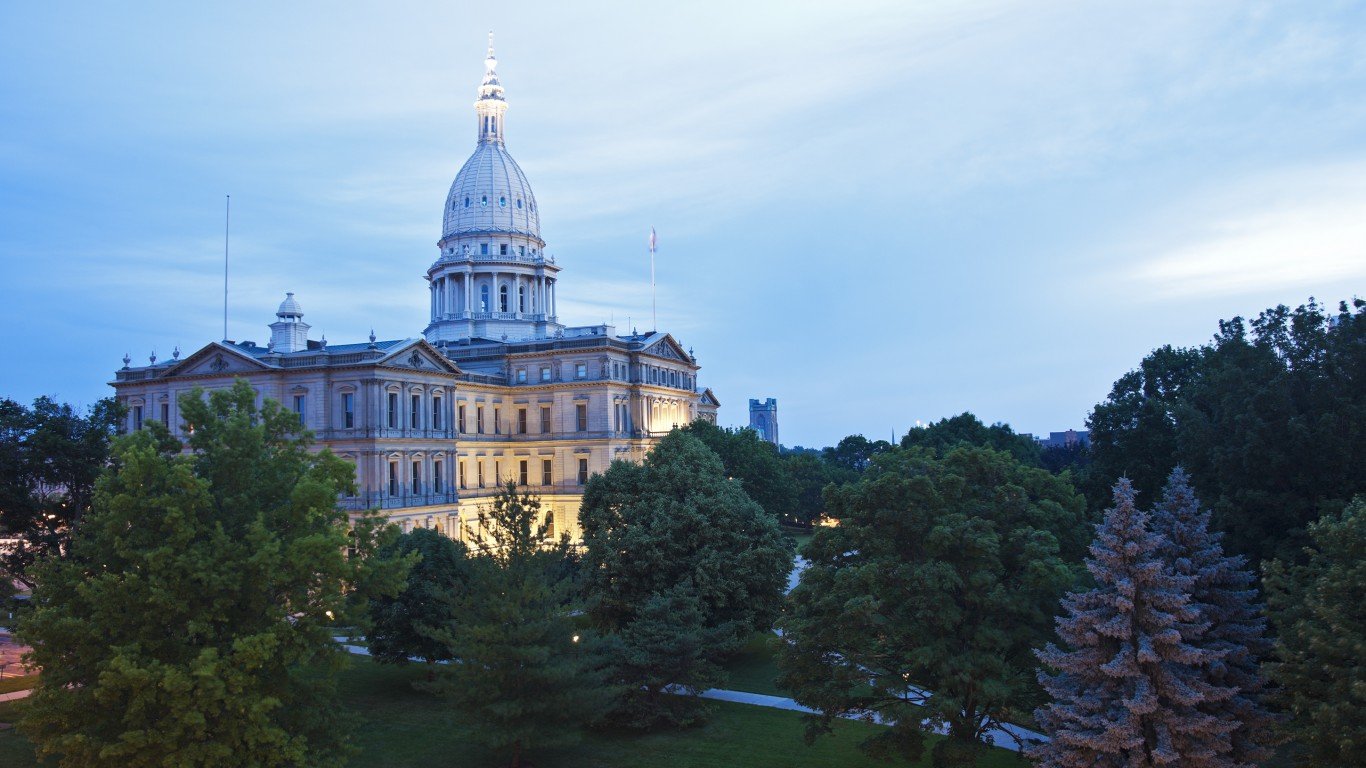
18. Michigan
> Funded ratio: 64.0%
> Total pension shortfall: $31.6 billion (13th largest)
> Gov’t workers as share of total workforce: 12.6% (9th lowest)
> Avg. annual payout per public retiree: $23,375 (24th highest)

Source: f11photo / Getty Images
17. Indiana
> Funded ratio: 63.0%
> Total pension shortfall: $17.7 billion (22nd largest)
> Gov’t workers as share of total workforce: 12.5% (8th lowest)
> Avg. annual payout per public retiree: $16,828 (2nd lowest)
[in-text-ad-2]

Source: troutnut / Getty Images
16. Alaska
> Funded ratio: 62.7%
> Total pension shortfall: $7.9 billion (18th smallest)
> Gov’t workers as share of total workforce: 20.1% (2nd highest)
> Avg. annual payout per public retiree: $25,481 (15th highest)

Source: tonda / Getty Images
15. Arizona
> Funded ratio: 60.4%
> Total pension shortfall: $26.7 billion (14th largest)
> Gov’t workers as share of total workforce: 12.9% (14th lowest)
> Avg. annual payout per public retiree: $23,768 (22nd highest)
[in-text-ad]

Source: Robert John Photography / Getty Images
14. Louisiana
> Funded ratio: 59.7%
> Total pension shortfall: $20.7 billion (19th largest)
> Gov’t workers as share of total workforce: 15.0% (19th highest)
> Avg. annual payout per public retiree: $22,395 (21st lowest)
 24/7 Wall St.
Source: SeanPavonePhoto / Getty Images
13. New Hampshire
> Funded ratio: 58.2%
> Total pension shortfall: $5.4 billion (15th smallest)
> Gov’t workers as share of total workforce: 12.2% (6th lowest)
> Avg. annual payout per public retiree: $20,530 (17th lowest)

Source: Sean Pavone / Getty Images
12. Massachusetts
> Funded ratio: 57.6%
> Total pension shortfall: $38.5 billion (10th largest)
> Gov’t workers as share of total workforce: 11.3% (4th lowest)
> Avg. annual payout per public retiree: $27,894 (11th highest)
[in-text-ad-2]

Source: SeanPavonePhoto / Getty Images
11. Mississippi
> Funded ratio: 57.5%
> Total pension shortfall: $18.1 billion (21st largest)
> Gov’t workers as share of total workforce: 18.9% (4th highest)
> Avg. annual payout per public retiree: $23,808 (20th highest)

Source: Thinkstock
10. South Carolina
> Funded ratio: 53.8%
> Total pension shortfall: $24.1 billion (18th largest)
> Gov’t workers as share of total workforce: 15.9% (11th highest)
> Avg. annual payout per public retiree: $19,979 (14th lowest)
[in-text-ad]

Source: SeanPavonePhoto / Getty Images
9. Rhode Island
> Funded ratio: 53.7%
> Total pension shortfall: $5.1 billion (14th smallest)
> Gov’t workers as share of total workforce: 10.1% (the lowest)
> Avg. annual payout per public retiree: $34,222 (6th highest)
Source: NicholasBPhotography / iStock
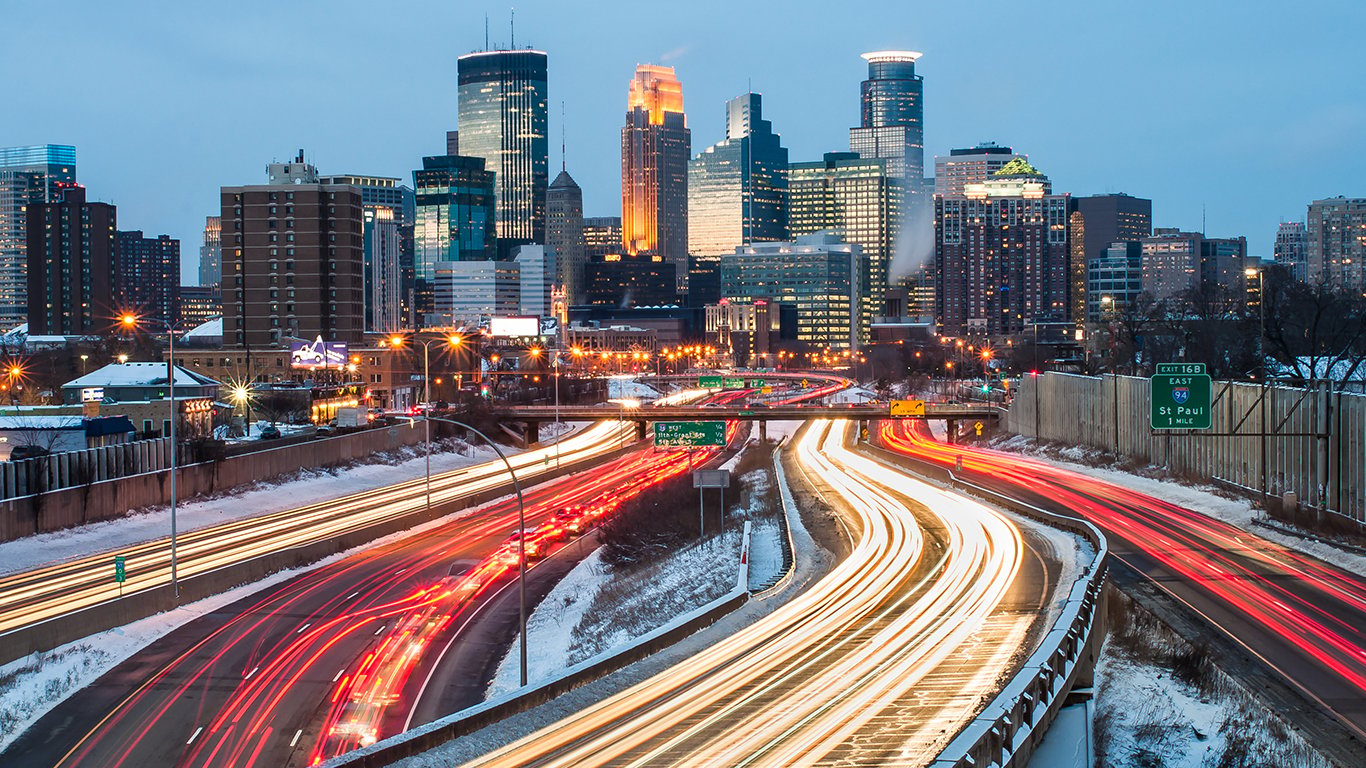
8. Minnesota
> Funded ratio: 53.2%
> Total pension shortfall: $50.9 billion (7th largest)
> Gov’t workers as share of total workforce: 13.4% (19th lowest)
> Avg. annual payout per public retiree: $21,131 (18th lowest)

Source: Thinkstock
7. Pennsylvania
> Funded ratio: 52.6%
> Total pension shortfall: $68.8 billion (4th largest)
> Gov’t workers as share of total workforce: 10.2% (2nd lowest)
> Avg. annual payout per public retiree: $26,056 (13th highest)
[in-text-ad-2]

Source: Thinkstock
6. Hawaii
> Funded ratio: 51.3%
> Total pension shortfall: $13.4 billion (22nd smallest)
> Gov’t workers as share of total workforce: 14.1% (25th highest)
> Avg. annual payout per public retiree: $23,349 (25th highest)

Source: f11photo / Getty Images
5. Colorado
> Funded ratio: 46.0%
> Total pension shortfall: $50.8 billion (8th largest)
> Gov’t workers as share of total workforce: 14.4% (23rd highest)
> Avg. annual payout per public retiree: $35,512 (4th highest)
[in-text-ad]

Source: DenisTangneyJr / Getty Images
4. Connecticut
> Funded ratio: 41.4%
> Total pension shortfall: $37.5 billion (11th largest)
> Gov’t workers as share of total workforce: 12.8% (12th lowest)
> Avg. annual payout per public retiree: $37,934 (the highest)
 24/7 Wall St.
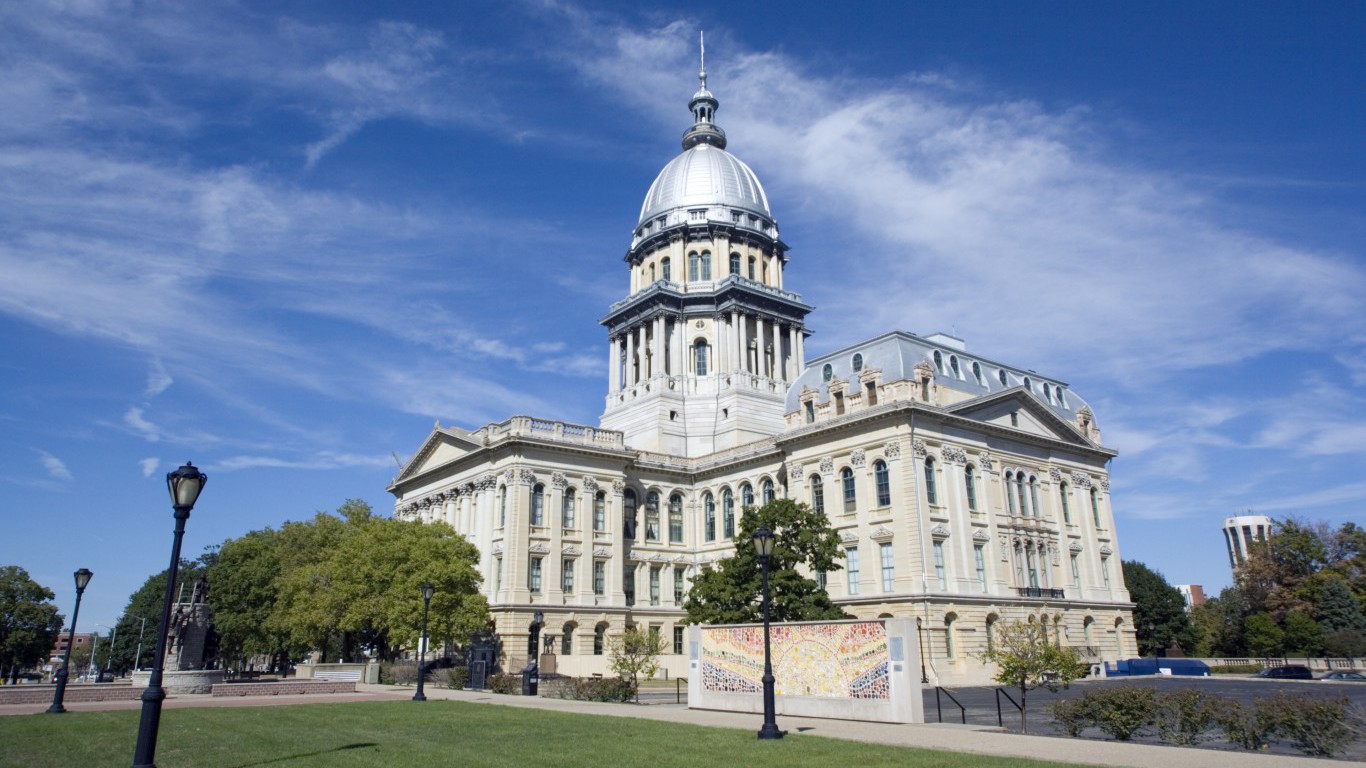
Source: Thinkstock
3. Illinois
> Funded ratio: 35.6%
> Total pension shortfall: $141.2 billion (3rd largest)
> Gov’t workers as share of total workforce: 12.4% (7th lowest)
> Avg. annual payout per public retiree: $35,209 (5th highest)

Source: alexeys / Getty Images
2. Kentucky
> Funded ratio: 31.4%
> Total pension shortfall: $43.4 billion (9th largest)
> Gov’t workers as share of total workforce: 14.5% (22nd highest)
> Avg. annual payout per public retiree: $24,431 (19th highest)
[in-text-ad-2]

Source: SeanPavonePhoto / Getty Images
1. New Jersey
> Funded ratio: 30.9%
> Total pension shortfall: $168.2 billion (the largest)
> Gov’t workers as share of total workforce: 13.7% (22nd lowest)
> Avg. annual payout per public retiree: $31,474 (10th highest)
Detailed Findings
In recent years, investment returns that fell short of state assumptions have significantly contributed to the national aggregate pension debt. In 2016, the typical state pension plan yielded a 1.0% return on investment, far below the median investment return assumption of 7.5% for public pension funds and the worst performance since the end of the Great Recession in 2009. The investment shortfall was largely due to increased exposure to risk and market volatility and accounted for an aggregate increase of $146 billion to the total state funding gap.
One factor that can contribute to increased pension obligations is demographic change. As the U.S. population ages and more public employees enter retirement, there are fewer workers per retiree to support pension plan payments. States that do not accurately account for the rising old-age dependency ratio in their benefits schemes may face increased pension debt and risk having to raise employee contribution rates or reduce other government services in order to fill the shortfall.
Methodology
To rank the severity of each state’s pension crisis, 24/7 Wall St. reviewed the average pension funding ratio — the market value of a pension fund as a share of the total benefits owed to current or retired public employees — for all 50 states as of 2016 with data from nongovernmental organization The Pew Charitable Trusts. Data on the total pension shortfall also came from Pew and is for 2016. Data on the average annual benefits payout per public retiree came from the research nonprofit National Institute on Retirement Security and are for 2016. Data on the share of the workforce employed in state and local government is from the Bureau of Labor Statistics and are for 2017.
Sponsored: Want to Retire Early? Here’s a Great First Step
Want retirement to come a few years earlier than you’d planned? Or are you ready to retire now, but want an extra set of eyes on your finances?
Now you can speak with up to 3 financial experts in your area for FREE. By simply clicking here you can begin to match with financial professionals who can help you build your plan to retire early. And the best part? The first conversation with them is free.
Click here to match with up to 3 financial pros who would be excited to help you make financial decisions.
Thank you for reading! Have some feedback for us?
Contact the 24/7 Wall St. editorial team.
Editors' Picks

