
Based on the latest data released in September by the U.S. Census Bureau, poverty is on the decline in the United States. In 2017, an estimated 13.4% of Americans lived below the poverty line, down from 14.0% in 2016.
While the improvement is good news, there are many parts of the country where residents are much more likely to struggle with poverty. The poverty threshold is set by the federal government and depends on the size of the family. In the 48 contiguous states, the federal poverty level for a family of four is an annual income of $28,100.
24/7 Wall St. reviewed metro area level poverty data from the U.S. Census Bureau to identify the cities with the highest poverty rates. In 38 of the 382 metro areas reviewed at least one in five residents live in poverty. As would be expected, the majority of these metro areas are in states where low incomes are common. Of the 38 metro areas, 17 are in Texas, Georgia, Louisiana, or West Virginia.
The 38 metropolitan areas with at least a 20% poverty rate also face other issues commonly associated with poverty. In many, unemployment is relatively high, educational attainment is low, and a large share of available jobs are in low-paying sectors.
Click here to see the cities with the highest poverty rates.
Click here to see our detailed findings and methodology.
Source: Tim Kiser (w:User:Malepheasant) / Wikimedia Commons
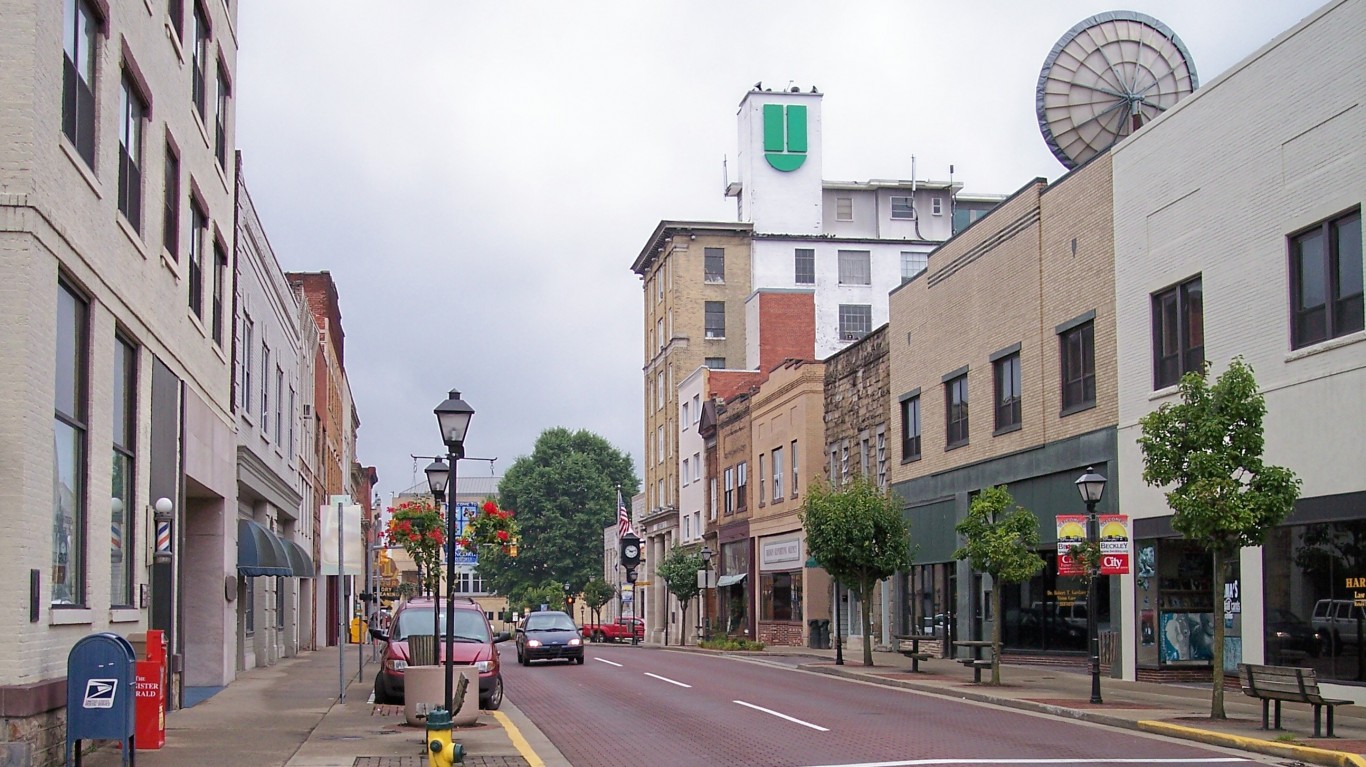
38. Beckley, WV
> Poverty rate: 20.0%
> 2017 Unemployment: 5.7% (highest 25%)
> Households receiving SNAP benefits: 19.7% (highest 10%)
> Median household income: $42,493 (bottom 10%)
[in-text-ad]

Source: Rex_Wholster / Getty Images
37. Alexandria, LA
> Poverty rate: 20.1%
> 2017 Unemployment: 5.7% (highest 25%)
> Households receiving SNAP benefits: 17.1% (highest 25%)
> Median household income: $40,585 (bottom 10%)
 24/7 Wall St.
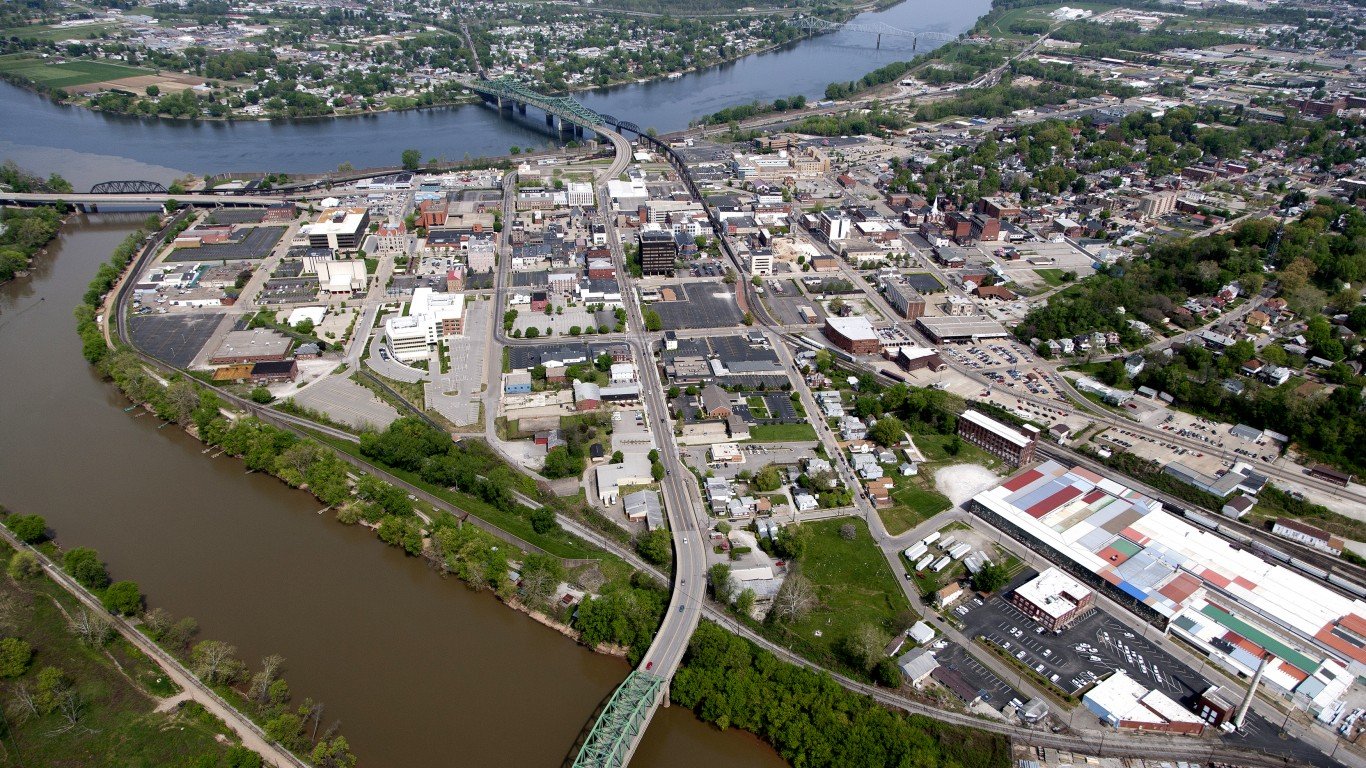
Source: 6381380 / Getty Images
36. Parkersburg-Vienna, WV
> Poverty rate: 20.1%
> 2017 Unemployment: 5.6% (highest 25%)
> Households receiving SNAP benefits: 15.9% (highest 25%)
> Median household income: $43,648 (bottom 10%)
Source: tomorrowspix / Getty Images
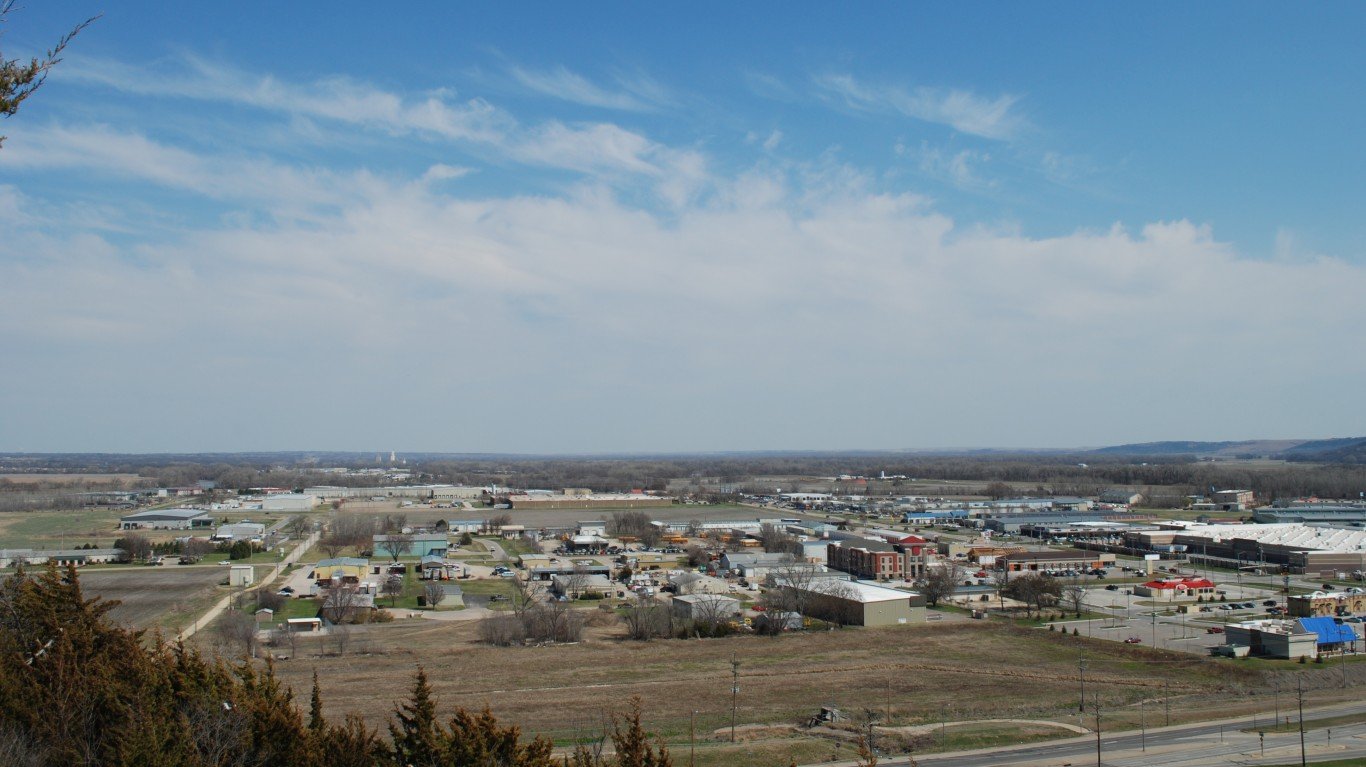
35. Manhattan, KS
> Poverty rate: 20.1%
> 2017 Unemployment: 3.0% (lowest 25%)
> Households receiving SNAP benefits: 4.8% (lowest 10%)
> Median household income: $50,698
[in-text-ad-2]

Source: Warren-Pender / Getty Images
34. Sebring, FL
> Poverty rate: 20.2%
> 2017 Unemployment: 5.6% (highest 25%)
> Households receiving SNAP benefits: 15.9% (highest 25%)
> Median household income: $35,543 (bottom 10%)

Source: lydiabilby / Getty Images
33. Muncie, IN
> Poverty rate: 20.4%
> 2017 Unemployment: 4.2%
> Households receiving SNAP benefits: 13.5%
> Median household income: $41,255 (bottom 10%)
[in-text-ad]

Source: aimintang / Getty Images
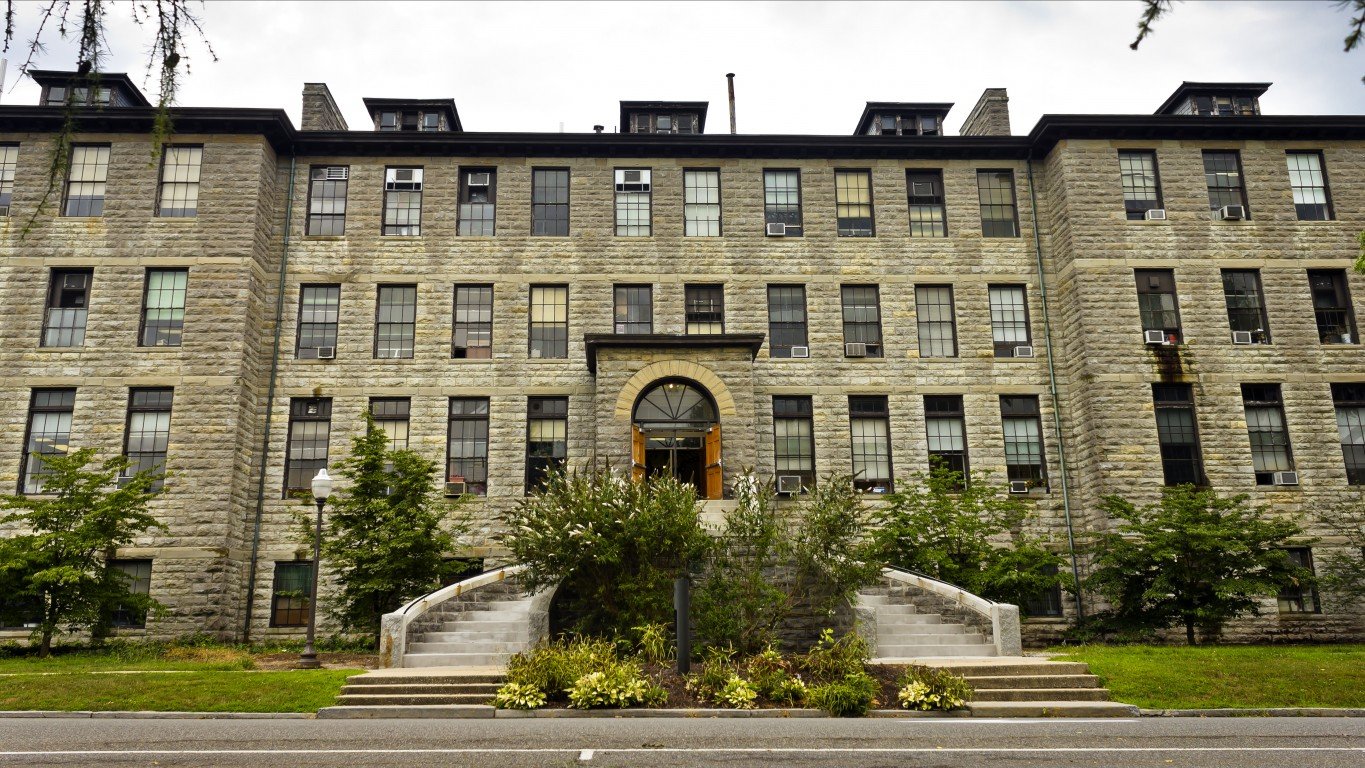
32. Ithaca, NY
> Poverty rate: 20.5%
> 2017 Unemployment: 4.4%
> Households receiving SNAP benefits: 10.1%
> Median household income: $56,672
Source: DenisTangneyJr / Getty Images
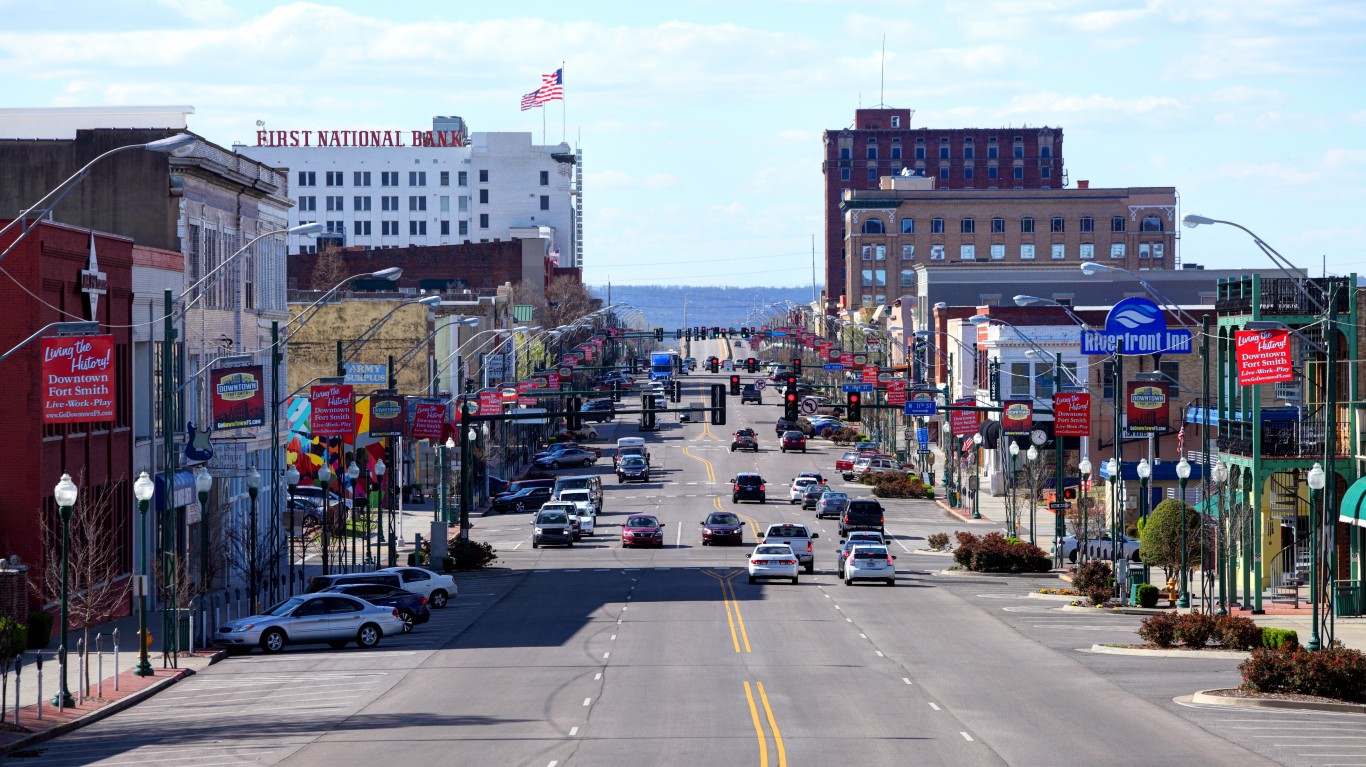
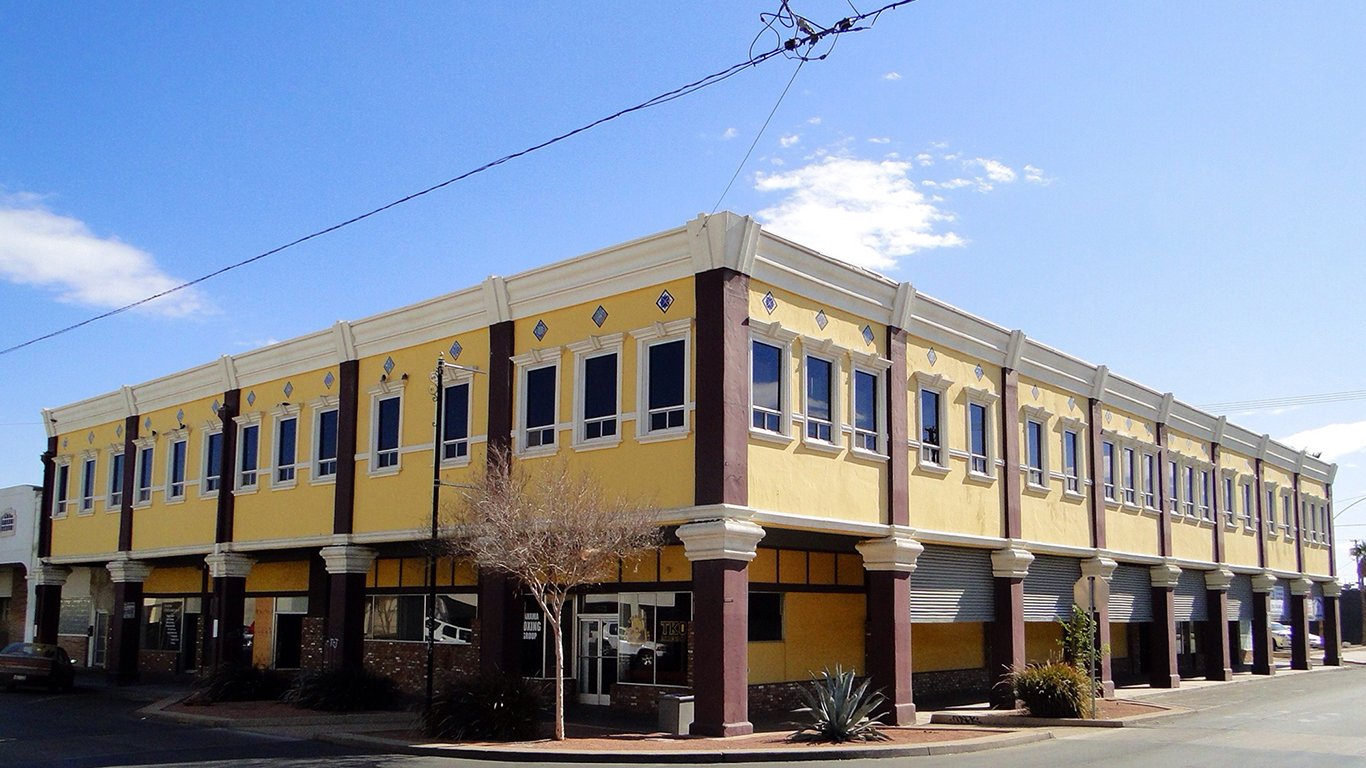
31. Fort Smith, AR-OK
> Poverty rate: 20.6%
> 2017 Unemployment: 4.2%
> Households receiving SNAP benefits: 14.8%
> Median household income: $40,282 (bottom 10%)
Source: Public Domain / Wikimedia Commons
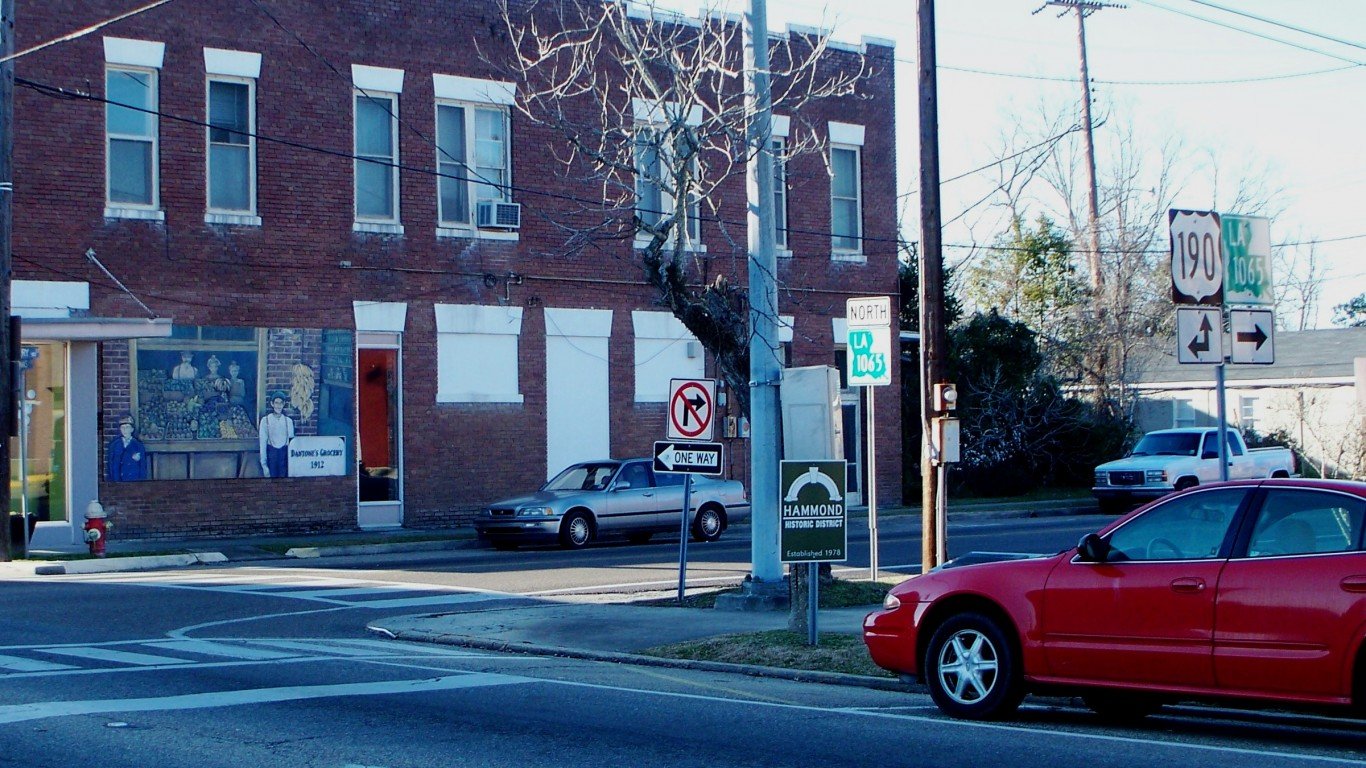
30. Hammond, LA
> Poverty rate: 20.7%
> 2017 Unemployment: 5.7% (highest 25%)
> Households receiving SNAP benefits: 22.7% (highest 10%)
> Median household income: $44,861 (bottom 25%)
[in-text-ad-2]

Source: Geoff Eccles / Getty Images
29. Battle Creek, MI
> Poverty rate: 20.7%
> 2017 Unemployment: 5.0%
> Households receiving SNAP benefits: 18.4% (highest 10%)
> Median household income: $45,386 (bottom 25%)
Source: Cbl62 / Wikimedia Commons
28. El Centro, CA
> Poverty rate: 20.7%
> 2017 Unemployment: 19.1% (highest 10%)
> Households receiving SNAP benefits: 22.5% (highest 10%)
> Median household income: $47,211 (bottom 25%)
[in-text-ad]
Source: User Youngamerican on en.wikipedia / Wikimedia Commons
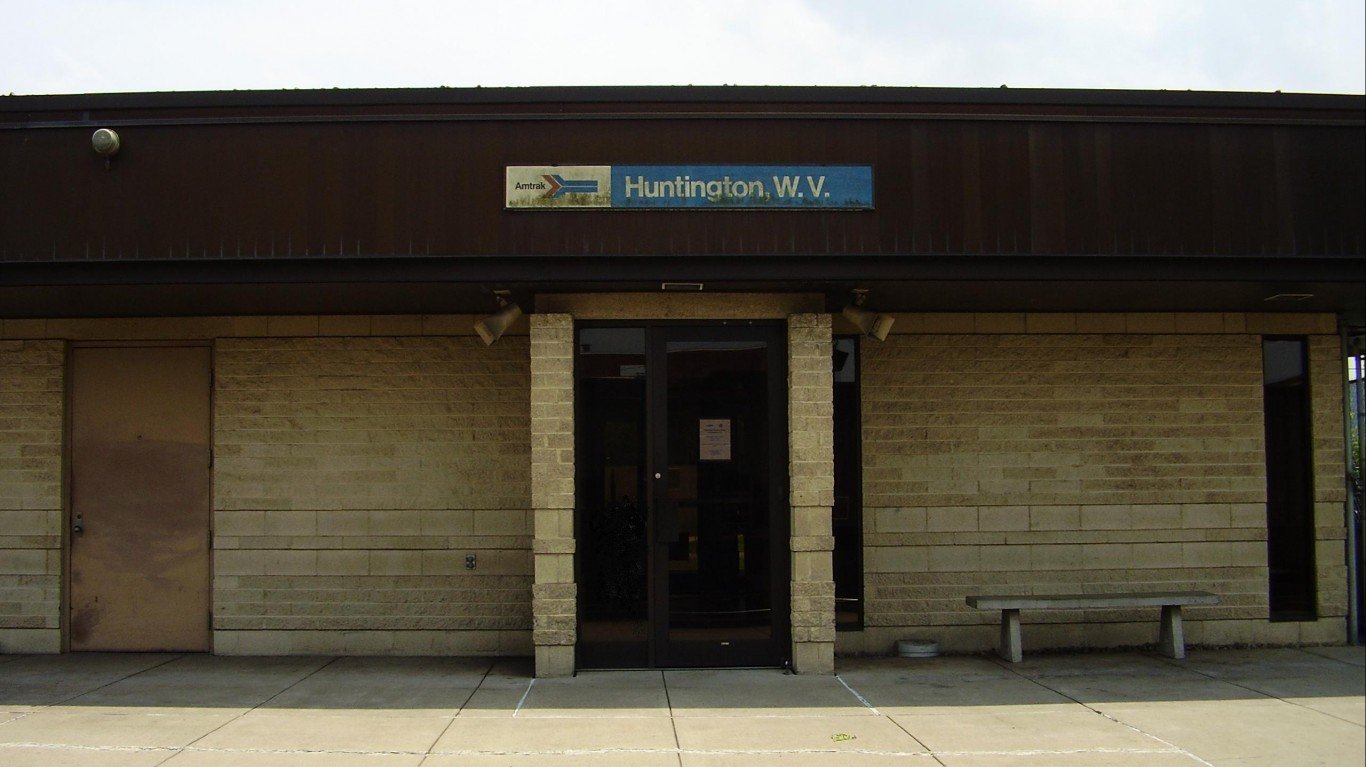
27. Huntington-Ashland, WV-KY-OH
> Poverty rate: 20.9%
> 2017 Unemployment: 5.6% (highest 25%)
> Households receiving SNAP benefits: 19.8% (highest 10%)
> Median household income: $40,646 (bottom 10%)

Source: SeanPavonePhoto / Getty Images
26. Athens-Clarke County, GA
> Poverty rate: 21.0%
> 2017 Unemployment: 4.4%
> Households receiving SNAP benefits: 10.5%
> Median household income: $46,521 (bottom 25%)
Source: DenisTangneyJr / Getty Images
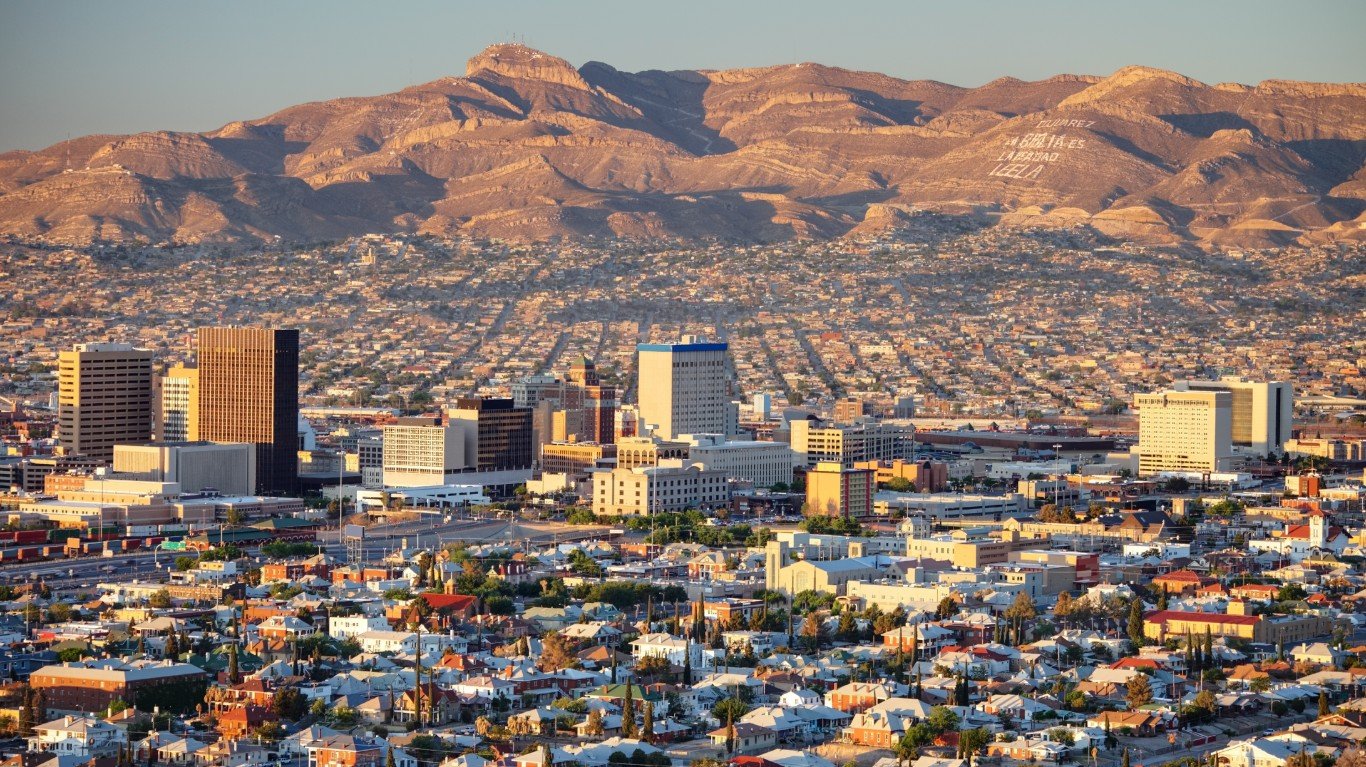
25. El Paso, TX
> Poverty rate: 21.1%
> 2017 Unemployment: 4.6%
> Households receiving SNAP benefits: 19.3% (highest 10%)
> Median household income: $44,416 (bottom 10%)
[in-text-ad-2]

Source: DenisTangneyJr / Getty Images
24. Fresno, CA
> Poverty rate: 21.1%
> 2017 Unemployment: 8.5% (highest 10%)
> Households receiving SNAP benefits: 20.2% (highest 10%)
> Median household income: $51,800

Source: oddharmonic / Flickr
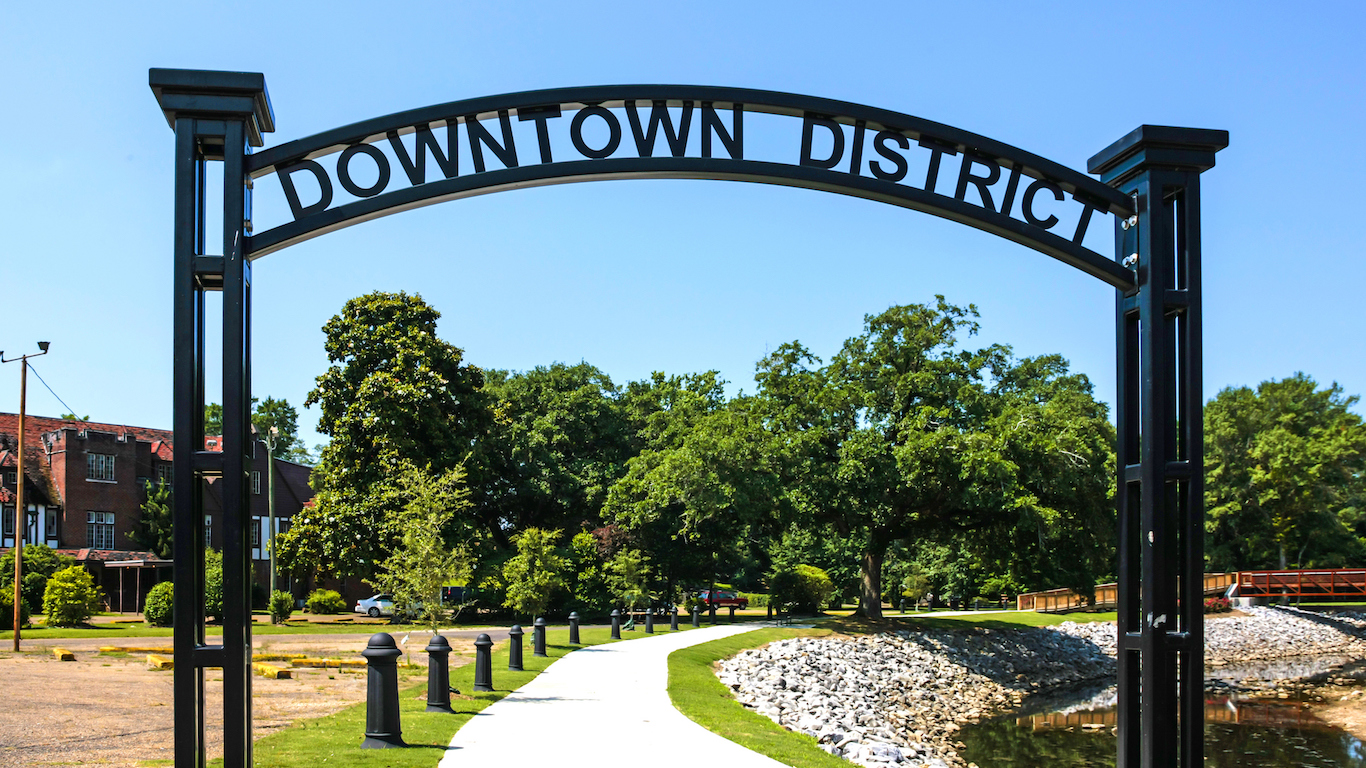
23. Goldsboro, NC
> Poverty rate: 21.2%
> 2017 Unemployment: 5.1%
> Households receiving SNAP benefits: 19.0% (highest 10%)
> Median household income: $44,347 (bottom 10%)
[in-text-ad]

Source: Sean Pavone / Getty Images
22. Gainesville, FL
> Poverty rate: 21.2%
> 2017 Unemployment: 3.7%
> Households receiving SNAP benefits: 10.6%
> Median household income: $44,548 (bottom 10%)
Source: BSPollard / Getty Images
21. Blacksburg-Christiansburg-Radford, VA
> Poverty rate: 21.2%
> 2017 Unemployment: 4.3%
> Households receiving SNAP benefits: 7.3% (lowest 25%)
> Median household income: $52,075

Source: DenisTangneyJr / Getty Images
20. Bakersfield, CA
> Poverty rate: 21.4%
> 2017 Unemployment: 9.2% (highest 10%)
> Households receiving SNAP benefits: 16.0% (highest 25%)
> Median household income: $49,854
[in-text-ad-2]
Source: Thinkstock
19. Hattiesburg, MS
> Poverty rate: 21.6%
> 2017 Unemployment: 4.5%
> Households receiving SNAP benefits: 15.6% (highest 25%)
> Median household income: $46,167 (bottom 25%)

Source: SeanPavonePhoto / Getty Images
18. Macon-Bibb County, GA
> Poverty rate: 21.9%
> 2017 Unemployment: 5.2% (highest 25%)
> Households receiving SNAP benefits: 15.7% (highest 25%)
> Median household income: $41,303 (bottom 10%)
[in-text-ad]
17. Greenville, NC
> Poverty rate: 22.0%
> 2017 Unemployment: 4.9%
> Households receiving SNAP benefits: 11.2%
> Median household income: $45,849 (bottom 25%)
 24/7 Wall St.
Source: SeanPavonePhoto / Getty Images
16. Columbus, GA-AL
> Poverty rate: 22.1%
> 2017 Unemployment: 5.5% (highest 25%)
> Households receiving SNAP benefits: 17.6% (highest 25%)
> Median household income: $43,051 (bottom 10%)

Source: Explorecdale / Wikimedia Commons
15. Carbondale-Marion, IL
> Poverty rate: 22.6%
> 2017 Unemployment: 4.8%
> Households receiving SNAP benefits: 16.9% (highest 25%)
> Median household income: $43,892 (bottom 10%)
[in-text-ad-2]

Source: Jcarrello / Wikimedia Commons
14. Madera, CA
> Poverty rate: 22.6%
> 2017 Unemployment: 8.1% (highest 10%)
> Households receiving SNAP benefits: 17.6% (highest 25%)
> Median household income: $51,283

Source: DenisTangneyJr / Getty Images
13. Bloomington, IN
> Poverty rate: 22.7%
> 2017 Unemployment: 3.7%
> Households receiving SNAP benefits: 8.4% (lowest 25%)
> Median household income: $49,043
[in-text-ad]

Source: diegograndi / Getty Images
12. Merced, CA
> Poverty rate: 23.8%
> 2017 Unemployment: 9.3% (highest 10%)
> Households receiving SNAP benefits: 19.9% (highest 10%)
> Median household income: $47,735 (bottom 25%)

Source: SeanPavonePhoto / Getty Images
11. Shreveport-Bossier City, LA
> Poverty rate: 23.9%
> 2017 Unemployment: 5.5% (highest 25%)
> Households receiving SNAP benefits: 16.4% (highest 25%)
> Median household income: $38,627 (bottom 10%)
Source: Thinkstock
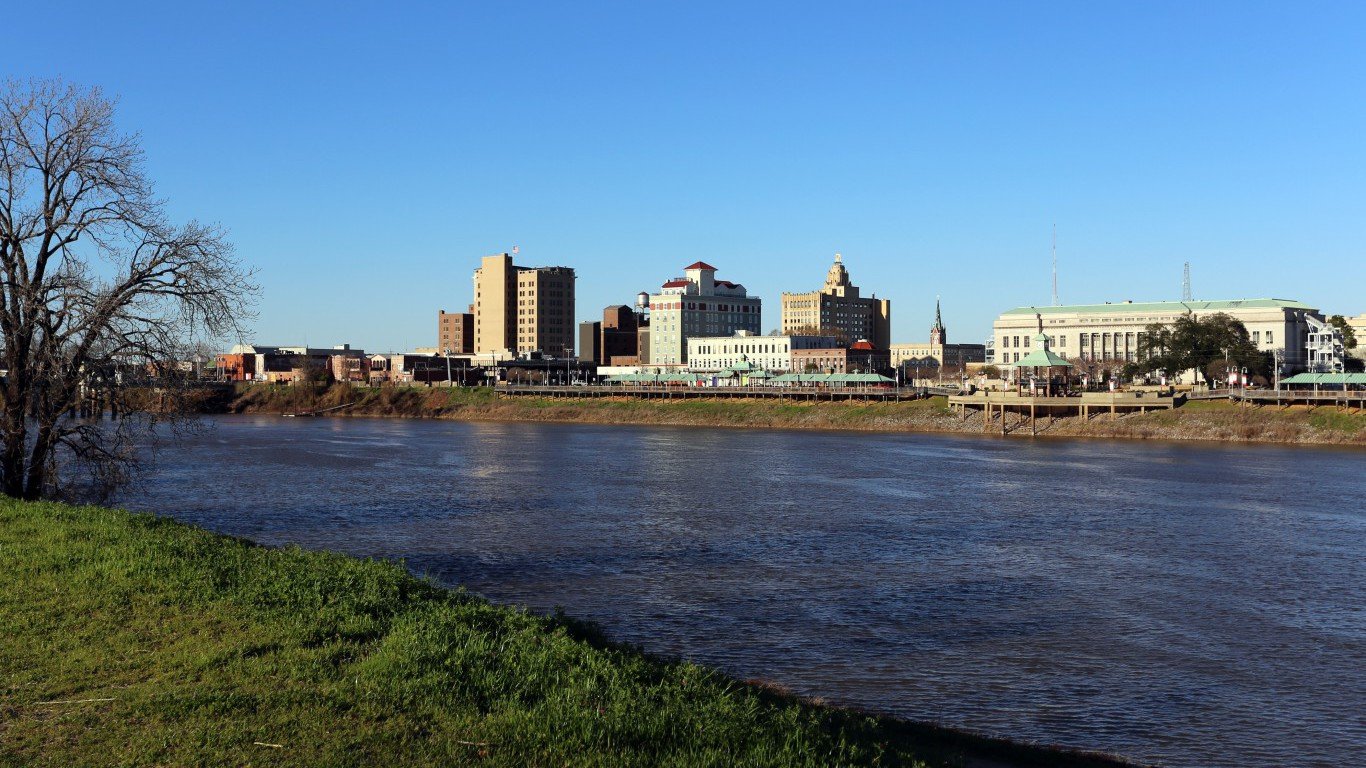
10. Monroe, LA
> Poverty rate: 24.3%
> 2017 Unemployment: 5.3% (highest 25%)
> Households receiving SNAP benefits: 15.8% (highest 25%)
> Median household income: $39,610 (bottom 10%)
[in-text-ad-2]

Source: TriciaDaniel / Getty Images
9. College Station-Bryan, TX
> Poverty rate: 24.6%
> 2017 Unemployment: 3.2% (lowest 25%)
> Households receiving SNAP benefits: 11.5%
> Median household income: $45,515 (bottom 25%)

Source: Esme7 / Getty Images
8. Visalia-Porterville, CA
> Poverty rate: 24.6%
> 2017 Unemployment: 10.4% (highest 10%)
> Households receiving SNAP benefits: 22.7% (highest 10%)
> Median household income: $46,266 (bottom 25%)
[in-text-ad]

Source: sshepard / Getty Images
7. Albany, GA
> Poverty rate: 24.7%
> 2017 Unemployment: 5.5% (highest 25%)
> Households receiving SNAP benefits: 24.1% (highest 10%)
> Median household income: $43,614 (bottom 10%)

Source: teofilo / Flickr
6. Farmington, NM
> Poverty rate: 24.8%
> 2017 Unemployment: 7.2% (highest 10%)
> Households receiving SNAP benefits: 21.2% (highest 10%)
> Median household income: $45,942 (bottom 25%)

Source: talentbender / Thinkstock
5. Valdosta, GA
> Poverty rate: 26.0%
> 2017 Unemployment: 4.7%
> Households receiving SNAP benefits: 18.8% (highest 10%)
> Median household income: $40,391 (bottom 10%)
[in-text-ad-2]
Source: DavieJones13 / Getty Images
4. Brownsville-Harlingen, TX
> Poverty rate: 27.9%
> 2017 Unemployment: 6.9% (highest 10%)
> Households receiving SNAP benefits: 22.8% (highest 10%)
> Median household income: $36,975 (bottom 10%)

Source: artiste9999 / Getty Images
3. Laredo, TX
> Poverty rate: 28.0%
> 2017 Unemployment: 4.2%
> Households receiving SNAP benefits: 28.0% (highest 10%)
> Median household income: $43,408 (bottom 10%)
[in-text-ad]
Source: DenisTangneyJr / Getty Images
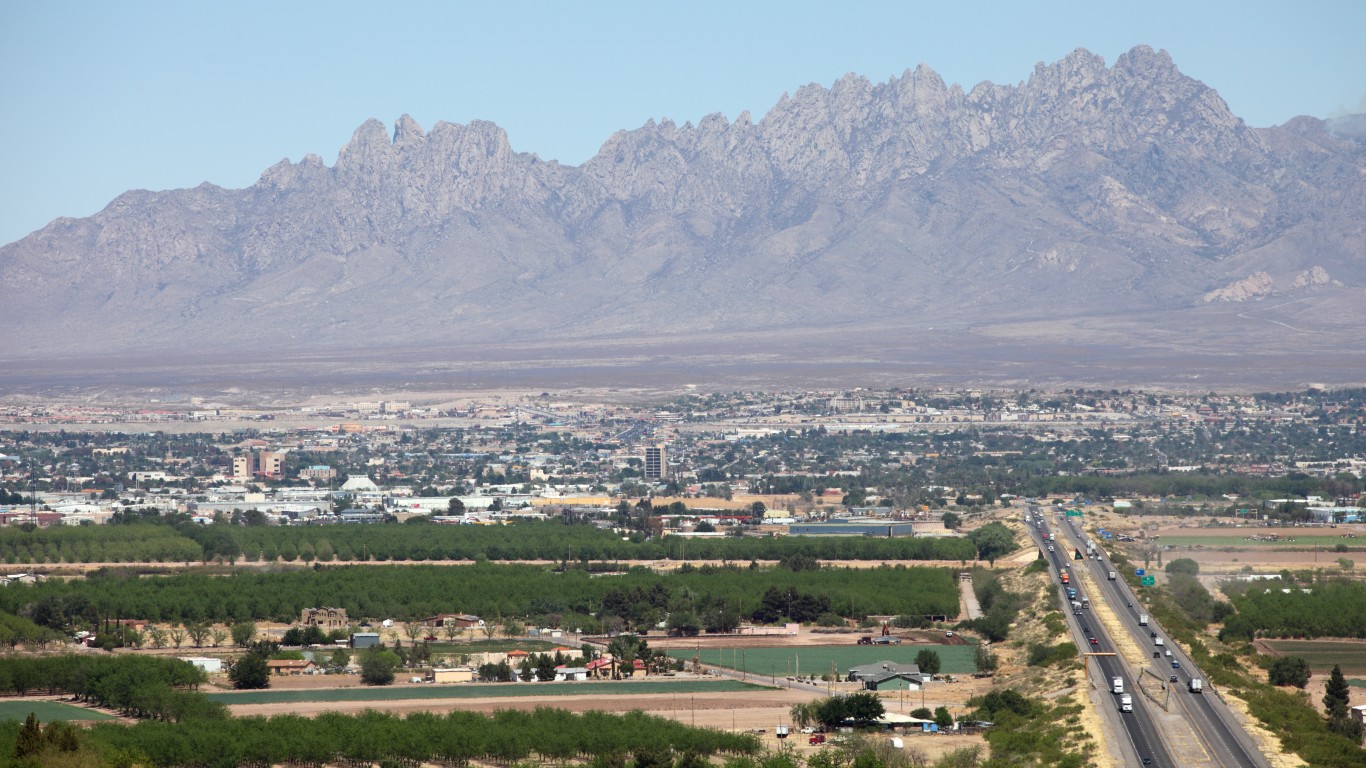
2. Las Cruces, NM
> Poverty rate: 28.1%
> 2017 Unemployment: 6.9% (highest 10%)
> Households receiving SNAP benefits: 26.4% (highest 10%)
> Median household income: $37,144 (bottom 10%)
 24/7 Wall St.
Source: tirc83 / Getty Images
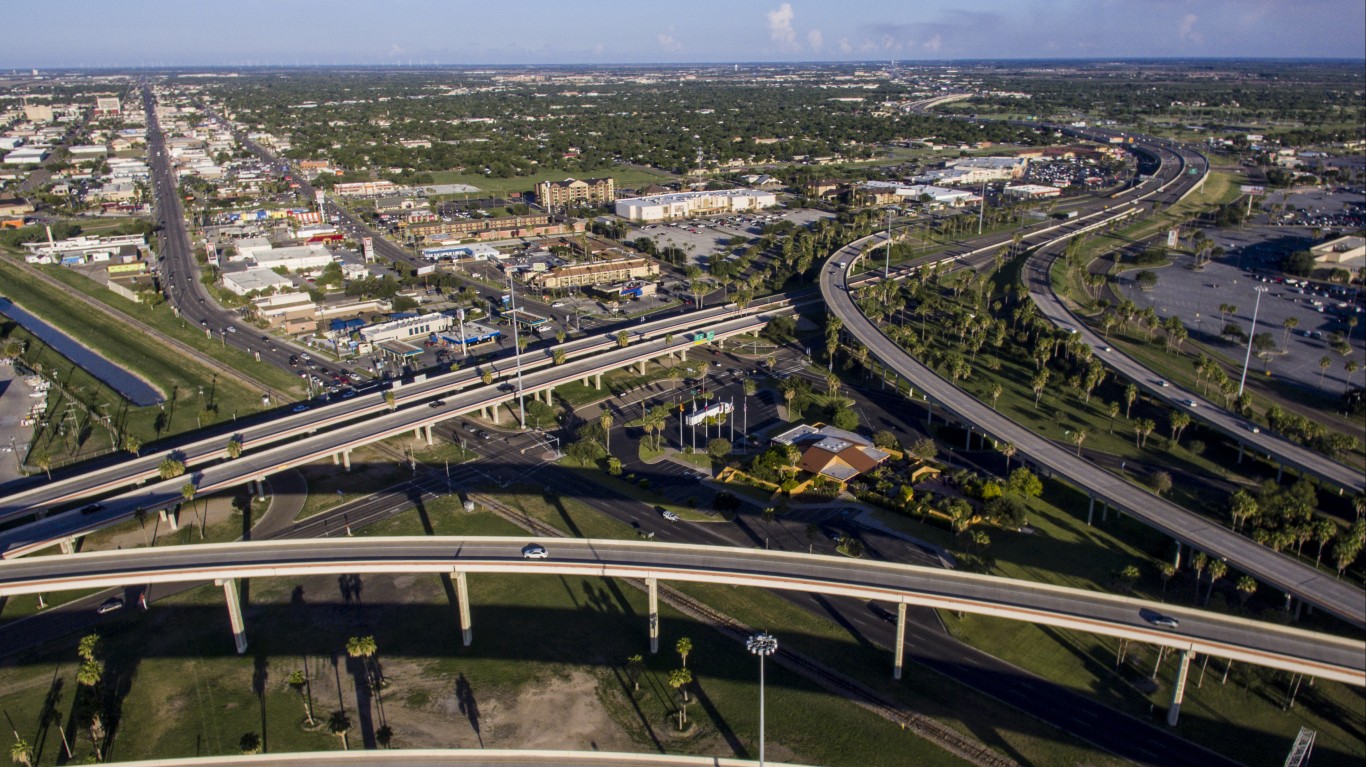
1. McAllen-Edinburg-Mission, TX
> Poverty rate: 30.0%
> 2017 Unemployment: 7.4% (highest 10%)
> Households receiving SNAP benefits: 30.5% (highest 10%)
> Median household income: $37,106 (bottom 10%)
Detailed Findings
Supplemental Nutrition Assistance Program (SNAP) benefits, sometimes referred to as food stamps, are intended to help the poorest Americans afford groceries. Not surprisingly, the U.S. cities with the highest poverty rates also tend to be home to a higher than typical share of residents who depend on SNAP. Of the 38 metro areas on this list, 30 have a higher SNAP recipiency rate than the comparable 11.7% national share. The three metro areas with the highest poverty rates — Laredo, Texas, Las Cruces, New Mexico, and McAllen, Texas — also have the highest SNAP recipiency rates, at 28.0%, 26.4%, and 30.5%, respectively.
The U.S. cities with the highest poverty rates also are home to larger than typical shares of households facing extreme poverty. In most of the country, an individual earning $12,140 or less a year is living on poverty level income. Nationwide, some 6.5% of households earn $10,000 or less a year. Nearly every city on this list is home to a larger share of households earning $10,000 or less
In many cities on this list, a stalled economy and lack of job opportunities likely contribute to the widespread poverty. In 28 of the 38 metro areas with the highest poverty rates, the annual unemployment rate is greater than or equal to the 2017 U.S. jobless rate of 4.4%. In El Centro, California, a metro area with a nation-leading 19.1% unemployment rate, 24.6% of the population lives below the poverty line, a higher poverty rate than in all but handful of U.S. metro areas.
Higher educational attainment rates often are indicative of areas where people are able to afford higher education. Of course, higher education also can be a means of escaping poverty and earning higher wages. All but seven of the 38 metropolitan areas with the highest poverty rates have adult college attainment rates below the national rate of 32%. In 15 of the 38 metropolitan areas on this list, less than 20% of adults have at least a bachelor’s degree.
To identify the cities with the highest poverty rates, 24/7 Wall St. reviewed recently released poverty rates data for 382 U.S. metro areas from the 2017 1-year American Community Survey. Only those areas with poverty rates of 20% or greater were included on this list. Poverty rates, as well as median household income, SNAP recipiency, and the share of households with annual incomes below $10,000 also came from the U.S. Census Bureau’s 2017 American Community Survey. Annual unemployment figures are for 2017 and came from the Bureau of Labor Statistics.
Take This Retirement Quiz To Get Matched With An Advisor Now (Sponsored)
Are you ready for retirement? Planning for retirement can be overwhelming, that’s why it could be a good idea to speak to a fiduciary financial advisor about your goals today.
Start by taking this retirement quiz right here from SmartAsset that will match you with up to 3 financial advisors that serve your area and beyond in 5 minutes. Smart Asset is now matching over 50,000 people a month.
Click here now to get started.
Thank you for reading! Have some feedback for us?
Contact the 24/7 Wall St. editorial team.
Editors' Picks

