
The U.S. economy was in better condition in 2018 than it has been in decades. The job market posted its 96th consecutive month of job growth in September, the longest job creation streak in U.S. history, and the unemployment rate fell to 3.7% — its lowest point in nearly 50 years.
As of October, the U.S. economy has added 1.9 million jobs this year. If the current rate of job growth continues through December, the year-over-year job growth in 2018 will be among the fastest of the last two decades.
Approximately 80% of U.S. metropolitan areas have posted positive job growth figures for the year. In several cities — largely midsize manufacturing and mining hubs in the Northeast and Midwest — job growth from January 2018 to October 2018 was more than triple the 1.4% national growth. Conversely, in 25 metro areas — many located in Louisiana, North Dakota, Ohio, and West Virginia — employment has fallen by more than 1.1% in 2018.
Nationwide, the sectors with the fastest job growth in 2018 were construction, mining and logging, leisure and hospitality, and professional and business services. Sectors with the slowest job growth included retail trade, financial activities, and information.
Population growth and a robust economy are two of the main factors that contribute to employment growth, but not necessarily to lower unemployment. Cities that added residents — often due to available job growth — generally saw the size of their labor force rise as well. The size of the civilian labor force grew in approximately 90% of cities with job growth in 2018.
To identify the cities adding (and losing) the most jobs in 2018, 24/7 Wall st. reviewed monthly metro area employment figures from the Bureau of Labor Statistics. We calculated the percentage change from January 2018 through October 2018, the latest month for which employment data at the metro area level is available. All figures are seasonally adjusted. January and October unemployment rates came from the BLS. We identified the industry contributing the most to job growth using employment breakdowns by sector (NAICS level 2), also from the BLS.
Click here to see the 25 cities that added the most jobs in 2018.

Source: DebraMillet / Getty Images
25. Syracuse, NY
> 2018 employment change: 9,076 (+3.1%)
> Jan. 2018 employment: 289,411
> Oct. 2018 employment: 298,487
> Unemployment, Oct. 2018: 4.0%
> Strongest sector: Mining, logging and construction (+31.1% employment chg.)
[in-text-ad]

Source: DenisTangneyJr / Getty Images
24. Manchester, NH
> 2018 employment change: 3,620 (+3.2%)
> Jan. 2018 employment: 112,792
> Oct. 2018 employment: 116,412
> Unemployment, Oct. 2018: 2.3%
> Strongest sector: Education and health services (+8.5% employment chg.)

Source: Public Domain / Wikimedia Commons
23. Kokomo, IN
> 2018 employment change: 1,203 (+3.2%)
> Jan. 2018 employment: 37,206
> Oct. 2018 employment: 38,409
> Unemployment, Oct. 2018: 3.6%
> Strongest sector: Transportation, warehousing, and utilities (+12.5% employment chg.)

Source: Publichall / Wikimedia Commons
22. Elkhart-Goshen, IN
> 2018 employment change: 3,639 (+3.3%)
> Jan. 2018 employment: 111,692
> Oct. 2018 employment: 115,331
> Unemployment, Oct. 2018: 2.8%
> Strongest sector: Mining, logging and construction (+21.9% employment chg.)
[in-text-ad-2]

Source: dszc / Getty Images
21. Phoenix-Mesa-Scottsdale, AZ
> 2018 employment change: 73,199 (+3.3%)
> Jan. 2018 employment: 2.2 million
> Oct. 2018 employment: 2.3 million
> Unemployment, Oct. 2018: 4.0%
> Strongest sector: Construction (+14.8% employment chg.)

Source: DenisTangneyJr / Getty Images
20. Pittsfield, MA
> 2018 employment change: 1,371 (+3.3%)
> Jan. 2018 employment: 41,471
> Oct. 2018 employment: 42,842
> Unemployment, Oct. 2018: 4.0%
> Strongest sector: Mining, logging and construction (+31.6% employment chg.)
[in-text-ad]

Source: Bobak Ha'Eri / Wikimedia Commons
19. Charlottesville, VA
> 2018 employment change: 3,851 (+3.3%)
> Jan. 2018 employment: 116,348
> Oct. 2018 employment: 120,199
> Unemployment, Oct. 2018: 2.5%
> Strongest sector: Leisure and hospitality (+15.9% employment chg.)
 24/7 Wall St.
Source: OlegAlbinsky / Getty Images
18. Kingston, NY
> 2018 employment change: 2,903 (+3.4%)
> Jan. 2018 employment: 84,457
> Oct. 2018 employment: 87,360
> Unemployment, Oct. 2018: 3.6%
> Strongest sector: Leisure and hospitality (+26.8% employment chg.)

Source: DenisTangneyJr / Getty Images
17. Columbus, IN
> 2018 employment change: 1,537 (+3.5%)
> Jan. 2018 employment: 43,509
> Oct. 2018 employment: 45,046
> Unemployment, Oct. 2018: 2.9%
> Strongest sector: Mining, logging and construction (+18.8% employment chg.)
[in-text-ad-2]

Source: nashvillecorps / Flickr
16. Florence-Muscle Shoals, AL
> 2018 employment change: 2,224 (+3.6%)
> Jan. 2018 employment: 61,061
> Oct. 2018 employment: 63,285
> Unemployment, Oct. 2018: 4.4%
> Strongest sector: Mining, logging and construction (+16.1% employment chg.)

Source: JennaWagner / Getty Images
15. Fort Wayne, IN
> 2018 employment change: 7,479 (+3.7%)
> Jan. 2018 employment: 204,876
> Oct. 2018 employment: 212,355
> Unemployment, Oct. 2018: 3.3%
> Strongest sector: Mining, logging and construction (+22.7% employment chg.)
[in-text-ad]

Source: Sean Pavone / Getty Images
14. Springfield, MA-CT
> 2018 employment change: 13,169 (+3.7%)
> Jan. 2018 employment: 354,153
> Oct. 2018 employment: 367,322
> Unemployment, Oct. 2018: 4.1%
> Strongest sector: Leisure and hospitality (+20.7% employment chg.)
 24/7 Wall St.
Source: f11photo / Getty Images
13. Las Vegas-Henderson-Paradise, NV
> 2018 employment change: 39,204 (+3.8%)
> Jan. 2018 employment: 1.0 million
> Oct. 2018 employment: 1.1 million
> Unemployment, Oct. 2018: 4.5%
> Strongest sector: Mining and logging (+25.0% employment chg.)
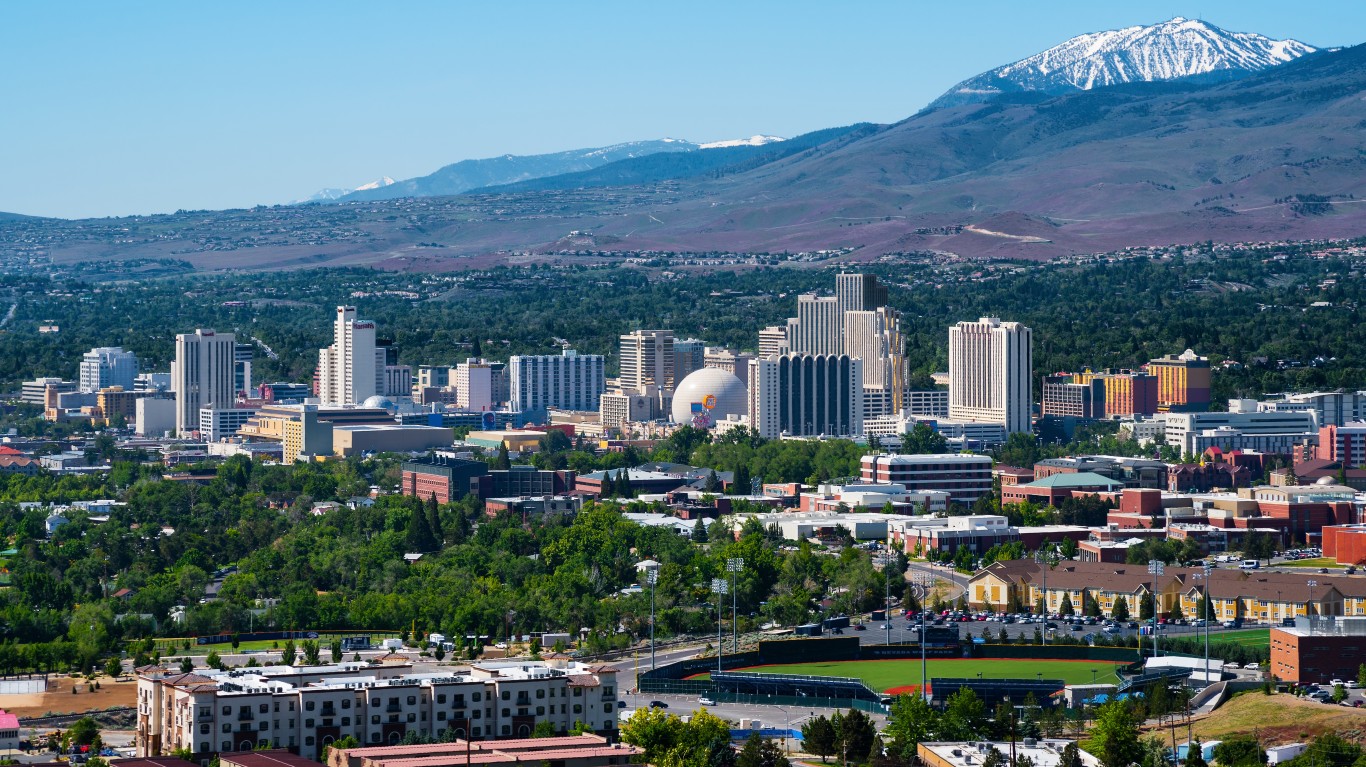
Source: photoquest7 / Getty Images
12. Reno, NV
> 2018 employment change: 9,033 (+3.8%)
> Jan. 2018 employment: 236,176
> Oct. 2018 employment: 245,209
> Unemployment, Oct. 2018: 3.5%
> Strongest sector: Construction (+20.1% employment chg.)
[in-text-ad-2]

Source: Tim Kiser (w:User:Malepheasant) / Wikimedia Commons
11. Des Moines-West Des Moines, IA
> 2018 employment change: 13,507 (+4.0%)
> Jan. 2018 employment: 336,874
> Oct. 2018 employment: 350,381
> Unemployment, Oct. 2018: 2.3%
> Strongest sector: Mining, logging and construction (+32.8% employment chg.)

Source: Ebyabe / Wikimedia Commons
10. Sebring, FL
> 2018 employment change: 1,360 (+4.1%)
> Jan. 2018 employment: 33,304
> Oct. 2018 employment: 34,664
> Unemployment, Oct. 2018: 3.8%
> Strongest sector: N/A
[in-text-ad]

Source: oneillbro / Getty Images
9. Colorado Springs, CO
> 2018 employment change: 14,083 (+4.2%)
> Jan. 2018 employment: 331,932
> Oct. 2018 employment: 346,015
> Unemployment, Oct. 2018: 3.9%
> Strongest sector: Professional and business services (+14.3% employment chg.)
 24/7 Wall St.
Source: John Phelan / Wikimedia Commons
8. Leominster-Gardner, MA
> 2018 employment change: 3,203 (+4.3%)
> Jan. 2018 employment: 75,340
> Oct. 2018 employment: 78,543
> Unemployment, Oct. 2018: 3.8%
> Strongest sector: Mining, logging and construction (+31.6% employment chg.)

Source: SeanPavonePhoto / Getty Images
7. Worcester, MA-CT
> 2018 employment change: 14,905 (+4.4%)
> Jan. 2018 employment: 340,938
> Oct. 2018 employment: 355,843
> Unemployment, Oct. 2018: 3.6%
> Strongest sector: Mining, logging and construction (+18.1% employment chg.)
[in-text-ad-2]

Source: Sean Pavone / Getty Images
6. Huntsville, AL
> 2018 employment change: 9,884 (+4.7%)
> Jan. 2018 employment: 208,740
> Oct. 2018 employment: 218,624
> Unemployment, Oct. 2018: 3.5%
> Strongest sector: Mining, logging and construction (+11.8% employment chg.)

Source: SeanPavonePhoto / Getty Images
5. Boston-Cambridge-Nashua, MA-NH
> 2018 employment change: 129,367 (+4.9%)
> Jan. 2018 employment: 2.6 million
> Oct. 2018 employment: 2.8 million
> Unemployment, Oct. 2018: 3.0%
> Strongest sector: Mining, logging and construction (+16.2% employment chg.)
[in-text-ad]

Source: DenisTangneyJr / Getty Images
4. New Bedford, MA
> 2018 employment change: 3,959 (+4.9%)
> Jan. 2018 employment: 80,157
> Oct. 2018 employment: 84,116
> Unemployment, Oct. 2018: 5.0%
> Strongest sector: Mining, logging and construction (+37.5% employment chg.)
 24/7 Wall St.
Source: Rodrigo A. Rodriguez Fuentes / Getty Images
3. Lafayette-West Lafayette, IN
> 2018 employment change: 5,645 (+5.4%)
> Jan. 2018 employment: 104,921
> Oct. 2018 employment: 110,566
> Unemployment, Oct. 2018: 3.3%
> Strongest sector: Mining, logging and construction (+19.4% employment chg.)

Source: Billy Hathorn / Wikimedia Commons
2. Midland, TX
> 2018 employment change: 5,282 (+5.7%)
> Jan. 2018 employment: 93,228
> Oct. 2018 employment: 98,510
> Unemployment, Oct. 2018: 2.2%
> Strongest sector: Mining, logging and construction (+18.8% employment chg.)
[in-text-ad-2]

Source: pasa / Flickr
1. Kankakee, IL
> 2018 employment change: 3,081 (+5.7%)
> Jan. 2018 employment: 53,650
> Oct. 2018 employment: 56,731
> Unemployment, Oct. 2018: 5.0%
> Strongest sector: Mining, logging and construction (+45.5% employment chg.)
Essential Tips for Investing: Sponsored
A financial advisor can help you understand the advantages and disadvantages of investment properties. Finding a qualified financial advisor doesn’t have to be hard. SmartAsset’s free tool matches you with up to three financial advisors who serve your area, and you can interview your advisor matches at no cost to decide which one is right for you. If you’re ready to find an advisor who can help you achieve your financial goals, get started now.
Investing in real estate can diversify your portfolio. But expanding your horizons may add additional costs. If you’re an investor looking to minimize expenses, consider checking out online brokerages. They often offer low investment fees, helping you maximize your profit.
Thank you for reading! Have some feedback for us?
Contact the 24/7 Wall St. editorial team.
Editors' Picks

