
The U.S. economy was in better condition in 2018 than it has been in decades. The job market posted its 96th consecutive month of job growth in September, the longest job creation streak in U.S. history, and the unemployment rate fell to 3.7% — its lowest point in nearly 50 years.
While approximately 80% of U.S. metropolitan areas have posted positive job growth figures for the year, some major cities have struggled. In 25 metro areas — an outsized share located in Louisiana, North Dakota, Ohio, and West Virginia — employment has fallen by more than 1.1% in 2018.
Nationwide, the sectors with the fastest job growth in 2018 were construction, mining and logging, leisure and hospitality, and professional and business services. Sectors with the slowest job growth included retail trade, financial activities, and information, and many of the cities that lost the most jobs depend heavily on these sectors.
Population decline and a stagnant economy are two of the main factors that contribute to negative employment growth, but not necessarily to higher unemployment. Cities that lost residents — often due to lack of jobs — generally saw the size of their labor force shrink as well. The size of the civilian labor force fell in approximately 80% of cities with negative job growth in 2018. However, negative job growth did not necessarily lead to higher unemployment in several of the cities as workers also left the labor force. In fact, in nine of the 25 cities with the largest declines in employment in 2018, the unemployment rate actually fell or remained the same.
To identify the cities adding (and losing) the most jobs in 2018, 24/7 Wall st. reviewed monthly metro area employment figures from the Bureau of Labor Statistics. We calculated the percentage change from January 2018 through October 2018, the latest month for which employment data at the metro area level is available. All figures are seasonally adjusted. January and October unemployment rates came from the BLS. We identified the industry contributing the most to job loss using employment breakdowns by sector (NAICS level 2), also from the BLS.
Click here to see the 25 cities that lost the most jobs in 2018.

Source: taarnes / Getty Images
25. Duluth, MN-WI
> 2018 employment change: -1,744 (-1.2%)
> Jan. 2018 employment: 140,443
> Oct. 2018 employment: 138,699
> Unemployment, Oct. 2018: 3.7%
> Weakest sector: Education and health services (-0.3% employment chg.)
[in-text-ad]

Source: DianeBentleyRaymond / Getty Images
24. Eugene, OR
> 2018 employment change: -2,246 (-1.3%)
> Jan. 2018 employment: 177,750
> Oct. 2018 employment: 175,504
> Unemployment, Oct. 2018: 4.5%
> Weakest sector: Information (-7.4% employment chg.)

Source: Davel5957 / Getty Images
23. Cheyenne, WY
> 2018 employment change: -590 (-1.3%)
> Jan. 2018 employment: 45,748
> Oct. 2018 employment: 45,158
> Unemployment, Oct. 2018: 3.8%
> Weakest sector: Information (-9.1% employment chg.)

Source: DenisTangneyJr / Getty Images
22. Grand Forks, ND-MN
> 2018 employment change: -705 (-1.3%)
> Jan. 2018 employment: 54,532
> Oct. 2018 employment: 53,827
> Unemployment, Oct. 2018: 2.8%
> Weakest sector: Government (-2.1% employment chg.)
[in-text-ad-2]

Source: shakzu / Getty Images
21. Vineland-Bridgeton, NJ
> 2018 employment change: -809 (-1.3%)
> Jan. 2018 employment: 62,103
> Oct. 2018 employment: 61,294
> Unemployment, Oct. 2018: 6.1%
> Weakest sector: Trade, transportation, and utilities (-3.0% employment chg.)

Source: f11photo / Getty Images
20. New Orleans-Metairie, LA
> 2018 employment change: -7,592 (-1.3%)
> Jan. 2018 employment: 579,519
> Oct. 2018 employment: 571,927
> Unemployment, Oct. 2018: 4.6%
> Weakest sector: Wholesale trade (-3.1% employment chg.)
[in-text-ad]

Source: DenisTangneyJr / Getty Images
19. Wilmington, NC
> 2018 employment change: -1,849 (-1.3%)
> Jan. 2018 employment: 140,469
> Oct. 2018 employment: 138,620
> Unemployment, Oct. 2018: 3.8%
> Weakest sector: Other services (-8.0% employment chg.)
 24/7 Wall St.
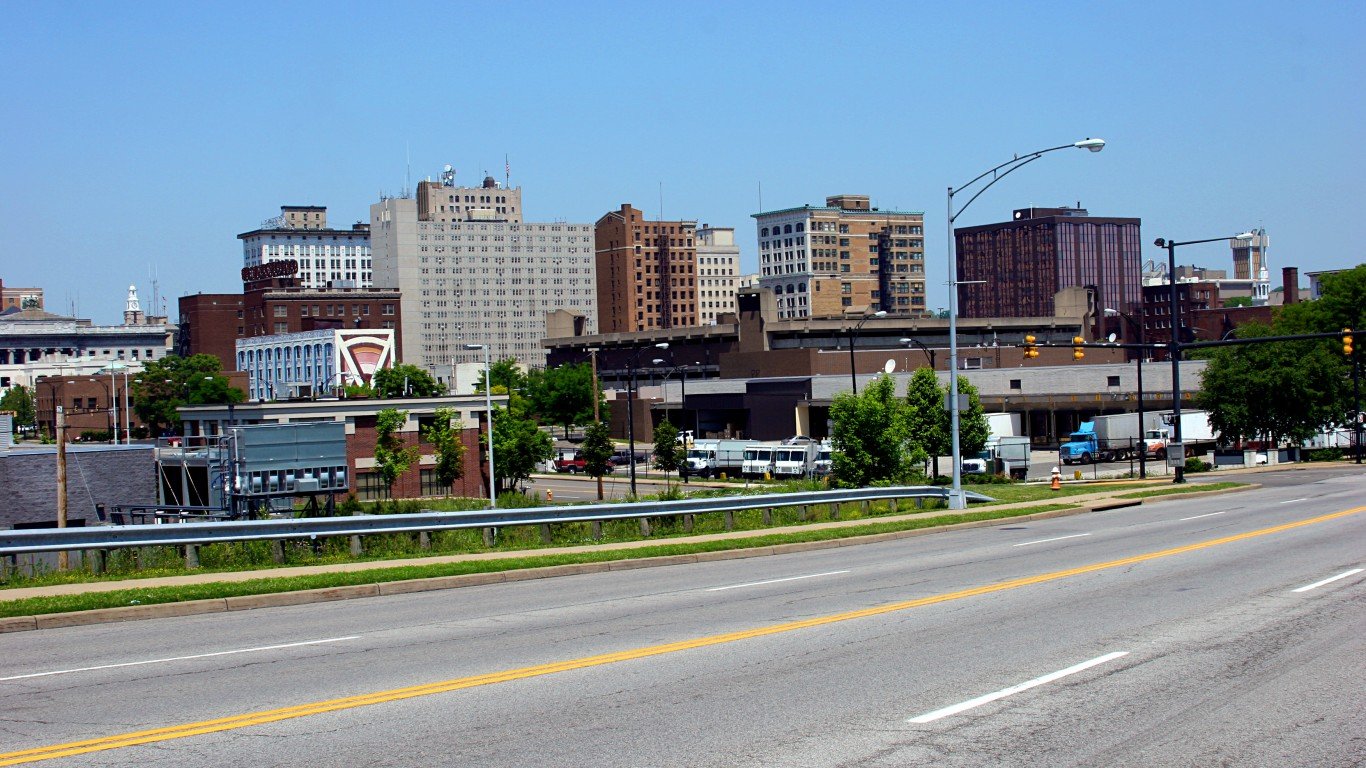
Source: ftwitty / Getty Images
18. Youngstown-Warren-Boardman, OH-PA
> 2018 employment change: -3,028 (-1.3%)
> Jan. 2018 employment: 227,743
> Oct. 2018 employment: 224,715
> Unemployment, Oct. 2018: 5.8%
> Weakest sector: Retail trade (-2.7% employment chg.)

Source: Sean Pavone / Getty Images
17. Salem, OR
> 2018 employment change: -2,745 (-1.4%)
> Jan. 2018 employment: 196,156
> Oct. 2018 employment: 193,411
> Unemployment, Oct. 2018: 4.5%
> Weakest sector: N/A
[in-text-ad-2]

Source: Tim Kiser (w:User:Malepheasant) / Wikimedia Commons
16. Beckley, WV
> 2018 employment change: -607 (-1.4%)
> Jan. 2018 employment: 42,870
> Oct. 2018 employment: 42,263
> Unemployment, Oct. 2018: 5.8%
> Weakest sector: N/A
Source: 6381380 / Getty Images
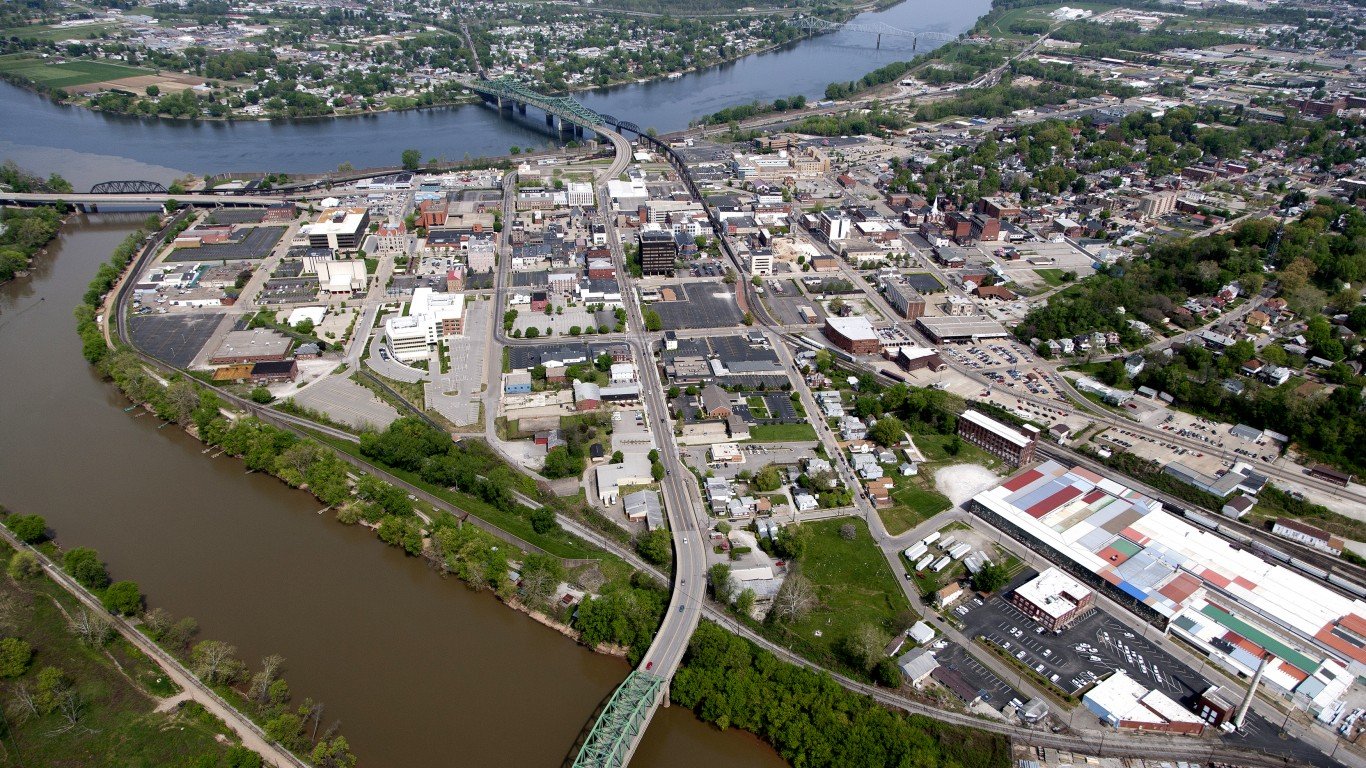
15. Parkersburg-Vienna, WV
> 2018 employment change: -526 (-1.4%)
> Jan. 2018 employment: 36,391
> Oct. 2018 employment: 35,865
> Unemployment, Oct. 2018: 5.5%
> Weakest sector: N/A
[in-text-ad]

Source: DenisTangneyJr / Getty Images
14. Charleston, WV
> 2018 employment change: -1,445 (-1.6%)
> Jan. 2018 employment: 90,757
> Oct. 2018 employment: 89,312
> Unemployment, Oct. 2018: 5.2%
> Weakest sector: Education and health services (-1.9% employment chg.)
 24/7 Wall St.
Source: Jeramey Jannene (Grassferry49) / Wikimedia Commons
13. Janesville-Beloit, WI
> 2018 employment change: -1,347 (-1.6%)
> Jan. 2018 employment: 82,867
> Oct. 2018 employment: 81,520
> Unemployment, Oct. 2018: 3.1%
> Weakest sector: Retail trade (-5.1% employment chg.)

Source: Public Domain / Wikimedia Commons
12. Lima, OH
> 2018 employment change: -804 (-1.7%)
> Jan. 2018 employment: 46,350
> Oct. 2018 employment: 45,546
> Unemployment, Oct. 2018: 4.4%
> Weakest sector: Retail trade (-1.8% employment chg.)
[in-text-ad-2]

Source: Thinkstock
11. Toledo, OH
> 2018 employment change: -5,123 (-1.8%)
> Jan. 2018 employment: 288,722
> Oct. 2018 employment: 283,599
> Unemployment, Oct. 2018: 5.0%
> Weakest sector: Information (-3.4% employment chg.)

Source: jmoor17 / Getty Images
10. Casper, WY
> 2018 employment change: -756 (-2.0%)
> Jan. 2018 employment: 37,274
> Oct. 2018 employment: 36,518
> Unemployment, Oct. 2018: 4.7%
> Weakest sector: Information (-20.0% employment chg.)
[in-text-ad]

Source: SeanPavonePhoto / Getty Images
9. Baton Rouge, LA
> 2018 employment change: -8,428 (-2.1%)
> Jan. 2018 employment: 408,741
> Oct. 2018 employment: 400,313
> Unemployment, Oct. 2018: 4.4%
> Weakest sector: Retail trade (-3.9% employment chg.)

Source: Richard David Ramsey / Wikimedia Commons
8. Hammond, LA
> 2018 employment change: -1,123 (-2.1%)
> Jan. 2018 employment: 53,555
> Oct. 2018 employment: 52,432
> Unemployment, Oct. 2018: 5.3%
> Weakest sector: N/A

Source: DenisTangneyJr / Getty Images
7. Fargo, ND-MN
> 2018 employment change: -2,905 (-2.1%)
> Jan. 2018 employment: 135,824
> Oct. 2018 employment: 132,919
> Unemployment, Oct. 2018: 2.5%
> Weakest sector: N/A
[in-text-ad-2]

Source: DenisTangneyJr / Getty Images
6. Lafayette, LA
> 2018 employment change: -4,613 (-2.3%)
> Jan. 2018 employment: 204,593
> Oct. 2018 employment: 199,980
> Unemployment, Oct. 2018: 4.9%
> Weakest sector: Information (-4.0% employment chg.)

Source: wellesenterprises / Getty Images
5. Monroe, LA
> 2018 employment change: -1,972 (-2.5%)
> Jan. 2018 employment: 77,552
> Oct. 2018 employment: 75,580
> Unemployment, Oct. 2018: 5.4%
> Weakest sector: N/A
[in-text-ad]

Source: afiler / Flickr
4. Bismarck, ND
> 2018 employment change: -1,856 (-2.7%)
> Jan. 2018 employment: 67,868
> Oct. 2018 employment: 66,012
> Unemployment, Oct. 2018: 2.9%
> Weakest sector: N/A
 24/7 Wall St.
Source: Rex_Wholster / Getty Images
3. Alexandria, LA
> 2018 employment change: -1,851 (-3.0%)
> Jan. 2018 employment: 62,249
> Oct. 2018 employment: 60,398
> Unemployment, Oct. 2018: 5.4%
> Weakest sector: N/A

Source: con4tini / Flickr
2. Houma-Thibodaux, LA
> 2018 employment change: -2,686 (-3.1%)
> Jan. 2018 employment: 85,520
> Oct. 2018 employment: 82,834
> Unemployment, Oct. 2018: 4.9%
> Weakest sector: N/A
[in-text-ad-2]

Source: DenisTangneyJr / Getty Images
1. Shreveport-Bossier City, LA
> 2018 employment change: -6,431 (-3.5%)
> Jan. 2018 employment: 181,680
> Oct. 2018 employment: 175,249
> Unemployment, Oct. 2018: 5.3%
> Weakest sector: Professional and business services (-1.8% employment chg.)
Sponsored: Attention Savvy Investors: Speak to 3 Financial Experts – FREE
Ever wanted an extra set of eyes on an investment you’re considering? Now you can speak with up to 3 financial experts in your area for FREE. By simply
clicking here you can begin to match with financial professionals who can help guide you through the financial decisions you’re making. And the best part? The first conversation with them is free.
Click here to match with up to 3 financial pros who would be excited to help you make financial decisions.
Thank you for reading! Have some feedback for us?
Contact the 24/7 Wall St. editorial team.
Editors' Picks

