
No two states are exactly alike. Job market strength, economic productivity, and individual prosperity and security all vary widely from state to state. While some of these conditions can be meaningfully impacted by immutable characteristics like geography and the presence of natural resources, ultimately they are a reflection of leadership.
The U.S. Constitution grants state governments a wide range of powers. Safe streets, a balanced budget, and a growing economy can all come as a result of shrewd policy making at the state level. Some states have proven to be more adept than others at achieving these goals.
It is important to note that current economic and social conditions in a given state are often not the result of the work of sitting elected officials. High-level governing strategies and budget priorities can have consequences that extend far beyond the tenure of those who make them.
For the ninth year in a row, 24/7 Wall St. reviewed economic indicators, budget allocations, and state balance sheets, in addition to a range of social measures to rank how well each state is run. These are the best and worst run states in the country.
Click here to see the best and worst run states in America.
Click here to see our detailed findings and methodology.

Source: Thinkstock
1. Oregon
> 2017 unemployment: 4.1% (22nd lowest)
> Pension funded ratio: 80.5% (12th highest)
> 1 yr. GDP growth: +3.6% (3rd highest)
> Poverty rate: 13.2% (23rd highest)
> Moody’s credit rating and outlook: Aa1/Stable
Oregon climbed up in rank from fourth best-run state last year to best-run state this year. The West Coast state is also one of the fastest growing by population, adding a net total of about 46,000 residents from migration alone from mid-2016 to mid-2017. The influx has likely contributed to rising home values and increased economic activity, and has added extra tax revenue to the state’s budget.
Oregon’s median home value climbed by 11.2% from 2016 to 2017, the largest increase of any state. Over the same period, the state’s economy expanded by 3.6%, more than all but two other states and far faster than the comparable national GDP growth rate of 2.2%. Oregon’s budget reserves amount to 12.3% of the state’s annual expenditures, and the state has enough money to fund 80.5% of its pension benefits obligations — each larger than the corresponding national shares.
[in-text-ad]

Source: Adventure_Photo / Getty Images
2. Utah
> 2017 unemployment: 3.2% (8th lowest)
> Pension funded ratio: 86.0% (8th highest)
> 1 yr. GDP growth: +2.5% (11th highest)
> Poverty rate: 9.7% (6th lowest)
> Moody’s credit rating and outlook: Aaa/Stable
Utah ranks as the second best-run state for the second year in a row, and in the top 10 best-run states for the the ninth year in a row. Like several other western states, Utah’s population is growing relatively rapidly — and so is its workforce. From 2013 to 2017, the number of people working or looking for work in Utah increased by 11.0%, more than any other state over that time period. The state’s job market has absorbed the influx handily. Just 3.2% of workers in the state were unemployed in 2017, a far smaller share than the 4.4% national unemployment rate.
Utah also gets high marks for its budgeting and fiscal prudence. The state has a far larger than typical share of its pension obligations funded, and it is one of only 14 states with a perfect credit rating and outlook from Moody’s.

Source: Thinkstock
3. Washington
> 2017 unemployment: 4.8% (13th highest)
> Pension funded ratio: 84.0% (9th highest)
> 1 yr. GDP growth: +4.7% (the highest)
> Poverty rate: 11% (14th lowest)
> Moody’s credit rating and outlook: Aa1/Stable
Much like Oregon, its neighbor to the south, Washington’s population is booming. In the last year alone, 90,600 more people moved to the state than left. And just like in Oregon, the influx has likely bolstered home values and helped boost the economy. Over the last year alone, the typical home in the state appreciated in value by 10.6% — well above the 6.1% increase nationwide. That same year, Washington reported a nation-leading 4.7% GDP growth, more than double the 2.2% U.S. GDP growth.
Like other well-managed states, Washington is well-positioned to pay out pensions of government workers. Currently, the state has funds to cover 84.0% of its pension obligations, a far larger share than most states.

Source: RudyBalasko / Getty Images
4. Minnesota
> 2017 unemployment: 3.5% (13th lowest)
> Pension funded ratio: 53.2% (8th lowest)
> 1 yr. GDP growth: +1.6% (25th highest)
> Poverty rate: 9.5% (3rd lowest)
> Moody’s credit rating and outlook: Aa1/Stable
Minnesota allocates more of its budget to education than most states. Investment in the state’s school system appears to be paying off, as 93.1% of adult residents have a high school diploma, the largest share in the country. A high school education is a prerequisite for most jobs, and the high educational attainment in the state may partially explain the low unemployment rate. Just 3.5% of the state’s labor force was jobless in 2017, well below the 4.4% national unemployment rate.
A larger than typical share of the state’s annual budget is allocated to police and law enforcement — and Minnesota is one of the safest states in the country. There were just 238 violent crimes for every 100,000 state residents in 2017, well below the national violent crime rate of 383 per 100,000 that year.
[in-text-ad-2]

Source: Ron_Thomas / Getty Images
5. Iowa
> 2017 unemployment: 3.1% (7th lowest)
> Pension funded ratio: 81.6% (10th highest)
> 1 yr. GDP growth: +0.3% (12th lowest)
> Poverty rate: 10.7% (12th lowest)
> Moody’s credit rating and outlook: Aaa/Stable
Iowa is a fiscally well-managed state with a relatively well-balanced budget. The state’s debt load amounts to only about a quarter of its revenue, one of the smallest shares of any state. Additionally, about 82% of the state’s pension obligations are funded, compared to the 66% average across all states. Iowa is one of only 14 states with a perfect credit rating and outlook from Moody’s.
Iowa also receives high marks for its job market. Just 3.1% of workers in the state were unemployed in 2017, well below the 4.4% national annual unemployment rate.

Source: rruntsch / Getty Images
6. North Dakota
> 2017 unemployment: 2.6% (2nd lowest)
> Pension funded ratio: 65.9% (23rd lowest)
> 1 yr. GDP growth: -0.5% (4th lowest)
> Poverty rate: 10.3% (8th lowest)
> Moody’s credit rating and outlook: Aa1/Negative
Within the last decade, North Dakota was home to one of the fastest growing populations and fastest growing economies of any state. The boom was almost entirely attributable to natural gas drilling in the Williston Basin. However, following the collapse of oil prices in 2014, growth in the state has slowed. Still, North Dakota boasts a strong job market, with just a 2.6% unemployment rate, the lowest of any state other than Hawaii.
Average output per worker in North Dakota is also much greater than in other parts of the country. The state’s GDP per capita of $67,244 is about $12,000 more than GDP per capita nationwide. Generally, higher per capita GDP reflects a higher standard of living.
[in-text-ad]

Source: Gary Gray / Getty Images
7. Colorado
> 2017 unemployment: 2.8% (4th lowest)
> Pension funded ratio: 46.0% (5th lowest)
> 1 yr. GDP growth: +2.7% (8th highest)
> Poverty rate: 10.3% (8th lowest)
> Moody’s credit rating and outlook: Aa1/Stable
Colorado is one of the fastest growing states in the country by population. About 47,000 more people moved to Colorado than left between July 2016 and July 2017, among the most of any state when adjusted for population. The influx has likely helped drive up home values. The typical house in the state appreciated in value by 11.0% from 2016 to 2017, the second largest increase of any state. Over the last four years, home values in the state jumped 45.1%.
The growing population has led to a growing workforce. Since 2013, the number of people working or looking for work in Colorado has jumped by 8.1%, more than double the 3.4% growth in the national labor pool. Still, the state’s economy easily absorbed the growing demand for jobs as just 2.8% of of workers in Colorado were unemployed in 2017, well below the 4.4% national unemployment rate last year.
Source: knowlesgallery / Getty Images
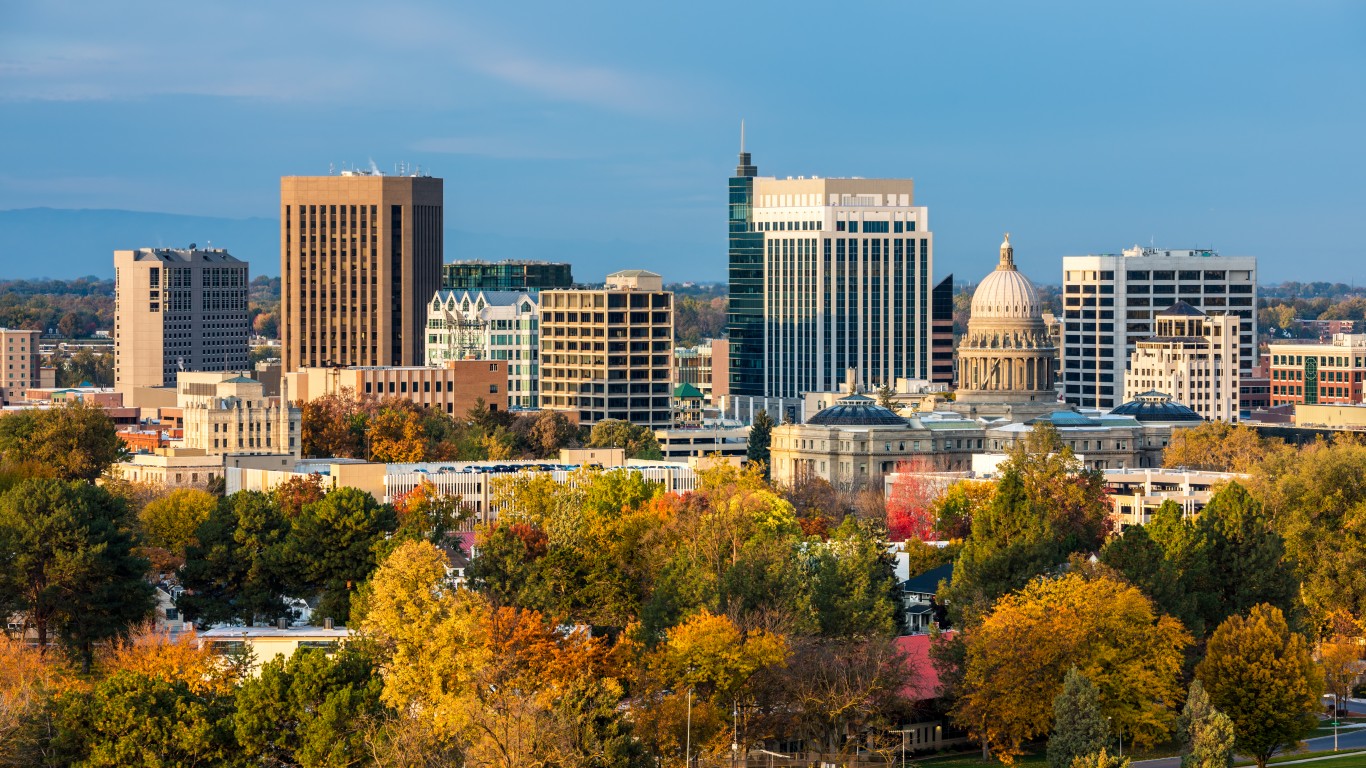
8. Idaho
> 2017 unemployment: 3.2% (8th lowest)
> Pension funded ratio: 87.7% (7th highest)
> 1 yr. GDP growth: +2.4% (13th highest)
> Poverty rate: 12.8% (25th lowest)
> Moody’s credit rating and outlook: Aa1/Stable
Idaho is adding new residents at a nation-leading pace. Between mid-2016 and mid-2017, the state’s population grew by 1.5% from migration alone — more than four times the comparable average across all states. The population influx has likely contributed to soaring home values and strong economic growth. Over the last year, the typical state home appreciated in value by 9.3%, well above the 6.1% national average. Additionally, Idaho’s economy grew by 2.4% that year, faster than all but 12 other states.
Idaho’s rainy day fund has also been largely replenished since it was drained in the wake of the Great Recession. The state now has the equivalent of 11.4% of its annual budget set aside for emergency spending, more than the 7.2% average across all states.

Source: DenisTangneyJr / Getty Images
9. Massachusetts
> 2017 unemployment: 3.7% (16th lowest)
> Pension funded ratio: 57.6% (12th lowest)
> 1 yr. GDP growth: +2.6% (9th highest)
> Poverty rate: 10.5% (10th lowest)
> Moody’s credit rating and outlook: Aa1/Stable
Massachusetts is the only state east of the Mississippi to rank among the top 10 best-managed. The state has a massive $53.6 billion budget, and it allocates a relatively large 37.6% share to public welfare. The state has relatively generous benefits for residents who qualify. For example, unemployment insurance recipients receive an average of $511 a week, the most of any state. Residents of Massachusetts are also less likely to be unemployed than most Americans. Just 3.7% of workers in the state were unemployed in 2017, a smaller share than the 4.4% national unemployment rate.
Massachusetts was also the first state to mandate health insurance coverage for its citizens, years before the Affordable Care Act was even discussed at the national level. Partially as a result, just 2.8% of state residents do not have health insurance, the lowest uninsured rate in the country.
[in-text-ad-2]
Source: ChrisBoswell / Getty Images
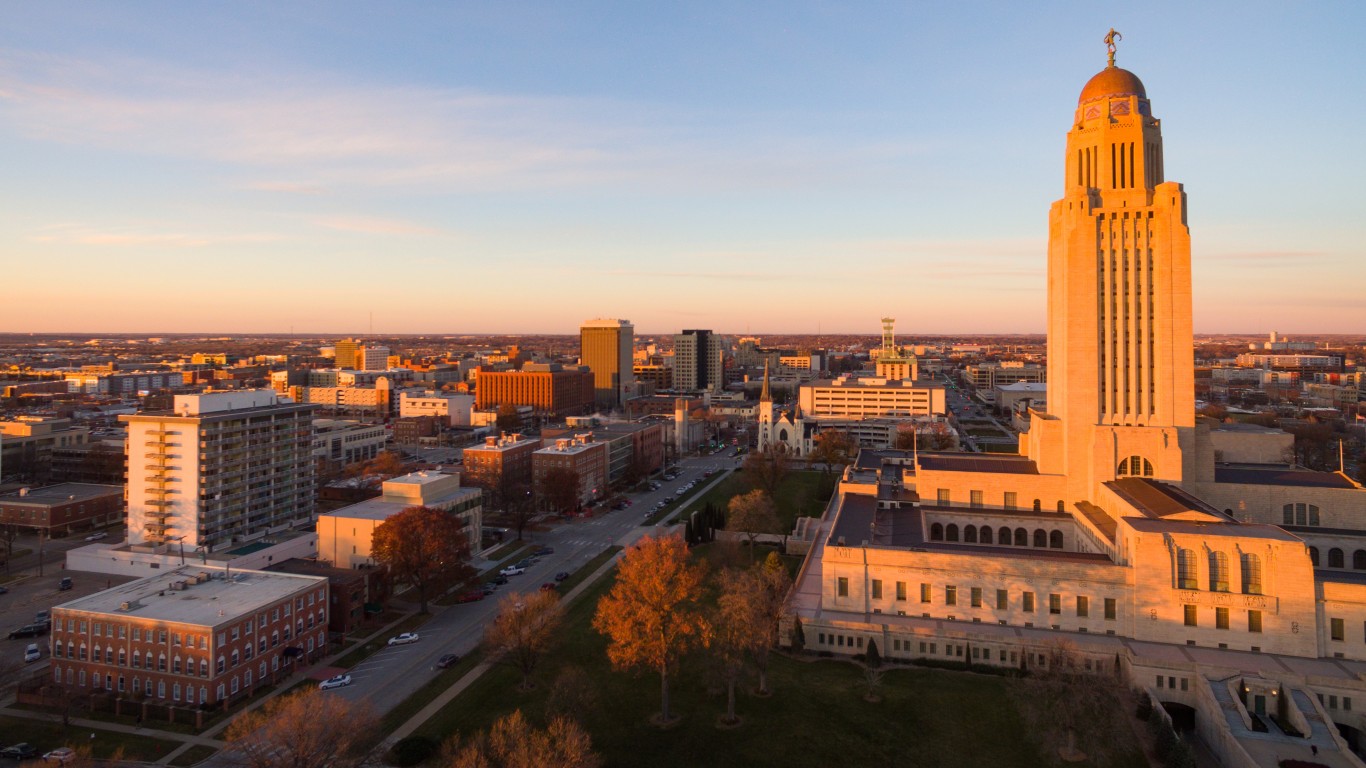
10. Nebraska
> 2017 unemployment: 2.9% (5th lowest)
> Pension funded ratio: 88.8% (5th highest)
> 1 yr. GDP growth: +0.9% (17th lowest)
> Poverty rate: 10.8% (13th lowest)
> Moody’s credit rating and outlook: Aa1/Stable
Nebraska, a relatively small state of just 1.9 million residents, has a well-managed budget. The state has funding for 88.8% of its pension obligations, and its debt is equal to just 17.9% of its annual revenue. For reference, states have an average of just 65.9% of their pensions funded, and the average debt as a percent of annual spending across all states is 54.3%. However, Nebraska is facing a projected $95.1 million budget shortfall in the next two years, and how the state will close the gap remains uncertain.
Nebraska also has one of the healthiest job markets of any state. Just 2.9% of workers were out of a job in 2017, well below the 4.4% national unemployment rate in 2017.
Source: gchapel / Getty Images
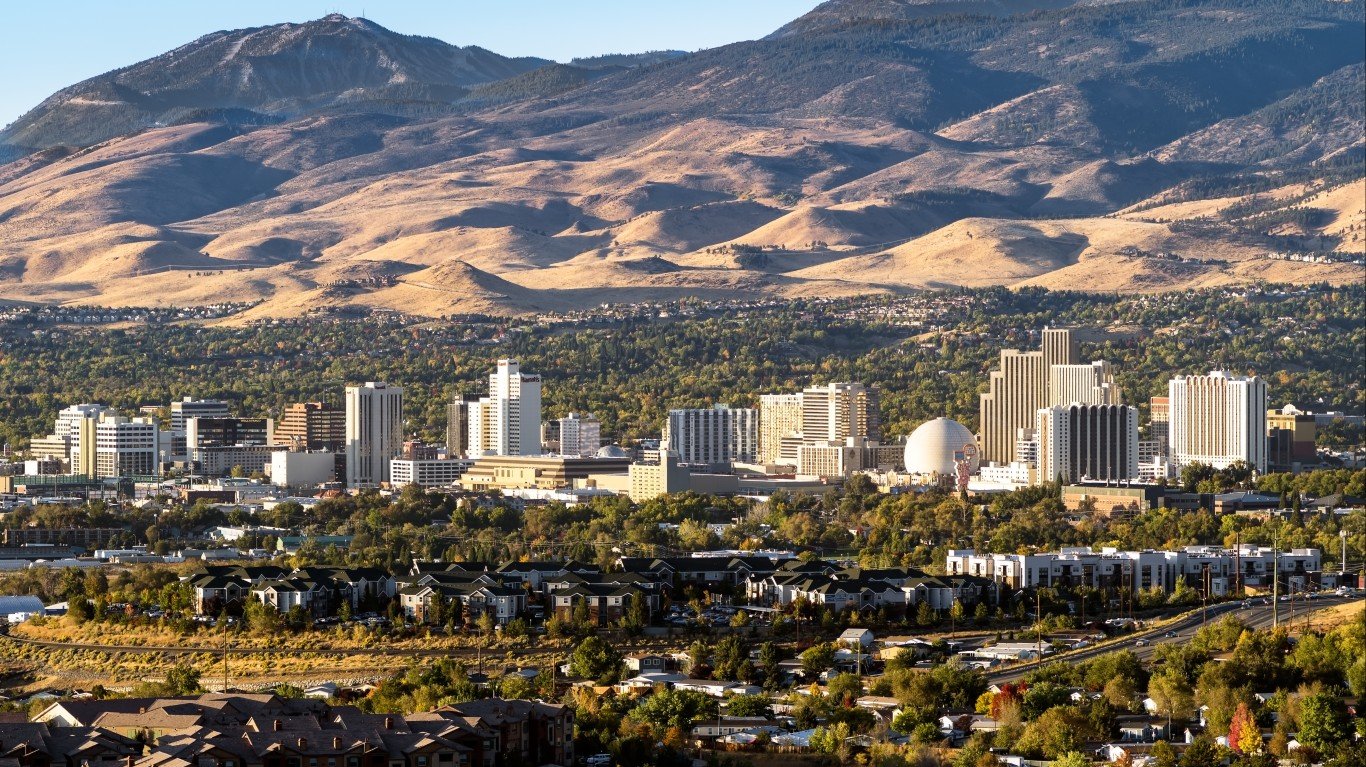
11. Nevada
> 2017 unemployment: 5% (8th highest)
> Pension funded ratio: 72.3% (21st highest)
> 1 yr. GDP growth: +3.8% (2nd highest)
> Poverty rate: 13% (25th highest)
> Moody’s credit rating and outlook: Aa2/Stable
The unemployment rate in Nevada has improved tremendously since the end of the Great Recession, falling from a peak of 13.7% in the wake of the Great Recession in November 2010 to 4.4% in October 2018. The state ranked among the 10 worst run states for four consecutive years beginning in 2010, and is now the 11th best run state.
Nevada has been drawing new residents at a near nation-leading rate, which has likely contributed to skyrocketing home values and rapid economic expansion. The 56.2% appreciation in median home value in the state between 2013 and 2017 is the largest of any state. Additionally, Nevada’s GDP growth of 3.8% from 2016 to 2017 was faster than any state other Washington.
[in-text-ad]

Source: Thinkstock
12. Delaware
> 2017 unemployment: 4.6% (20th highest)
> Pension funded ratio: 81.1% (11th highest)
> 1 yr. GDP growth: +0.1% (8th lowest)
> Poverty rate: 13.6% (19th highest)
> Moody’s credit rating and outlook: Aaa/Stable
Delaware is one of only 14 states with a perfect credit rating and a stable outlook from Moody’s. The state has funding for over 80% if its pension obligations — far more than average. The standard of living in Delaware is also relatively high. The state’s GDP per capita of $66,419 is over $10,000 more than the national GDP per capita.
With no sales tax, property tax, or corporate tax on earnings or investment income, Delaware is considered a tax haven by many. Still, through means like personal income tax, lotteries, and corporate franchise tax, the state still manages to collect considerable funds in revenue. Delaware brought in $8.1 billion in tax revenue in 2016, more than all but eight other states when adjusted for population.
 24/7 Wall St.
Source: Sean Pavone / Getty Images
13. New Hampshire
> 2017 unemployment: 2.7% (3rd lowest)
> Pension funded ratio: 58.2% (13th lowest)
> 1 yr. GDP growth: +2.5% (11th highest)
> Poverty rate: 7.7% (the lowest)
> Moody’s credit rating and outlook: Aa1/Stable
New Hampshire ranks as the 13 best-run state in the country and the second best-run in the New England region. Despite allocating just 24.0% of its annual budget to education, educational outcomes are strong in New Hampshire by several important measures. For example, 93.1% of adults in the state have a high school diploma, tied with Minnesota as the largest share of any state.
New Hampshire is also notable for the relative scarcity of poverty and crime in the state. Just 7.7% of the population lives below the poverty line, the smallest share of any state. Additionally, there were 199 violent crimes for every 100,000 residents in the state in 2017, well below the national violent crime rate of 383 per 100,000.

Source: Art Wager / Getty Images
14. Hawaii
> 2017 unemployment: 2.4% (the lowest)
> Pension funded ratio: 51.3% (6th lowest)
> 1 yr. GDP growth: +1.2% (18th lowest)
> Poverty rate: 9.5% (3rd lowest)
> Moody’s credit rating and outlook: Aa1/Stable
Just 2.4% of the workforce in Hawaii was out of a job in 2017, the lowest annual unemployment rate of any state. The state’s job market is heavily dependent on its tourism industry. Entertainment, accomodation, and food services accounts for 17.3% of employment in the state, the largest share of any state other than Nevada and well above the 9.7% national share.
In addition to the state’s strong job market, Hawaii residents have high incomes, providing a strong tax base. The typical household in Hawaii earns $77,765 a year, about $17,000 more than the typical American household. Meanwhile, the state collects the equivalent of $4,843 per person in taxes annually, more than every other state except North Dakota and Vermont.
[in-text-ad-2]

Source: f11photo / Getty Images
15. Texas
> 2017 unemployment: 4.3% (25th highest)
> Pension funded ratio: 73.0% (19th highest)
> 1 yr. GDP growth: +1.3% (21st lowest)
> Poverty rate: 14.7% (14th highest)
> Moody’s credit rating and outlook: Aaa/Stable
Texas is heavily dependent on its oil industry, and in recent years, economic growth in the Lone Star State has been stifled by falling oil prices. The state economy grew by 1.3% in 2017, sluggish compared to the 2.2% national GDP growth that year. Still, Texas is relatively well managed from a financial standpoint. The state has relatively little debt and the equivalent of 21.3% of its annual budget saved in a rainy day fund, more than by all but two other states. Texas is also one of only 14 states with a perfect credit rating and stable outlook from Moody’s.
Texas’s population has grown rapidly in recent years, and that has helped drive up property values. The typical Texas home is worth over 30% more now than in 2013, far faster appreciation than in most other states.

Source: Sean Pavone / Getty Images
16. Tennessee
> 2017 unemployment: 3.7% (16th lowest)
> Pension funded ratio: 94.1% (3rd highest)
> 1 yr. GDP growth: +2.8% (7th highest)
> Poverty rate: 15% (10th highest)
> Moody’s credit rating and outlook: Aaa/Stable
Tennessee is better run than the vast majority of southern states. While many states are running into a pension crisis, Tennessee has funding for 94.1% of its pension obligations, more than all states other than South Dakota and Wisconsin. Fiscally well managed, Tennessee has a perfect credit rating and stable outlook from Moody’s. The state also spends 41.3% of its annual budget on public welfare, the largest share of any state.
The job market in Tennessee is relatively strong. Tennessee’s population has grown faster than most states in recent years, and its job market has been able to accommodate the extra members of the labor force. The state’s annual unemployment rate was 3.7% in 2017, well below the 4.4% annual national rate.
[in-text-ad]

Source: choness / Getty Images
17. California
> 2017 unemployment: 4.8% (13th highest)
> Pension funded ratio: 69.5% (25th lowest)
> 1 yr. GDP growth: +3% (6th highest)
> Poverty rate: 13.3% (22nd highest)
> Moody’s credit rating and outlook: Aa3/Positive
By far the most populous state in the country, California’s annual budget tops $276 billion. More than a third of that money goes to public welfare, a larger share than in all but three other states. California’s economy is also the largest in the nation — and growing fast. California’s GDP grew by 3.0% in the last year, more than the vast majority of states and far outpacing the 2.2% national GDP growth.
While California has a lot going for it, it also has some weaknesses. For example, the state’s violent crime rate of 449 incidents per 100,000 people is higher than most states, and its 4.8% annual unemployment rate is higher than the comparable 4.4% national rate.

Source: Sean Pavone / Getty Images
18. Florida
> 2017 unemployment: 4.2% (24th lowest)
> Pension funded ratio: 79.4% (13th highest)
> 1 yr. GDP growth: +2.2% (15th highest)
> Poverty rate: 14% (18th highest)
> Moody’s credit rating and outlook: Aaa/Stable
People are moving to Florida at a far faster pace than most other states. From mid-2016 to mid-2017, 305,000 more people moved to Florida than left. The influx is helping drive up property values. The typical Florida home is worth 39.6% more today than in 2013, the third largest increase of any state.
In many ways, economic conditions in Florida align closely with the nation as a whole. For example, the state’s 4.2% 2017 unemployment rate is only slightly lower than the 4.4% national rate. Similarly, Florida’s 2.2% 2017 GDP growth is exactly in line with U.S. economic growth.

Source: Thinkstock
19. Georgia
> 2017 unemployment: 4.7% (16th highest)
> Pension funded ratio: 75.8% (17th highest)
> 1 yr. GDP growth: +3.1% (4th highest)
> Poverty rate: 14.9% (12th highest)
> Moody’s credit rating and outlook: Aaa/Stable
Georgia’s economy is one of the fastest growing in the country. The state’s 3.1% GDP growth in 2017 was the fourth strongest among states. Georgia also has a lower debt-to-revenue ratio than most states and more of its pension obligations are funded than is typical among states. The state also has a perfect credit rating and stable outlook from Moody’s.
In other measures, Georgia looks more like the rest of the nation. The state’s 4.7% unemployment rate in 2017 was slightly higher than the 4.4% national unemployment rate.
[in-text-ad-2]

Source: Davel5957 / Getty Images
20. Michigan
> 2017 unemployment: 4.6% (20th highest)
> Pension funded ratio: 64.0% (18th lowest)
> 1 yr. GDP growth: +2.2% (15th highest)
> Poverty rate: 14.2% (15th highest)
> Moody’s credit rating and outlook: Aa1/Stable
Michigan’s economic growth of 2.2% last year was in line with the national GDP growth rate. Michigan also closely matches the average across states in its ability to pay out pensions for state workers. Michigan has funding for 64.0% of its total pension obligations, compared to the 65.9% average funding across all states.
Michigan’s job market does not compare favorably to that of most other states. In 2017, 4.6% of the Michigan workforce was unemployed, slightly higher than the 4.4% national annual unemployment rate.

Source: DenisTangneyJr / Getty Images
21. Wisconsin
> 2017 unemployment: 3.3% (10th lowest)
> Pension funded ratio: 99.1% (the highest)
> 1 yr. GDP growth: +1.3% (21st lowest)
> Poverty rate: 11.3% (17th lowest)
> Moody’s credit rating and outlook: Aa1/Stable
Wisconsin has one of the strongest job markets of any state. Just 3.3% of the state’s labor force was out a job in 2017, well below the 4.4% national unemployment rate. Wisconsin is also better positioned to pay out the pensions of its public employees than any other state. While many states are facing a pension funding crisis, Wisconsin has funding for 99.1% of its pension obligations, well above the 65.9% average across all states.
Economic growth, however, is relatively weak in Wisconsin. In the last year, Wisconsin’s GDP grew by 1.3%, compared to the 2.2% national economic growth.
[in-text-ad]

Source: Thinkstock
22. North Carolina
> 2017 unemployment: 4.6% (20th highest)
> Pension funded ratio: 88.3% (6th highest)
> 1 yr. GDP growth: +2.4% (13th highest)
> Poverty rate: 14.7% (14th highest)
> Moody’s credit rating and outlook: Aaa/Stable
With a relatively fast growing economy, North Carolina is drawing in new residents at a faster rate than most states. In the last year, the state’s 2.4% GDP growth was faster than the 2.2% national economic growth. The state’s labor force has also grown by 5.3% since 2013. Despite the fast pace of economic growth, unemployment is more common in North Carolina than in a majority of states. In 2017 4.6% of the state workforce was unemployed, higher than the 4.4% national unemployment rate.
North Carolina is a fiscally well-managed state. It is one of only 14 states with a perfect credit rating from Moody’s and a stable outlook.

Source: Thinkstock
23. Indiana
> 2017 unemployment: 3.5% (13th lowest)
> Pension funded ratio: 63.0% (17th lowest)
> 1 yr. GDP growth: +1.8% (22nd highest)
> Poverty rate: 13.5% (20th highest)
> Moody’s credit rating and outlook: Aaa/Stable
Indiana’s economy is largely dependent on manufacturing and trade. The manufacturing sector accounts for 18.8% of total employment in the state, the largest share of any state other than Michigan. Indiana is also a major trading partner of Canada, shipping more than $4 billion in cars, trucks, auto parts, and steel across the Great Lakes every year. Indiana exported a total of $5,660 worth of goods per capita in 2017, the ninth most of any state.
While the U.S. manufacturing sector as a whole has struggled in recent years, Indiana has relatively low unemployment and ranks towards the middle of all states in a number of measures related to fiscal management. The state’s unemployment rate is 3.5%, less than the 4.4% national figure. Indiana’s rainy day fund is equivalent to 8.9% of its annual expenditures, greater than the 7.2% average across all states.

Source: SeanPavonePhoto / Getty Images
24. Maryland
> 2017 unemployment: 4.1% (22nd lowest)
> Pension funded ratio: 64.9% (20th lowest)
> 1 yr. GDP growth: +2.2% (15th highest)
> Poverty rate: 9.3% (2nd lowest)
> Moody’s credit rating and outlook: Aaa/Stable
By several key economic measures, Maryland aligns closely with the country as a whole. For example, 4.1% of the state’s workforce was unemployed in 2017, only slightly lower than the 4.4% national annual unemployment rate. Additionally, Maryland’s economy grew by 2.2% in 2017, exactly on pace with U.S. GDP growth that year.
Maryland’s median household income of $80,776 is the highest in the country. With a strong tax base, the state has relatively high tax revenue. Per capita tax revenue in Maryland was $3,473 in 2017, well above the $2,856 average across all states. Despite high revenues, Maryland’s debt is equal to 66.3% of its revenue, more than the 54.3% average debt-to-revenue ratio across states.
[in-text-ad-2]

Source: Thinkstock
25. Vermont
> 2017 unemployment: 3% (6th lowest)
> Pension funded ratio: 64.3% (19th lowest)
> 1 yr. GDP growth: +1.3% (21st lowest)
> Poverty rate: 11.3% (17th lowest)
> Moody’s credit rating and outlook: Aa1/Stable
Vermont excels in a number of economic and quality of life measures. The state is relatively safe — there were just 166 violent crimes for every 100,000 people in Vermont in 2017, the second lowest violent crime rate of any state, and less than half the comparable national rate. Additionally, Vermonters workers are less likely than workers in other states to be out of a job. Vermont’s 3.0% annual unemployment rate is among the lowest in the country and well below the 4.4% national rate.
Still, Vermont is lagging in several measures. For example, the state’s 1.3% economic growth in 2017 was sluggish compared to the 2.2% national GDP growth. Additionally, Moody’s downgraded Vermont’s formerly perfect credit rating earlier this year, citing slow economic growth prospects and growing long-term liabilities.

Source: Sierralara / Getty Images
26. Wyoming
> 2017 unemployment: 4.2% (24th lowest)
> Pension funded ratio: 73.3% (18th highest)
> 1 yr. GDP growth: +1.4% (22nd lowest)
> Poverty rate: 11.3% (17th lowest)
> Moody’s credit rating and outlook: N/A
Wyoming ranked among the five best-managed states for seven years, from 2010 through 2016. However, the resource-rich state is heavily dependent on its coal industry, which has taken a beating in recent years. Though Wyoming still accounts for two-fifths of total U.S. coal production, production in the state is down considerably from $467.6 million short tons in 2008 to $316.5 million in 2017.
Still, Wyoming is a fiscally well-managed state. Its total debt amounts to just 13.1% of its total revenue, the smallest share of any state. Also, Wyoming has the equivalent of 91.2% of its annual expenditures saved in a rainy day fund, the largest share of any state. In comparison, the average rainy day fund across all states amounts to just 7.2% of annual spending.
[in-text-ad]

Source: ablokhin / Getty Images
27. Virginia
> 2017 unemployment: 3.8% (19th lowest)
> Pension funded ratio: 72.4% (20th highest)
> 1 yr. GDP growth: +1.8% (22nd highest)
> Poverty rate: 10.6% (11th lowest)
> Moody’s credit rating and outlook: Aaa/Stable
Economic growth has been relatively slow in Virginia in recent years. The state’s labor force has grown by just 1.7% since 2013, half the comparable national labor force growth of 3.4%. Similarly, in the last year, Virginia’s 1.8% economic growth trailed the 2.2% nationwide GDP growth. Still, Virginia outperforms most states in several other important measures. The state has more of its pension obligations funded than most states, and it has a perfect credit rating and stable outlook from Moody’s.
Recently, Arlington, Virginia, was selected from a pool of over 200 contenders as a location for one of Amazon’s second headquarters. Amazon will invest $2.5 billion in the location and bring about 25,000 new high-paying jobs to the state.
 24/7 Wall St.
Source: SeanPavonePhoto / Getty Images
28. Maine
> 2017 unemployment: 3.3% (10th lowest)
> Pension funded ratio: 77.3% (14th highest)
> 1 yr. GDP growth: +1.9% (20th highest)
> Poverty rate: 11.1% (15th lowest)
> Moody’s credit rating and outlook: Aa2/Stable
Maine is one of the oldest states in the country, with one in every five residents age 65 or older. While the state currently has funding for 77.3% of its pension obligations, a rapidly aging population means that there will be more retirees and fewer workers their health care benefits and retirement income. In an effort to draw in more younger residents, Maine is offering tax credits to recent college graduates who return to the state.
Maine’s job market is relatively strong with just 3.3% of workers unemployed in 2017, well below the 4.4% national unemployment rate. Maine is also the safest state to live in the country. There were just 121 violent crimes for every 100,000 Maine residents in 2017, less than one third of the comparable national violent crime rate.

Source: miroslav_1 / iStock
29. Arizona
> 2017 unemployment: 4.9% (11th highest)
> Pension funded ratio: 60.4% (15th lowest)
> 1 yr. GDP growth: +3.1% (4th highest)
> Poverty rate: 14.9% (12th highest)
> Moody’s credit rating and outlook: Aa2/Stable
Arizona ranked among the six worst-run states as recently as 2014. Improving tremendously in recent years, it now ranks closer to the middle of all states. Last year, Arizona had near nation-leading GDP growth of 3.1%, well above the 2.2% national figure. Economic growth has been bolstered by an influx of new residents. Arizona’s population grew by a net total of 1.1% due to migration from mid-2016 to mid-2017, more than all but four other states.
Arizona still has some lingering problems, however. Its 4.9% annual unemployment rate is higher than most states and than the 4.4% national rate. Additionally, there were 508 violent crimes for every 100,000 people in the state in 2017, well above the U.S. violent crime rate of 383 per 100,000.
[in-text-ad-2]
Source: TraceRouda / Getty Images
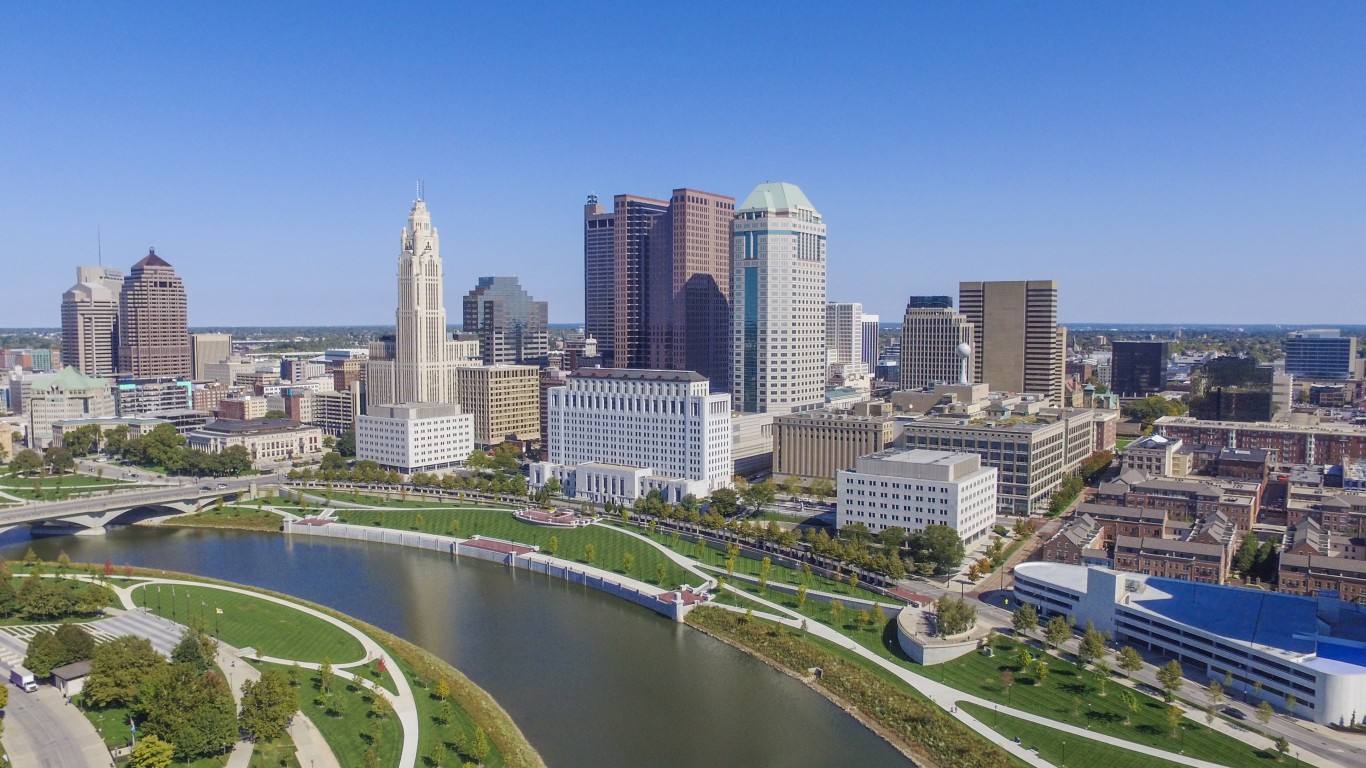
30. Ohio
> 2017 unemployment: 5% (8th highest)
> Pension funded ratio: 72.0% (22nd highest)
> 1 yr. GDP growth: +1.6% (25th highest)
> Poverty rate: 14% (18th highest)
> Moody’s credit rating and outlook: Aa1/Stable
Economic growth in Ohio was slower than typical in 2017. The state’s 1.6% GDP growth was below the 2.2% national GDP growth that year. In the last four years, Ohio’s labor force grew by just 1.1%, even as the number of workers nationwide climbed by 3.4%. The weak job market may be a drag on growth and detering many would-be job seekers. In 2017, 5.0% of Ohio’s workforce was unemployed, one of the highest unemployment rates of any state.
2018 marks the final year John Kasich will serve as Ohio governor. Kasich, a Republican, controversially expanded Medicaid under the Affordable Care Act, and partially as a result, the state’s uninsured rate dropped from 11.0% in 2013, the year before the Medicaid expansion took effect, to 6.0% in 2017.

Source: TomasSereda / Getty Images
31. New York
> 2017 unemployment: 4.7% (16th highest)
> Pension funded ratio: 90.6% (4th highest)
> 1 yr. GDP growth: +1.9% (20th highest)
> Poverty rate: 14.1% (16th highest)
> Moody’s credit rating and outlook: Aa1/Stable
As the population ages and a growing number of Americans enter retirement, many states are facing a dire pension crisis. New York is not one of them. The Empire State has funding for 90.6% of its pension obligations, well above the 65.9% average across all states. Still, New York is not without some budgetary shortcomings. The state has the equivalent of just 2.4% of its annual spending saved in a rainy day fund, smallest budget reserves of any state.
Like in many states that do not rank especially well, people are leaving New York faster than they are coming in. Between mid-2016 and mid-2017, over 60,000 more people left New York than moved to the state.
[in-text-ad]

Source: Thinkstock
32. South Dakota
> 2017 unemployment: 3.3% (10th lowest)
> Pension funded ratio: 96.9% (2nd highest)
> 1 yr. GDP growth: +0% (5th lowest)
> Poverty rate: 13% (25th highest)
> Moody’s credit rating and outlook: Aaa/Stable
South Dakota is in a better position to fully pay the pensions of former public employees than every other state except Wisconsin. South Dakota has funding for 96.9% of its total pension obligations, compared to the 65.9% average across all states. In other ways, South Dakota appears poorly managed from a fiscal standpoint. For example, the state has one of the lowest per capita tax revenues in the country and some of the most debt as a share of revenue. Despite high debt, Moody’s gives the state high marks for its ability to pay liabilities as South Dakota is one of just 14 states with a perfect credit rating and stable outlook.
Serious crimes are also more common in South Dakota than in much of the country. There were 434 violent crimes for every 100,000 people in the state in 2017, compared to the national violent crime rate of 383 per 100,000.

Source: Thinkstock
33. South Carolina
> 2017 unemployment: 4.3% (25th highest)
> Pension funded ratio: 53.8% (10th lowest)
> 1 yr. GDP growth: +2.6% (9th highest)
> Poverty rate: 15.4% (9th highest)
> Moody’s credit rating and outlook: Aaa/Stable
Violence is a bigger problem in South Carolina than in most other states. There were 506 violent crimes for every 100,000 people in the state, far more than the national violent crime rate of 383 per 100,000. Financial hardship is also relatively common in the state. South Carolina’s 15.4% poverty rate is well above the 13.4% national rate.
In other ways, South Carolina is doing relatively well. People are moving to the state at a relatively rapid pace, and in the last year, South Carolina’s GDP increased by 2.6%, faster than most states and the 2.2% national economic growth that year. South Carolina also has a perfect credit rating and stable outlook from Moody’s.
Source: Thinkstock
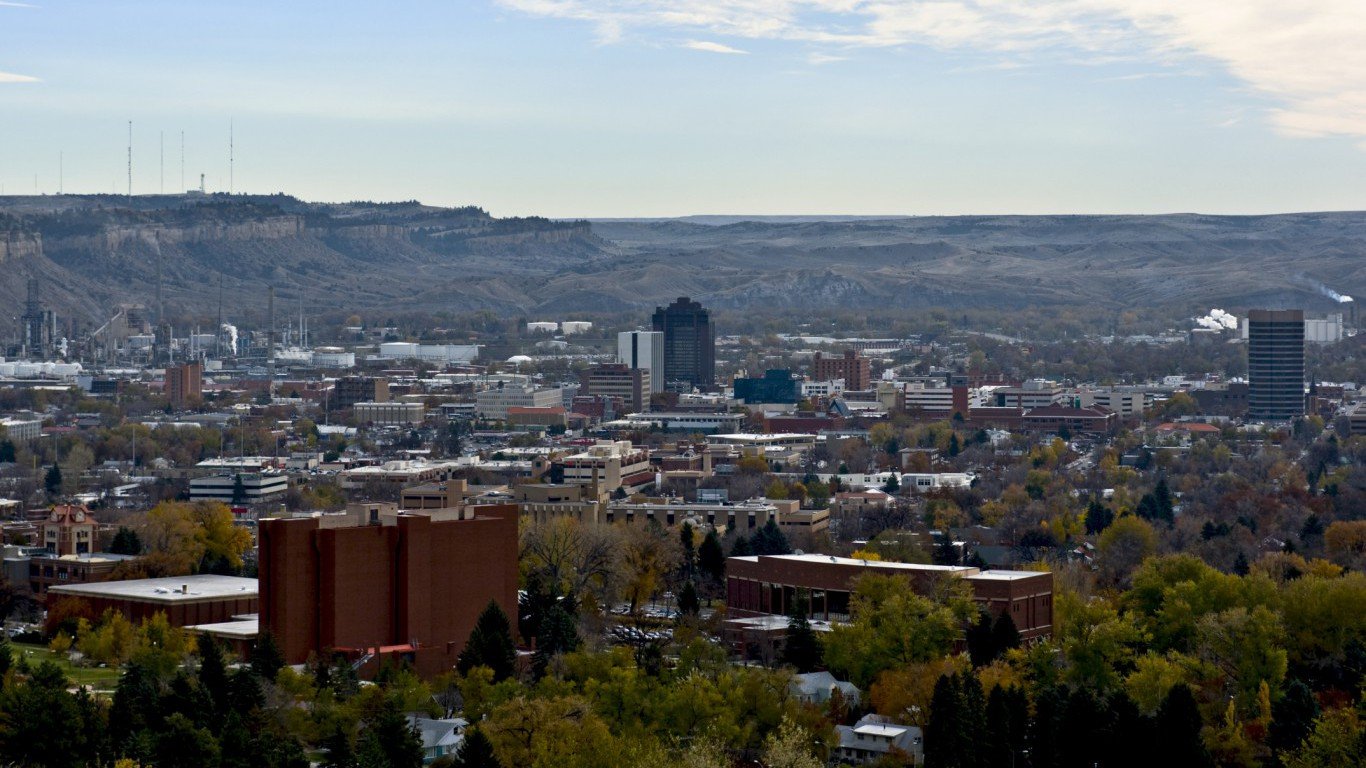
34. Montana
> 2017 unemployment: 4% (21st lowest)
> Pension funded ratio: 71.2% (25th highest)
> 1 yr. GDP growth: +0.3% (12th lowest)
> Poverty rate: 12.5% (22nd lowest)
> Moody’s credit rating and outlook: Aa1/Stable
While the state legislature is currently in talks to create a budget reserve fund, Montana is one of only a handful of states with no money set aside in a rainy day fund. Economic growth in the state is also weak. Montana’s economic output inched up by just 0.3% in 2017, lagging far behind the U.S. GDP growth of 2.2%.
In other economic measures, Montana performs only slightly better than the nation as a whole. For example, in 2017, 4.0% of workers in the state were unemployed, slightly below the 4.4% national unemployment rate. Similarly, Montana has funding for 71.2% of its pension obligations, marginally more than the 65.9% average across all states.
[in-text-ad-2]

Source: SeanPavonePhoto / Getty Images
35. Connecticut
> 2017 unemployment: 4.7% (16th highest)
> Pension funded ratio: 41.4% (4th lowest)
> 1 yr. GDP growth: -1.1% (the lowest)
> Poverty rate: 9.6% (5th lowest)
> Moody’s credit rating and outlook: A1/Stable
Connecticut ranks worse on this list than every other New England state except Rhode Island. The state’s economy contracted by 1.1% in 2017, the steepest GDP decline of any state. The flailing economy is likely due in part to the state’s higher than typical 4.7% annual unemployment rate and heavy outbound migration. From mid-2016 to mid-2017, 4,500 more people left the state than moved there.
Voters in Connecticut elected Democrat Ned Lamont as the new governor in November 2018 by a narrow margin over Republican Bob Stefanowski. Economic reform was a central component of Lamont’s campaign message. Lamont will replace Gov. Dannel Malloy, whose 14.6% approval rating leading up to the election was the lowest of any sitting U.S. governor in the country.

Source: SeanPavonePhoto / Getty Images
36. Pennsylvania
> 2017 unemployment: 4.9% (11th highest)
> Pension funded ratio: 52.6% (7th lowest)
> 1 yr. GDP growth: +2.2% (15th highest)
> Poverty rate: 12.5% (22nd lowest)
> Moody’s credit rating and outlook: Aa3/Stable
After Rhode Island and neighboring New Jersey, Pennsylvania ranks as the worst run state in the Northeast. Pennsylvania has enough money set aside to meet only about half its total pension obligations, a far smaller share than most states. While Gov. Wolf recently announced the state would allocate roughly $22 million to its rainy day fund, Pennsylvania is also one of just a handful of states with no money currently set aside to fund government operations in the event of an emergency. Pennsylvania’s job market is also relatively weak. In 2017, 4.9% of workers in the state were unemployed, well above the comparable 4.4% national unemployment rate.
Economic growth in Pennsylvania is on pace with that of the nation. The GDP of the United States and Pennsylvania grew by 2.2% in 2017.
[in-text-ad]

Source: Creative-Family / Getty Images
37. New Jersey
> 2017 unemployment: 4.6% (20th highest)
> Pension funded ratio: 30.9% (the lowest)
> 1 yr. GDP growth: +1.6% (25th highest)
> Poverty rate: 10% (7th lowest)
> Moody’s credit rating and outlook: A3/Stable
New Jersey lags behind the nation as a whole in a number of key economic measures. For one, the state is facing the worst pension crisis in the country, with funding for just 30.9% of its total pension obligations. As more Garden State residents reach retirement, the state’s shrinking workforce is not likely to help with the pension crisis. The number of workers in the state has fallen by 0.7% over the last five years. The state is also hampered by slow economic growth and high unemployment in comparison with nationwide averages.
Earlier this year, Republican Chris Christie left the New Jersey governor’s office with the lowest approval rating in state history. The sitting governor, Democrat Phil Murphy, won the office after running a campaign that centered largely on fixing the economy and getting the state on track to a fully funded pension system.
 24/7 Wall St.
Source: Thinkstock
38. Arkansas
> 2017 unemployment: 3.7% (16th lowest)
> Pension funded ratio: 76.9% (15th highest)
> 1 yr. GDP growth: +0.3% (12th lowest)
> Poverty rate: 16.4% (7th highest)
> Moody’s credit rating and outlook: Aa1/Stable
Economic growth is far slower in Arkansas than in most other states. Arkansas’s GDP growth was just 0.3% in 2017, even as the U.S. economy grew by 2.2%. The state also has very little in the way of emergency funding with the equivalent of just 2.3% of its annual expenditures saved in a rainy day fund. Among state residents, economic hardship is relatively common. Some 16.4% live below the poverty line, one of the highest poverty rates of any state.
Improved educational outcomes among Arkansas residents would likely help improve economic conditions. Currently, just 86.7% of adults in the state have a high school diploma, among the 10 lowest high school education attainment rates of any state.

Source: SeanPavonePhoto / Getty Images
39. Alabama
> 2017 unemployment: 4.4% (22nd highest)
> Pension funded ratio: 67.2% (24th lowest)
> 1 yr. GDP growth: +1.6% (25th highest)
> Poverty rate: 16.9% (6th highest)
> Moody’s credit rating and outlook: Aa1/Stable
Overall quality of life in Alabama is weighed down by poverty and crime. The state’s 16.9% poverty rate is well above the 13.4% national poverty rate, and its violent crime rate of 524 crimes per 100,000 people is significantly higher than the nationwide rate of 383 per 100,000. While Alabama’s 4.4% unemployment rate is in line with the national rate, its 1.6% 2017 GDP growth was sluggish relative the 2.2% national economic growth.
Greater educational attainment would likely result in improved economic and social conditions in Alabama. Just 86.5% of adults in the state have a high school diploma and 25.5% have a bachelor’s degree, the seventh and eighth lowest shares, respectively, of all states.
[in-text-ad-2]

Source: DenisTangneyJr / Getty Images
40. Rhode Island
> 2017 unemployment: 4.5% (21st highest)
> Pension funded ratio: 53.7% (9th lowest)
> 1 yr. GDP growth: +0.7% (15th lowest)
> Poverty rate: 11.6% (20th lowest)
> Moody’s credit rating and outlook: Aa2/Stable
Rhode Island ranks as the worst-run state in New England and the broader Northeast. Rhode Island has accumulated some of the most debt of any state, and is one of just four states in which total outstanding debt is greater than annual revenue. Partially as a result, Rhode Island allocated 6.1% of its general expenditure to interest payments alone, the largest share of any state.
Rhode Island is partially economically hamstrung by relatively high unemployment, a shrinking labor force, and sluggish growth. Last year, 4.5% of workers in the state were unemployed, slightly more than the 4.4% national unemployment rate. Over the last four years, the number of people working or looking for work in the state fell by 0.4%, even as the U.S. labor force grew 3.4%. Rhode Island’s 0.7% GDP growth in 2017 was less than one third of the 2.2% national growth.
Source: Jamie Squire / Getty Images
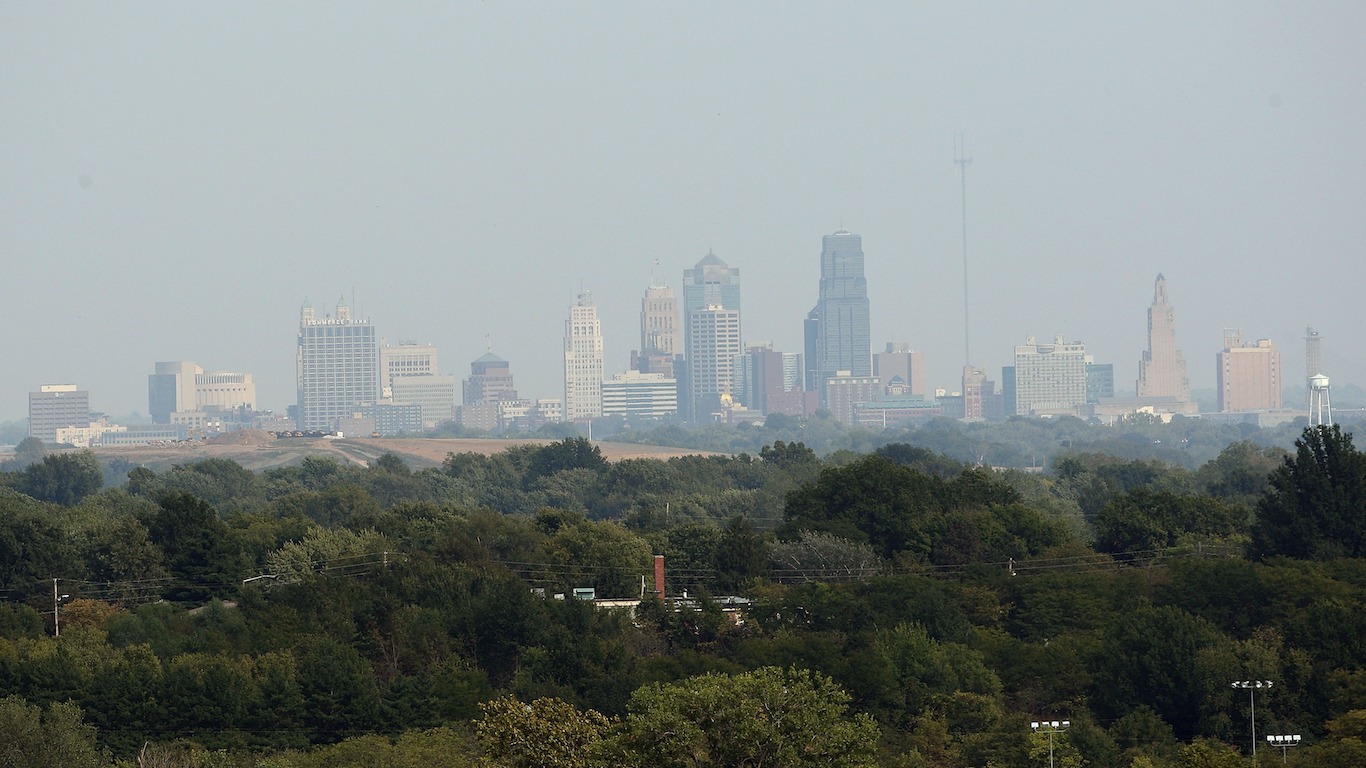
41. Kansas
> 2017 unemployment: 3.6% (15th lowest)
> Pension funded ratio: 65.1% (21st lowest)
> 1 yr. GDP growth: +0.2% (9th lowest)
> Poverty rate: 11.9% (21st lowest)
> Moody’s credit rating and outlook: Aa2/Stable
Under former Republican Gov. Sam Brownback, who implemented a policy of steep income tax reductions, Kansas has had multiple years of budget shortfalls since 2012. While state lawmakers overrode Brownback’s policy in 2017, a move that resulted in a revenue surplus, Kansas remains one of only a handful of states with no money set aside in a rainy day fund. In January, Democrat Laura Kelly will take the governor’s office from Lt. Gov. Jeff Colyer, who took office when Browback accepted an ambassadorship. Kelly ran on a platform of rejecting Brownback’s tax policies.
From mid-2016 to mid-2017, about 8,000 more people left Kansas than moved to the state, likely contributing to a declining workforce and sluggish economic growth. Over the last four years the number of people working or looking for work in Kansas fell by 0.5%, even as the labor force expanded in most states. The state’s economy grew by just 0.2% in 2017, a fraction of the 2.2% national GDP growth.
[in-text-ad]

Source: Thinkstock
42. Missouri
> 2017 unemployment: 3.8% (19th lowest)
> Pension funded ratio: 76.7% (16th highest)
> 1 yr. GDP growth: +0.9% (17th lowest)
> Poverty rate: 13.4% (21st highest)
> Moody’s credit rating and outlook: Aaa/Stable
Missouri has some of the lowest taxes of any state. The state collected the equivalent of just $2,010 per capita in 2016, more than $800 below the average across states. Lawmakers in the state have continually cut taxes in recent years, and now Missouri could be facing a budget shortfall next year. Currently, the state has the equivalent of just 3.1% of its budget saved in a rainy day fund, less than half the average amount among all states. The state’s debt load is equal to 57.8% of its total revenue, slightly more than the 54.3% average debt-to-revenue ratio across all states.
Economic growth is also sluggish in the state. In 2017, Missouri’s economy expanded by just 0.9%, less than half the 2.2% national GDP growth.

Source: Thinkstock
43. Kentucky
> 2017 unemployment: 4.9% (11th highest)
> Pension funded ratio: 31.4% (2nd lowest)
> 1 yr. GDP growth: +1.7% (24th highest)
> Poverty rate: 17.2% (5th highest)
> Moody’s credit rating and outlook: Aa3/Stable
One of the poorest states in the country, Kentucky’s 17.2% poverty rate is well above the 13.4% national rate. Financial hardship would likely be less common if the state’s job market were healthier. Last year, 4.9% of workers in Kentucky were unemployed, one of the higher jobless rates among states.
Kentucky has also done a relatively poor job managing its own finances with the future in mind. Along with New Jersey, Kentucky is one of only two states with funding for less than one third of its pension obligations. Additionally, Kentucky has the equivalent of just 0.6% of its annual budget saved in a rainy day fund.

Source: Thinkstock
44. Illinois
> 2017 unemployment: 5% (8th highest)
> Pension funded ratio: 35.6% (3rd lowest)
> 1 yr. GDP growth: +0.4% (13th lowest)
> Poverty rate: 12.6% (24th lowest)
> Moody’s credit rating and outlook: Baa3/Stable
Few states face budget a crisis as severe as that of Illinois. Illinois effectively has no money set aside in a rainy day fund, and only has enough funding to meet 35.6% of its pension obligations. The state also has enormous debt obligations, equal to 87.2% of its total revenue. As result, Illinois has the lowest Moody’s credit rating of any state.
Hampered by political gridlock, Illinois passed its first budget in two years in 2017. According to the Governor’s Office of Management and Budget, the state budget for fiscal 2019, which passed early this year, is out of balance by as much as $1.2 billion. Because of its high debt load, Illinois spends 5.1% of its annual budget on interest payments, more than twice the national average.
[in-text-ad-2]

Source: Davel5957 / Getty Images
45. Oklahoma
> 2017 unemployment: 4.3% (25th highest)
> Pension funded ratio: 71.9% (24th highest)
> 1 yr. GDP growth: +0.7% (15th lowest)
> Poverty rate: 15.8% (8th highest)
> Moody’s credit rating and outlook: Aa2/Stable
Oklahoma is one of many states with a heavily energy-dependent economy to rank among the worst-run. Oklahoma is one of the top five petroleum producing states and, due in large part to the recent decline in oil prices, economic growth is sluggish in Oklahoma. The state’s GDP grew by just 0.7% in 2017, well below most states’ growth and the national economic growth of 2.2%.
Oklahoma is also a relatively dangerous state. There were 456 violent crimes for every 100,000 people in the state in 2017, compared to the national violent crime rate of 383 per 100,000.

Source: BackyardProduction / iStock
46. West Virginia
> 2017 unemployment: 5.2% (3rd highest)
> Pension funded ratio: 71.9% (23rd highest)
> 1 yr. GDP growth: +2.2% (15th highest)
> Poverty rate: 19.1% (4th highest)
> Moody’s credit rating and outlook: Aa2/Stable
West Virginia is one of the poorest states in the country. The typical household in the state earns just $43,469 a year and 19.1% of the population lives in poverty. For reference, the typical American household earns $60,336 a year, and the national poverty rate is 13.4%. A weak job market is partially to blame for low incomes. In 2017, 5.2% of workers in West Virginia were unemployed, the third highest unemployment rate of any state.
Some residents may be leaving West Virginia because of the lack of jobs. From mid-2016 to mid-2017, 9,640 more people left the state than moved in, the fifth largest decline when adjusted for population. Additionally, over the last four years, the number of people working or looking for work in West Virginia fell by 2.5%.
[in-text-ad]

Source: Thinkstock
47. Mississippi
> 2017 unemployment: 5.1% (5th highest)
> Pension funded ratio: 57.5% (11th lowest)
> 1 yr. GDP growth: +0.1% (8th lowest)
> Poverty rate: 19.8% (the highest)
> Moody’s credit rating and outlook: Aa2/Stable
Mississippi is one of the poorest states in the country. Nearly one in every five state residents live below the poverty line, the largest share of any state. A stronger job market would likely help reduce the state’s poverty rate. Mississippi’s annual unemployment rate of 5.1% is one of the highest of any states and well above the 4.4% national unemployment rate.
Poverty and a weak job market would likely improve with greater educational attainment. Just 84.4% of adults in Mississippi have a high school diploma, nearly the smallest share of any state. Education may be less of a budgetary priority in Mississippi than in most other states. Just 33.7% Mississippi’s annual spending goes to education, below the 35.3% average spending across all states.
 24/7 Wall St.
Source: urbanglimpses / Getty Images
48. Alaska
> 2017 unemployment: 7.2% (the highest)
> Pension funded ratio: 62.7% (16th lowest)
> 1 yr. GDP growth: -0.5% (4th lowest)
> Poverty rate: 11.1% (15th lowest)
> Moody’s credit rating and outlook: Aa3/Stable
A resource-rich state that depends heavily on the oil industry, Alaska has struggled since the price of oil collapsed in 2014. Alaska’s economy contracted by 0.5% in 2017, even as the U.S. economy grew by 2.2%. Joblessness is also a serious problem in Alaska. In 2017, 7.2% of the Alaska workforce was unemployed, the largest share of any state and well above the 4.4% national unemployment rate.
People are leaving Alaska far faster than they are coming in. Alaska’s population declined by a net total of 1.1% due to migration from mid-2016 to mid-2017, nearly the largest such decline of any state.

Source: Thinkstock
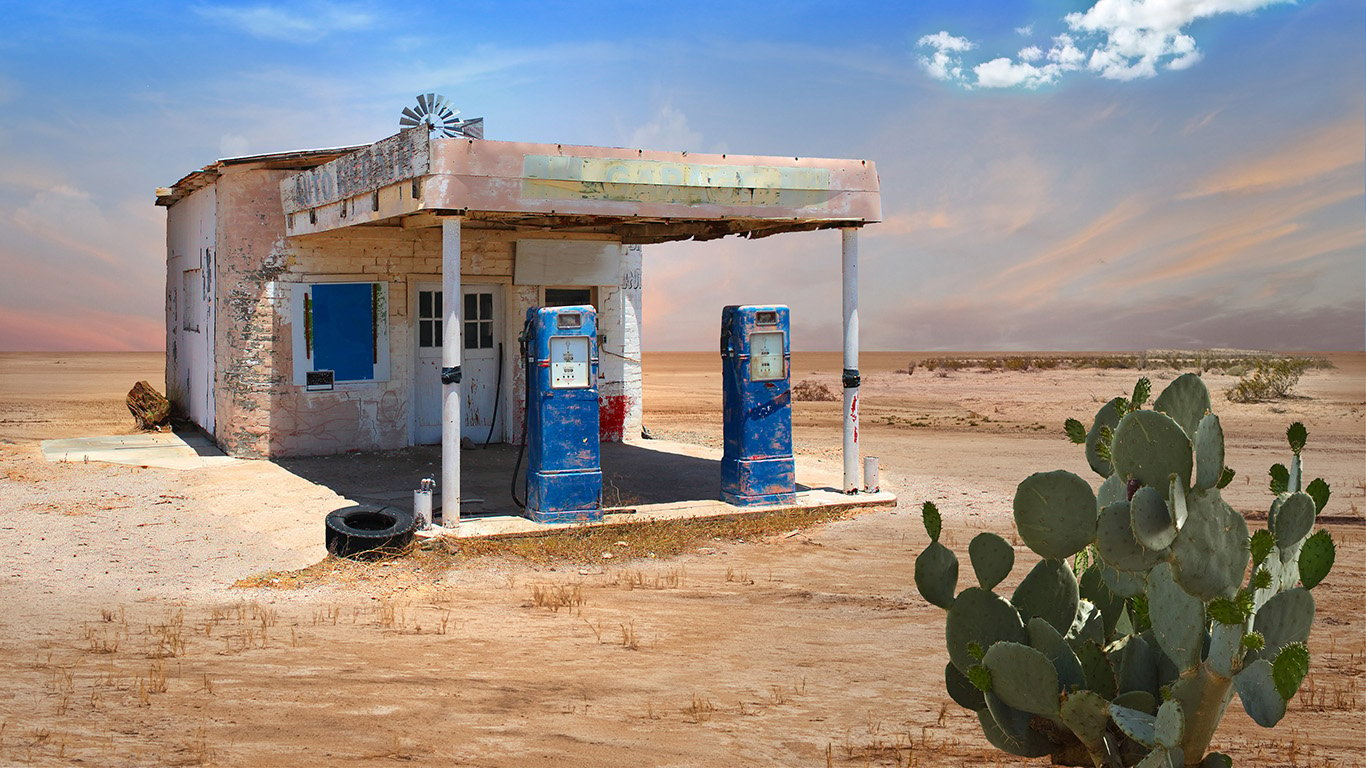
49. New Mexico
> 2017 unemployment: 6.2% (2nd highest)
> Pension funded ratio: 65.4% (22nd lowest)
> 1 yr. GDP growth: +0.1% (8th lowest)
> Poverty rate: 19.7% (3rd highest)
> Moody’s credit rating and outlook: Aa2/Stable
Last year, 6.2% of New Mexico’s labor force was unemployed, the second highest unemployment rate of any state and well above the comparable 4.4% national rate. The weak job market makes it difficult for many in the state to escape poverty. Some 6.6% of families in New Mexico earn less than $10,000 a year, the largest share of any state. Overall quality of life in New Mexico is further hamstrung by the prevalence of violence. There were 783 violent crimes for every 100,000 people in the state in 2017, more than double the national violent crime rate of 383 violent crimes per 100,000.
Economic growth is stagnant in New Mexico. The state’s economy grew by just 0.1% in 2017, even as the U.S. economy grew 2.2%.
[in-text-ad-2]

Source: Thinkstock
50. Louisiana
> 2017 unemployment: 5.1% (5th highest)
> Pension funded ratio: 59.7% (14th lowest)
> 1 yr. GDP growth: -0.8% (2nd lowest)
> Poverty rate: 19.7% (3rd highest)
> Moody’s credit rating and outlook: Aa3/Stable
Louisiana ranks as the worst-run state for the second year in a row. The state’s economy shrank by 0.8% last year, even as U.S. GDP expanded by 2.2%. Economic growth is desperately needed in the state as 5.1% of the workforce was out of a job in 2017, and nearly one in every five residents currently live below the poverty line.
The state government’s finances are also in relatively bad shape. Louisiana has a higher than typical debt load and the equivalent of just 3.9% of its annual spending saved in rainy day fund, far less than the 7.2% average across all states. Louisiana is a top petroleum producing state and has been hurt considerably by the 2014 drop in oil prices and the ongoing sector volatility.
Detailed Findings & Methodology
Many of the metrics that can be used to assess how well a state is run influence others. For example, many of the states that rank well on this list, one way or another, have been able to draw in new residents. New residents, in turn, bring in new money and new demand for goods and services, which can stimulate economic growth. Nine of the 10 states with the fastest population growth attributable solely to migration reported GDP growth at least as high as the 2.2% national GDP growth rate in 2017.
Drawing in new residents and new workers can also boost tax revenue and help meet budgetary obligations, like public pension funding. Of the same 10 rapidly growing states by population, seven have better than average funding for their pension obligations.
Some states are using economic incentives to bring people in. Maine, for example, has one of the oldest populations in the country. Currently, the state is offering tax credits to recent college graduates in order to draw in younger workers to support retirement-age residents.
A strong job market is another hallmark of well-run states. Having sufficient employment opportunities for those seeking them can have wide-reaching positive effects, including boosting financial prosperity and economic growth, and gaining the ability to draw new residents seeking work into the state. Of the 10 highest ranking states on this list, Washington is the only one with a higher 2017 unemployment rate than the 4.4% rate national that year.
Many of the states ranking near the bottom of the list are heavily dependent on their energy industry. Resource-rich, petroleum-producing states like Alaska, Louisiana, and Oklahoma rank among the 10 worst states, partially due to the continued effects of the global collapse in oil prices in 2014.
However, not every state that relies heavily on oil ranks poorly. Texas, for example, by far the largest petroleum-producing state, ranks on the better half of this list, with a growing population, a relatively well-funded state pension system, and relatively little debt.
To determine how well each state is run, 24/7 Wall St. constructed an index of 20 measures of state finances, economy, job market, social-economic measures, and more from a variety of sources. From the U.S. Census Bureau, we looked at net migration to a state from July 2016 to July 2017 as a percentage of the 2016 population. We reviewed each state’s finances for the 2016 fiscal year, including revenue, per capita tax collection, expenditure, and debt levels, all from the Census. Also from the Census, we reviewed the per capita value of a state’s exports.
Additionally, we considered pension funding ratios for each state from the Pew Charitable Trusts, as well as each state’s rainy day fund balance as a percentage of total general fund expenditures estimated for fiscal 2018 from The National Association of State Budget Officers. NASBO defines rainy day funds as “budget stabilization funds set aside to respond to unforeseen circumstances.” From credit rating agency Moody’s Investors Service, we considered government general obligation ratings — they are the most recent as of this writing.
From the U.S. Census Bureau’s 2017 American Community Survey we also considered a range of socio-economic factors to assess social outcomes and residents’ well-being. We looked at poverty, high school educational attainment, the percentage of adults without health insurance, median household income, and 1- and 5-year changes in median home value. Violent crime rates came from the FBI’s 2017 Uniform Crime Report. Annual foreclosure rates, measured as the number of housing units at some stage of the foreclosure process, were provided by housing market data tracker Attom Data Solutions and are for 2017.
To evaluate each state’s job market, we reviewed annual 2017 unemployment rates as well as jobless rates as of October 2018 from the Bureau of Labor Statistics. Additionally, we reviewed the change in a state’s labor force from 2013 to 2017. For each state’s unemployment insurance benefits system we also considered average weekly benefit amounts and as a percentage of the average weekly wage, the percentage of UI claimants exhausting their benefits before finding a job, the average duration in weeks of insurance benefits, and the percentage of unemployed individuals receiving UI benefits from the Department of Labor’s Employment and Training Administration as of the twelve months ending Q1 2018.
Lastly, to assess the strength of each state’s economy, we reviewed real GDP growth rates and per capita real GDP for 2017 from the Bureau of Economic Analysis. Also from the BEA, we considered 2016 regional price parity, a proxy for an area’s cost of living.
Take This Retirement Quiz To Get Matched With An Advisor Now (Sponsored)
Are you ready for retirement? Planning for retirement can be overwhelming, that’s why it could be a good idea to speak to a fiduciary financial advisor about your goals today.
Start by taking this retirement quiz right here from SmartAsset that will match you with up to 3 financial advisors that serve your area and beyond in 5 minutes. Smart Asset is now matching over 50,000 people a month.
Click here now to get started.
Thank you for reading! Have some feedback for us?
Contact the 24/7 Wall St. editorial team.
Editors' Picks

