
Long-term population decline can spell disaster for any economy. A shrinking population can result in labor shortages, lower tax revenue, higher per-capita debt, and weakened GDP growth. While the U.S. population has grown steadily every year for decades, not all parts of the country are benefitting equally.
Counting births and newly settled immigrants — less all deaths and people who left the country — the U.S. population grew by 0.7%, or about 2.3 million, from 2016 to 2017. On a state level, domestic migration — people moving from one state to another — typically accounts for the largest fluctuation in population, more than new births and international immigration.
People choose to move for any number of reasons. Climate, job opportunities, and regional affordability are common factors. In some states, net migration is driving population growth. In others, it is driving population declines.
24/7 Wall St. reviewed the net population change by state from July 2016 to July 2017 to identify the fastest growing and shrinking states. Over that period, some states grew more than twice as fast as the nation as a whole, while others reported a population decline.
Click here to see the fastest growing states.
Click here to see the fastest shrinking states.
Click here to read our detailed findings and methodology.
Fastest Growing States
Source: nick1803 / Getty Images
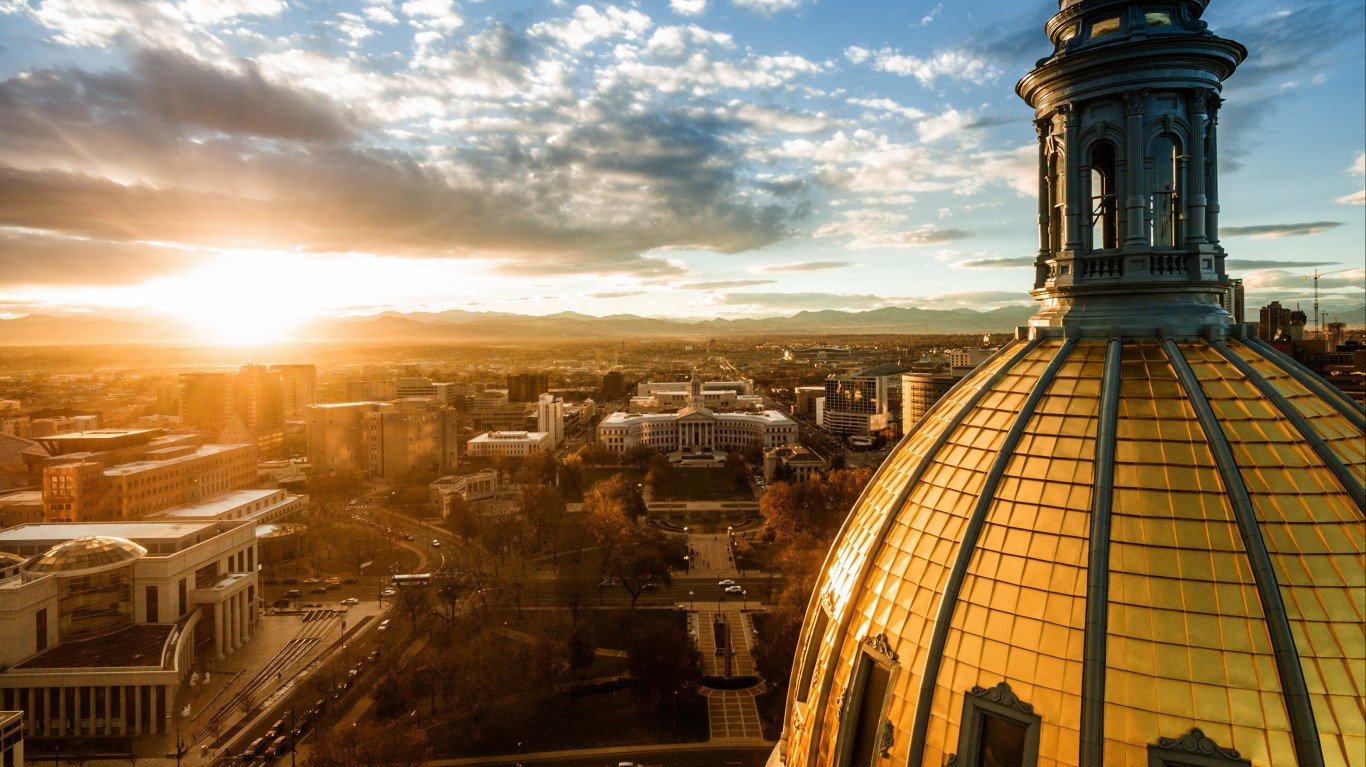
8. Colorado
> 1-yr. pop. growth: +1.39% (+77,049)
> Current population: 5.6 million (21st largest)
> 1-yr. change in median home value: 11.0% (2nd highest)
One of the fastest growing states in the country, Colorado’s population increased by 1.4% between July 2016 and July 2017. The state’s population boom is largely due to migration — people moving in from other states and countries. Nearly 47,000 more people moved to Colorado than left in the last year. Additionally, about 30,000 more people were born in the state than died over the same period.
Much of the influx may be due to employment opportunities. The state’s 2017 annual unemployment rate of 2.8% is well below the comparable 4.4% national rate.
See all stories featuring: Colorado
[in-text-ad]

Source: RoschetzkyIstockPhoto / Getty Images
7. Texas
> 1-yr. pop. growth: +1.43% (+399,734)
> Current population: 28.3 million (2nd largest)
> 1-yr. change in median home value: 6.6% (10th highest)
Texas’s population grew by nearly 400,000 from mid-2016 to mid-2017. Migration from other countries and states accounted for slightly less than half of that growth, and the remaining growth was attributable to natural growth — births minus deaths.
While the cost of living varies regionally even within a state, Texas as a whole is a relatively affordable place to live, which makes it an attractive option for new residents and families. The typical home in Texas is worth $172,200, or 2.9 times the state’s median annual household income of $59,2016. For reference, the typical home is worth 3.6 times the median income nationwide.
See all stories featuring: Texas
 24/7 Wall St.
Source: Dreamframer / Getty Images
6. Arizona
> 1-yr. pop. growth: +1.56% (+107,628)
> Current population: 7.0 million (14th largest)
> 1-yr. change in median home value: 8.5% (6th highest)
Far more people are moving to Arizona from outside the state than are leaving. Largely as a result, the state’s 1.6% population growth from mid-2016 to mid-2017 is among the highest in the country.
A growing population means growing demand for housing, and in Arizona, this has led to some of the most rapid appreciation in real estate value in the country. The typical home in the state is worth $237,700, up 8.5% from the previous year. Nationwide, the typical home appreciated by 6.1% over the same period.
See all stories featuring: Arizona
Source: Sean Pavone / Getty Images
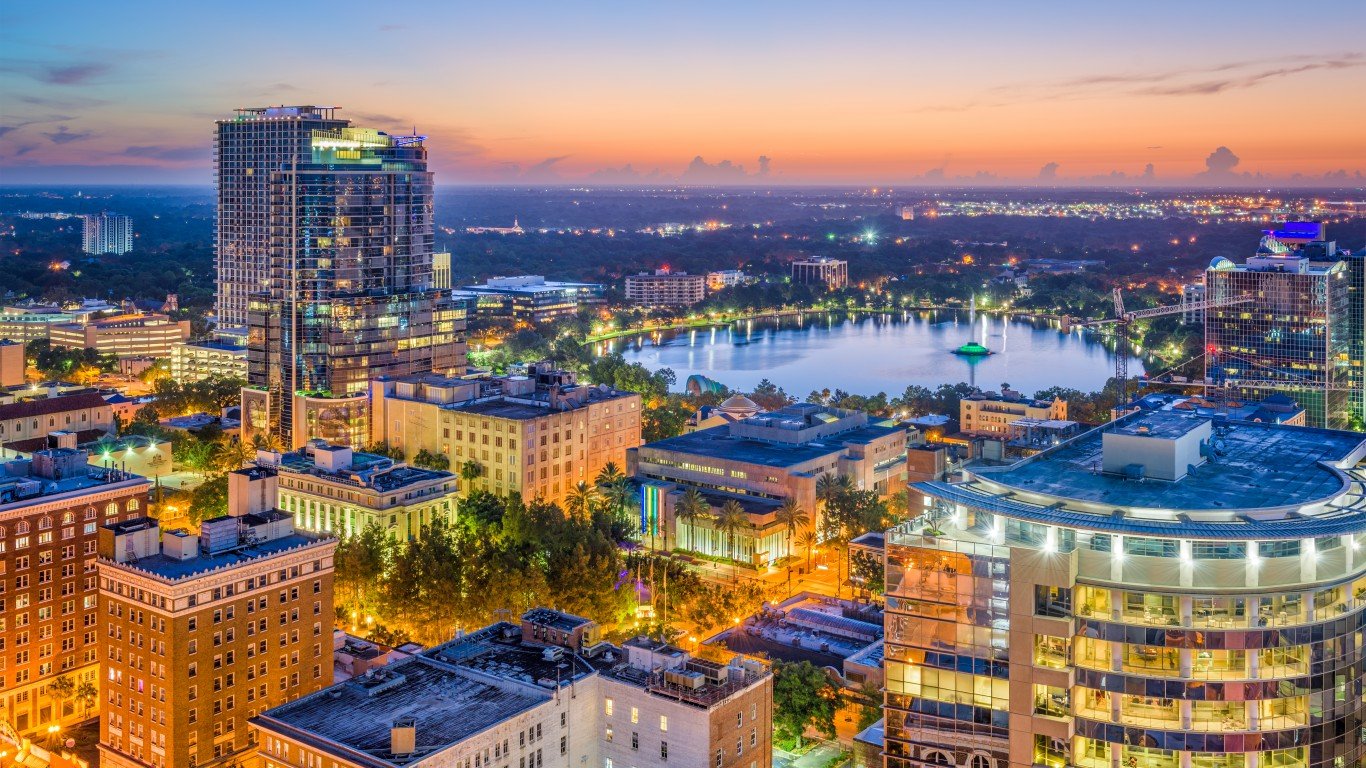
5. Florida
> 1-yr. pop. growth: +1.59% (+327,811)
> Current population: 21.0 million (3rd largest)
> 1-yr. change in median home value: 8.2% (7th highest)
Florida reported a larger net increase of residents from other parts of the United States from 2016 to 2017 than any other state. It also had the second largest influx of international migrants among states. Together, 305,019 more people moved to the Sunshine State than left between 2016 and 2017. When factoring in births, the state was fifth fastest growing in the country over that period.
Though Florida’s population has been among the fastest growing in the last decade, growing demand for housing has not been enough to raise housing values back to their pre-recession levels. The typical home in Florida is worth $214,000, about $16,300 less than the median home value in the state in 2007.
See all stories featuring: Florida
Source: gregobagel / Getty Images
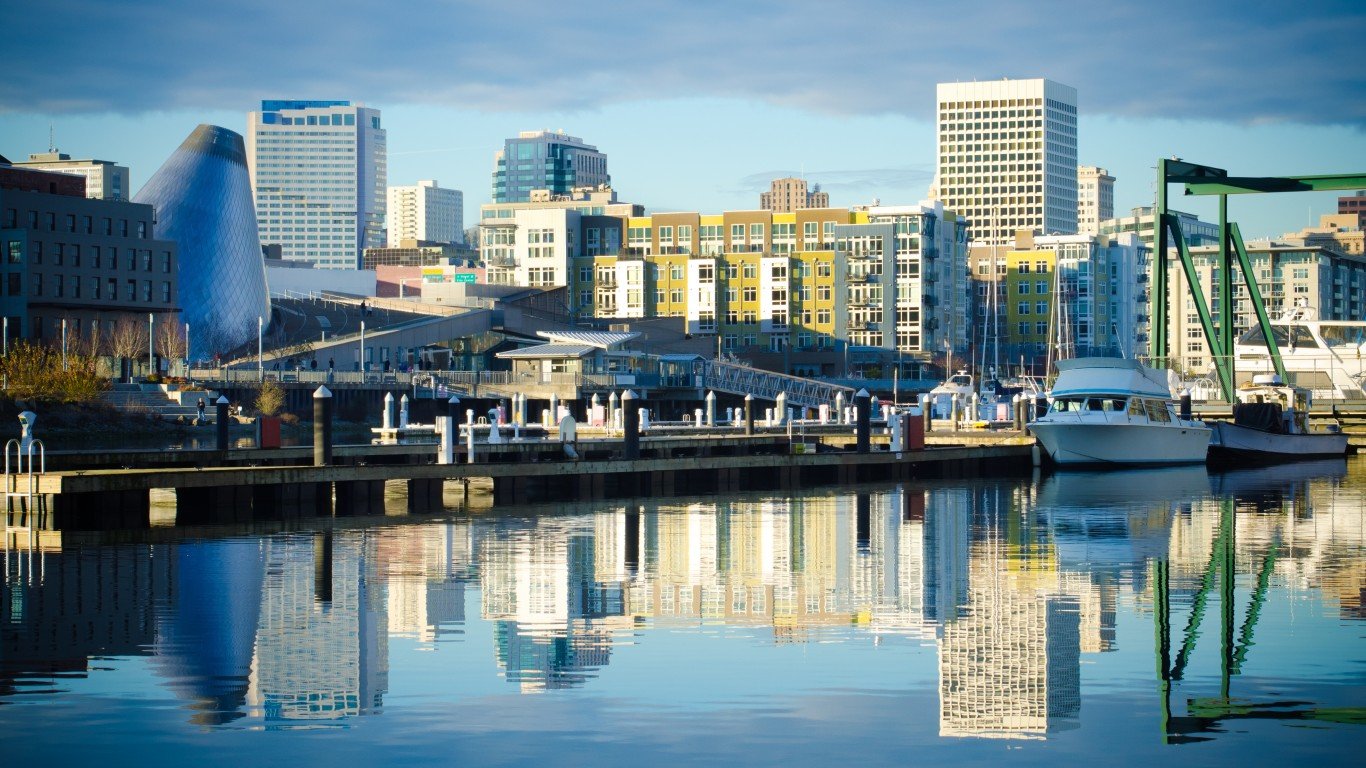
4. Washington
> 1-yr. pop. growth: +1.71% (+124,809)
> Current population: 7.4 million (13th largest)
> 1-yr. change in median home value: 10.6% (3rd highest)
Over 90,000 more people moved to Washington state than left between 2016 and 2017, and there were 34,000 more births than deaths in the state over the same period. Washington’s growing population has brought more job seekers to an already strained labor market. The state’s annual unemployment rate stands at 4.8%, well above the 4.4% national unemployment rate in 2017.
New residents are also likely driving up real estate prices in an already expensive state. The typical home in Washington is worth $339,000, 10.6% more than the median value of $306,400 in 2016.
[in-text-ad]
See all stories featuring: Washington
Source: Adventure_Photo / Getty Images
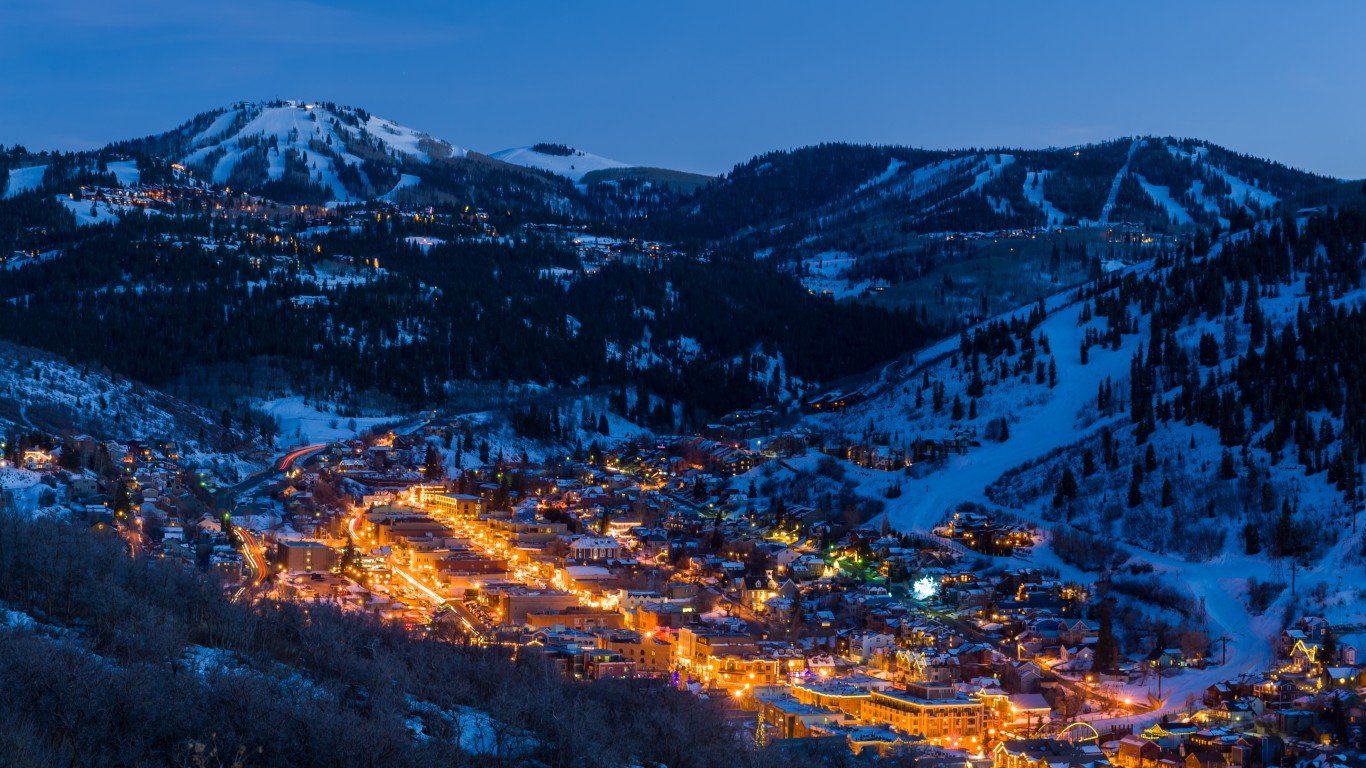
3. Utah
> 1-yr. pop. growth: +1.89% (+57,512)
> Current population: 3.1 million (20th smallest)
> 1-yr. change in median home value: 9.9% (4th highest)
Unlike nearly every other rapidly growing state, a high rate of births versus deaths accounted for the majority of population growth in Utah between mid-2016 and mid-2017. Last year, Utah had the highest birth rate and the fewest deaths per capita of any state.
The state’s higher-than-average natural growth rate is partially attributable to its large Mormon population. Nearly 62% of Utah residents identify as Mormon, and according to a study conducted by the Pew Research Center, Mormons have more children than Americans of any other religious group. Mormon adults have an average of 3.4 children compared to 2.2 children among all Christians and 2.1 children among all American adults.
See all stories featuring: Utah
Source: ddub3429 / Getty Images
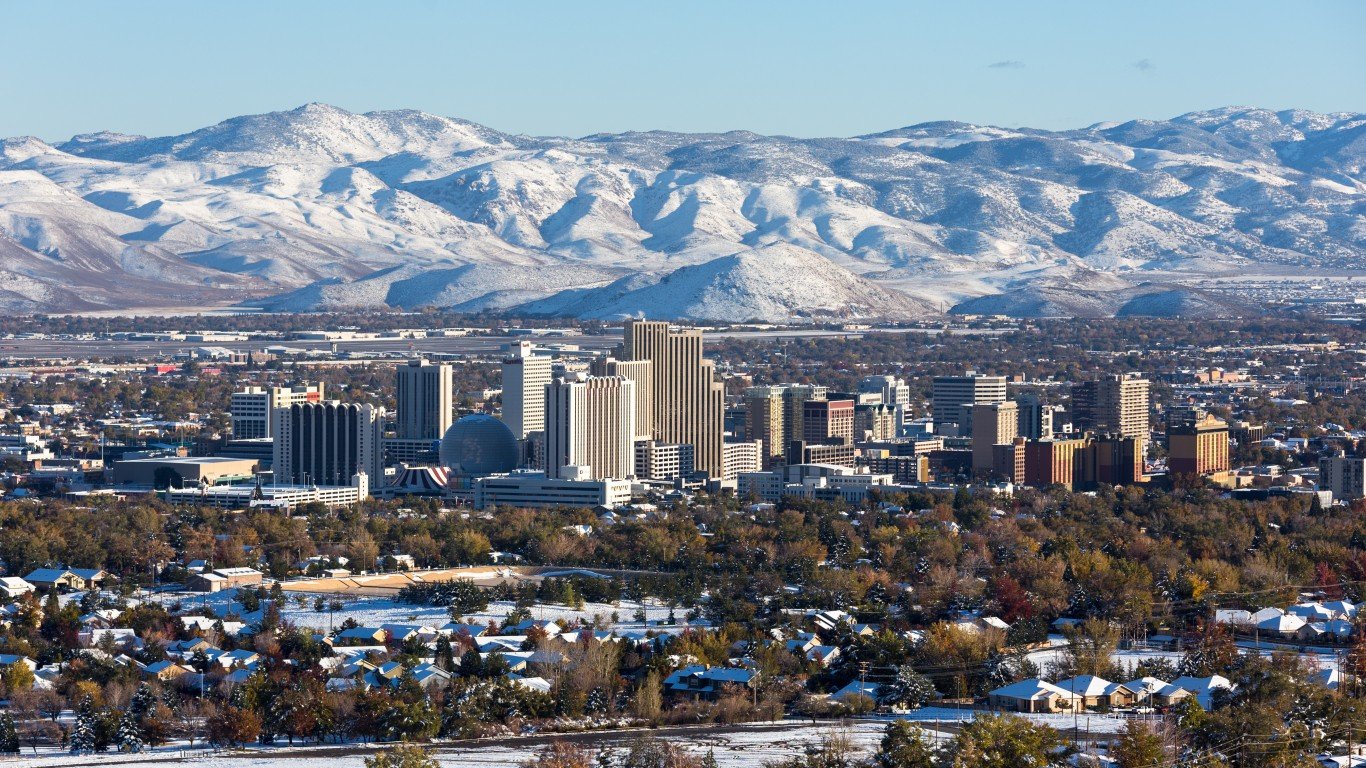
2. Nevada
> 1-yr. pop. growth: +2.00% (+58,785)
> Current population: 3.0 million (18th smallest)
> 1-yr. change in median home value: 7.8% (8th highest)
Nevada’s population grew by 2% from mid-2016 to mid-2017, the largest increase of any state after Idaho. About 46,000 more people moved to Nevada than left in that period, accounting for nearly 80% of the state’s total population growth. A growing population means a growing demand for housing, and between 2016 and 2017, real estate rental and leasing was the fastest growing industry in the state by total economic output.
The growing population has also led to rising home prices. However, because Nevada was one of the states hardest hit by the housing market collapse, the state’s median home value of $258,200 remains below the pre-recession median value of $311,300.
See all stories featuring: Nevada
Source: knowlesgallery / Getty Images
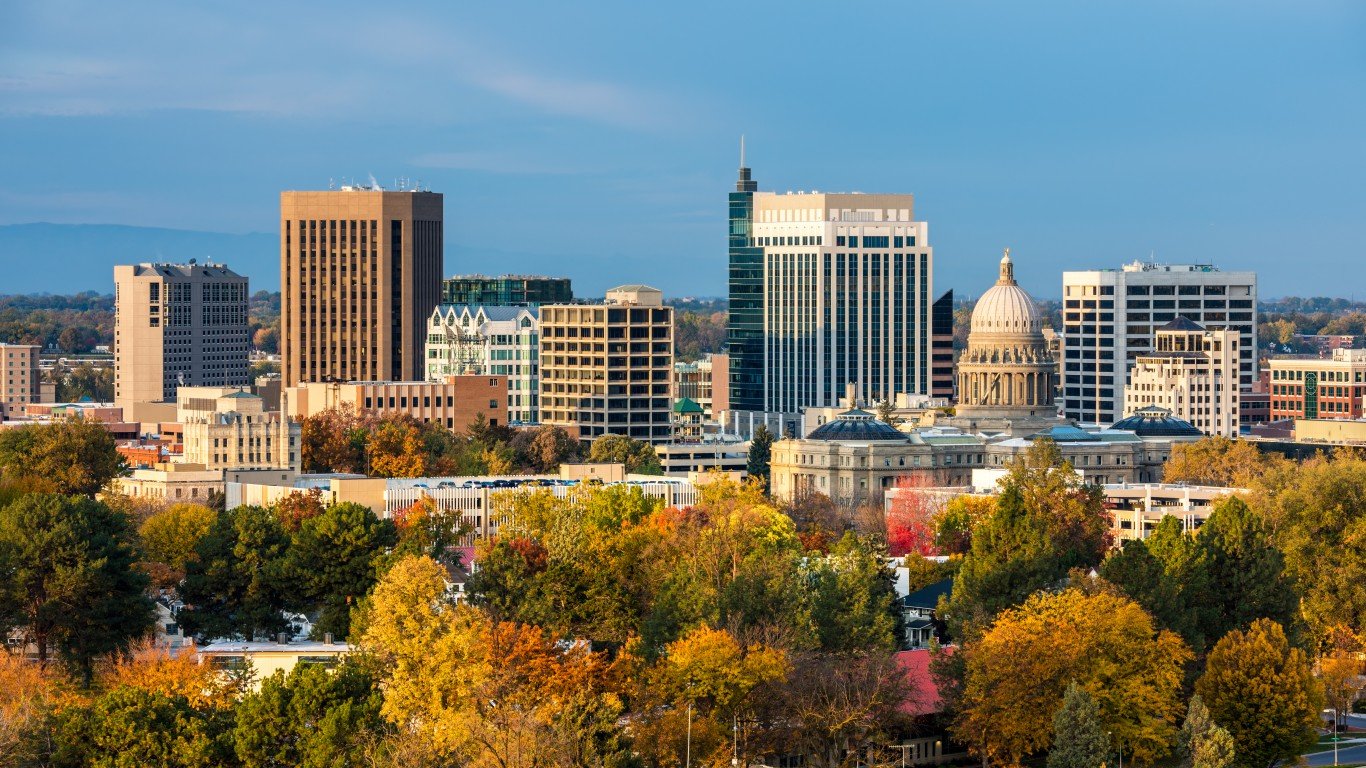
1. Idaho
> 1-yr. pop. growth: +2.20% (+36,917)
> Current population: 1.7 million (12th smallest)
Idaho’s population is booming. In the past year, the state’s population grew by a nation-leading 2.2%. The vast majority of the 37,000 new residents moved there from different states. Several factors are drawing Americans to the state. For one, Idaho is relatively affordable. Goods and services are 7% less expensive in the state than the they are nationwide on average — a lower cost of living than in any of the six states Idaho borders.
People are also increasingly drawn to the state capital of Boise, which has a growing tech sector. Overall, the state’s job market is strong with an annual unemployment rate of just 3.2% — well below the 4.4% national rate in 2017.
See all stories featuring: Idaho
Fastest Shrinking States
Source: DenisTangneyJr / Getty Images
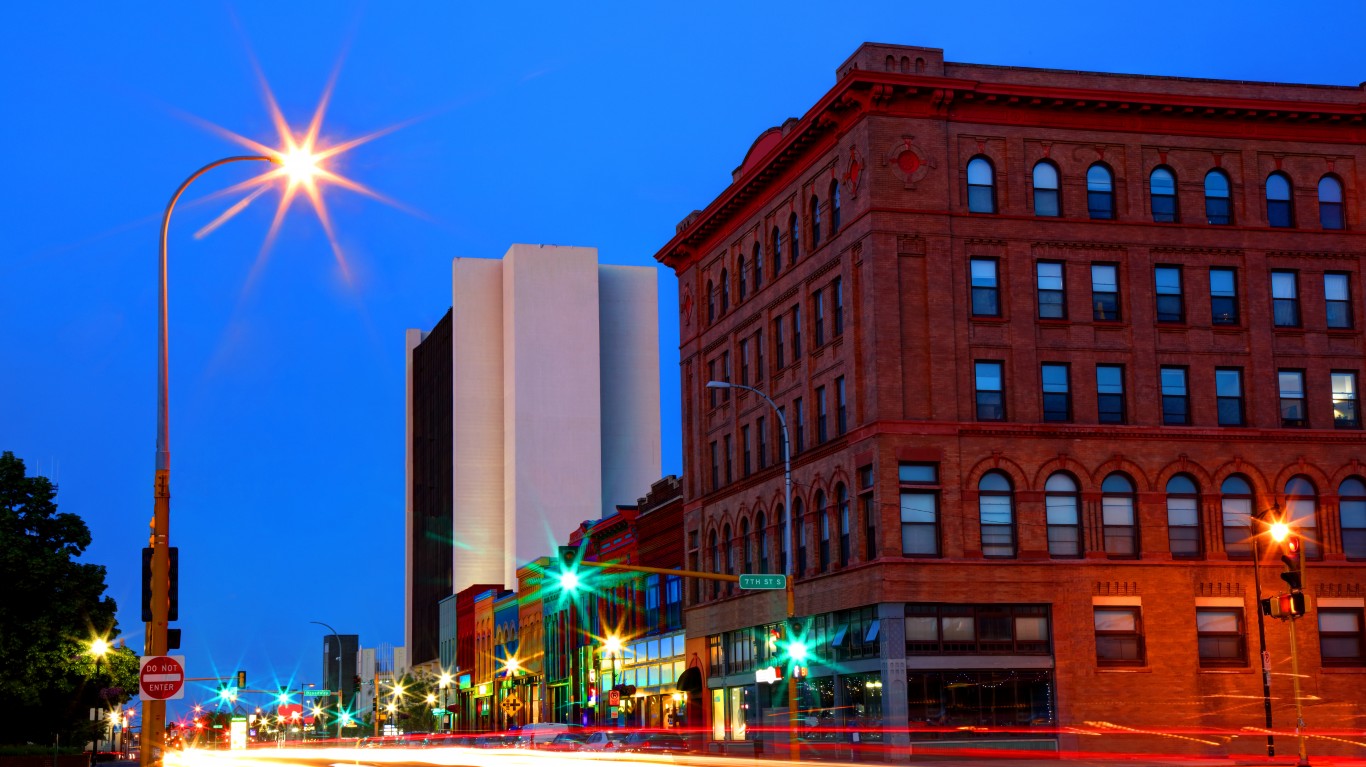
8. North Dakota
> 1-yr. pop. growth: -0.02% (-155)
> Current population: 755,393 (4th smallest)
> 1-yr. change in median home value: 5.8% (15th highest)
North Dakota’s population exploded by 15.7% between 2007 and 2017 — one of the largest 10-year increases of any state and nearly double the 8.1% national growth rate over the same time. The growth was driven by a thriving economy, driven by hydrofracking in the Williston Basin and the state’s booming energy sector. However, growth — both of the state’s economy and population — has slowed in recent years. Between 2016 and 2017, North Dakota was one of only eight states to report a population decline. The decline is partially attributable to a slowing energy sector following the collapse in the price of oil in 2014. Oil prices, and with it the state’s economy, haven’t fully recovered since.
In the last year, about 6,700 more people left North Dakota to other states than moved to the state. The domestic outbound migration was enough to offset growth from births and international migration.
See all stories featuring: North Dakota
[in-text-ad]

Source: f11photo / Getty Images
7. Louisiana
> 1-yr. pop. growth: -0.04% (-1,824)
> Current population: 4.7 million (25th largest)
> 1-yr. change in median home value: 2.8% (9th lowest)
There were about 1,800 fewer people living in Louisiana in July 2017 than there were a year before. The decline was driven by people leaving the state for other places in the United States. Many likely left for economic reasons.
The unemployment rate in Louisiana stood at 5.1%, nearly the highest among states and well above the 4.4% national unemployment rate. A shrinking manufacturing sector can partially explain this. Economic output in manufacturing, the state’s largest industry, dipped by by 5% from mid-2016 to mid-2017.
See all stories featuring: Louisiana
Source: SeanPavonePhoto / Getty Images
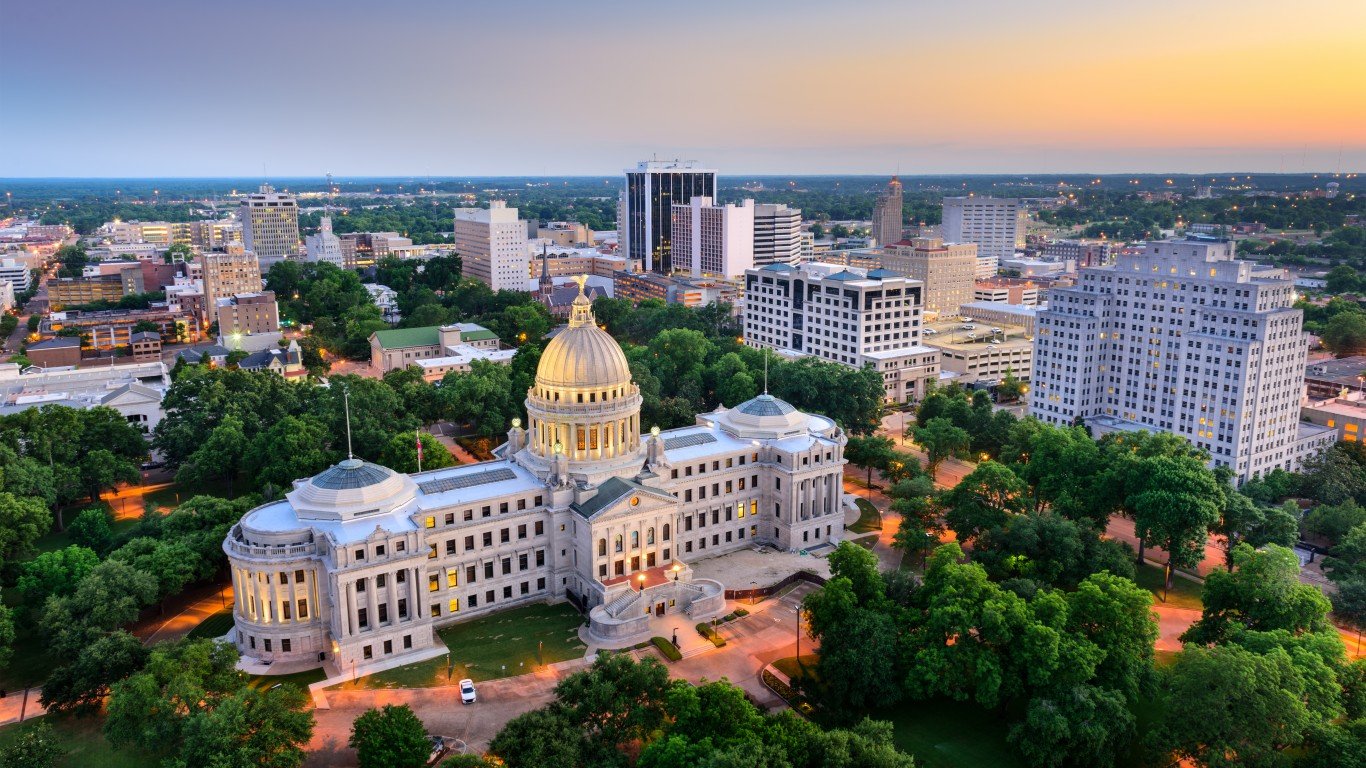
6. Mississippi
> 1-yr. pop. growth: -0.04% (-1,315)
> Current population: 3.0 million (17th smallest)
> 1-yr. change in median home value: 5.5% (16th highest)
Despite reporting about 6,500 more births than deaths, and becoming the home of over 2,000 net new residents from foreign countries, Mississippi’s population is declining. In the past year, nearly 10,000 people left the state for other parts of the country.
A growing population can help drive economic growth, and a shrinking one can be both the result and added cause of slowing conditions — and in Mississippi GDP growth is sluggish. Mississippi’s GDP growth of 0.4% from mid-2016 to mid-2017 is well below the 2.3% national GDP growth over that time. Over the last decade, Mississippi’s economy has been at a near standstill, growing at an average pace of just 0.1% a year.
See all stories featuring: Mississippi
Source: Eric Tessmer / Wikimedia Commons
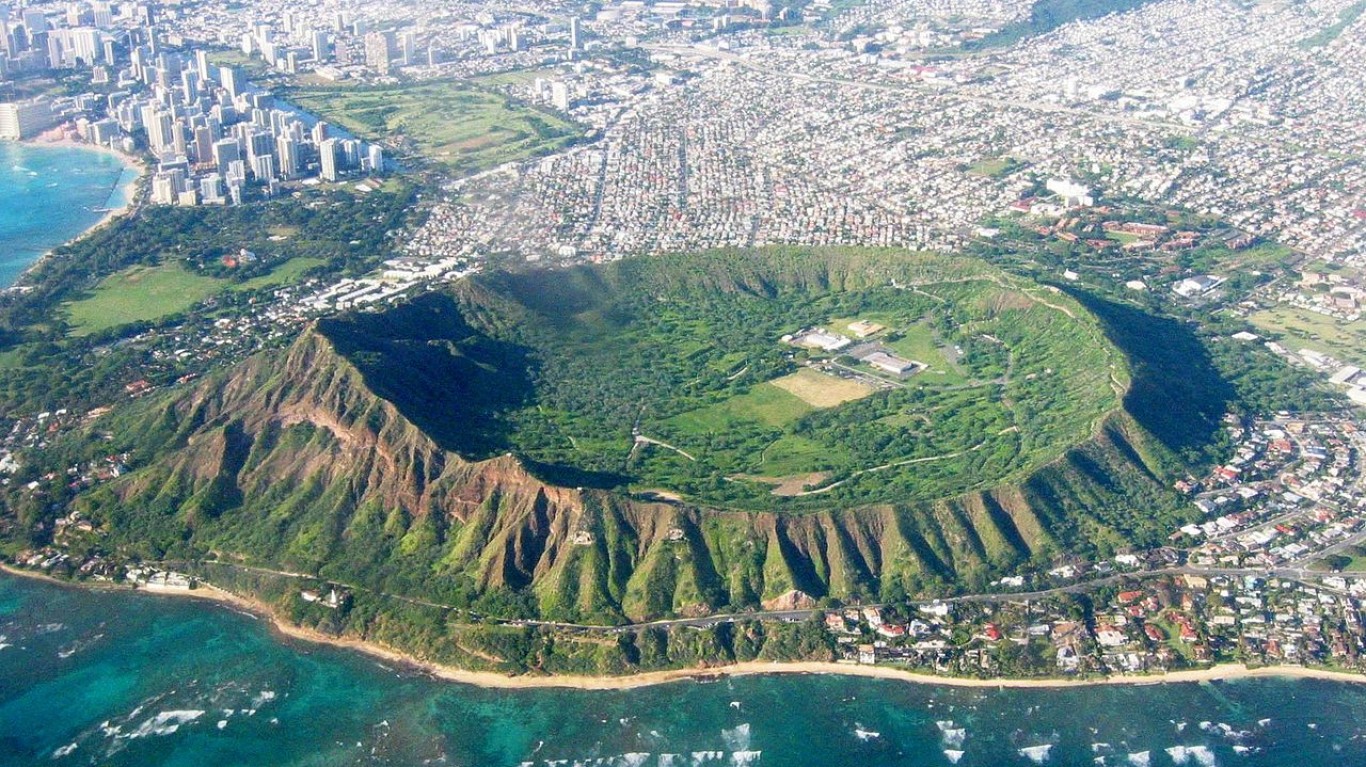
5. Hawaii
> 1-yr. pop. growth: -0.08% (-1,145)
> Current population: 1.4 million (11th smallest)
> 1-yr. change in median home value: 4.3% (25th highest)
About 13,500 more people left Hawaii for other parts of the country than moved in over the past year. This decline was enough to offset growth from international migration and birth rate.
One potential explanation for the exodus is the state’s high cost of living. Goods and services in Hawaii are 18.4% more expensive than they are nationwide on average — making Hawaii the most expensive state to in in the country. Housing is particularly expensive. The typical home in Hawaii is worth 7.9 times the median household income. Nationwide, the typical home is worth 3.6 times the median income.
See all stories featuring: Hawaii
Source: volvob12b / Flickr
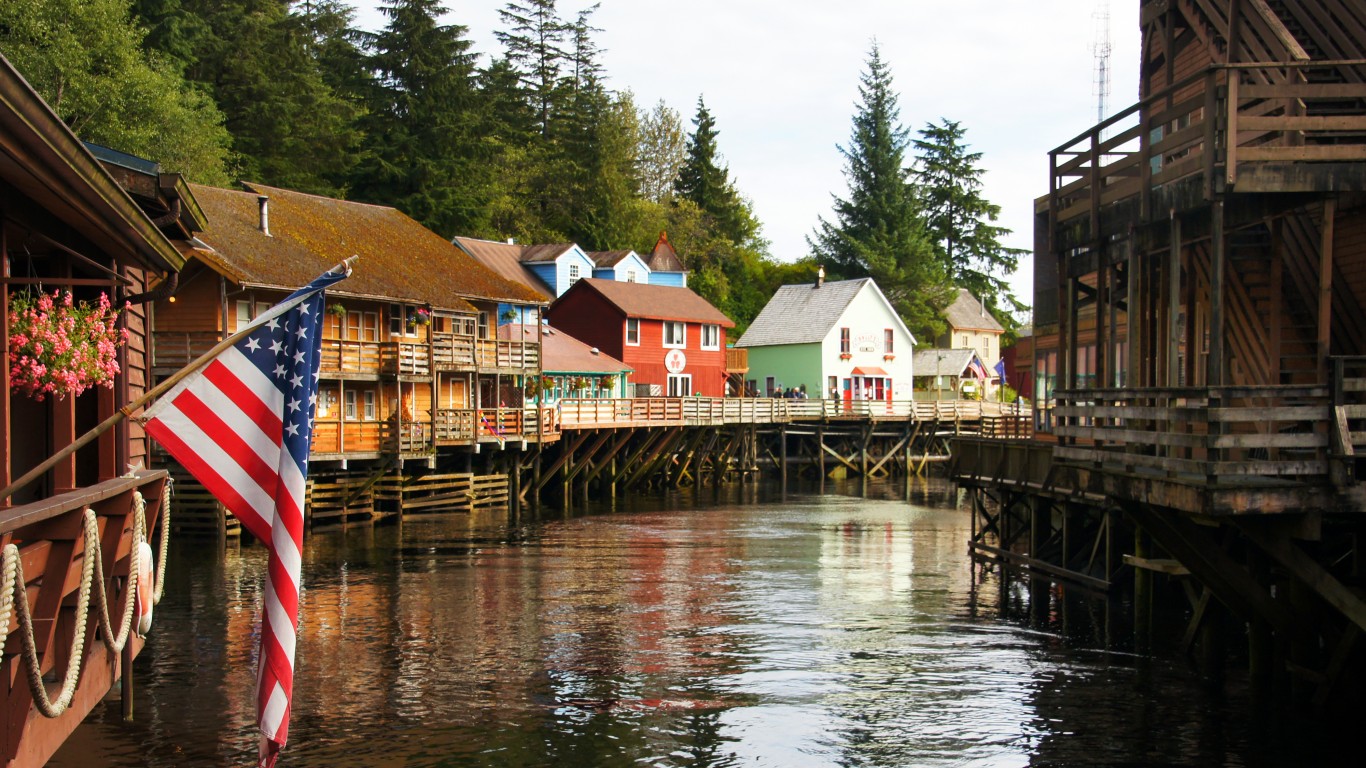
4. Alaska
> 1-yr. pop. growth: -0.23% (-1,727)
> Current population: 739,795 (3rd smallest)
> 1-yr. change in median home value: 2.0% (5th lowest)
Though more people were born in Alaska than died, and there was a net inflow from international immigration over the past year, the state’s population shrank. The decline was driven by residents moving to other parts of the country.
Population decline leads to reduced demand for housing, which can in turn make real estate less valuable. In Alaska, the typical home appreciated in value by just 2.0% from 2016 to 2017, far less than the 6.1% appreciation of the typical American home value over that time.
[in-text-ad]
See all stories featuring: Alaska

Source: marchello74 / Getty Images
3. Illinois
> 1-yr. pop. growth: -0.26% (-33,703)
> Current population: 12.8 million (6th largest)
> 1-yr. change in median home value: 4.7% (22nd highest)
People have been moving out of Illinois en masse for years. Due almost entirely to outbound migration, by mid-2017, Illinois had 33,703 fewer residents compared to a year before and 76,471 fewer residents compared to five years before. Population decline often results in reduced demand for housing, and this has strained Illinois’s largest industry, the real estate, rental, and leasing industry. Economic output of the industry dipped by 2.0% from mid-2016 to mid-2017, compared to 0.9% growth nationwide over the same period.
See all stories featuring: Illinois
Source: Sean Pavone / Getty Images
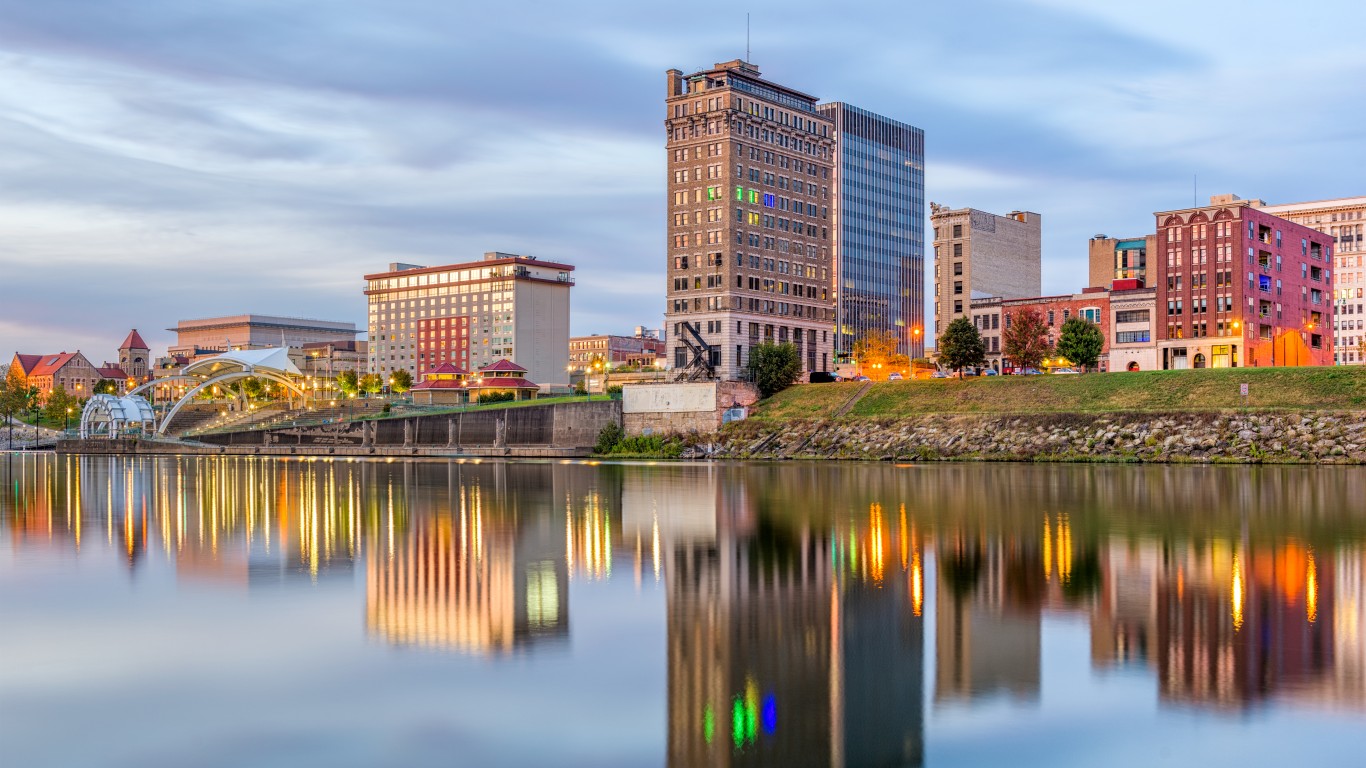
2. West Virginia
> 1-yr. pop. growth: -0.70% (-12,780)
> Current population: 1.8 million (13th smallest)
> 1-yr. change in median home value: 1.6% (3rd lowest)
Like every other state on this list, more people are leaving West Virginia than moving in. Many may be leaving for better economic opportunities. The unemployment in the state stood at 5.2% in 2017, nearly the highest jamong states and well above the comparable 4.4% national rate. Additionally, West Virginia’s 19.1% poverty rate is higher than all but three other states.
West Virginia is the only state in the country to report more deaths than births between 2016 and 2017. One of the hardest hit states by the opioid epidemic, nearly 1,000 West Virginia residents died of a drug overdose in 2017, an 11.2% increase from the previous year.
See all stories featuring: West Virginia
Source: collins_family / Flickr
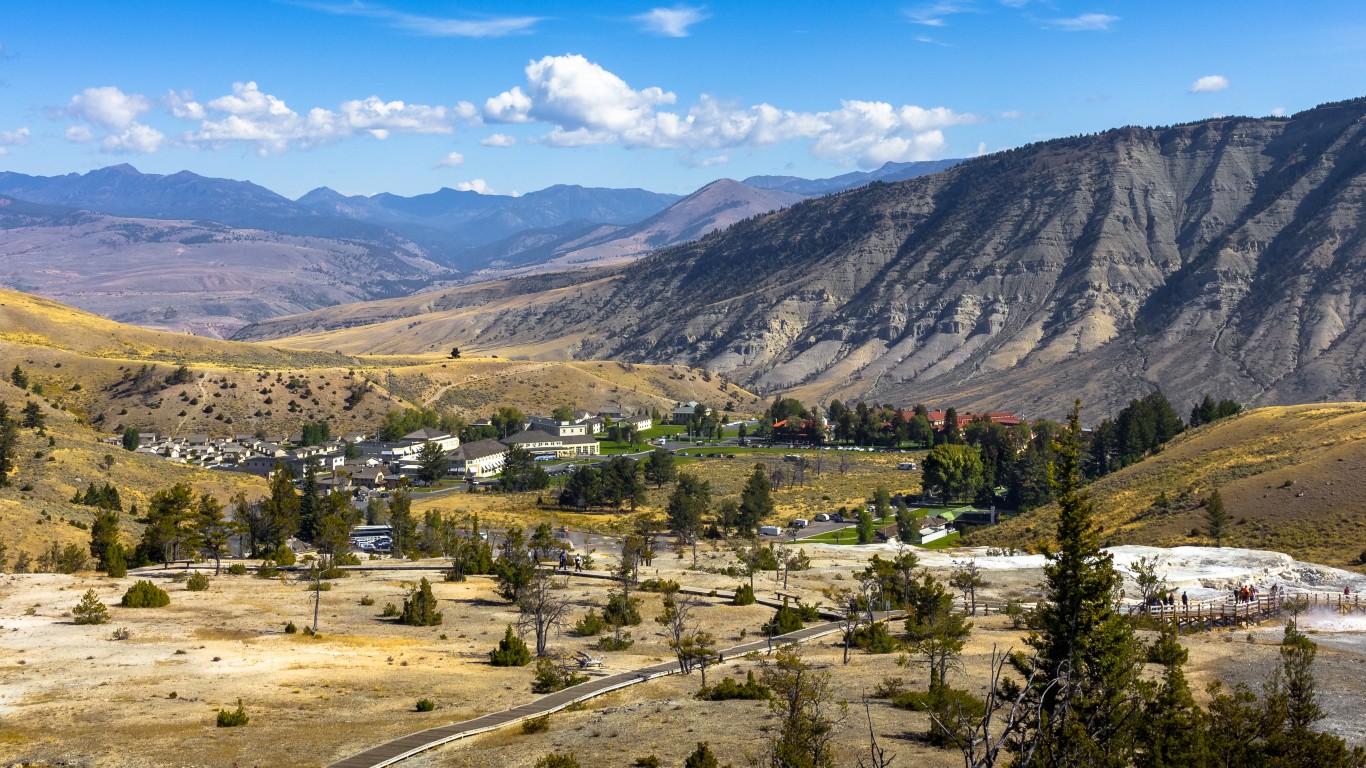
1. Wyoming
> 1-yr. pop. growth: 0.47% (-5,595)
> Current population: 579,315 (the smallest)
> 1-yr. change in median home value: 2.3% (8th lowest)
No state lost a larger share of its residents over the past year than Wyoming. Wyoming’s population, already the smallest of any state, shrank by 5,600 — or 1.0% — between July 2016 and July 2017.
Despite the nation-leading population decline, Wyoming’s economy is growing rapidly — thanks in part to increased output in the mining, quarrying, and gas extraction industry. Wyoming’s GDP grew by 3.7% from mid-2016 to mid-2017, outpacing the 2.3% U.S. GDP growth. Over the same period, Wyoming’s largest industry — mining, quarrying, and gas extraction — grew by 22.2%.
See all stories featuring: Wyoming
Detailed Findings
Population change is simply the number of people who moved into a state minus the number who left, as well as the number of people who were born in a state less the number of people who died.
In each of the fastest shrinking states, people moving out drove the population decline. This was even the case in West Virginia, the only state to report more deaths than births in the last year.
Meanwhile, Texas and Utah are the only states to rank among the fastest growing where births minus deaths — referred to as natural growth — accounted for most of the population growth. Still, migration was also a significant factor, as tens of thousands more people moved to those states than left in the last year.
A growing population typically increases demand for housing, which, in turn, raises property values. In each of the eight fastest growing states on this list, the typical home appreciated in value faster than the typical American home. Among the fastest growing states, median home values climbed anywhere from 6.6% to 11.0%, while the typical American home appreciated by 6.1% over that time.
None of the eight states with shrinking populations reported an annual increase in median home value greater than the national average increase.
Perhaps most importantly, population change appears closely tied to overall economic conditions. Wyoming and West Virginia are the only states with declining populations to report faster annual GDP growth than the U.S. growth of 2.3%. Meanwhile, five of the eight fastest growing states reported faster than national GDP growth.
Methodology
To determine the fastest growing and shrinking states, 24/7 Wall St. reviewed the one-year population change of all 50 states from July 2016 to July 2017 with data from the U.S. Census Bureau. Data on births, deaths, domestic migration, and international migration also came from the Census. Data on GDP and industry growth came from the Bureau of Economic Analysis and are for the third quarter of each year. Unemployment figures came from the Bureau of Labor Statistics and are annual averages for 2017. Poverty rates and median home values came from the American Community Survey of the U.S. Census Bureau and are for 2017.
Sponsored: Want to Retire Early? Here’s a Great First Step
Want retirement to come a few years earlier than you’d planned? Or are you ready to retire now, but want an extra set of eyes on your finances?
Now you can speak with up to 3 financial experts in your area for FREE. By simply clicking here you can begin to match with financial professionals who can help you build your plan to retire early. And the best part? The first conversation with them is free.
Click here to match with up to 3 financial pros who would be excited to help you make financial decisions.
Thank you for reading! Have some feedback for us?
Contact the 24/7 Wall St. editorial team.
Editors' Picks

