
The American middle class — once a major point of pride in the United States — has changed considerably over the course of recent decades. The typical occupations held by middle-class Americans have changed over the years, and a greater amount of all income generated has moved into the hands of individuals and households in the top shares of earners.
While the United States remains one of the most prosperous countries in the world, rising income inequality has intensified discussions discussions of how resources are distributed in general and to the middle class in particular.
One way to examine the American middle class is to look at where middle-income earners are residing, and how the geographic concentration of the nation’s economic majority has changed.
To identify the states where the middle class is disappearing, 24/7 Wall St. compared the share of households in each state within the middle range of nationwide incomes in 1999 and in 2017 using the U.S. Census Bureau’s 2017 1-year ACS microdata and 2000 decennial Census microdata. Across the country in 1999, the middle three quintiles included annual incomes from $17,196 to $79,375. In 2017, middle incomes ranged from $24,626 to $121,116.
Our ranking is based on the percentage point change in these shares of middle-class households between 2017 and 1999, the earliest year for which state-level household income data is available.
Incomes are lower in some states than in others and this is true throughout the period reviewed. However, the states with the largest increases in the share of households earning middle-incomes do not fall necessarily into lower- or higher-income states.
Click here to read about states where the middle class is disappearing.

Source: onasill / Flickr
50. Mississippi
> Chg. in share of households in the middle class: +1.5 ppt. (from 60.0% in ’99 to 61.6% in ’17)
> Median household income in 1999: $31,330 (2nd lowest)
> Median household income in 2017: $43,529 (2nd lowest)
> 1999-2017 population growth: +4.9% (11th smallest)
See all stories featuring: Mississippi
[in-text-ad]

Source: Davel5957 / Getty Images
49. Michigan
> Chg. in share of households in the middle class: +1.5 ppt. (from 62.2% in ’99 to 63.7% in ’17)
> Median household income in 1999: $44,667 (16th highest)
> Median household income in 2017: $54,909 (18th lowest)
> 1999-2017 population growth: +0.2% (the smallest)
See all stories featuring: Michigan
 24/7 Wall St.
Source: photoquest7 / Getty Images
48. Nevada
> Chg. in share of households in the middle class: +1.4 ppt. (from 65.1% in ’99 to 66.5% in ’17)
> Median household income in 1999: $44,581 (17th highest)
> Median household income in 2017: $58,003 (25th lowest)
> 1999-2017 population growth: +50.0% (the largest)
See all stories featuring: Nevada

Source: SeanPavonePhoto / Getty Images
47. Connecticut
> Chg. in share of households in the middle class: +1.3 ppt. (from 55.7% in ’99 to 57.0% in ’17)
> Median household income in 1999: $53,935 (2nd highest)
> Median household income in 2017: $74,168 (5th highest)
> 1999-2017 population growth: +5.4% (12th smallest)
See all stories featuring: Connecticut
[in-text-ad-2]

Source: vkbhat / Getty Images
46. Idaho
> Chg. in share of households in the middle class: +1.0 ppt. (from 66.8% in ’99 to 67.8% in ’17)
> Median household income in 1999: $37,572 (15th lowest)
> Median household income in 2017: $52,225 (11th lowest)
> 1999-2017 population growth: +32.7% (5th largest)
See all stories featuring: Idaho

Source: volvob12b / Flickr
45. Alaska
> Chg. in share of households in the middle class: +0.8 ppt. (from 60.4% in ’99 to 61.2% in ’17)
> Median household income in 1999: $51,571 (4th highest)
> Median household income in 2017: $73,181 (7th highest)
> 1999-2017 population growth: +18.0% (16th largest)
See all stories featuring: Alaska
[in-text-ad]

Source: maximkabb / iStock
44. Hawaii
> Chg. in share of households in the middle class: +0.6 ppt. (from 58.6% in ’99 to 59.2% in ’17)
> Median household income in 1999: $49,820 (6th highest)
> Median household income in 2017: $77,765 (3rd highest)
> 1999-2017 population growth: +17.8% (17th largest)
See all stories featuring: Hawaii

Source: Thinkstock
43. Kentucky
> Chg. in share of households in the middle class: +0.5 ppt. (from 61.6% in ’99 to 62.1% in ’17)
> Median household income in 1999: $33,672 (7th lowest)
> Median household income in 2017: $48,375 (7th lowest)
> 1999-2017 population growth: +10.2% (22nd smallest)
See all stories featuring: Kentucky

Source: collins_family / Flickr
42. Wyoming
> Chg. in share of households in the middle class: +0.4 ppt. (from 65.3% in ’99 to 65.7% in ’17)
> Median household income in 1999: $37,892 (16th lowest)
> Median household income in 2017: $60,434 (19th highest)
> 1999-2017 population growth: +17.3% (19th largest)
See all stories featuring: Wyoming
[in-text-ad-2]

Source: SeanPavonePhoto / Getty Images
41. Georgia
> Chg. in share of households in the middle class: +0.4 ppt. (from 61.7% in ’99 to 62.1% in ’17)
> Median household income in 1999: $42,433 (20th highest)
> Median household income in 2017: $56,183 (19th lowest)
> 1999-2017 population growth: +27.4% (9th largest)
See all stories featuring: Georgia

Source: benkrut / iStock
40. Kansas
> Chg. in share of households in the middle class: +0.3 ppt. (from 65.7% in ’99 to 66.0% in ’17)
> Median household income in 1999: $40,624 (25th lowest)
> Median household income in 2017: $56,422 (21st lowest)
> 1999-2017 population growth: +8.4% (17th smallest)
See all stories featuring: Kansas
[in-text-ad]

Source: f11photo / Getty Images
39. Missouri
> Chg. in share of households in the middle class: +0.2 ppt. (from 64.4% in ’99 to 64.6% in ’17)
> Median household income in 1999: $37,934 (17th lowest)
> Median household income in 2017: $53,578 (15th lowest)
> 1999-2017 population growth: +9.3% (19th smallest)
See all stories featuring: Missouri

Source: Sean Pavone / Getty Images
38. Alabama
> Chg. in share of households in the middle class: +0.2 ppt. (from 61.5% in ’99 to 61.6% in ’17)
> Median household income in 1999: $34,135 (9th lowest)
> Median household income in 2017: $48,123 (6th lowest)
> 1999-2017 population growth: +9.6% (20th smallest)
See all stories featuring: Alabama

Source: Majestic_Aerials / Getty Images
37. Oklahoma
> Chg. in share of households in the middle class: +0.1 ppt. (from 64.0% in ’99 to 64.1% in ’17)
> Median household income in 1999: $33,400 (6th lowest)
> Median household income in 2017: $50,051 (8th lowest)
> 1999-2017 population growth: +13.9% (25th largest)
See all stories featuring: Oklahoma
[in-text-ad-2]

Source: SeanPavonePhoto / Getty Images
36. Texas
> Chg. in share of households in the middle class: +0.1 ppt. (from 61.7% in ’99 to 61.8% in ’17)
> Median household income in 1999: $39,927 (22nd lowest)
> Median household income in 2017: $59,206 (23rd highest)
> 1999-2017 population growth: +35.7% (4th largest)
See all stories featuring: Texas

Source: SeanPavonePhoto / Getty Images
35. Maine
> Chg. in share of households in the middle class: -0.1 ppt. (from 65.1% in ’99 to 65.1% in ’17)
> Median household income in 1999: $37,240 (14th lowest)
> Median household income in 2017: $56,277 (20th lowest)
> 1999-2017 population growth: +4.8% (9th smallest)
See all stories featuring: Maine
[in-text-ad]

Source: Meinzahn / iStock
34. Florida
> Chg. in share of households in the middle class: -0.1 ppt. (from 64.0% in ’99 to 63.9% in ’17)
> Median household income in 1999: $38,819 (18th lowest)
> Median household income in 2017: $52,594 (12th lowest)
> 1999-2017 population growth: +31.3% (6th largest)
See all stories featuring: Florida
 24/7 Wall St.
Source: ferrantraite / Getty Images
33. New Mexico
> Chg. in share of households in the middle class: -0.1 ppt. (from 62.4% in ’99 to 62.2% in ’17)
> Median household income in 1999: $34,133 (8th lowest)
> Median household income in 2017: $46,744 (5th lowest)
> 1999-2017 population growth: +14.8% (23rd largest)
See all stories featuring: New Mexico
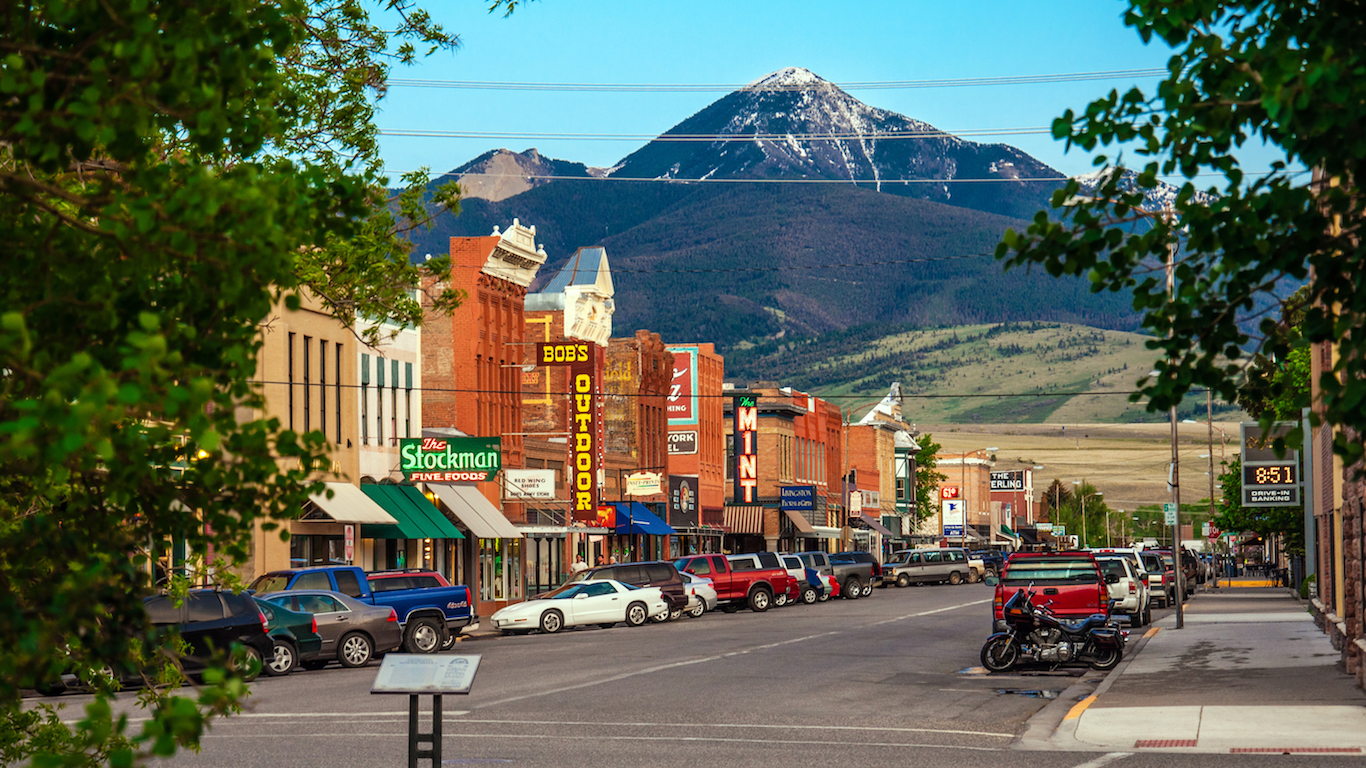
Source: Nick Fox / Shutterstock.com
32. Montana
> Chg. in share of households in the middle class: -0.3 ppt. (from 65.4% in ’99 to 65.1% in ’17)
> Median household income in 1999: $33,024 (5th lowest)
> Median household income in 2017: $53,386 (14th lowest)
> 1999-2017 population growth: +16.4% (21st largest)
See all stories featuring: Montana
[in-text-ad-2]

Source: DenisTangneyJr / Getty Images
31. Delaware
> Chg. in share of households in the middle class: -0.4 ppt. (from 62.5% in ’99 to 62.1% in ’17)
> Median household income in 1999: $47,381 (9th highest)
> Median household income in 2017: $62,852 (17th highest)
> 1999-2017 population growth: +22.8% (12th largest)
See all stories featuring: Delaware

Source: Sean Pavone / Getty Images
30. Tennessee
> Chg. in share of households in the middle class: -0.5 ppt. (from 64.2% in ’99 to 63.8% in ’17)
> Median household income in 1999: $36,360 (12th lowest)
> Median household income in 2017: $51,340 (10th lowest)
> 1999-2017 population growth: +18.0% (15th largest)
See all stories featuring: Tennessee
[in-text-ad]

Source: Sean Pavone / Getty Images
29. Ohio
> Chg. in share of households in the middle class: -0.5 ppt. (from 64.2% in ’99 to 63.7% in ’17)
> Median household income in 1999: $40,956 (23rd highest)
> Median household income in 2017: $54,021 (16th lowest)
> 1999-2017 population growth: +2.7% (5th smallest)
See all stories featuring: Ohio

Source: Dreamframer / Getty Images
28. Arizona
> Chg. in share of households in the middle class: -0.5 ppt. (from 64.5% in ’99 to 63.9% in ’17)
> Median household income in 1999: $40,558 (24th lowest)
> Median household income in 2017: $56,581 (23rd lowest)
> 1999-2017 population growth: +36.8% (3rd largest)
See all stories featuring: Arizona

Source: nick1803 / Getty Images
27. Colorado
> Chg. in share of households in the middle class: -0.7 ppt. (from 62.9% in ’99 to 62.2% in ’17)
> Median household income in 1999: $47,203 (10th highest)
> Median household income in 2017: $69,117 (11th highest)
> 1999-2017 population growth: +30.4% (7th largest)
See all stories featuring: Colorado
[in-text-ad-2]

Source: ChrisBoswell / Getty Images
26. Nebraska
> Chg. in share of households in the middle class: -0.8 ppt. (from 68.3% in ’99 to 67.5% in ’17)
> Median household income in 1999: $39,250 (20th lowest)
> Median household income in 2017: $59,970 (21st highest)
> 1999-2017 population growth: +12.2% (23rd smallest)
See all stories featuring: Nebraska

Source: RudyBalasko / Getty Images
25. Illinois
> Chg. in share of households in the middle class: -0.8 ppt. (from 60.9% in ’99 to 60.1% in ’17)
> Median household income in 1999: $46,590 (13th highest)
> Median household income in 2017: $62,992 (16th highest)
> 1999-2017 population growth: +3.1% (6th smallest)
See all stories featuring: Illinois
[in-text-ad]

Source: f11photo / Getty Images
24. Indiana
> Chg. in share of households in the middle class: -0.8 ppt. (from 66.5% in ’99 to 65.7% in ’17)
> Median household income in 1999: $41,567 (22nd highest)
> Median household income in 2017: $54,181 (17th lowest)
> 1999-2017 population growth: +9.6% (21st smallest)
See all stories featuring: Indiana

Source: stellalevi / Getty Images
23. California
> Chg. in share of households in the middle class: -0.9 ppt. (from 57.5% in ’99 to 56.5% in ’17)
> Median household income in 1999: $47,493 (8th highest)
> Median household income in 2017: $71,805 (8th highest)
> 1999-2017 population growth: +16.7% (20th largest)
See all stories featuring: California

Source: SeanPavonePhoto / Getty Images
22. New Jersey
> Chg. in share of households in the middle class: -0.9 ppt. (from 55.0% in ’99 to 54.1% in ’17)
> Median household income in 1999: $55,146 (the highest)
> Median household income in 2017: $80,088 (2nd highest)
> 1999-2017 population growth: +7.0% (13th smallest)
See all stories featuring: New Jersey
[in-text-ad-2]

Source: johnnya123 / Getty Images
21. Utah
> Chg. in share of households in the middle class: -0.9 ppt. (from 67.7% in ’99 to 66.7% in ’17)
> Median household income in 1999: $45,726 (15th highest)
> Median household income in 2017: $68,358 (13th highest)
> 1999-2017 population growth: +38.9% (2nd largest)
See all stories featuring: Utah

Source: SeanPavonePhoto / Getty Images
20. Maryland
> Chg. in share of households in the middle class: -1.0 ppt. (from 58.0% in ’99 to 57.0% in ’17)
> Median household income in 1999: $52,868 (3rd highest)
> Median household income in 2017: $80,776 (the highest)
> 1999-2017 population growth: +14.3% (24th largest)
See all stories featuring: Maryland
[in-text-ad]

Source: Sean Pavone / Getty Images
19. West Virginia
> Chg. in share of households in the middle class: -1.0 ppt. (from 62.1% in ’99 to 61.1% in ’17)
> Median household income in 1999: $29,696 (the lowest)
> Median household income in 2017: $43,469 (the lowest)
> 1999-2017 population growth: +0.4% (2nd smallest)
See all stories featuring: West Virginia

Source: BlazenImages / Getty Images
18. Arkansas
> Chg. in share of households in the middle class: -1.2 ppt. (from 64.0% in ’99 to 62.8% in ’17)
> Median household income in 1999: $32,182 (3rd lowest)
> Median household income in 2017: $45,869 (3rd lowest)
> 1999-2017 population growth: +12.4% (24th smallest)
See all stories featuring: Arkansas

Source: SeanPavonePhoto / Getty Images
17. South Carolina
> Chg. in share of households in the middle class: -1.3 ppt. (from 64.6% in ’99 to 63.3% in ’17)
> Median household income in 1999: $37,082 (13th lowest)
> Median household income in 2017: $50,570 (9th lowest)
> 1999-2017 population growth: +25.2% (11th largest)
See all stories featuring: South Carolina
[in-text-ad-2]

Source: pedrosz / Flickr
16. Louisiana
> Chg. in share of households in the middle class: -1.3 ppt. (from 60.1% in ’99 to 58.8% in ’17)
> Median household income in 1999: $32,566 (4th lowest)
> Median household income in 2017: $46,145 (4th lowest)
> 1999-2017 population growth: +4.8% (10th smallest)
See all stories featuring: Louisiana

Source: f11photo / Getty Images
15. Pennsylvania
> Chg. in share of households in the middle class: -1.4 ppt. (from 62.9% in ’99 to 61.6% in ’17)
> Median household income in 1999: $40,106 (23rd lowest)
> Median household income in 2017: $59,195 (24th highest)
> 1999-2017 population growth: +4.3% (7th smallest)
See all stories featuring: Pennsylvania
[in-text-ad]

Source: spyarm / Getty Images
14. New York
> Chg. in share of households in the middle class: -1.4 ppt. (from 57.0% in ’99 to 55.6% in ’17)
> Median household income in 1999: $43,393 (19th highest)
> Median household income in 2017: $64,894 (14th highest)
> 1999-2017 population growth: +4.6% (8th smallest)
See all stories featuring: New York
 24/7 Wall St.
Source: DenisTangneyJr / Getty Images
13. North Dakota
> Chg. in share of households in the middle class: -1.6 ppt. (from 66.9% in ’99 to 65.3% in ’17)
> Median household income in 1999: $34,604 (10th lowest)
> Median household income in 2017: $61,843 (18th highest)
> 1999-2017 population growth: +17.6% (18th largest)
See all stories featuring: North Dakota

Source: RudyBalasko / Getty Images
12. Minnesota
> Chg. in share of households in the middle class: -1.6 ppt. (from 64.1% in ’99 to 62.5% in ’17)
> Median household income in 1999: $47,111 (11th highest)
> Median household income in 2017: $68,388 (12th highest)
> 1999-2017 population growth: +13.4% (25th smallest)
See all stories featuring: Minnesota
[in-text-ad-2]

Source: Ron_Thomas / Getty Images
11. Wisconsin
> Chg. in share of households in the middle class: -1.7 ppt. (from 67.2% in ’99 to 65.5% in ’17)
> Median household income in 1999: $43,791 (18th highest)
> Median household income in 2017: $59,305 (22nd highest)
> 1999-2017 population growth: +8.1% (16th smallest)
See all stories featuring: Wisconsin

Source: Sean Pavone / Getty Images
10. Virginia
> Chg. in share of households in the middle class: -1.8 ppt. (from 60.5% in ’99 to 58.7% in ’17)
> Median household income in 1999: $46,677 (12th highest)
> Median household income in 2017: $71,535 (9th highest)
> 1999-2017 population growth: +19.7% (14th largest)
See all stories featuring: Virginia
[in-text-ad]

Source: SeanPavonePhoto / Getty Images
9. North Carolina
> Chg. in share of households in the middle class: -1.9 ppt. (from 64.8% in ’99 to 62.9% in ’17)
> Median household income in 1999: $39,184 (19th lowest)
> Median household income in 2017: $52,752 (13th lowest)
> 1999-2017 population growth: +27.6% (8th largest)
See all stories featuring: North Carolina
 24/7 Wall St.
Source: Thinkstock
8. Oregon
> Chg. in share of households in the middle class: -2.0 ppt. (from 65.1% in ’99 to 63.1% in ’17)
> Median household income in 1999: $40,916 (24th highest)
> Median household income in 2017: $60,212 (20th highest)
> 1999-2017 population growth: +21.1% (13th largest)
See all stories featuring: Oregon

Source: Public Domain / Wikimedia Commons
7. South Dakota
> Chg. in share of households in the middle class: -2.4 ppt. (from 68.3% in ’99 to 65.9% in ’17)
> Median household income in 1999: $35,282 (11th lowest)
> Median household income in 2017: $56,521 (22nd lowest)
> 1999-2017 population growth: +15.2% (22nd largest)
See all stories featuring: South Dakota
[in-text-ad-2]

Source: lucky-photographer / Getty Images
6. Washington
> Chg. in share of households in the middle class: -2.6 ppt. (from 63.1% in ’99 to 60.5% in ’17)
> Median household income in 1999: $45,776 (14th highest)
> Median household income in 2017: $70,979 (10th highest)
> 1999-2017 population growth: +25.6% (10th largest)
See all stories featuring: Washington
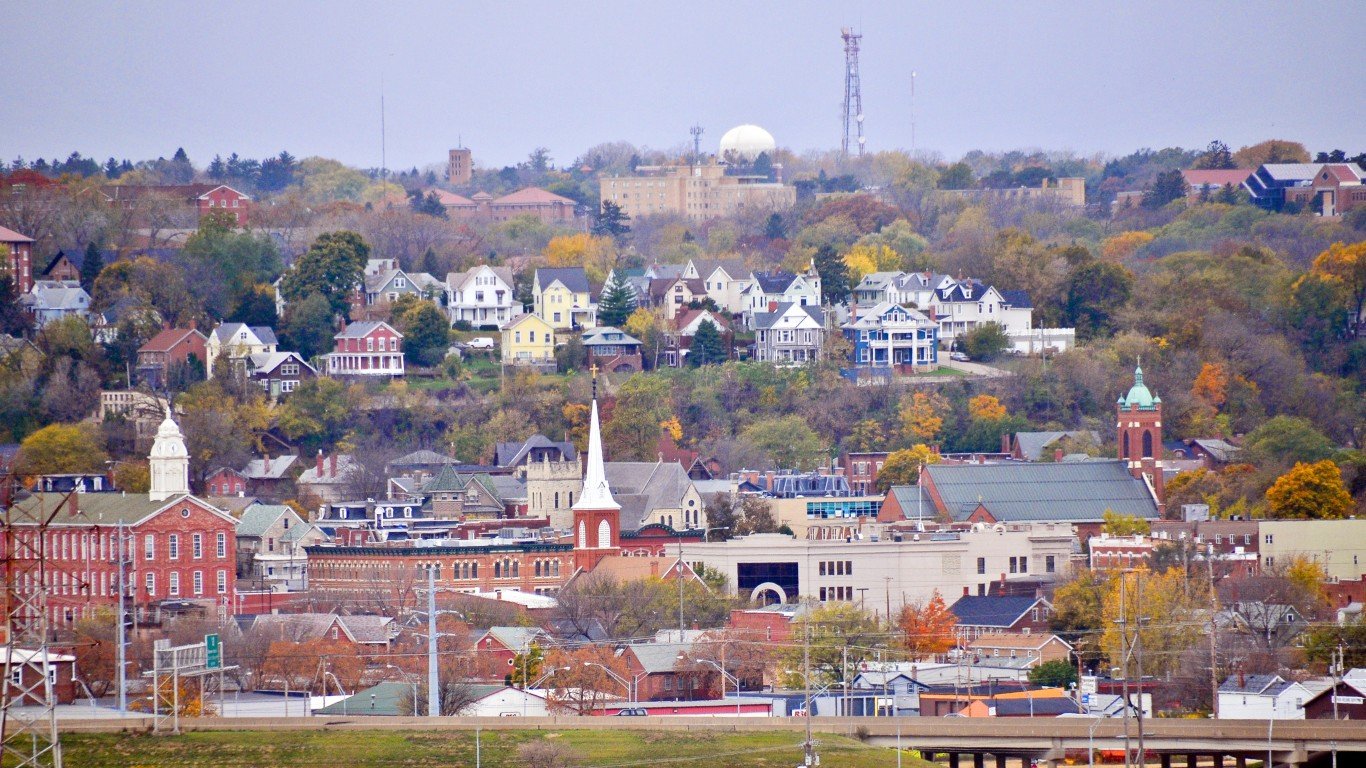
Source: Dirk DBQ / Flickr
5. Iowa
> Chg. in share of households in the middle class: -2.7 ppt. (from 68.8% in ’99 to 66.1% in ’17)
> Median household income in 1999: $39,469 (21st lowest)
> Median household income in 2017: $58,570 (25th highest)
> 1999-2017 population growth: +7.5% (14th smallest)
See all stories featuring: Iowa
[in-text-ad]

Source: SeanPavonePhoto / Getty Images
4. Rhode Island
> Chg. in share of households in the middle class: -2.9 ppt. (from 60.7% in ’99 to 57.8% in ’17)
> Median household income in 1999: $42,090 (21st highest)
> Median household income in 2017: $63,870 (15th highest)
> 1999-2017 population growth: +1.1% (3rd smallest)
See all stories featuring: Rhode Island
 24/7 Wall St.
Source: SeanPavonePhoto / Getty Images
3. Vermont
> Chg. in share of households in the middle class: -2.9 ppt. (from 67.5% in ’99 to 64.7% in ’17)
> Median household income in 1999: $40,856 (25th highest)
> Median household income in 2017: $57,513 (24th lowest)
> 1999-2017 population growth: +2.4% (4th smallest)
See all stories featuring: Vermont

Source: SeanPavonePhoto / Getty Images
2. Massachusetts
> Chg. in share of households in the middle class: -3.1 ppt. (from 56.0% in ’99 to 52.9% in ’17)
> Median household income in 1999: $50,502 (5th highest)
> Median household income in 2017: $77,385 (4th highest)
> 1999-2017 population growth: +8.0% (15th smallest)
See all stories featuring: Massachusetts
[in-text-ad-2]

Source: DenisTangneyJr / Getty Images
1. New Hampshire
> Chg. in share of households in the middle class: -4.3 ppt. (from 64.7% in ’99 to 60.4% in ’17)
> Median household income in 1999: $49,467 (7th highest)
> Median household income in 2017: $73,381 (6th highest)
> 1999-2017 population growth: +8.7% (18th smallest)
See all stories featuring: New Hampshire
Sponsored: Attention Savvy Investors: Speak to 3 Financial Experts – FREE
Ever wanted an extra set of eyes on an investment you’re considering? Now you can speak with up to 3 financial experts in your area for FREE. By simply
clicking here you can begin to match with financial professionals who can help guide you through the financial decisions you’re making. And the best part? The first conversation with them is free.
Click here to match with up to 3 financial pros who would be excited to help you make financial decisions.
Thank you for reading! Have some feedback for us?
Contact the 24/7 Wall St. editorial team.
Editors' Picks

