
In October of last year, the Dow Jones Industrial Average peaked at 26,952, the highest point on record for the stock index. Though the DJIA comprises only 30 stocks, it is often regarded as a gauge of American business and economic prosperity. At the time of this writing, the Dow Jones sits at just over 26,000, over triple its value from a decade ago.
The DJIA is a price-weighted average of 30 large American companies. The index currently contains companies such as the world’s largest retailer Walmart, media juggernaut Disney, global financial institution J.P. Morgan, aerospace and defense giant Boeing, and as of 2015, tech behemoth Apple.
The companies comprising the Dow change over time to reflect the changing economy. Since the creator of the index, Charles Dow, was also the founding editor of The Wall Street Journal, editors at the publication select the companies that comprise the index.
Since its inception in 1896, when only 12 companies were included in the average, the Dow has changed only 50 times. The last remaining company from the original list of 12, General Electric, was finally removed in June 2018. It was replaced with drugstore chain Walgreens Boots Alliance.
To determine the value of the Dow Jones Industrial Average the year you were born, 24/7 Wall St. reviewed daily Dow figures aggregated by economic research website Macrotrends.net. Historical Dow data are inflation-adjusted using annual headline CPI in chained 2018 dollars.
Click here to see what the stock market was worth the year you were born.
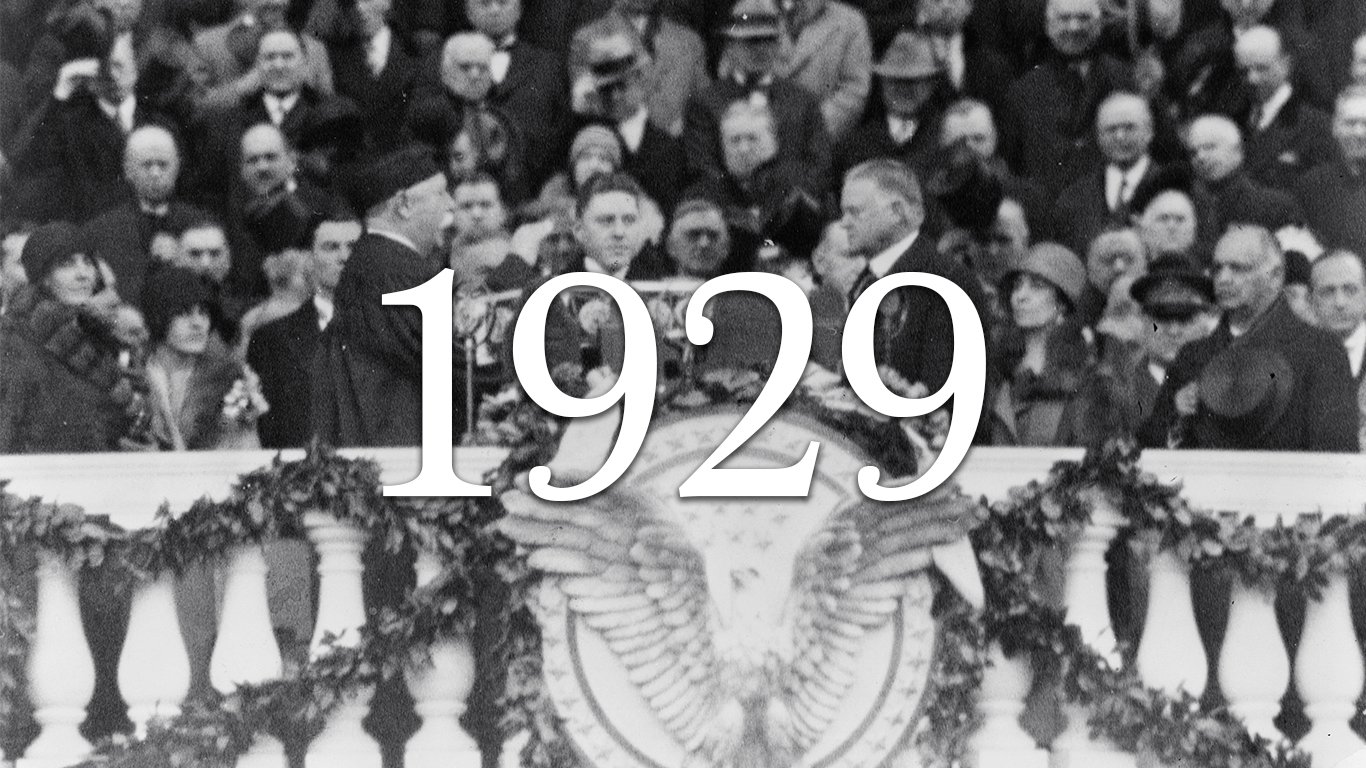
Source: Wikimedia Commons
1929
> Start: 4,452.4
> End: 3,603.6
> High: 5,527.9
> Change: -19.1%
[in-text-ad]
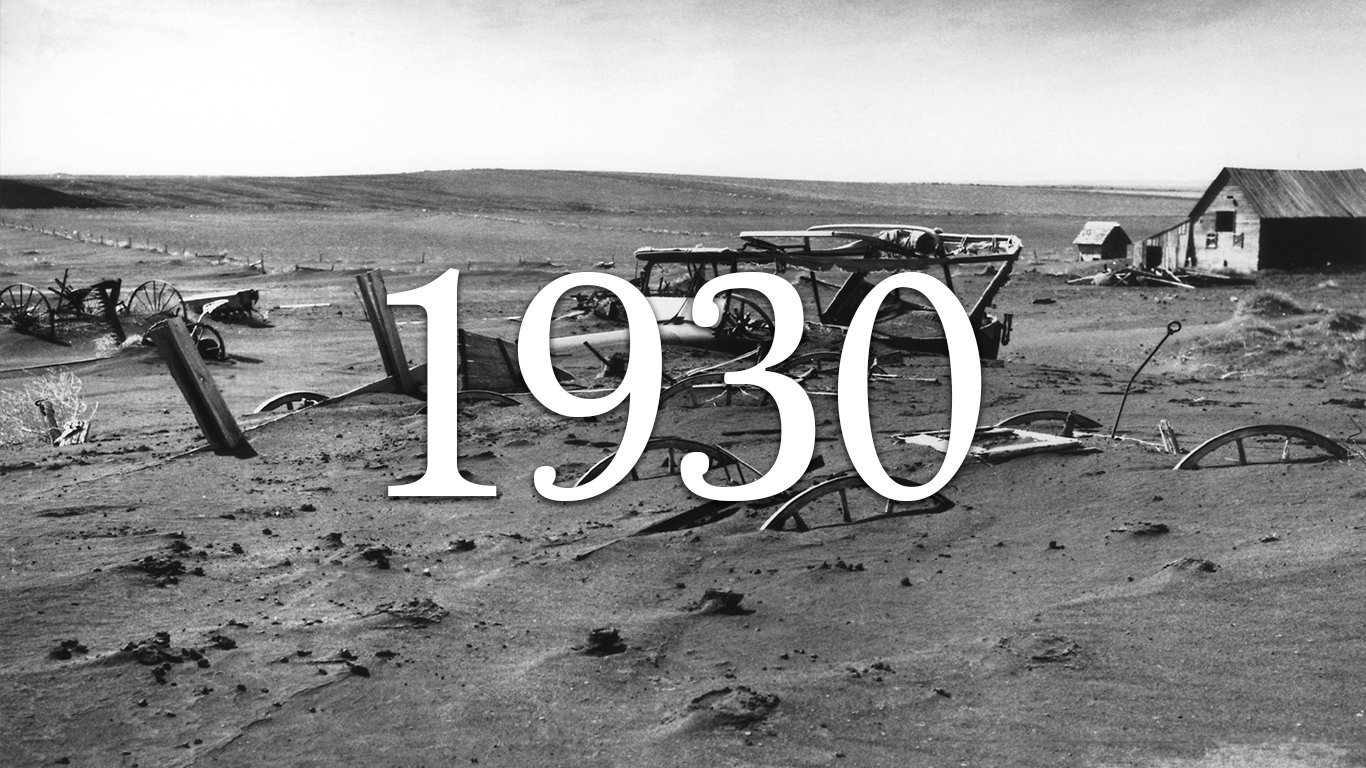
Source: Wikimedia Commons
1930
> Start: 3,632.7
> End: 2,448.3
> High: 4,374.6
> Change: -32.6%
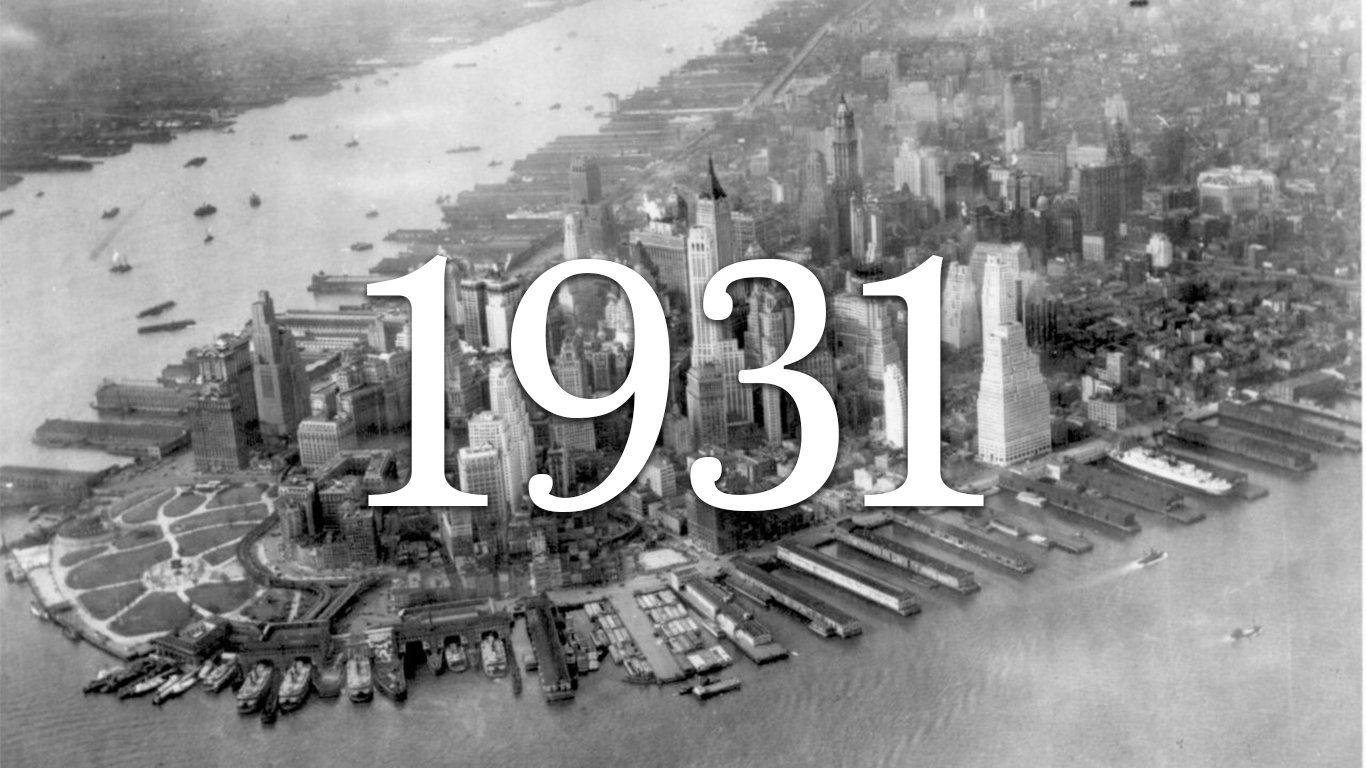
Source: Wikimedia Commons
1931
> Start: 2,770.4
> End: 1,270.7
> High: 3,170.4
> Change: -54.1%
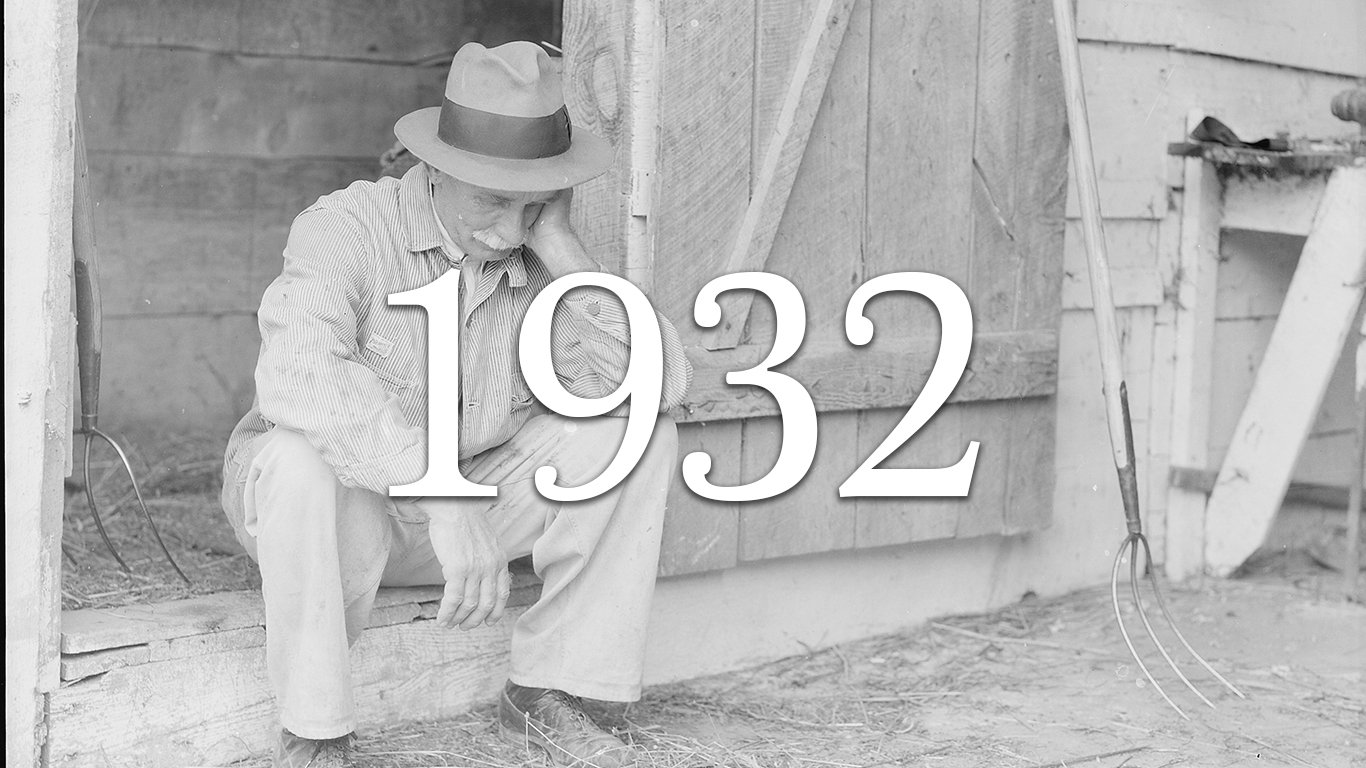
Source: Wikimedia Commons
1932
> Start: 1,357.1
> End: 1,089.9
> High: 1,614.6
> Change: -19.7%
Source: U.S. National Archives and Records Administration / Wikimedia Commons
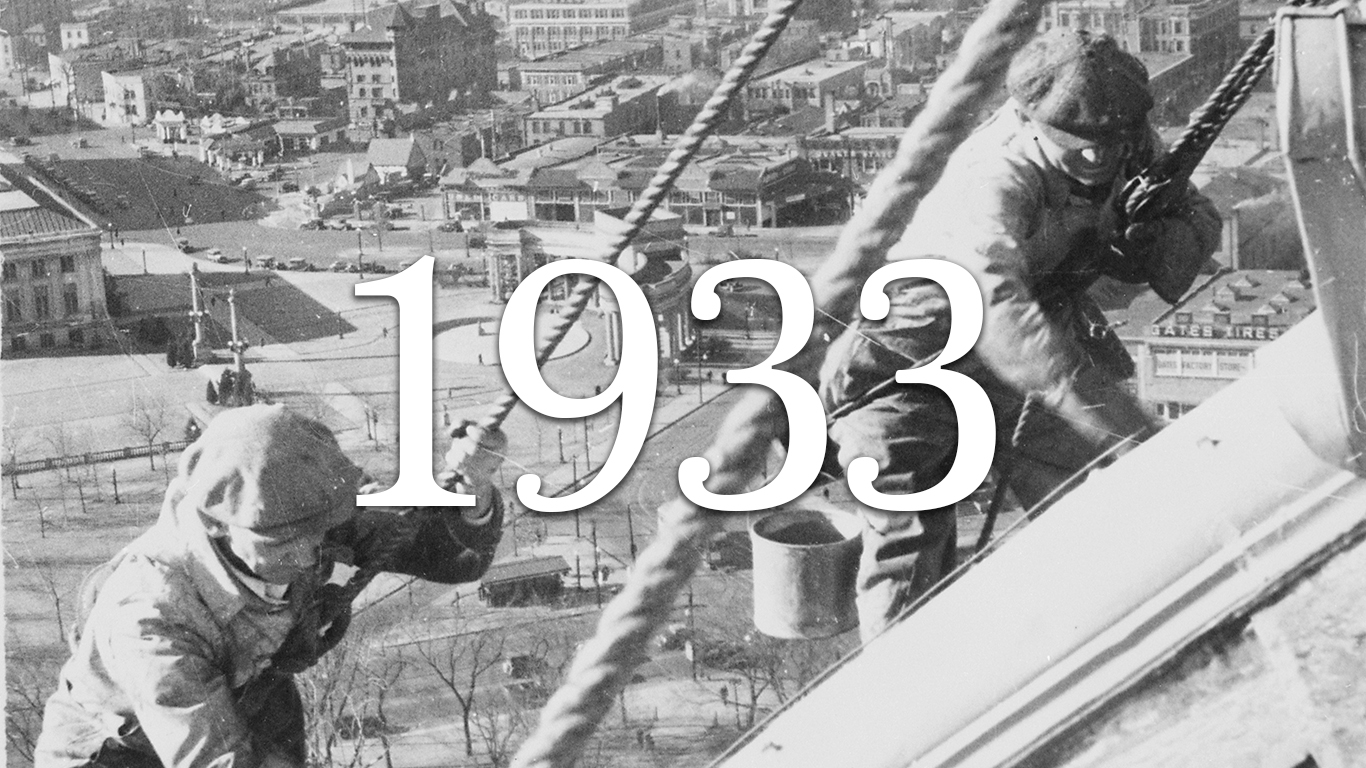
1933
> Start: 1,136.5
> End: 1,915.0
> High: 2,083.1
> Change: +68.5%
Source: Public Domain / Wikimedia Commons
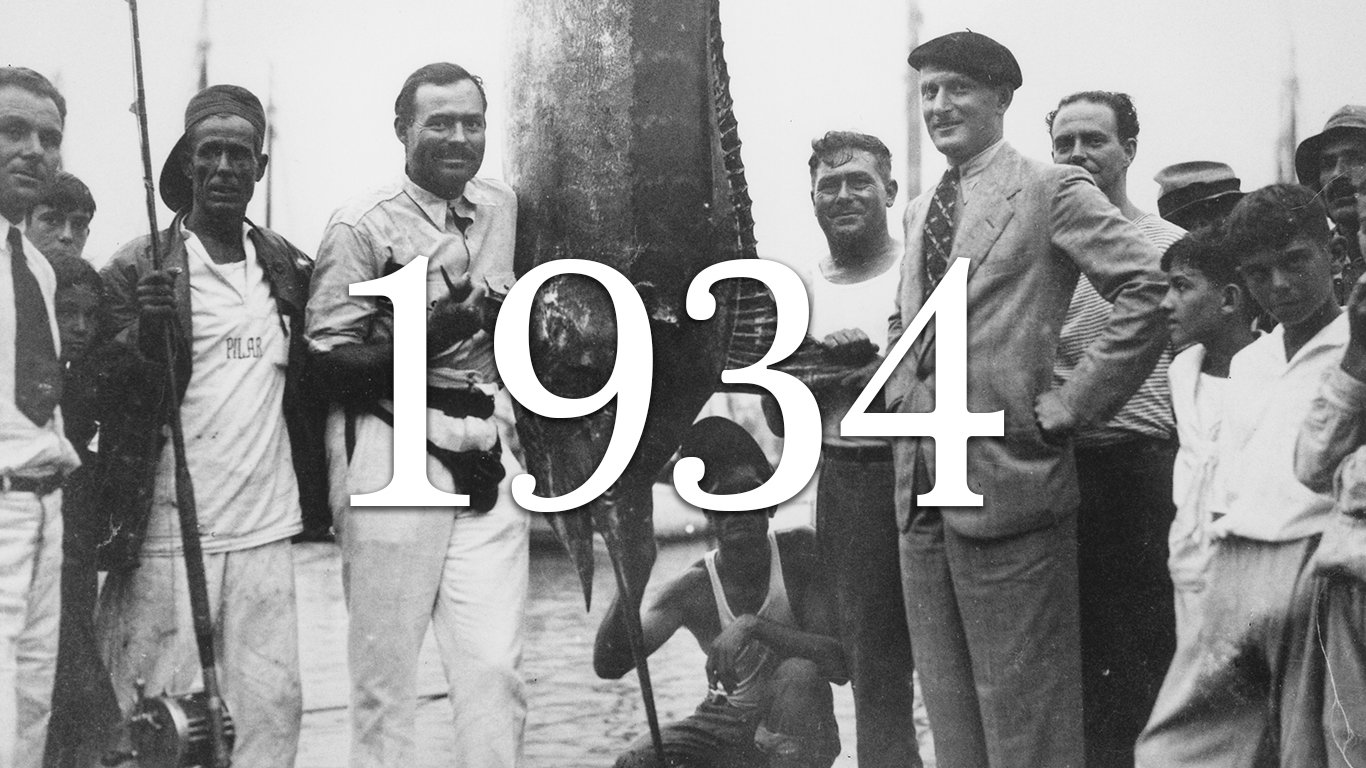
1934
> Start: 1,862.0
> End: 1,930.3
> High: 2,054.6
> Change: +3.7%
Source: Wikimedia Commons
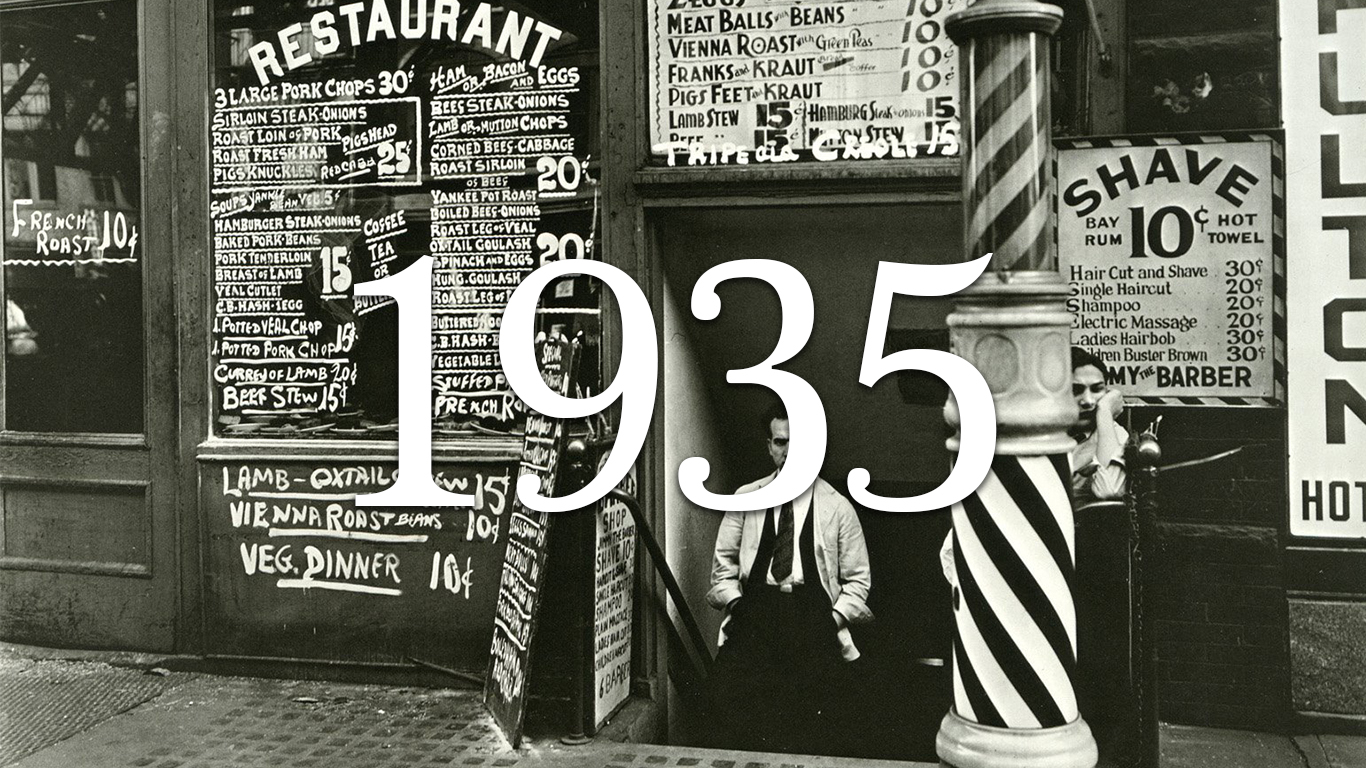
1935
> Start: 1,891.0
> End: 2,607.9
> High: 2,685.9
> Change: +37.9%
[in-text-ad-2]
Source: St. Paul Pioneer Press / Wikimedia Commons
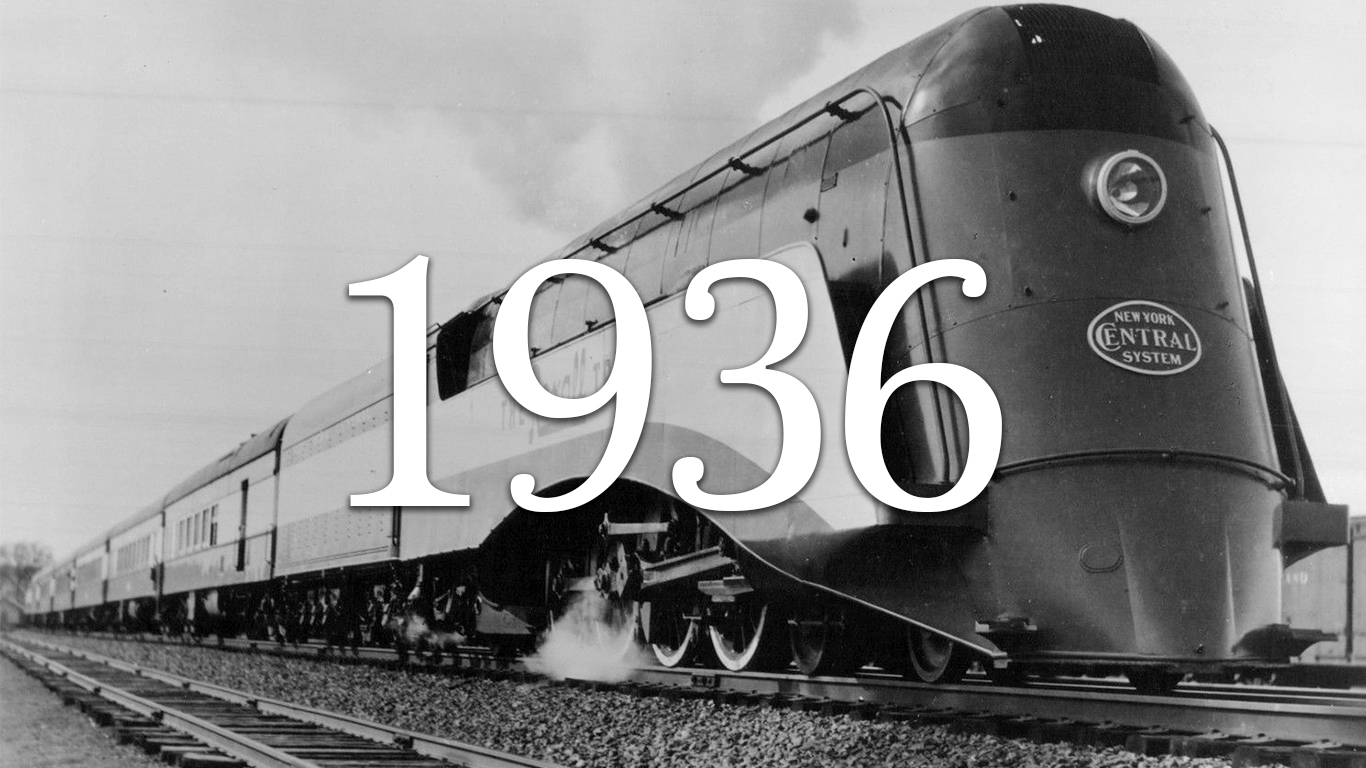
1936
> Start: 2,583.4
> End: 3,224.6
> High: 3,314.2
> Change: +24.8%
Source: State Library of New South Wales / Flickr
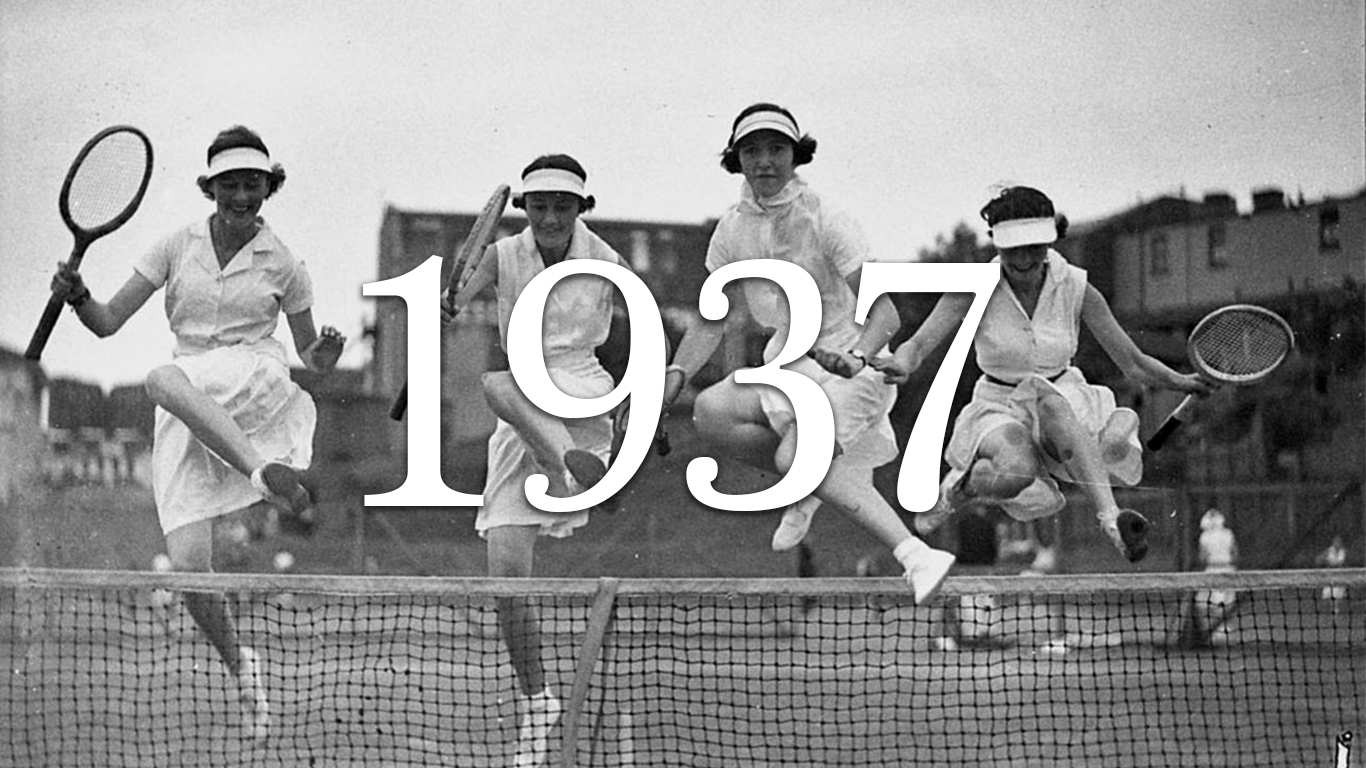
1937
> Start: 3,088.4
> End: 2,090.7
> High: 3,363.1
> Change: -32.3%
Source: Wikimedia Commons
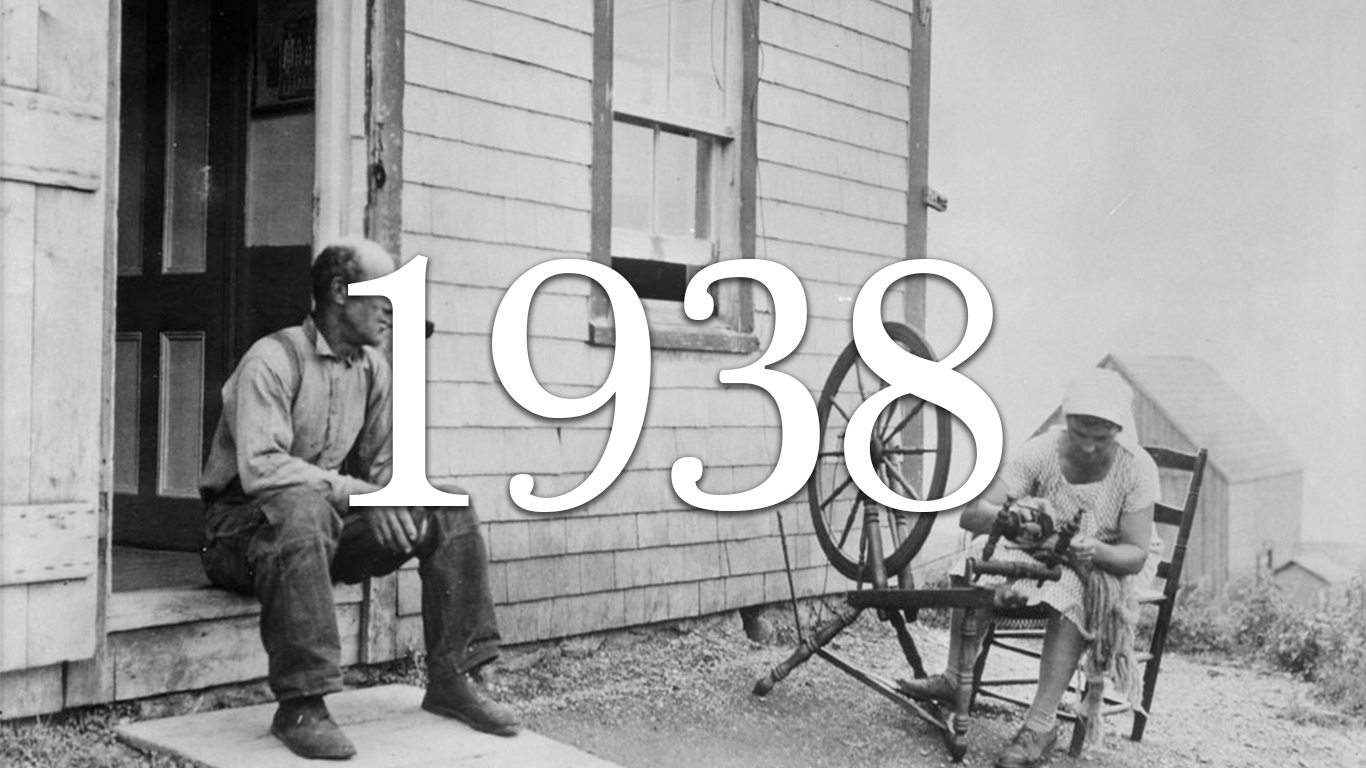
1938
> Start: 2,125.8
> End: 2,728.7
> High: 2,793.0
> Change: +28.4%
Source: Library of Congress / Wikimedia Commons
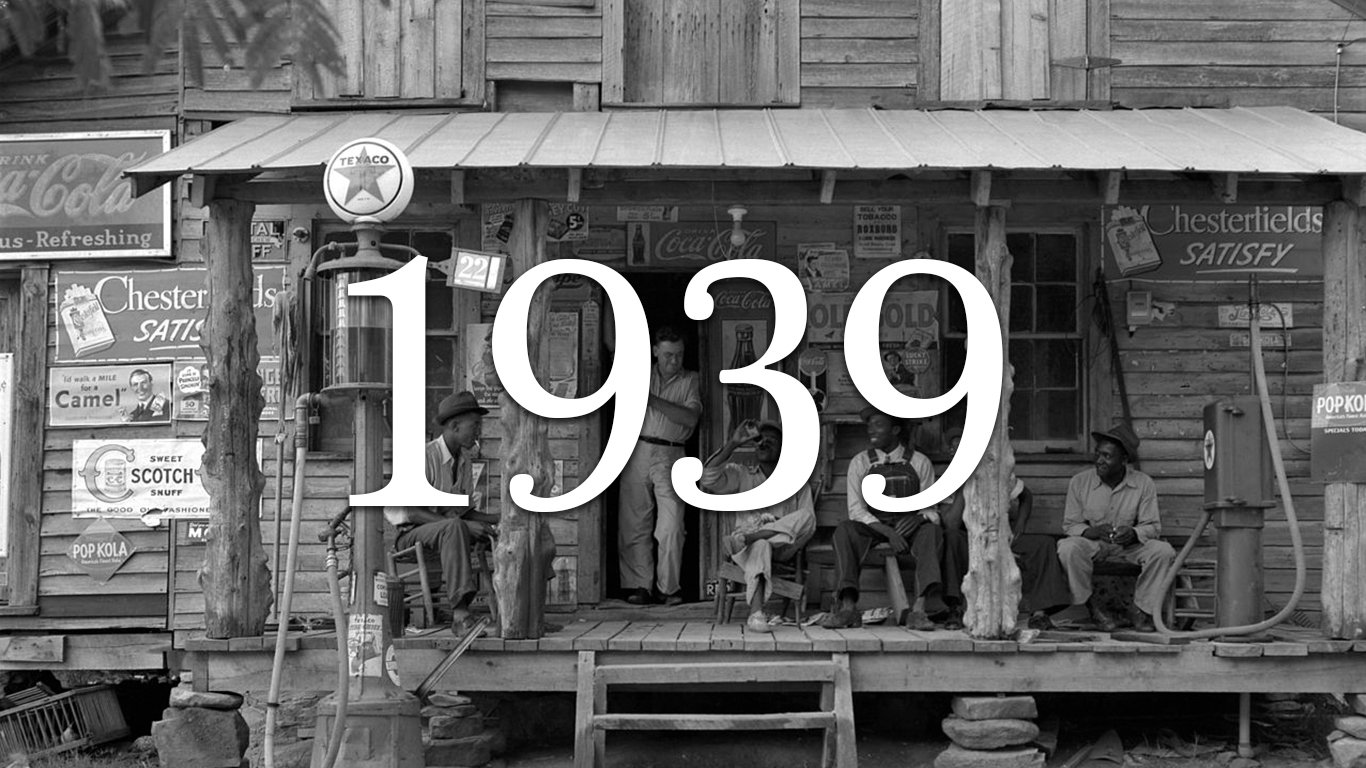
1939
> Start: 2,747.9
> End: 2,687.1
> High: 2,788.7
> Change: -2.2%
[in-text-ad]
Source: Wikimedia Commons
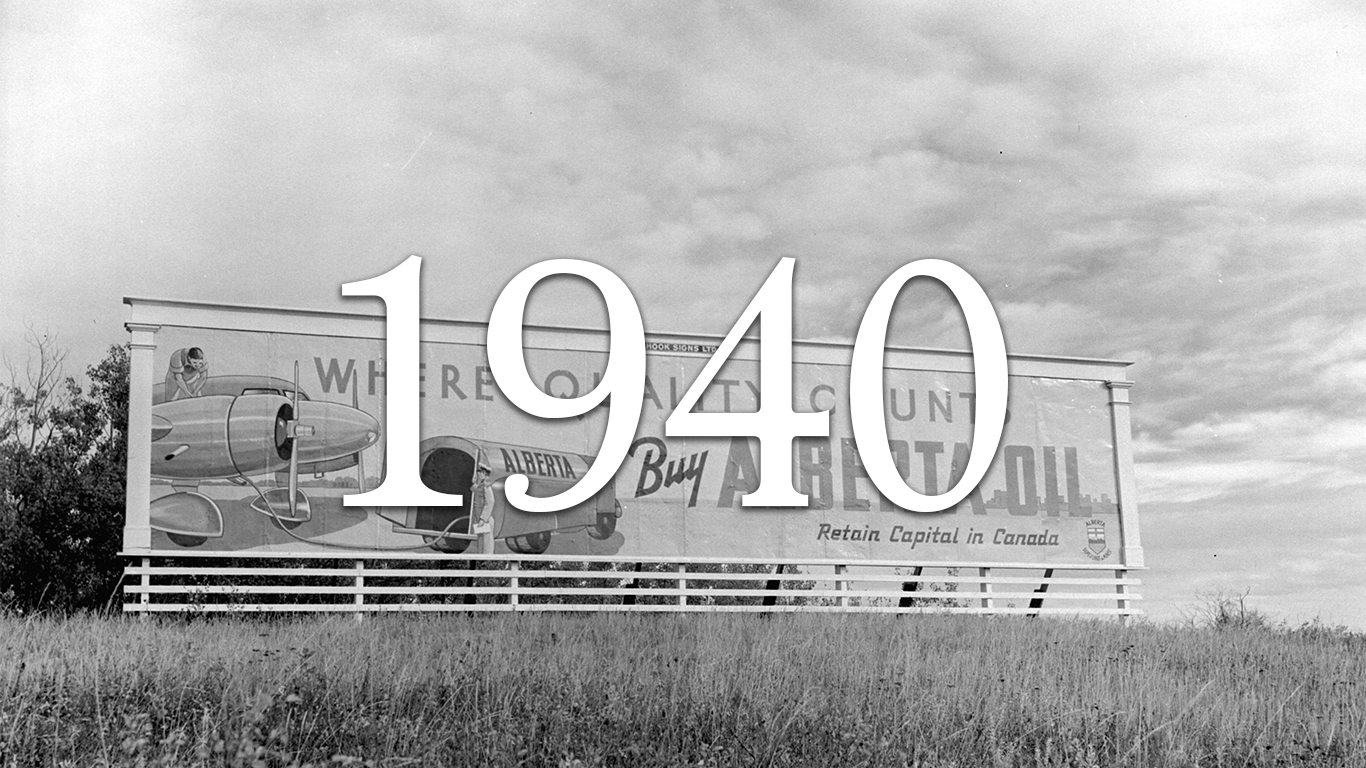
1940
> Start: 2,681.4
> End: 2,321.9
> High: 2,705.6
> Change: -13.4%
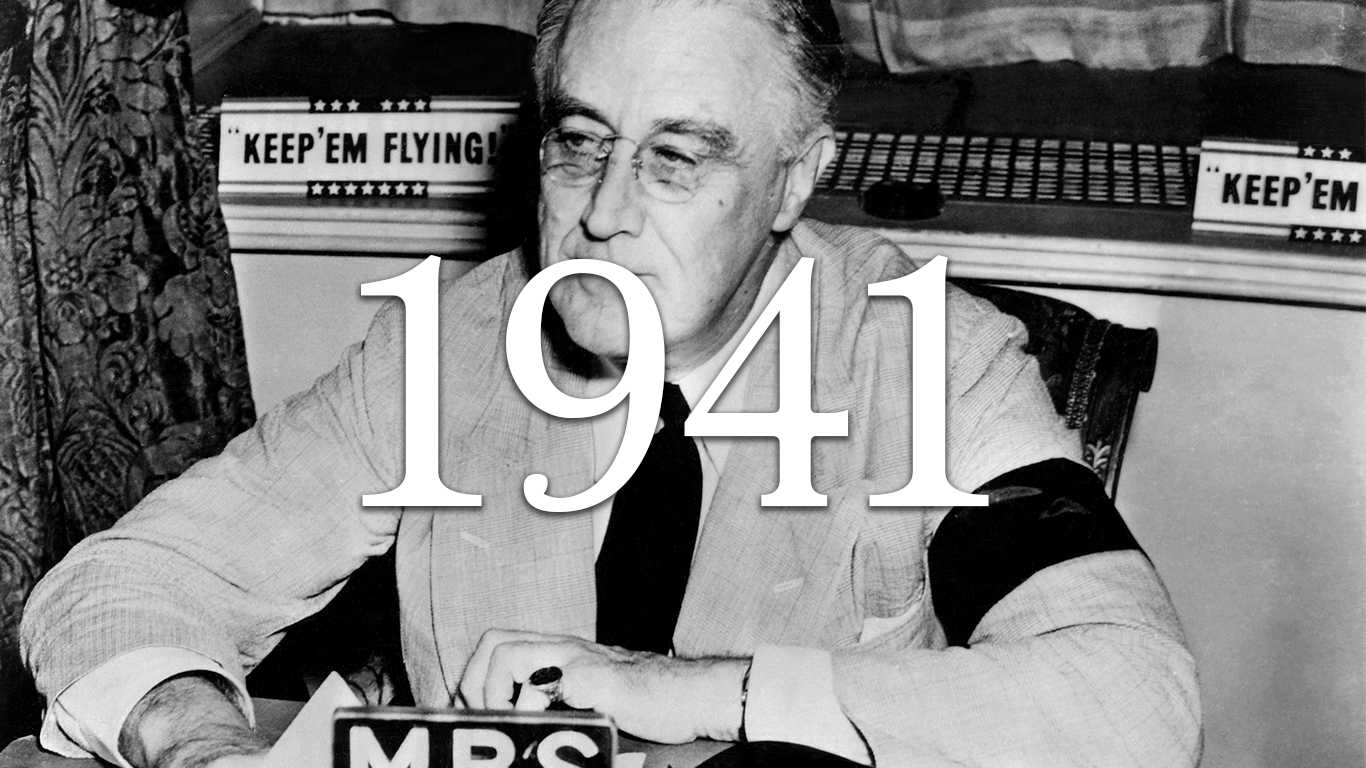
Source: National Archives and Records Administration, Franklin D. Roosevelt Library (NLFDR) / Wikimedia Commons
1941
> Start: 2,202.1
> End: 1,871.4
> High: 2,253.1
> Change: -15.0%
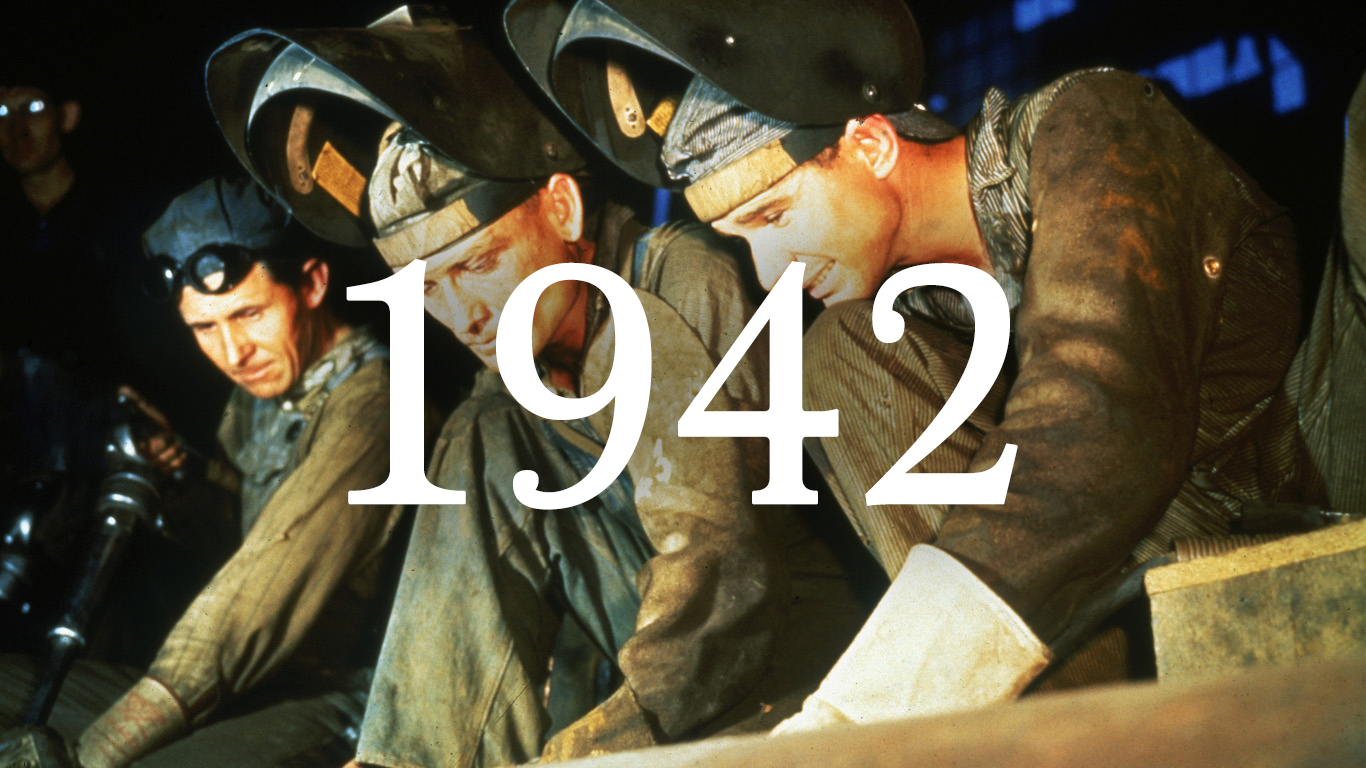
Source: Photo by Hulton Archive / Getty Images
1942
> Start: 1,718.7
> End: 1,819.8
> High: 1,824.5
> Change: +5.9%
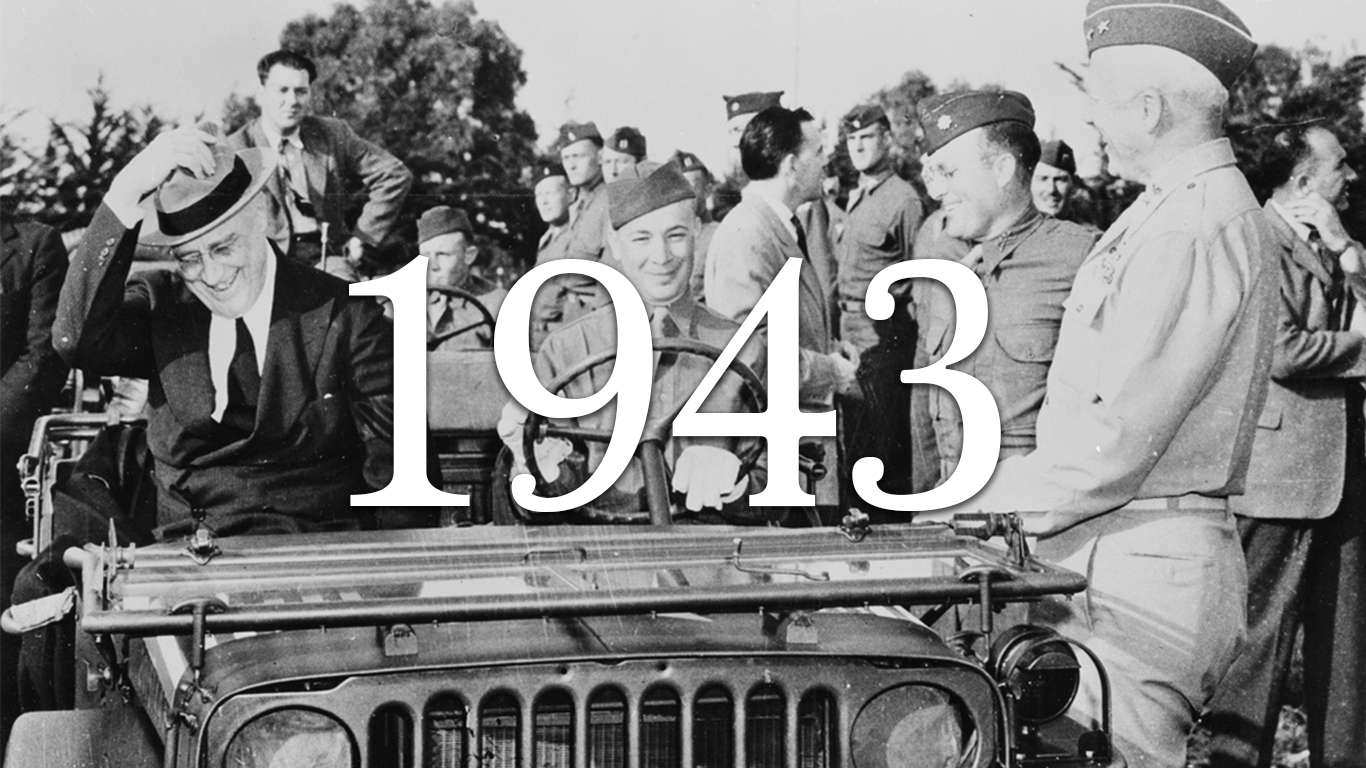
Source: pingnews.com / Flickr
1943
> Start: 1,722.2
> End: 1,951.4
> High: 2,094.0
> Change: +13.3%
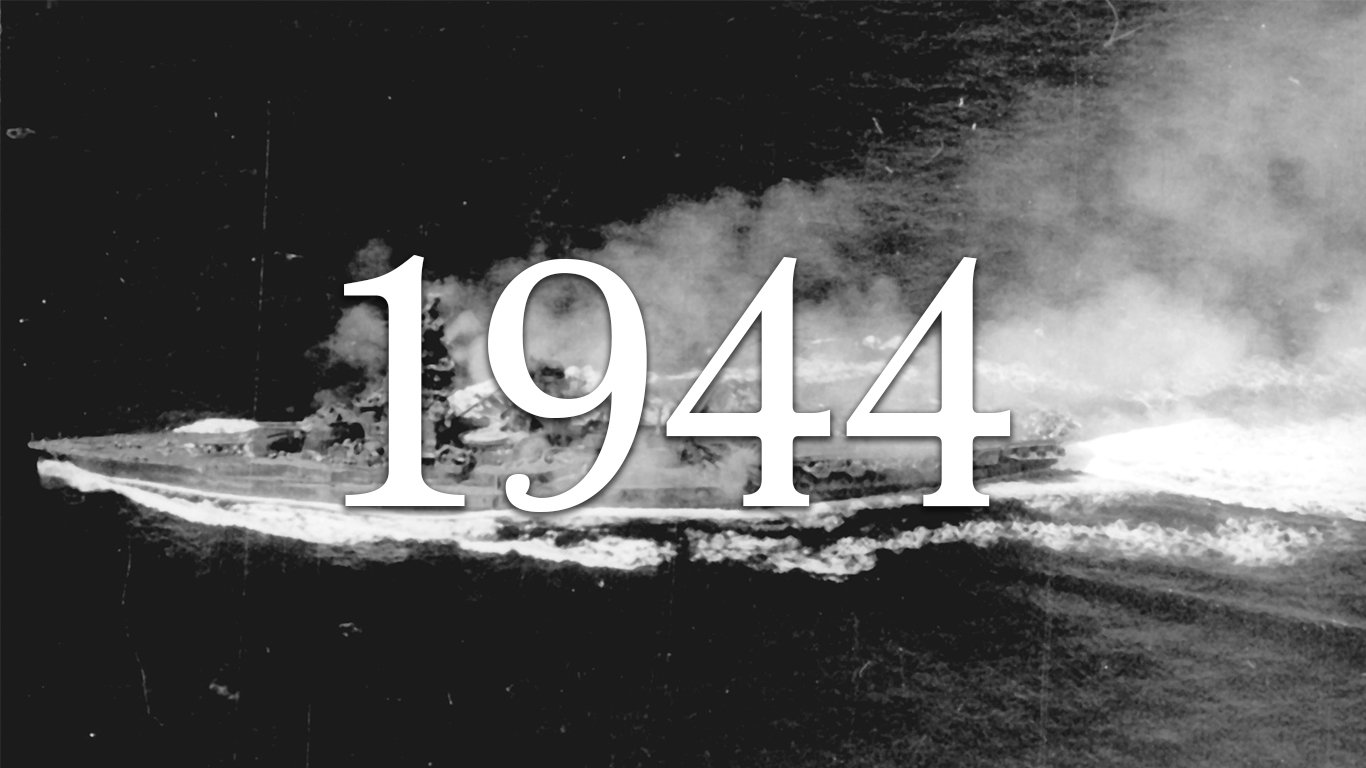
Source: U.S. Navy National Museum of Naval Aviation / Wikimedia Commons
1944
> Start: 1,918.5
> End: 2,150.0
> High: 2,153.0
> Change: +12.1%
Source: National Archives and Records Administration / Wikimedia Commons
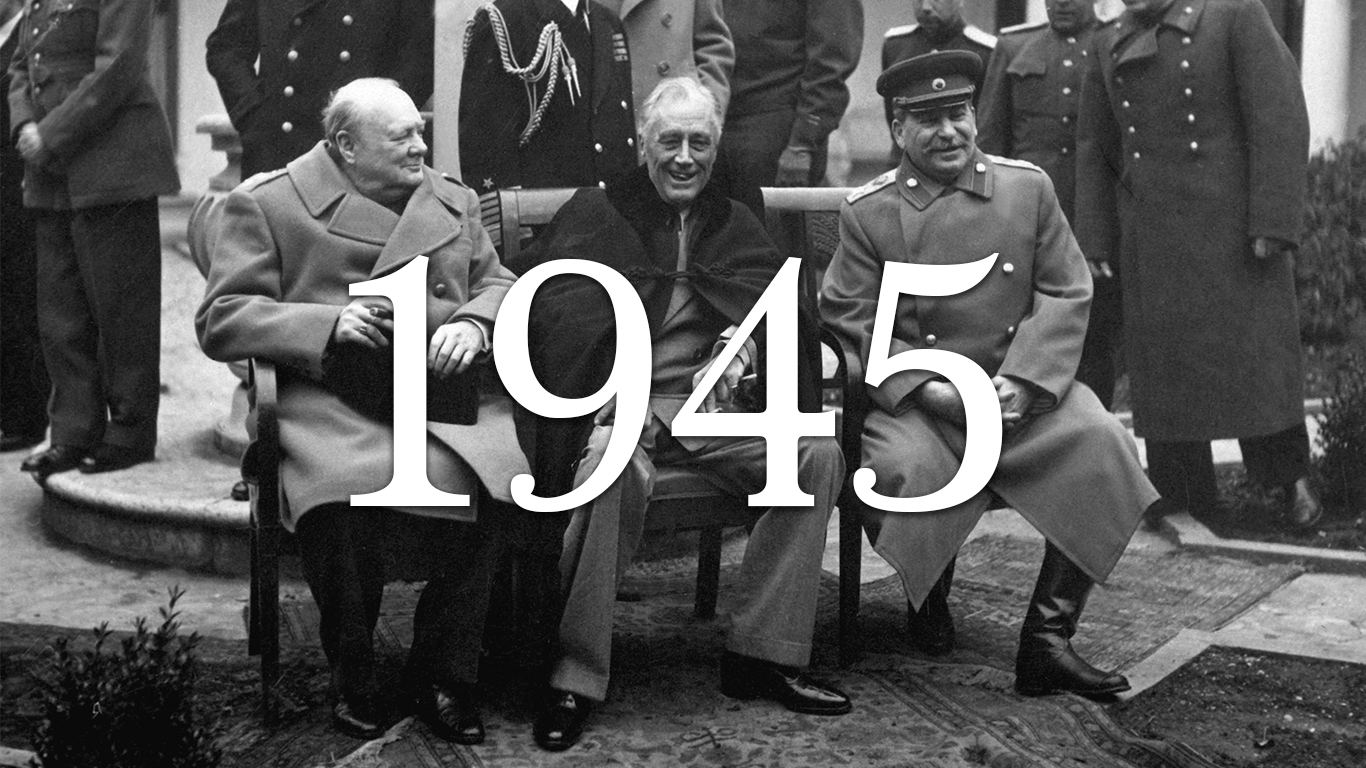
1945
> Start: 2,105.8
> End: 2,662.5
> High: 2,702.6
> Change: +26.4%
[in-text-ad-2]
Source: Wikimedia Commons
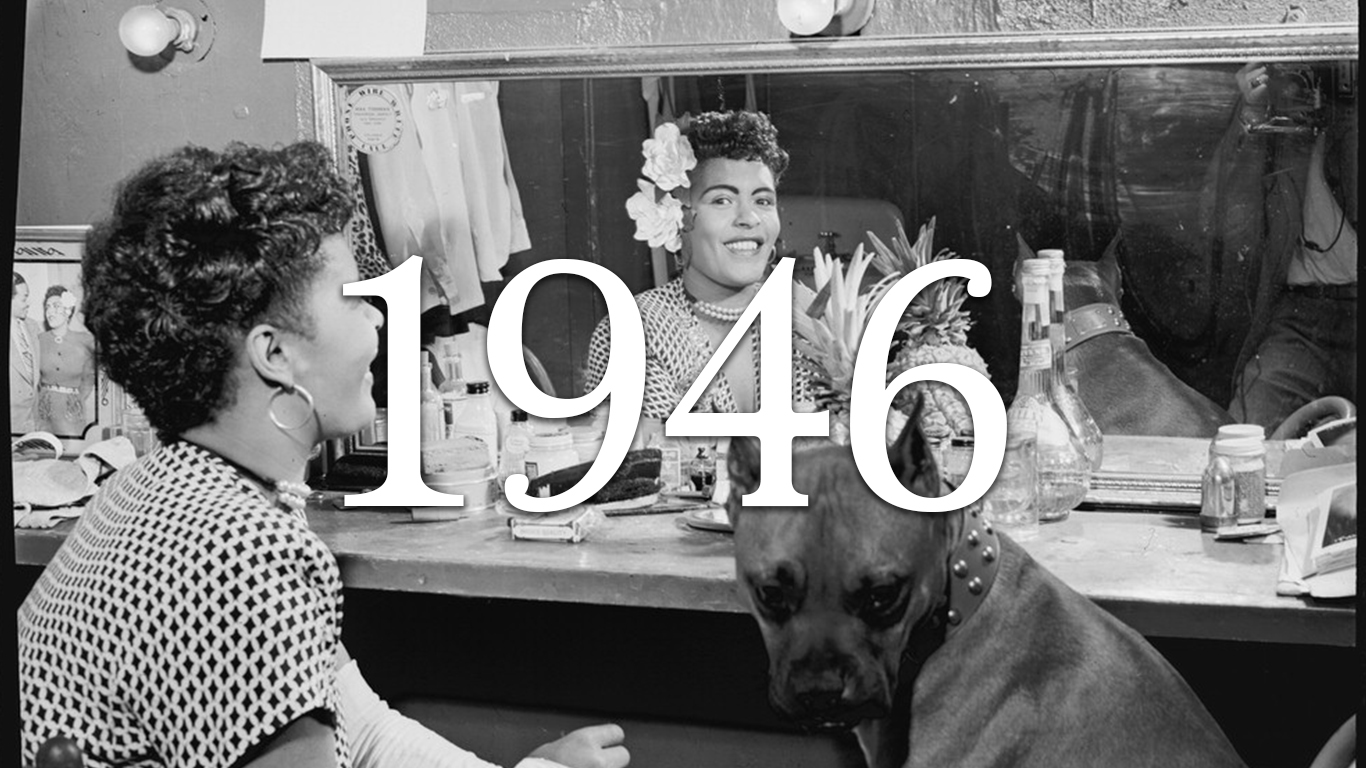
1946
> Start: 2,436.7
> End: 2,252.9
> High: 2,701.7
> Change: -7.5%
Source: Photo by Michael Ochs Archives / Getty Images
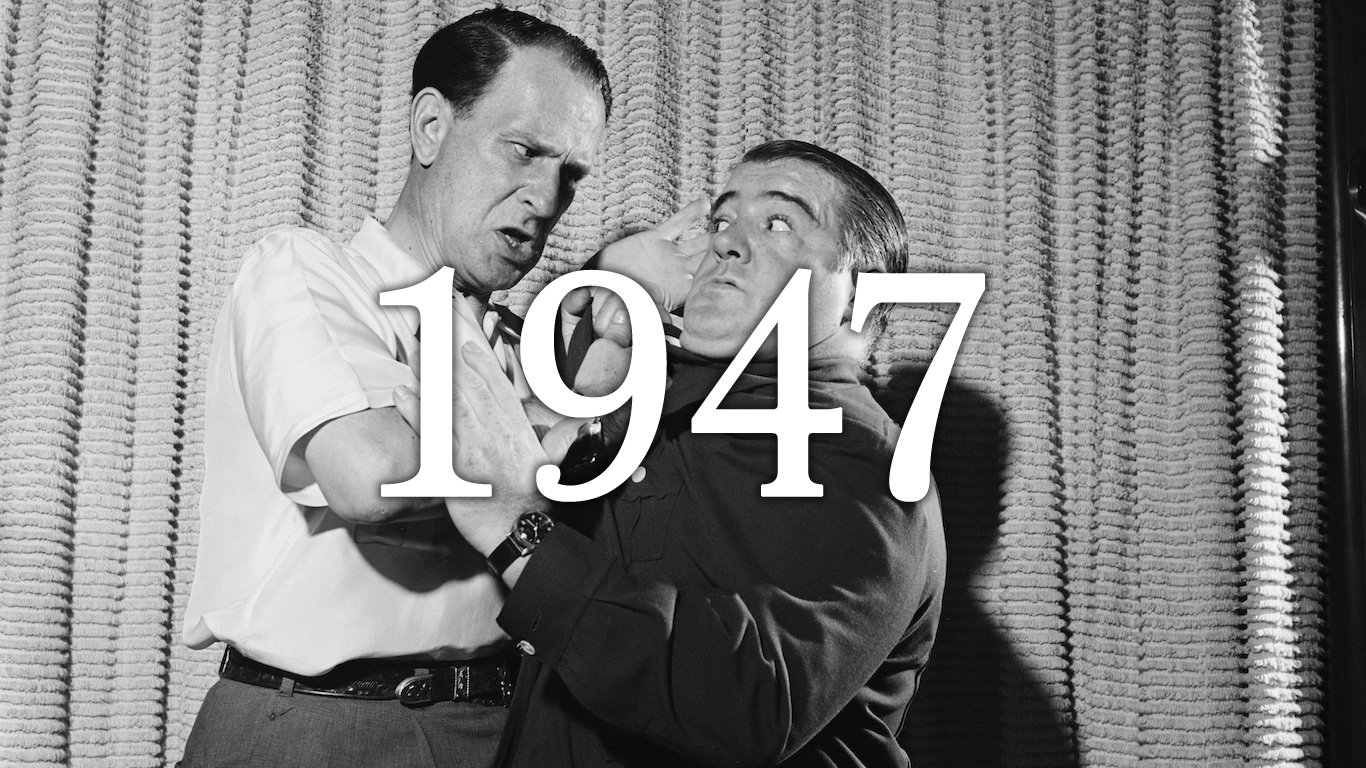
1947
> Start: 1,961.5
> End: 2,014.6
> High: 2,077.8
> Change: +2.7%
Source: Wikimedia Commons
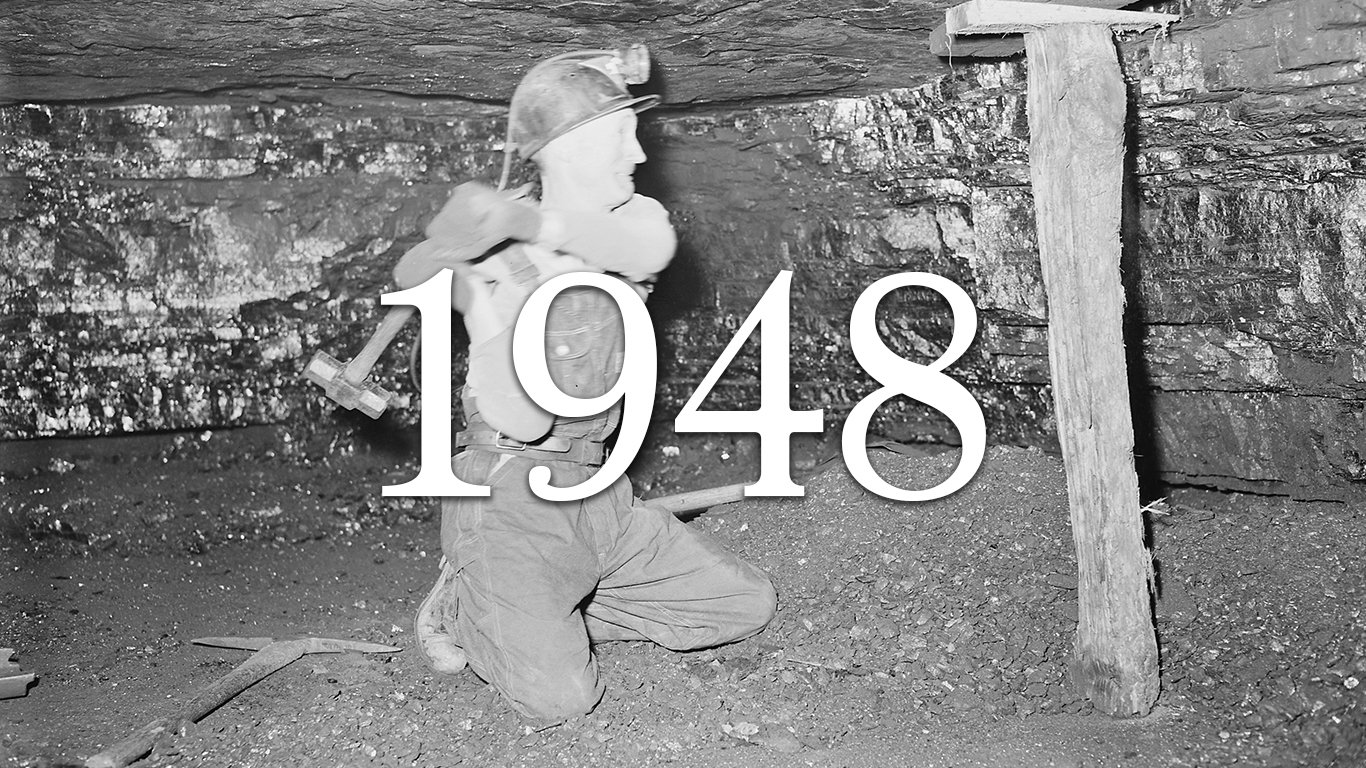
1948
> Start: 1,867.8
> End: 1,829.2
> High: 1,992.8
> Change: -2.1%
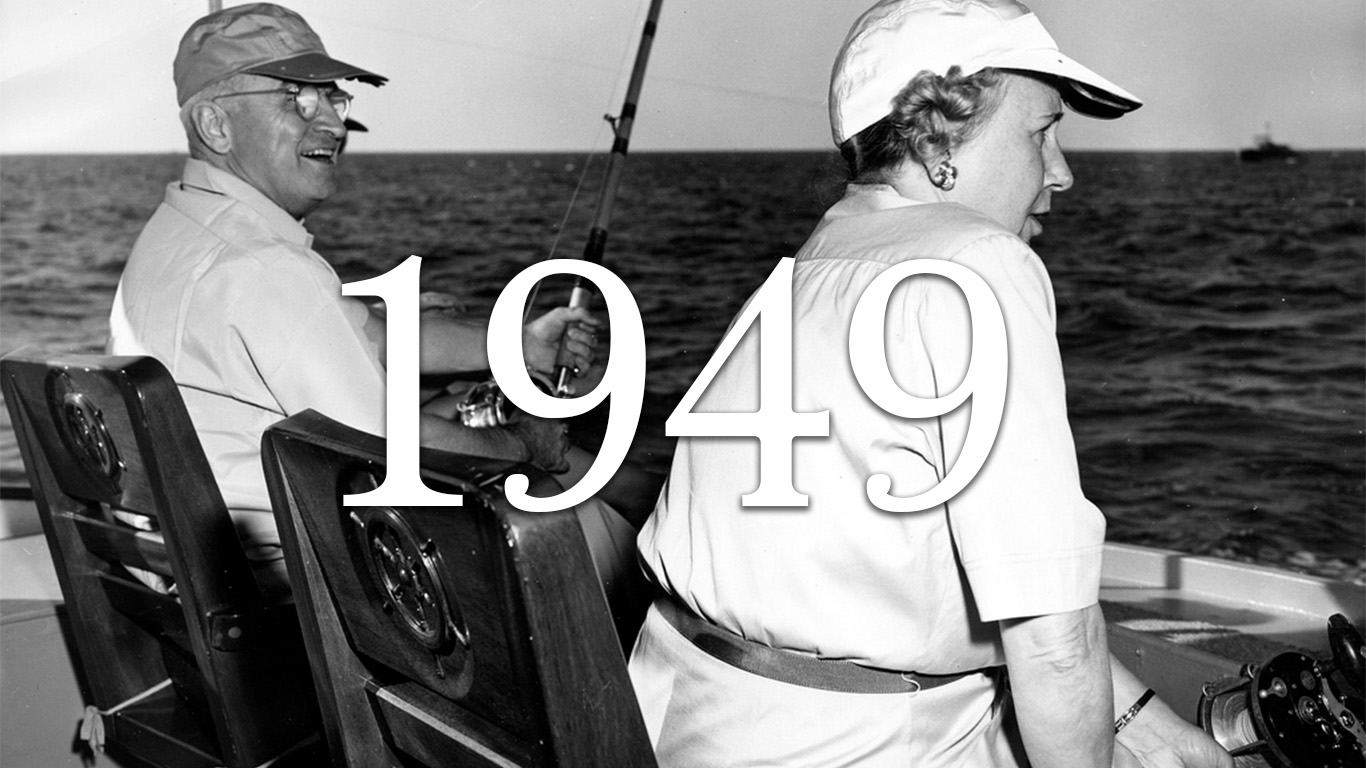
Source: The U.S. National Archives / Flickr
1949
> Start: 1,823.2
> End: 2,084.6
> High: 2,088.7
> Change: +14.3%
[in-text-ad]
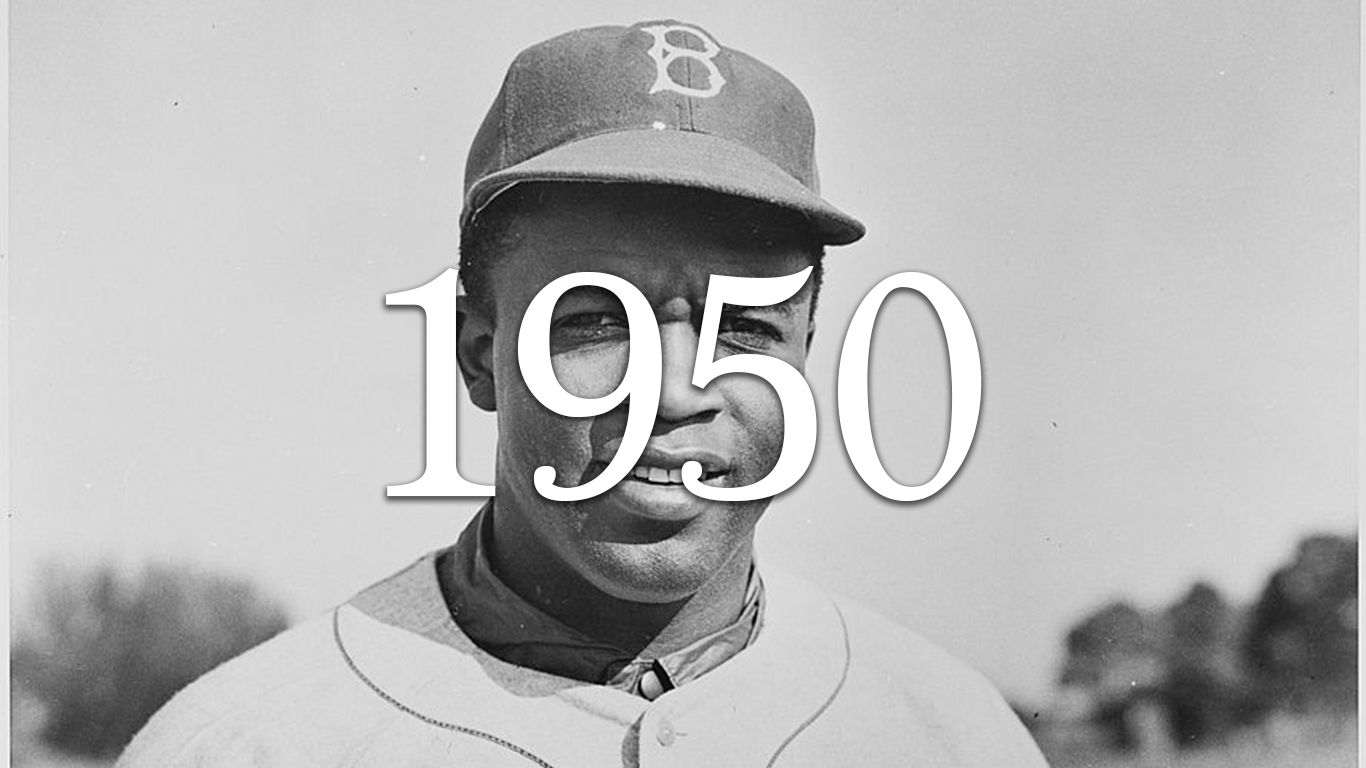
Source: National Archives and Records Administration / Wikimedia Commons
1950
> Start: 2,051.9
> End: 2,428.7
> High: 2,429.3
> Change: +18.4%
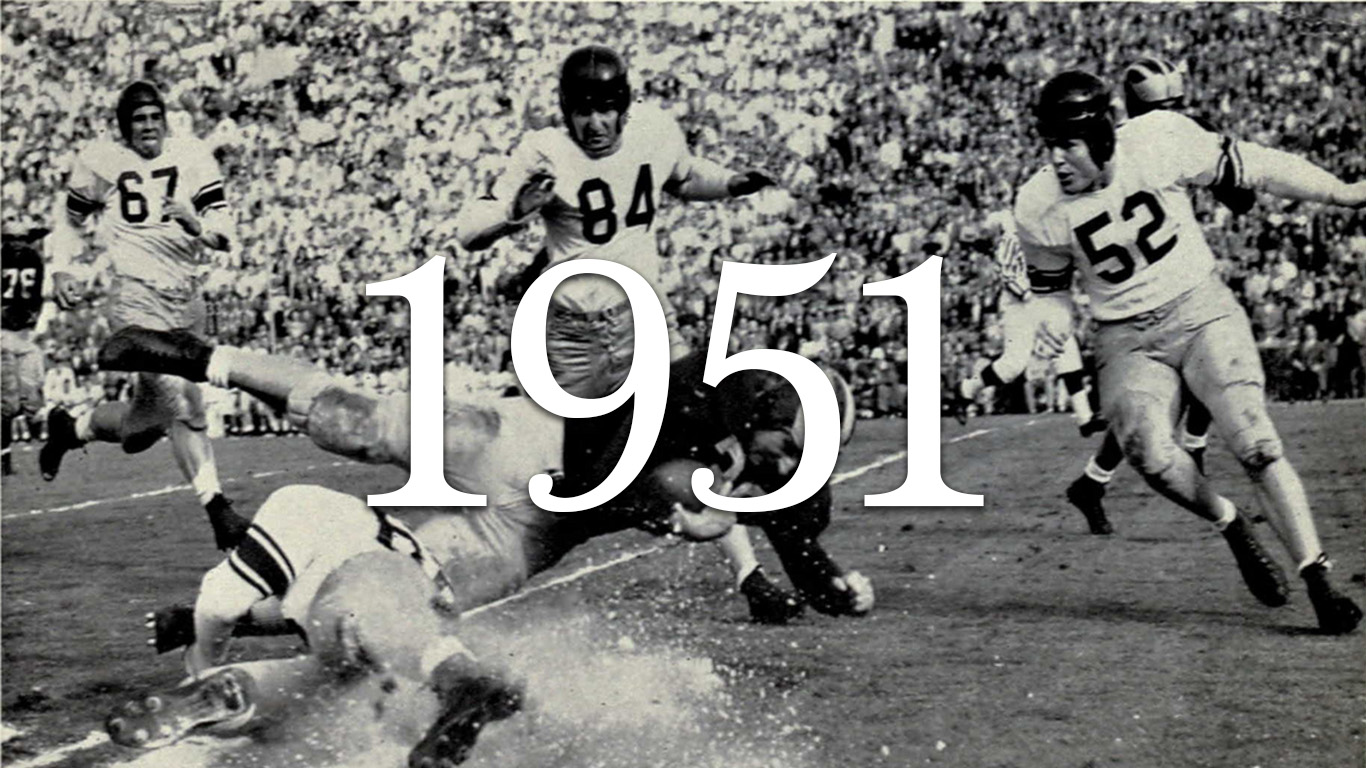
Source: Public Domain / Wikimedia Commons
1951
> Start: 2,294.2
> End: 2,574.5
> High: 2,642.7
> Change: +12.2%
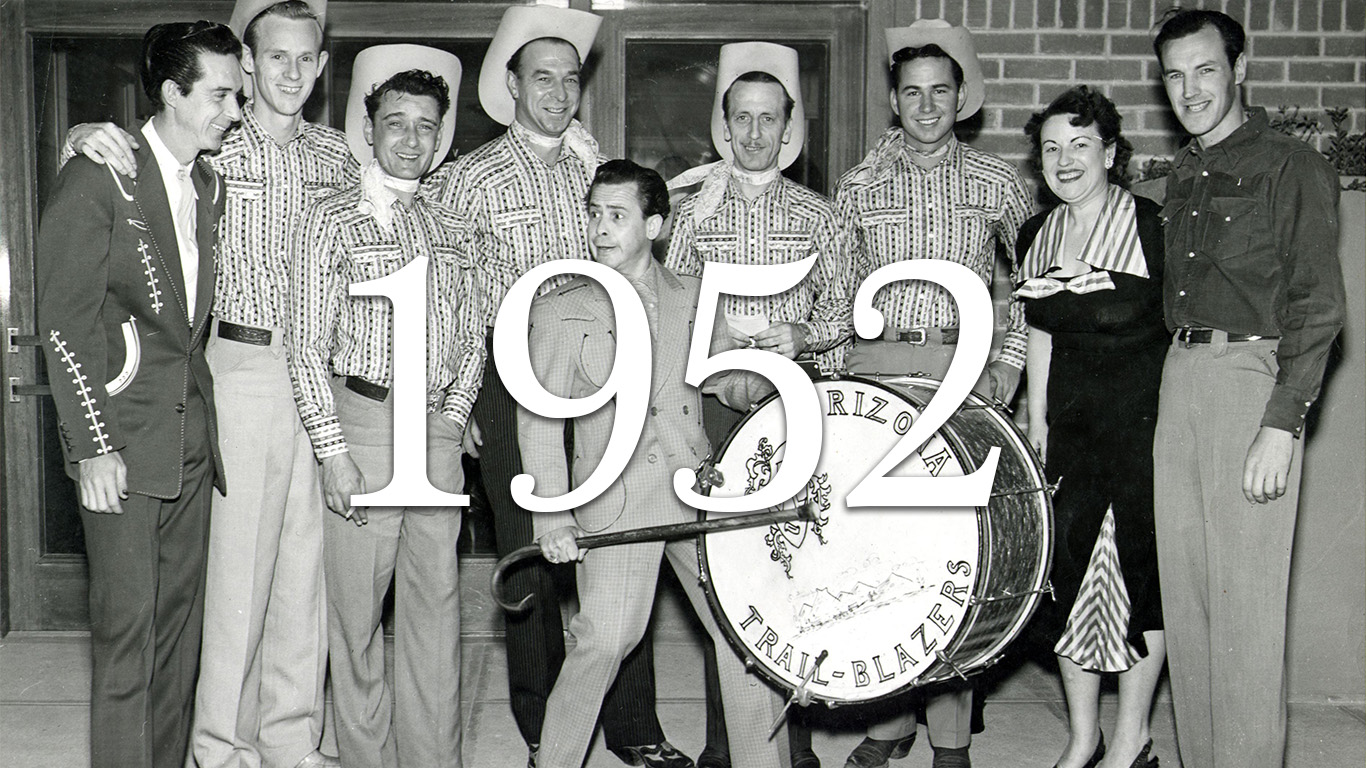
Source: Wikimedia Commons
1952
> Start: 2,525.1
> End: 2,731.3
> High: 2,732.3
> Change: +8.2%
 24/7 Wall St.
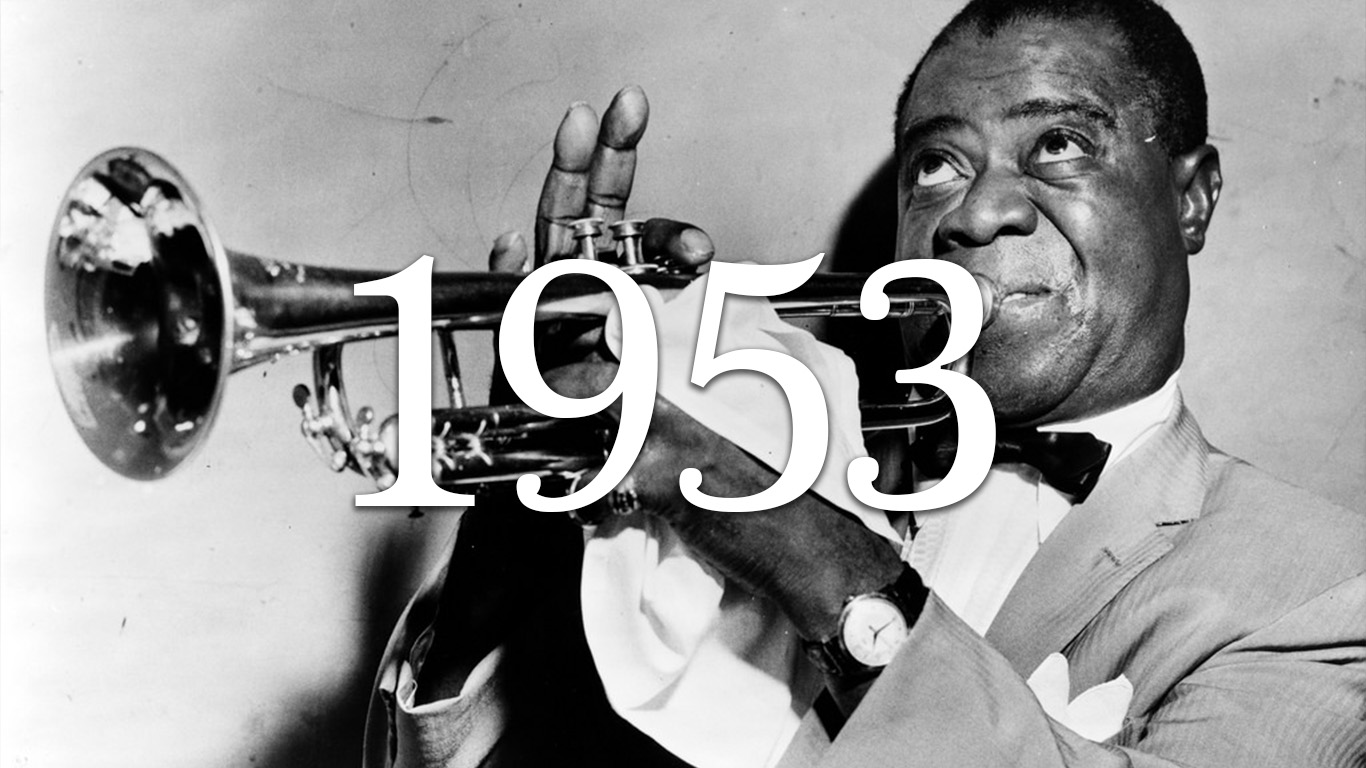
Source: Library of Congress / Wikimedia Commons
1953
> Start: 2,713.1
> End: 2,608.7
> High: 2,728.4
> Change: -3.8%
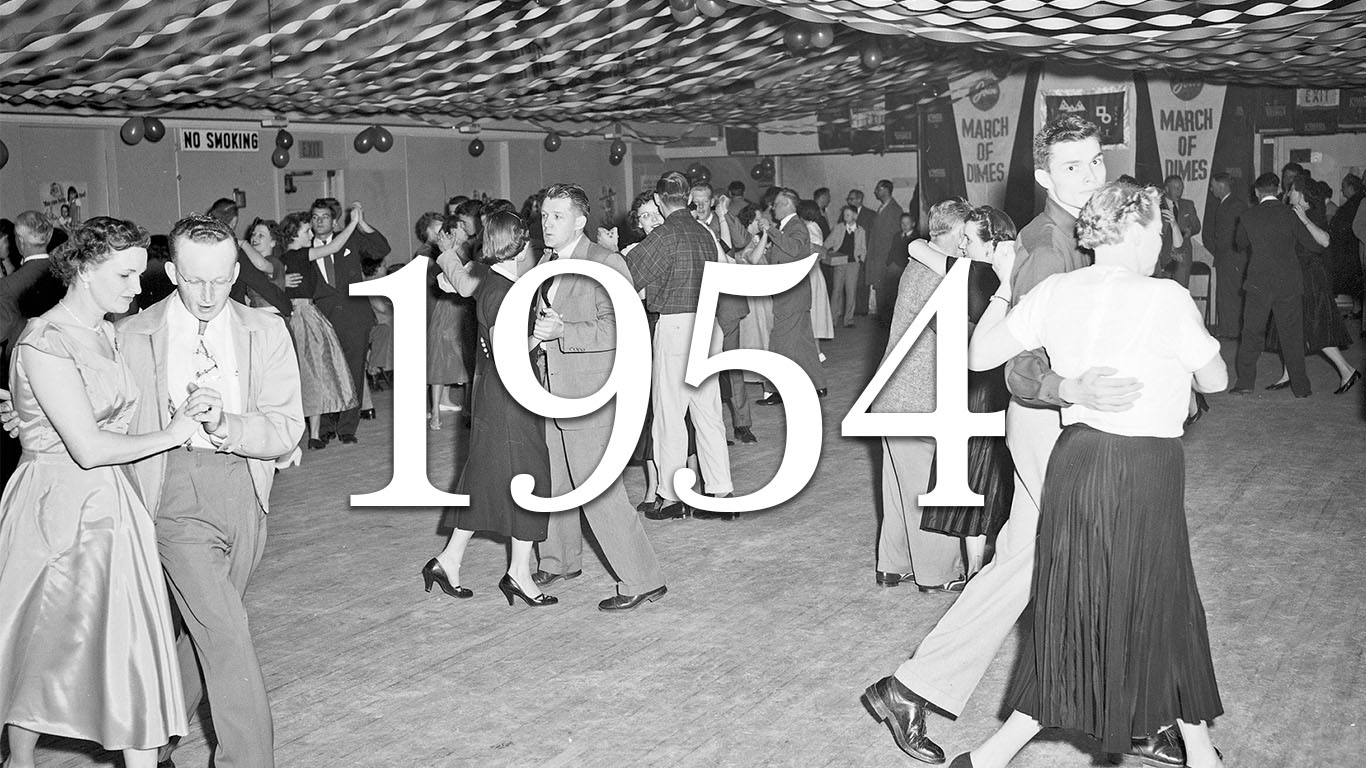
Source: Seattle Municipal Archives / Wikimedia Commons
1954
> Start: 2,614.5
> End: 3,737.4
> High: 3,737.4
> Change: +42.9%
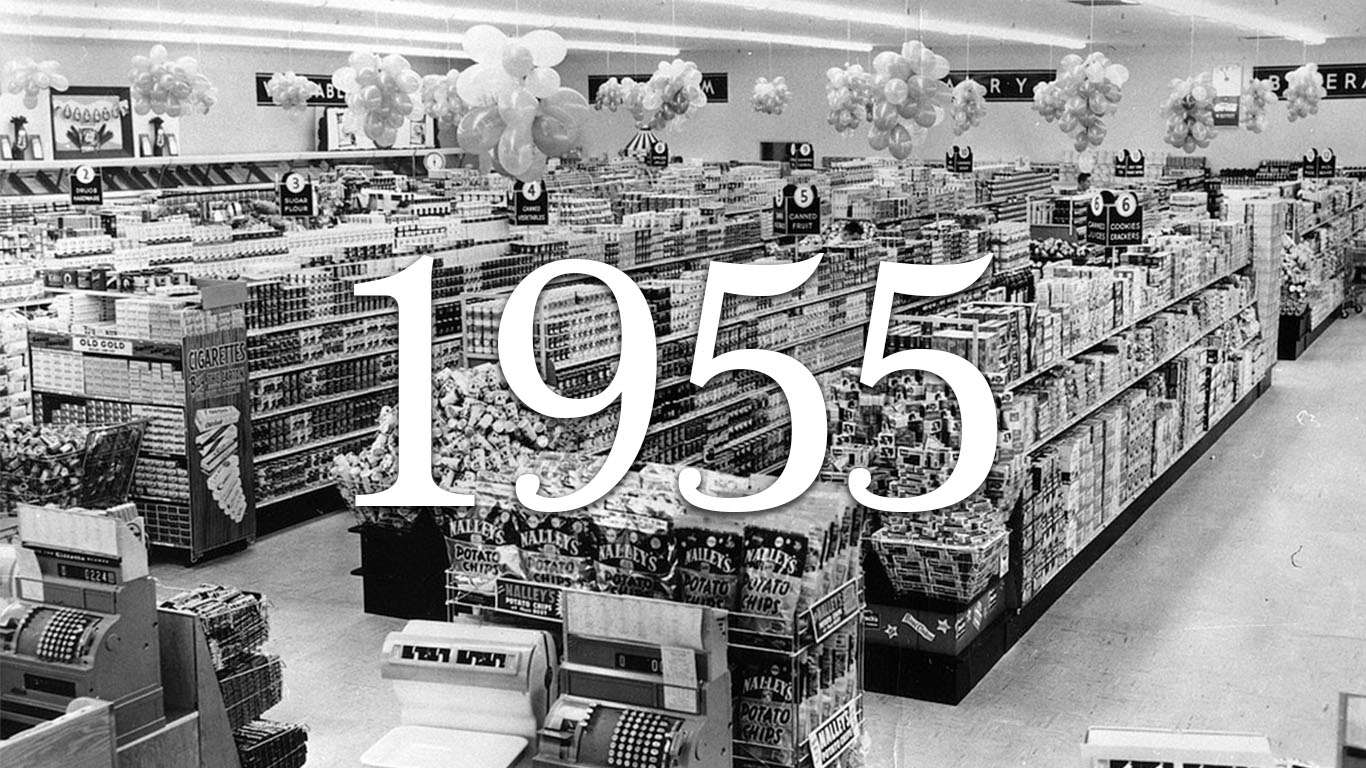
Source: Seattle Municipal Archives / Wikimedia Commons
1955
> Start: 3,793.1
> End: 4,530.7
> High: 4,530.7
> Change: +19.4%
[in-text-ad-2]
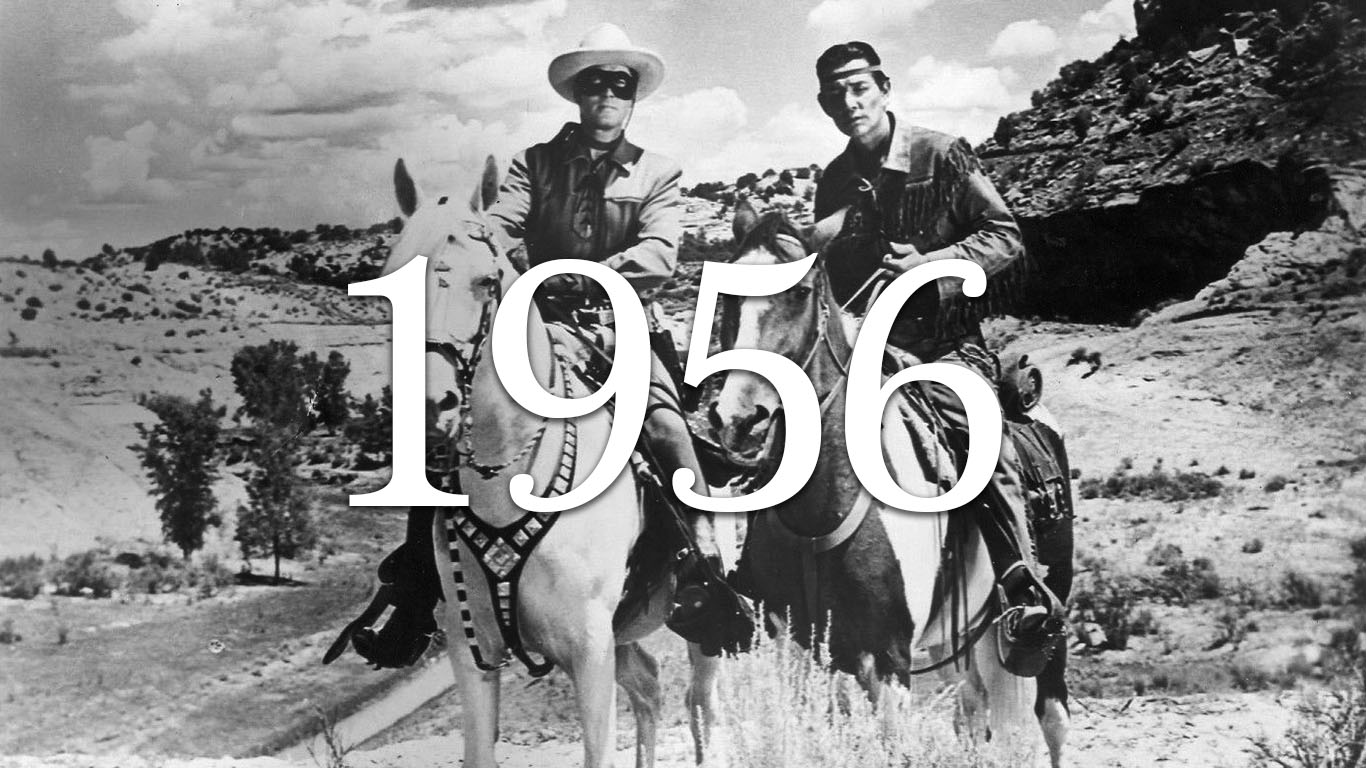
Source: ABC Television / Wikimedia Commons
1956
> Start: 4,440.1
> End: 4,565.2
> High: 4,762.5
> Change: +2.8%
Source: Public Domain / Wikimedia Commons
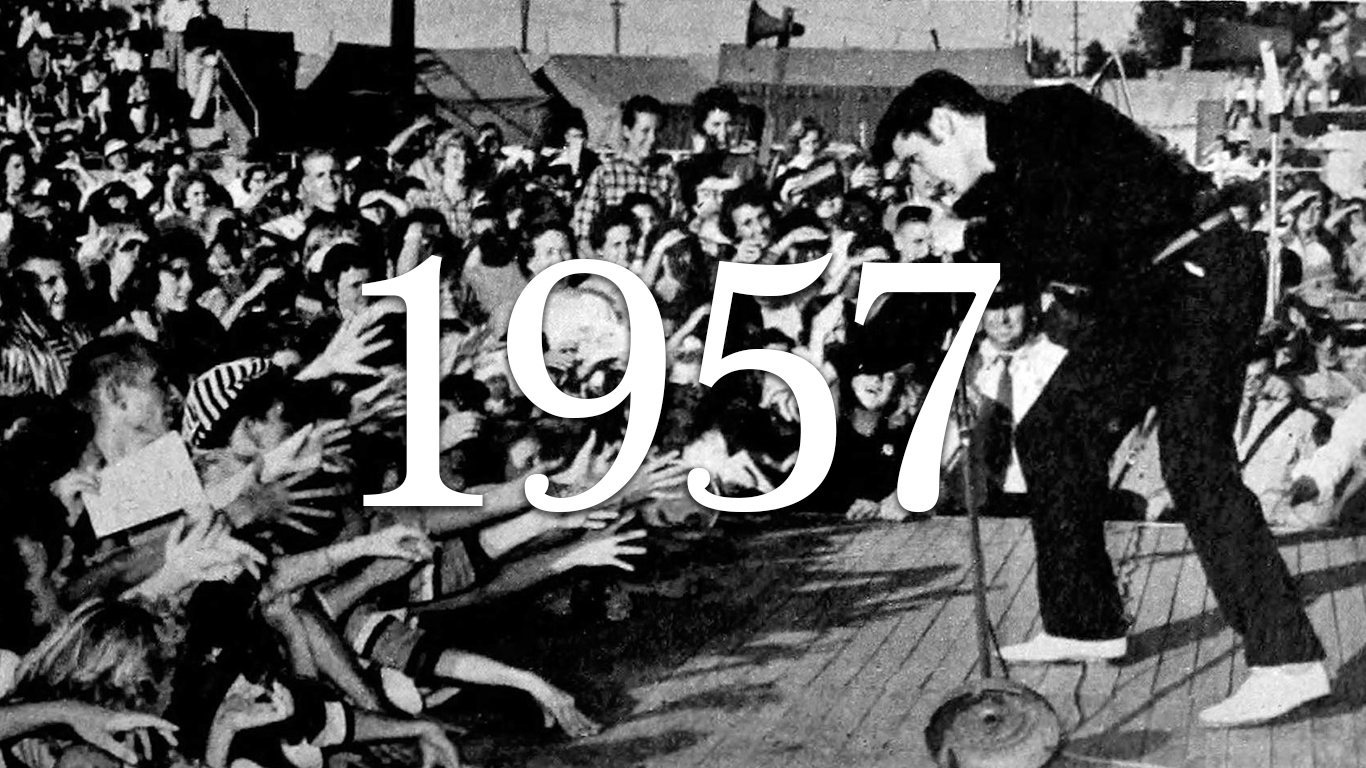
1957
> Start: 4,377.6
> End: 3,845.0
> High: 4,595.9
> Change: -12.2%
Source: National Archives and Records Administration / Wikimedia Commons
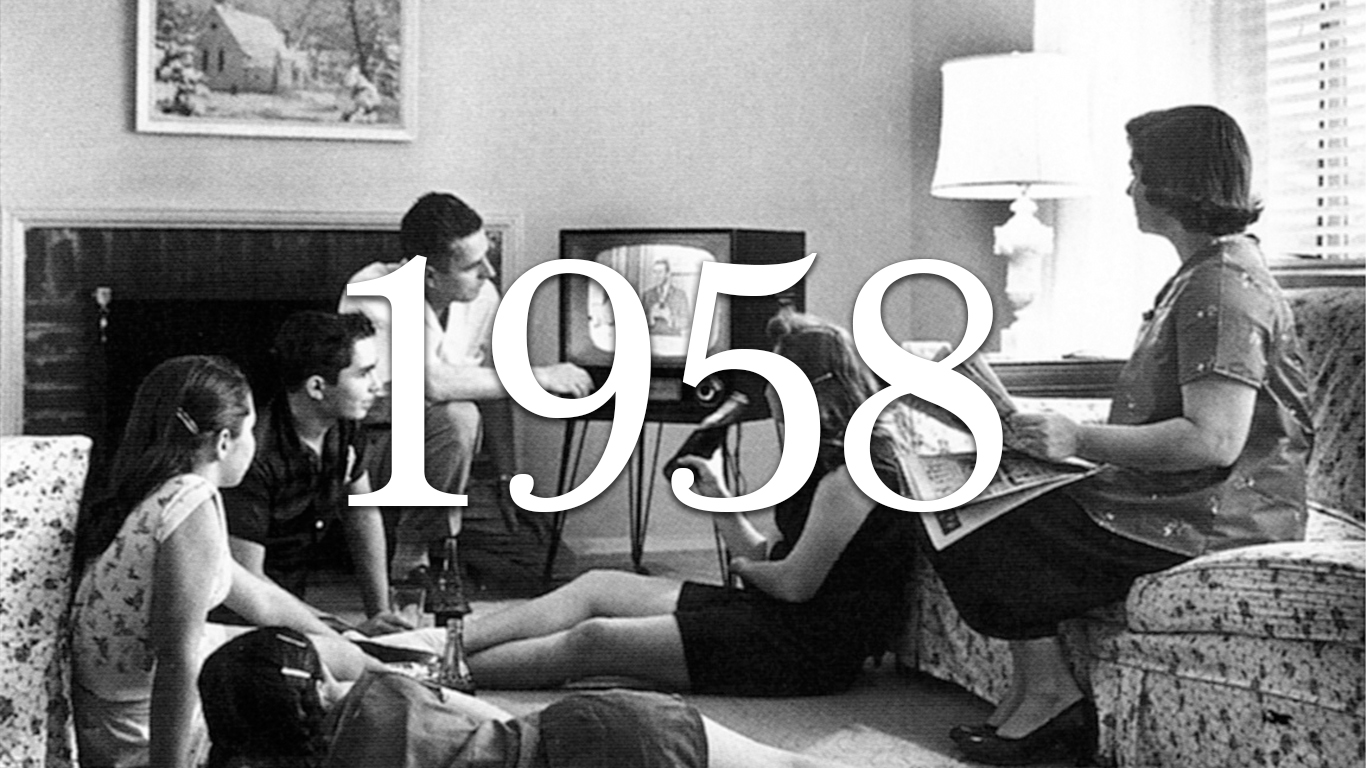
1958
> Start: 3,773.4
> End: 5,013.7
> High: 5,013.7
> Change: +32.9%
Source: The Sporting News Archives / Wikimedia Commons
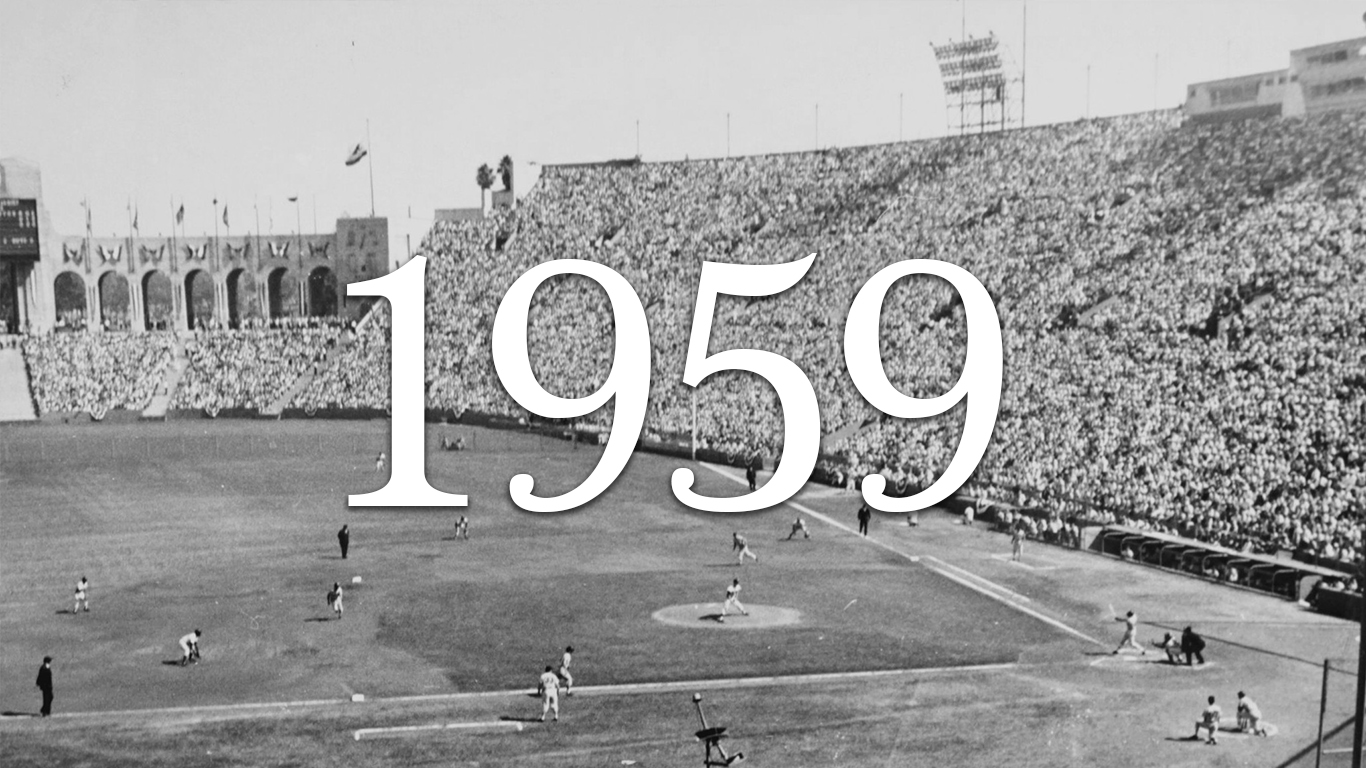
1959
> Start: 5,006.0
> End: 5,787.8
> High: 5,787.8
> Change: +15.6%
[in-text-ad]
Source: Alden Jewell / Wikimedia Commons
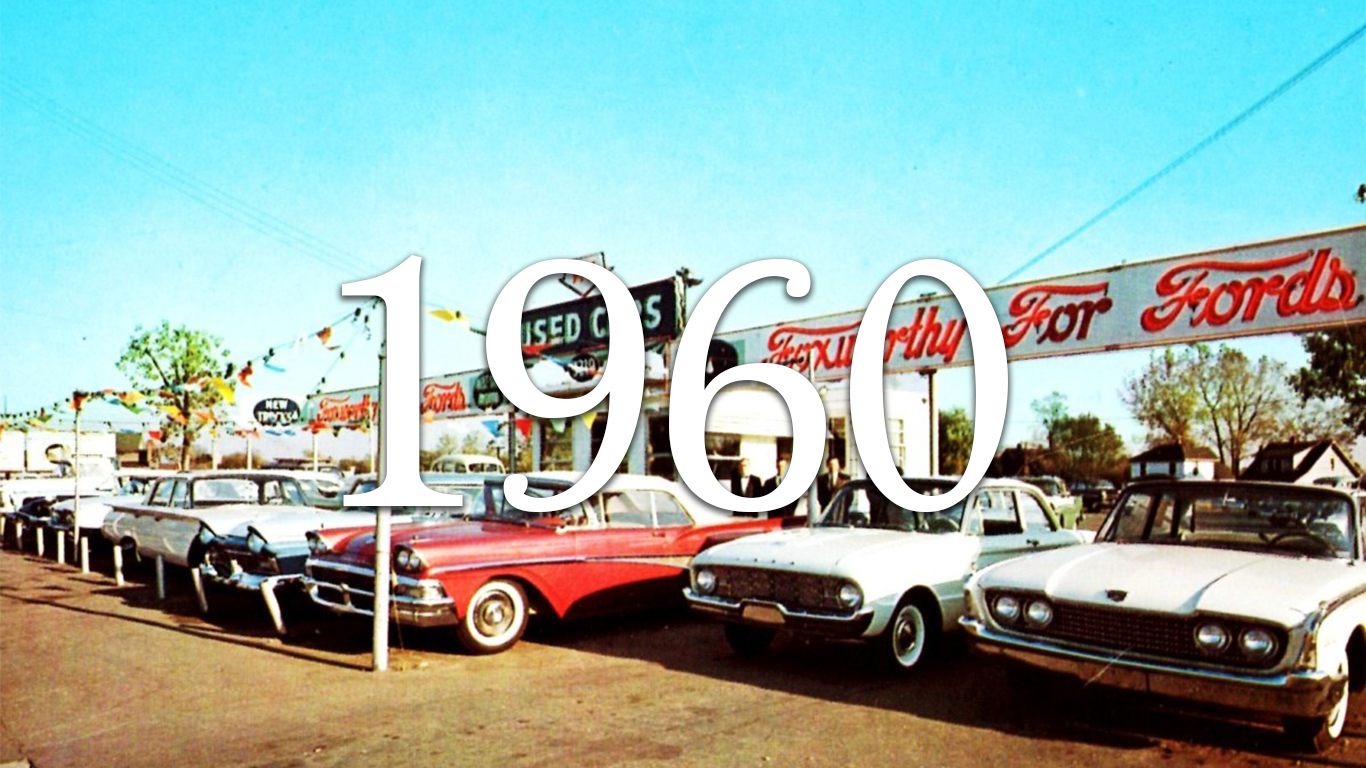
1960
> Start: 5,695.4
> End: 5,165.6
> High: 5,749.2
> Change: -9.3%
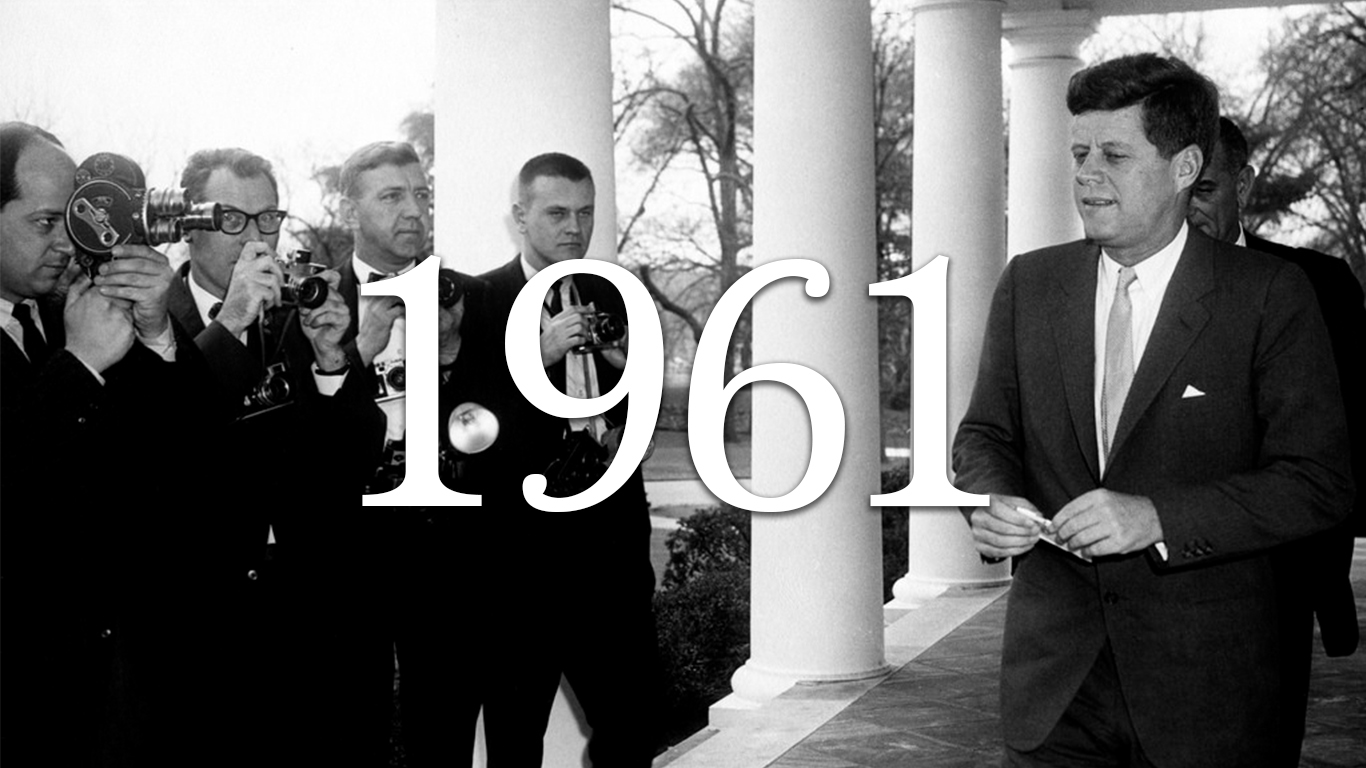
Source: The U.S. National Archives / Wikimedia Commons
1961
> Start: 5,067.0
> End: 6,070.7
> High: 6,102.0
> Change: +19.8%
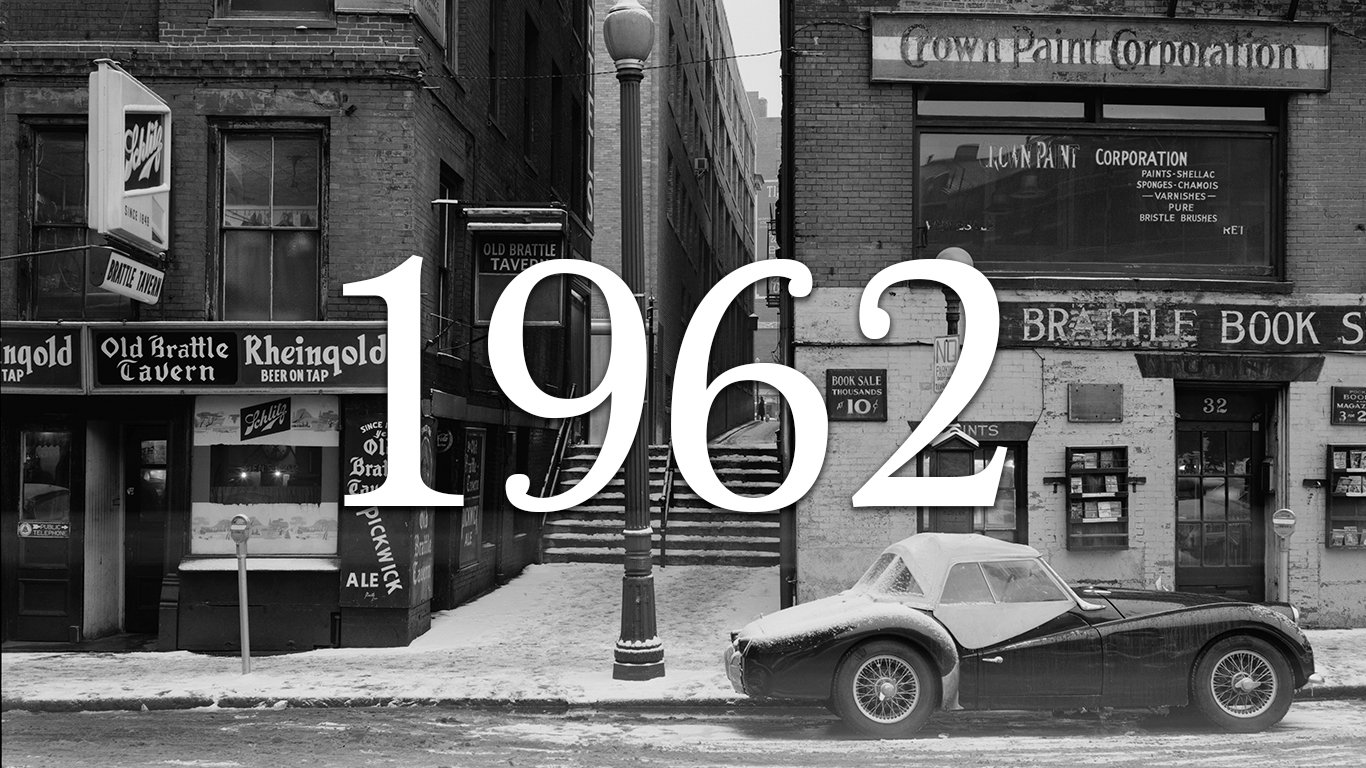
Source: Wikimedia Commons
1962
> Start: 5,949.7
> End: 5,353.6
> High: 5,960.4
> Change: -10.0%
 24/7 Wall St.
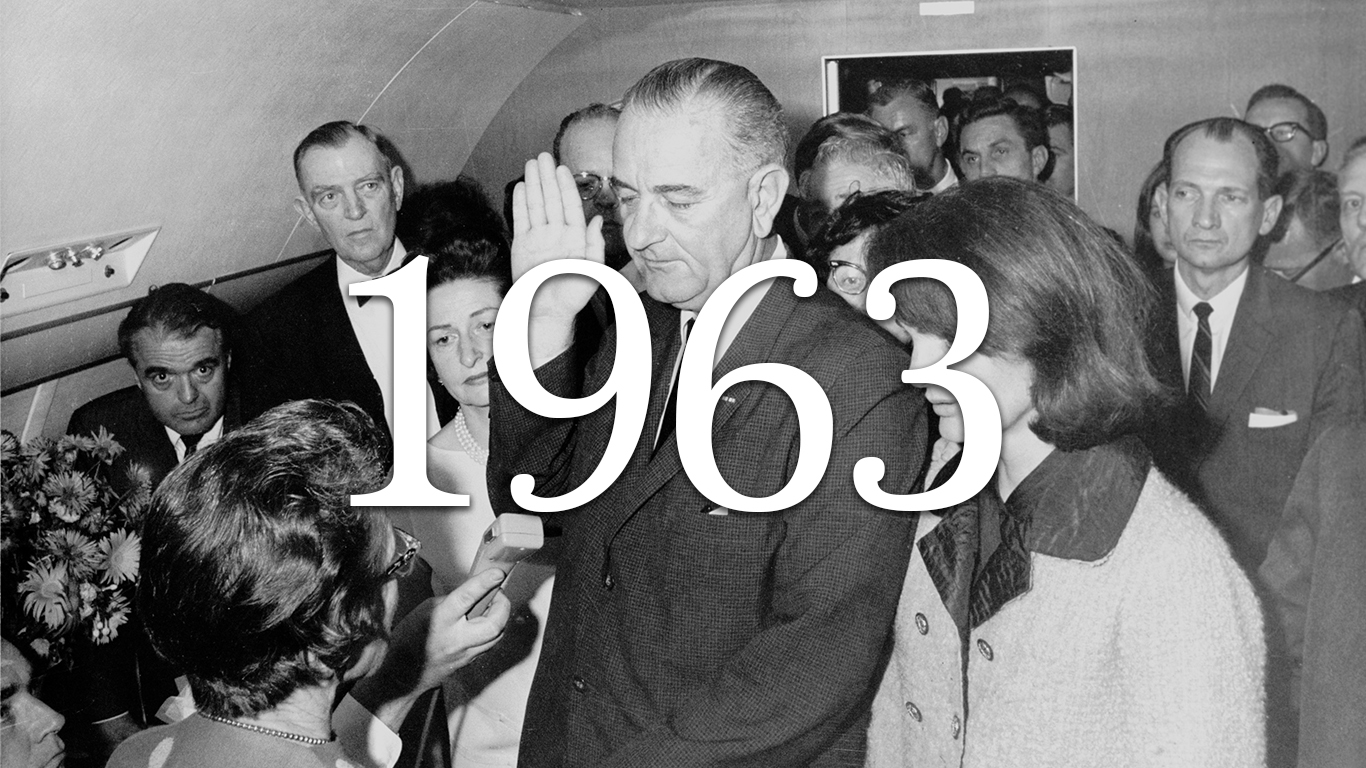
Source: Executive Office of the President of the United States / Wikimedia Commons
1963
> Start: 5,247.6
> End: 6,190.0
> High: 6,224.6
> Change: +18.0%
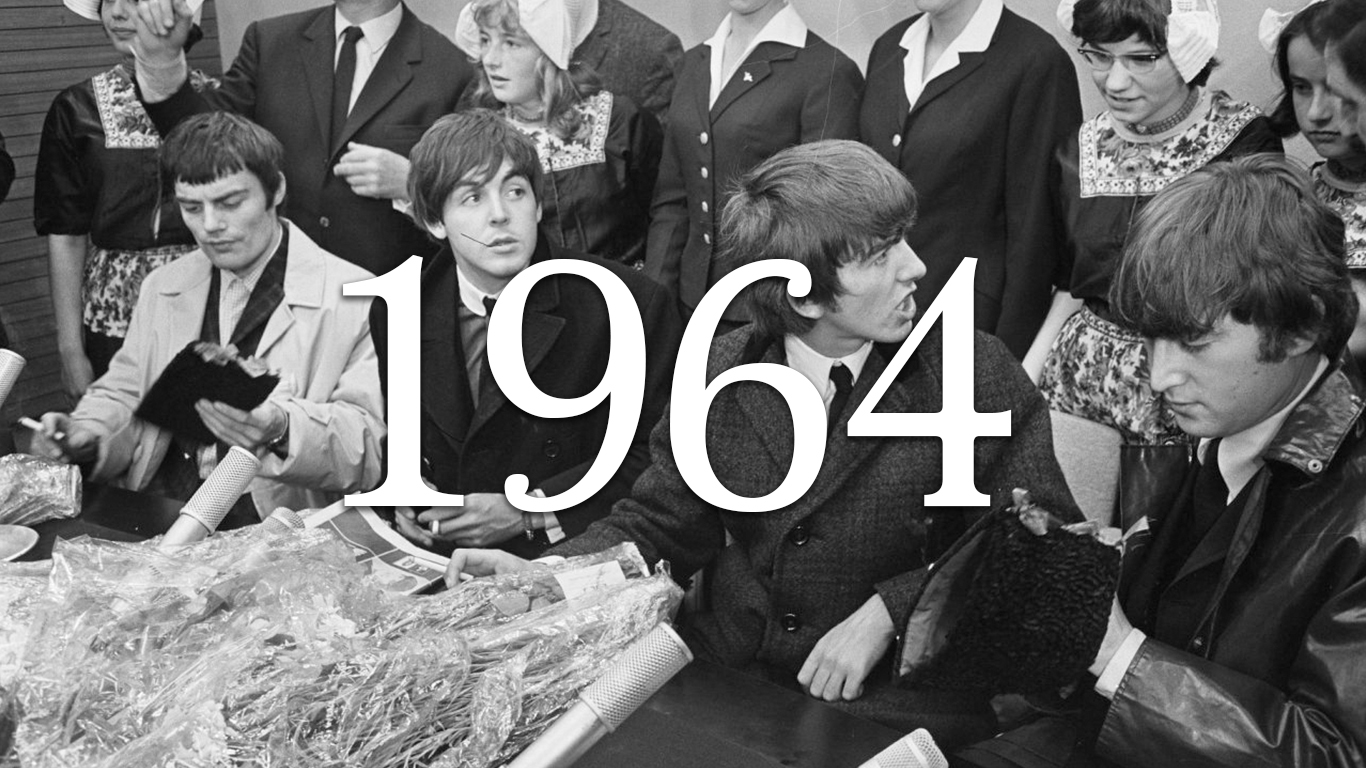
Source: Harry Pot, / Wikimedia Commons
1964
> Start: 6,133.3
> End: 6,998.4
> High: 7,139.1
> Change: +14.1%
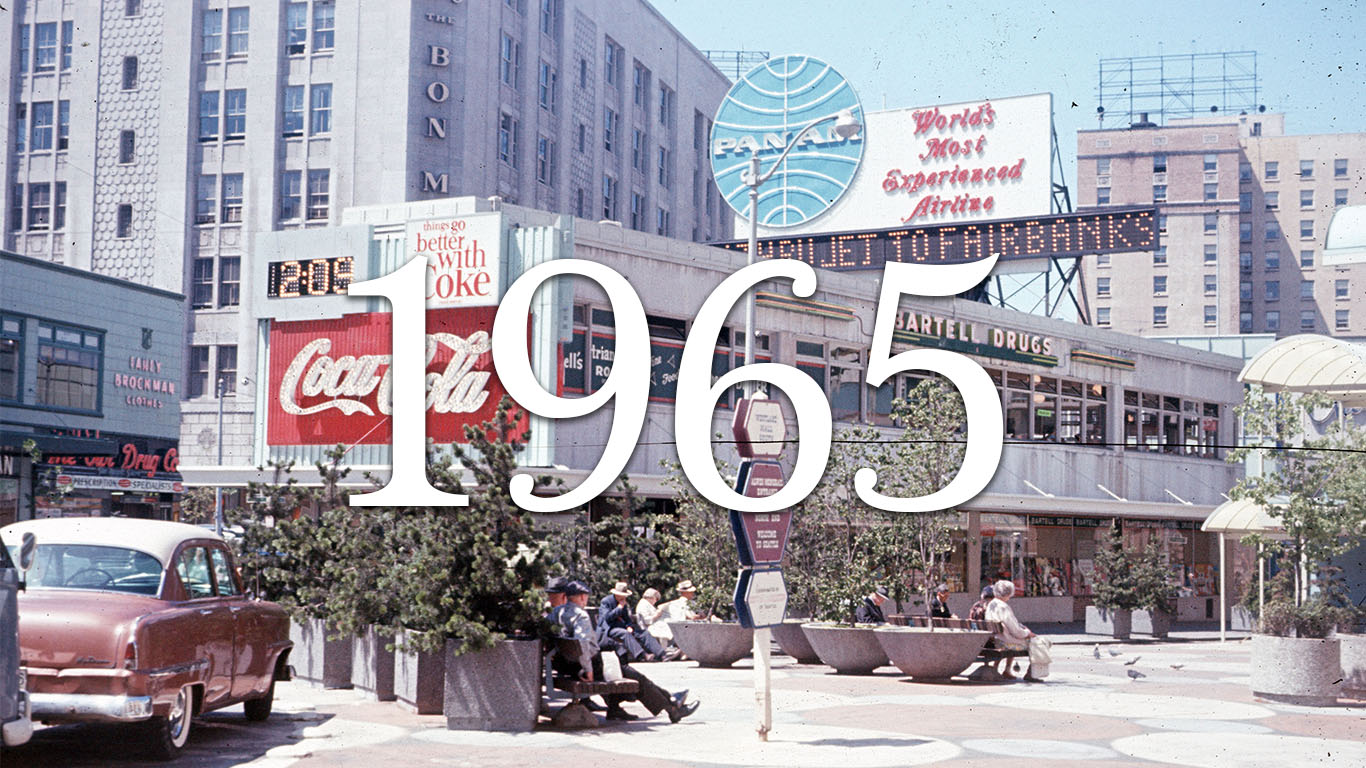
Source: Seattle Municipal Archives / Wikimedia Commons
1965
> Start: 6,846.6
> End: 7,629.7
> High: 7,629.7
> Change: +11.4%
[in-text-ad-2]
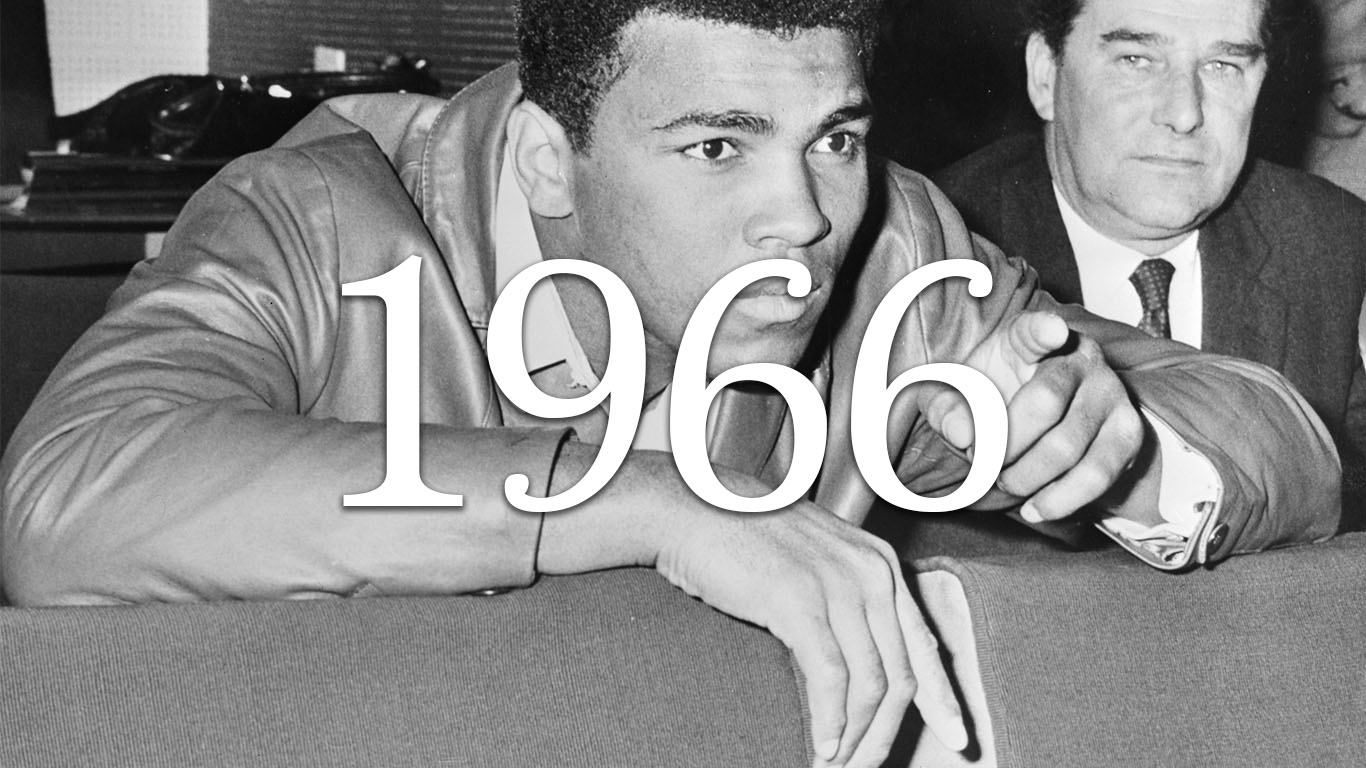
Source: Nationaal Archief / Wikimedia Commons
1966
> Start: 7,412.6
> End: 6,013.2
> High: 7,616.3
> Change: -18.9%
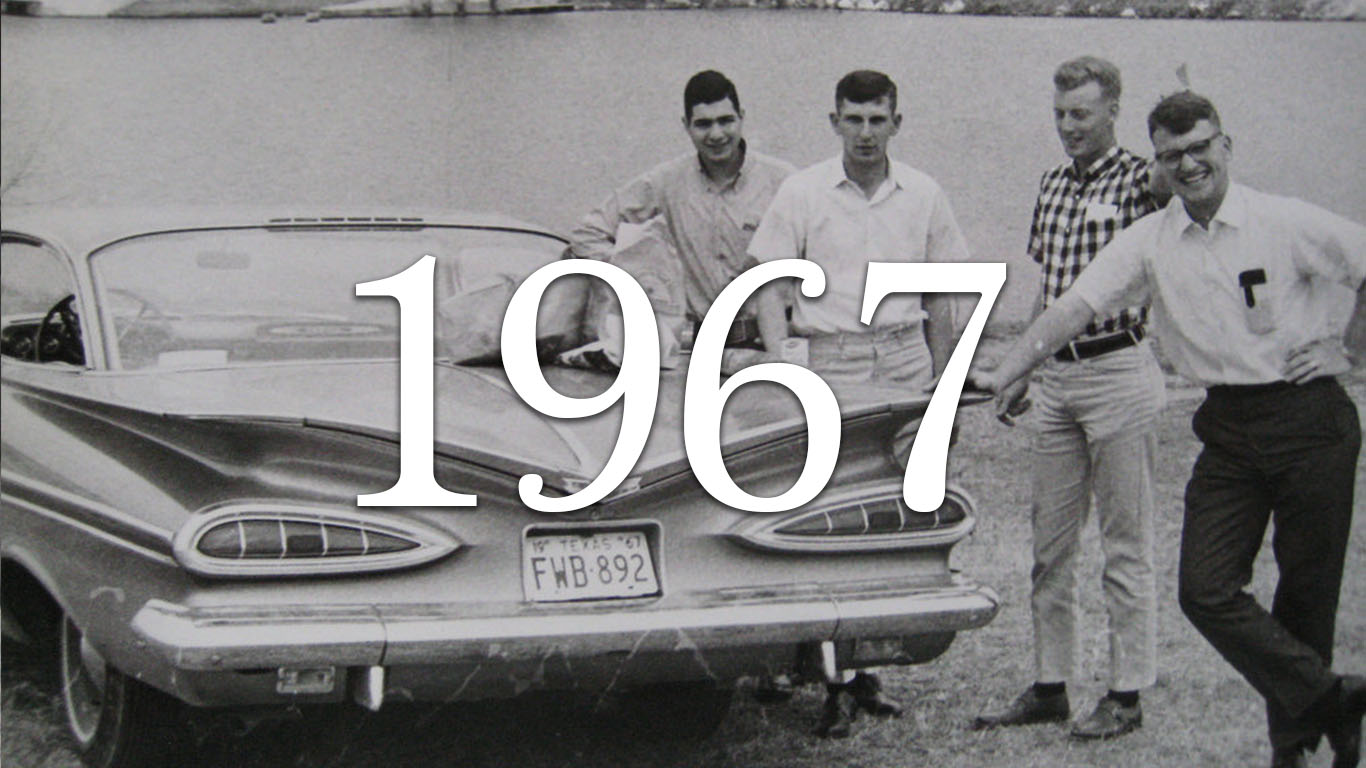
Source: JOHN LLOYD / Flickr
1967
> Start: 5,849.3
> End: 6,732.2
> High: 7,014.6
> Change: +15.1%
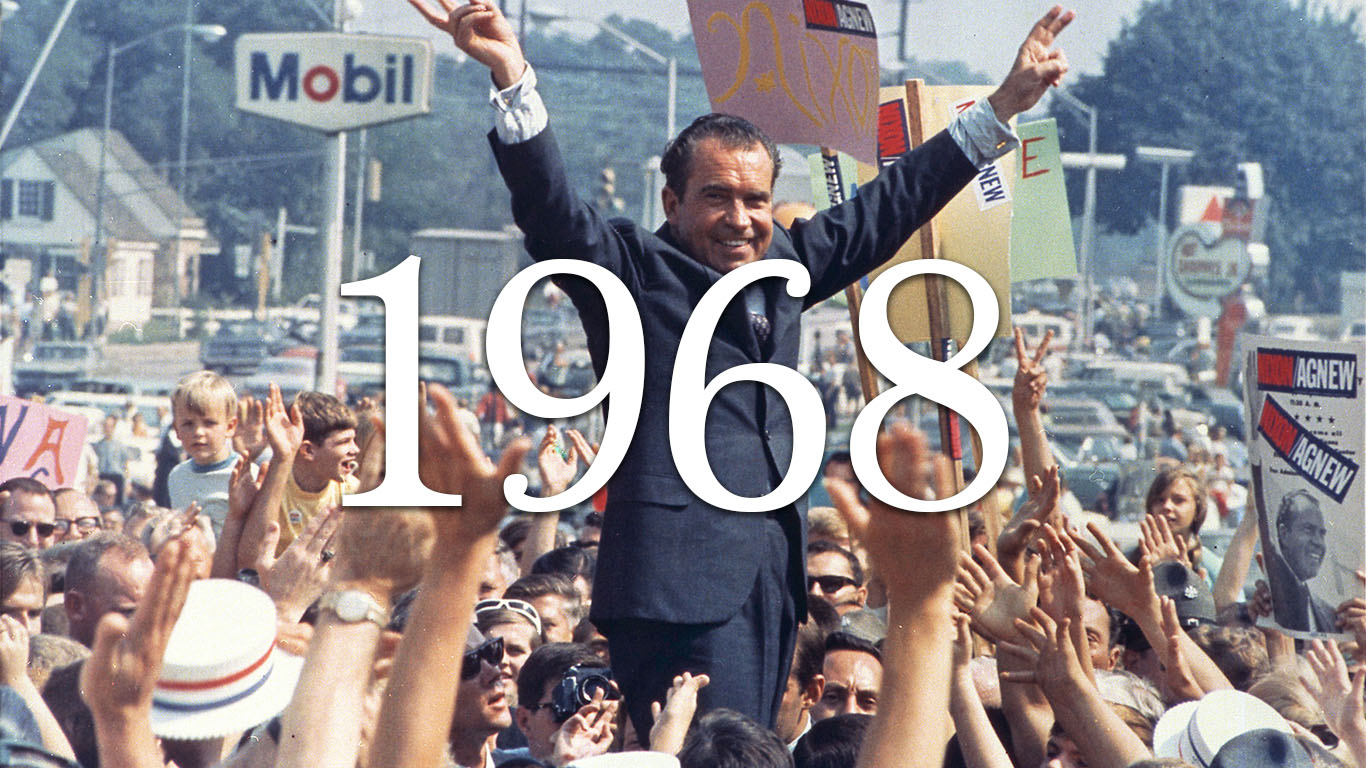
Source: Ollie Atkins, White House photographer / Library of Congress / Wikimedia Commons
1968
> Start: 6,473.7
> End: 6,737.2
> High: 7,033.2
> Change: +4.1%
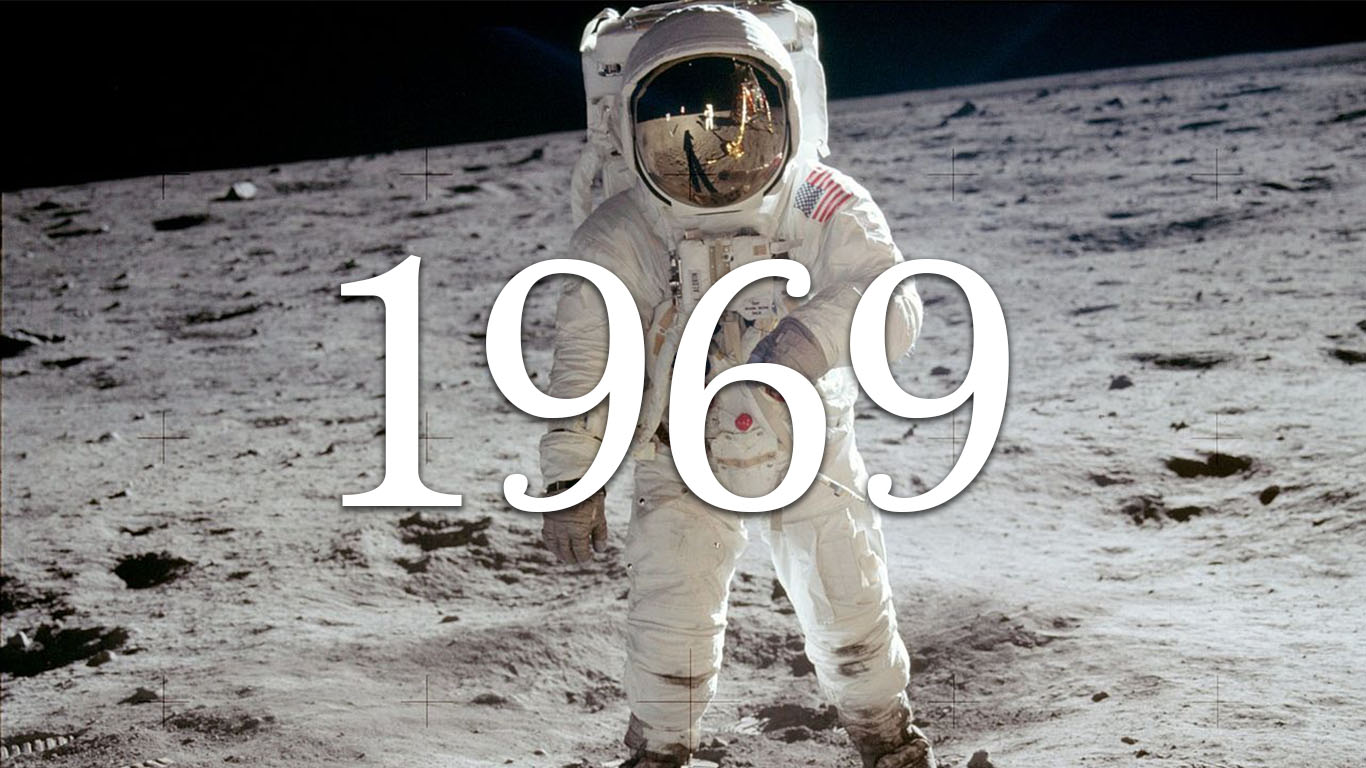
Source: NASA / Wikimedia Commons
1969
> Start: 6,420.6
> End: 5,422.2
> High: 6,563.7
> Change: -15.5%
[in-text-ad]
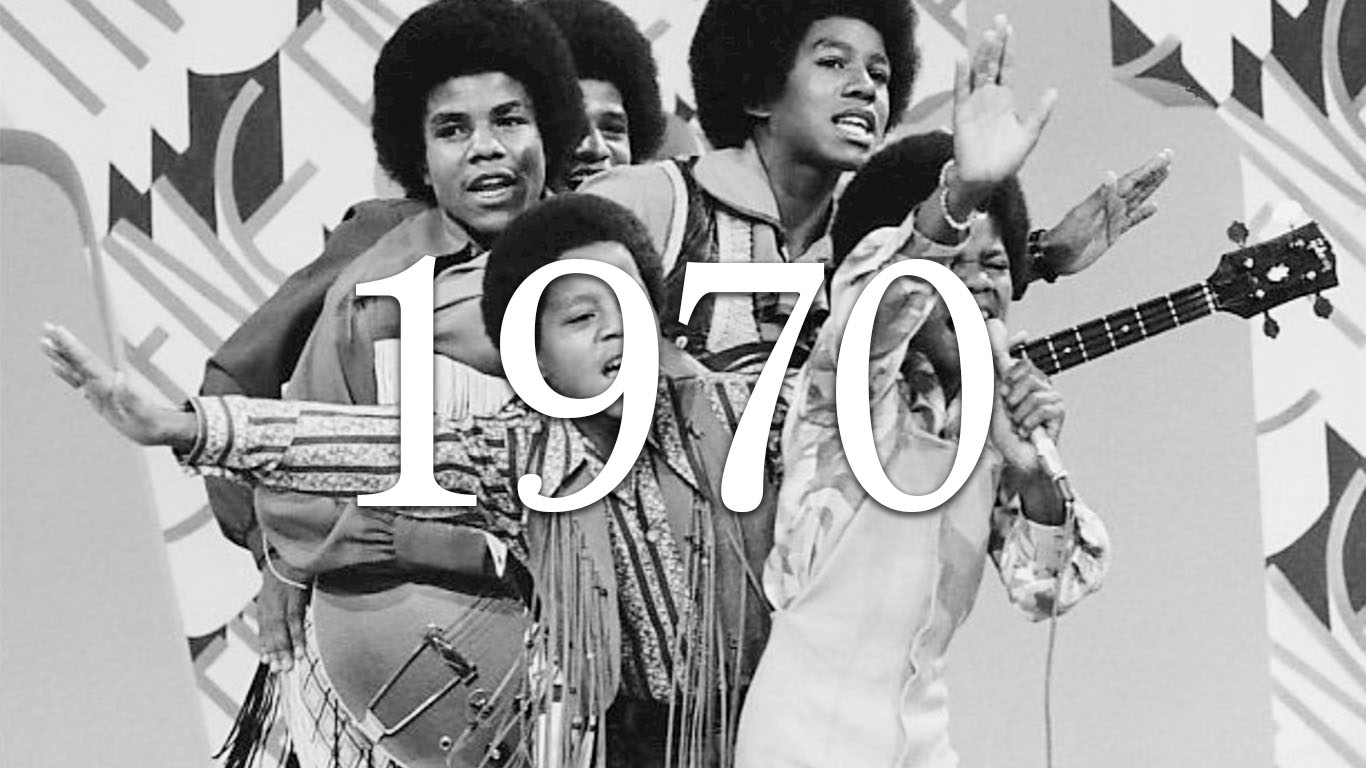
Source: CBS Television / Wikimedia Commons
1970
> Start: 5,175.8
> End: 5,365.9
> High: 5,385.6
> Change: +3.7%
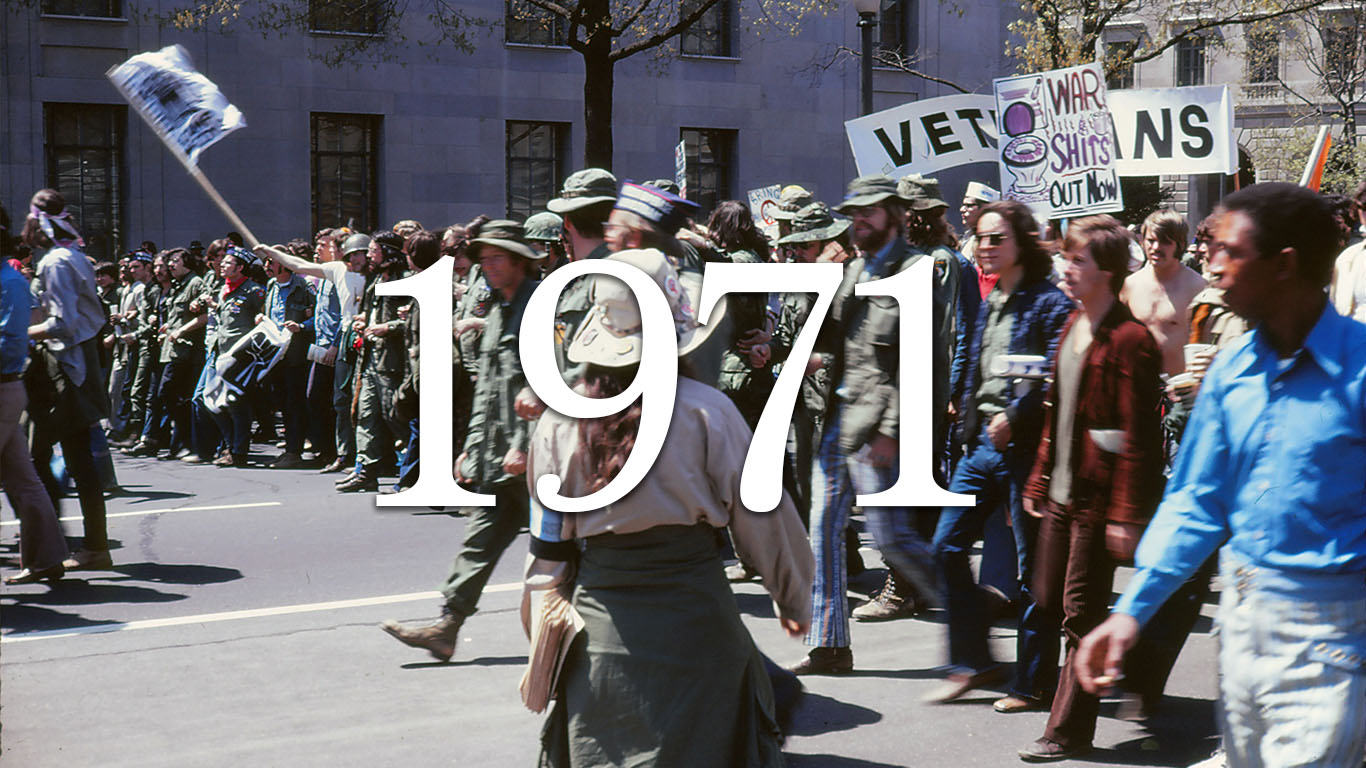
Source: Leena A. Krohn / Wikimedia Commons
1971
> Start: 5,093.5
> End: 5,459.2
> High: 5,830.9
> Change: +7.2%
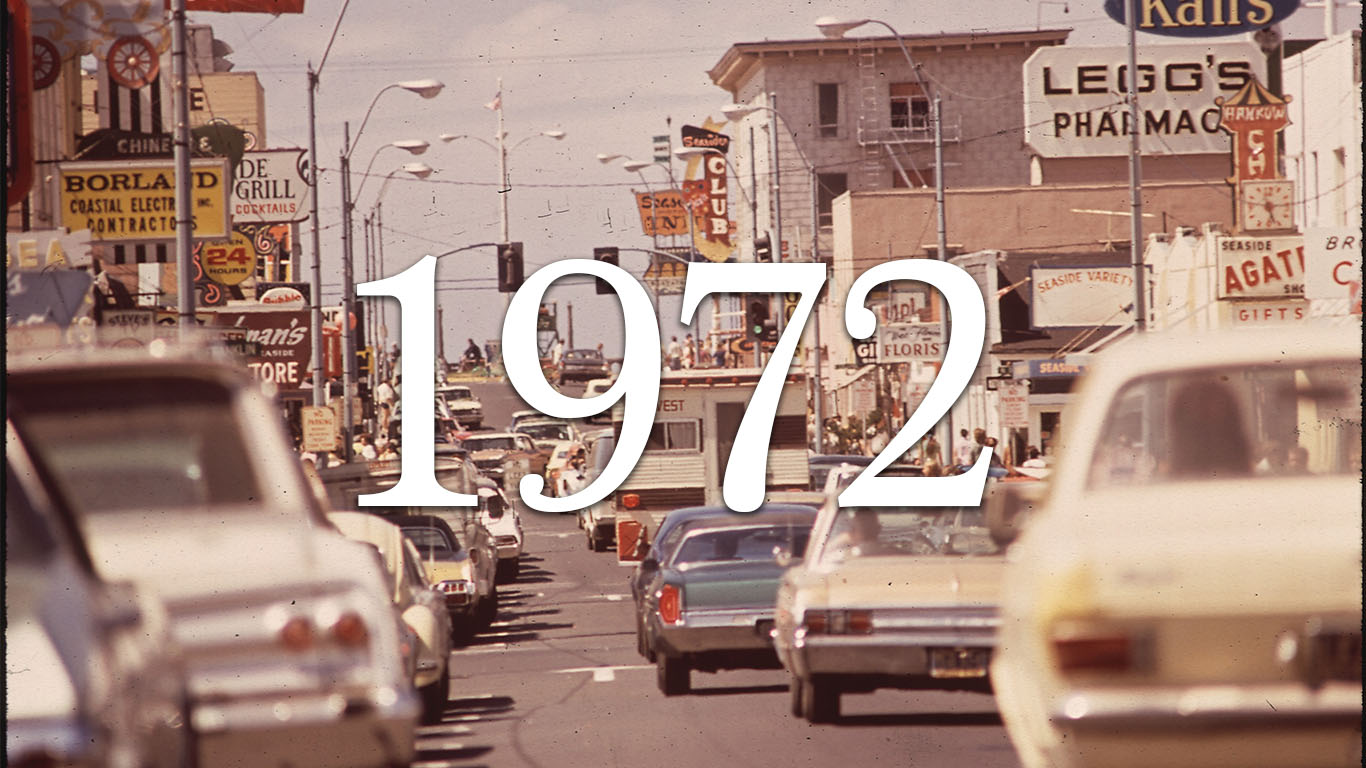
Source: U.S. National Archives and Records Administration / Wikimedia Commons
1972
> Start: 5,279.0
> End: 6,055.0
> High: 6,151.5
> Change: +14.7%
 24/7 Wall St.
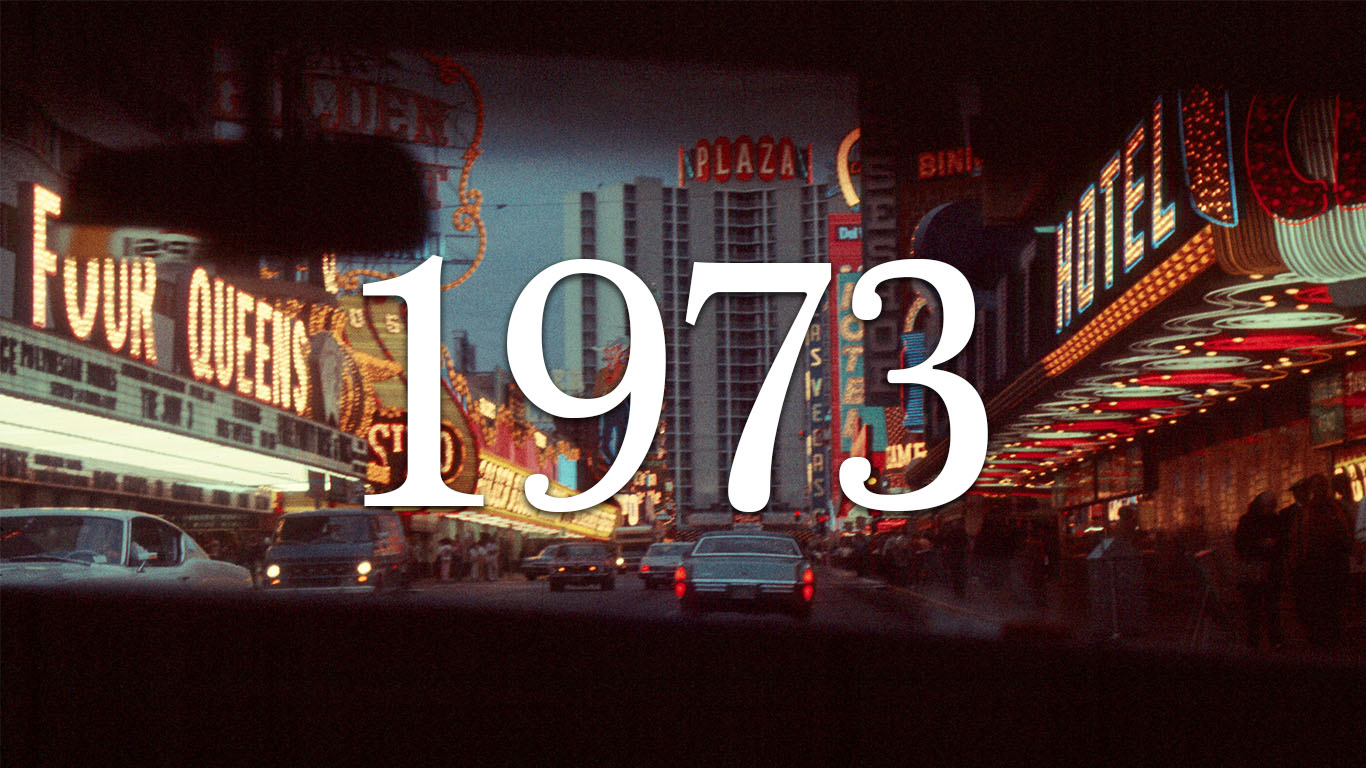
Source: sterferg / Wikimedia Commons
1973
> Start: 5,766.0
> End: 4,755.4
> High: 5,877.9
> Change: -17.5%
Source: ABC Television / Wikimedia Commons
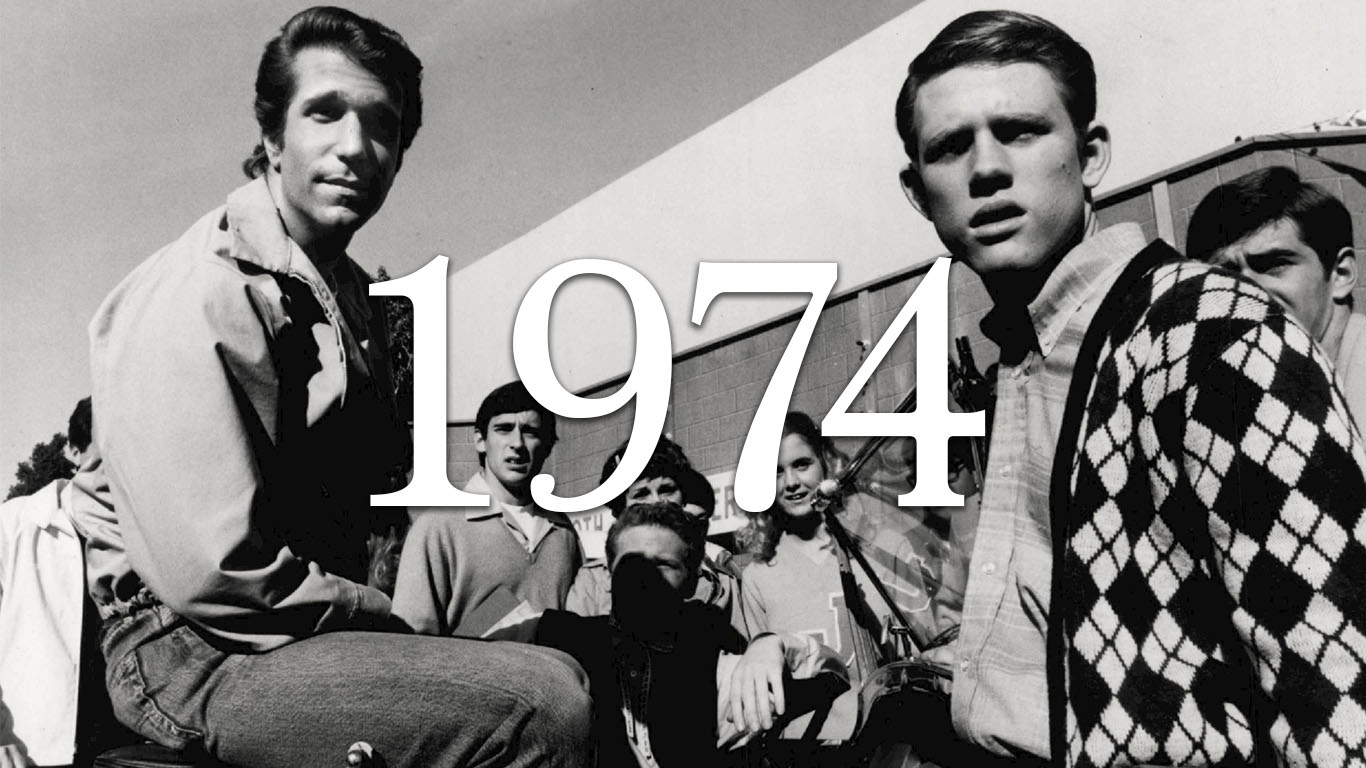
1974
> Start: 4,307.4
> End: 3,103.4
> High: 4,490.5
> Change: -28.0%
Source: O'Halloran, Thomas J. / Library of Congress / Wikimedia Commons
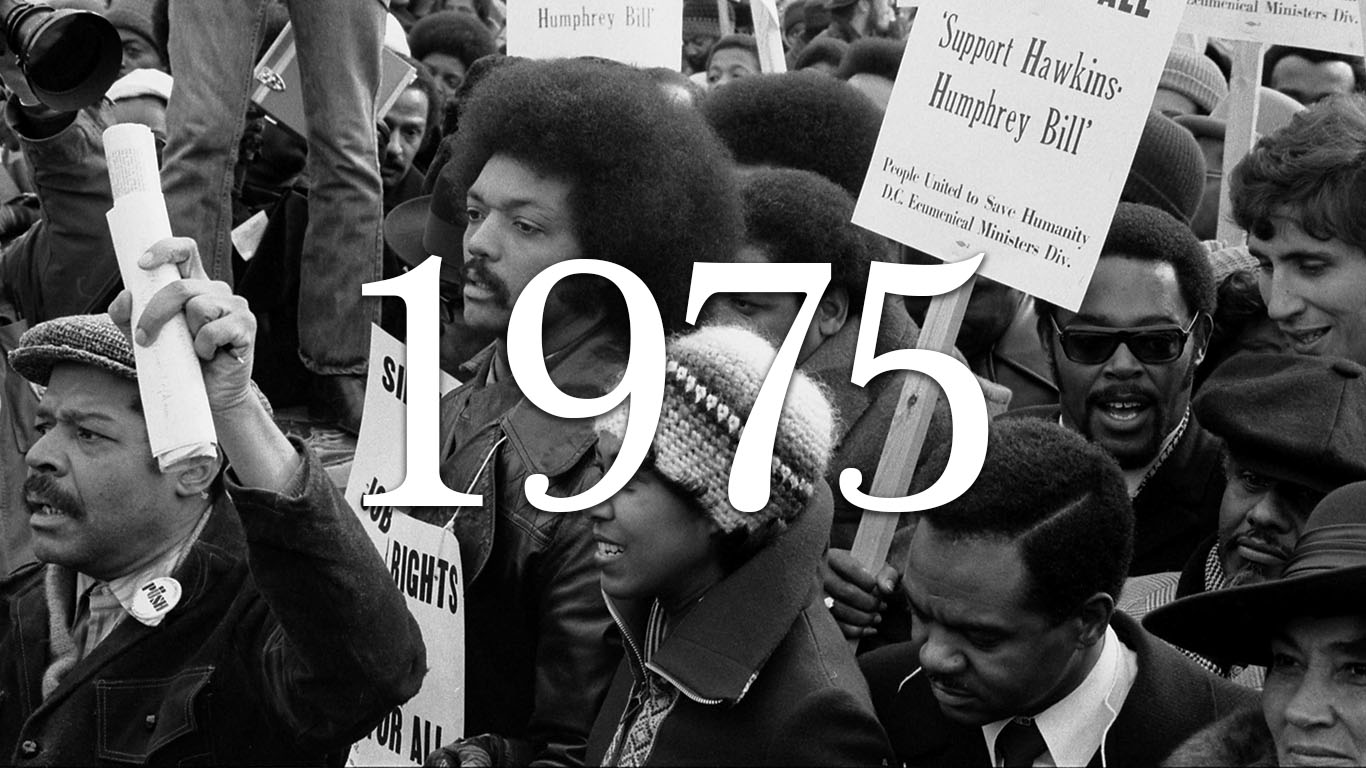
1975
> Start: 2,916.4
> End: 3,933.2
> High: 4,068.9
> Change: +34.9%
[in-text-ad-2]
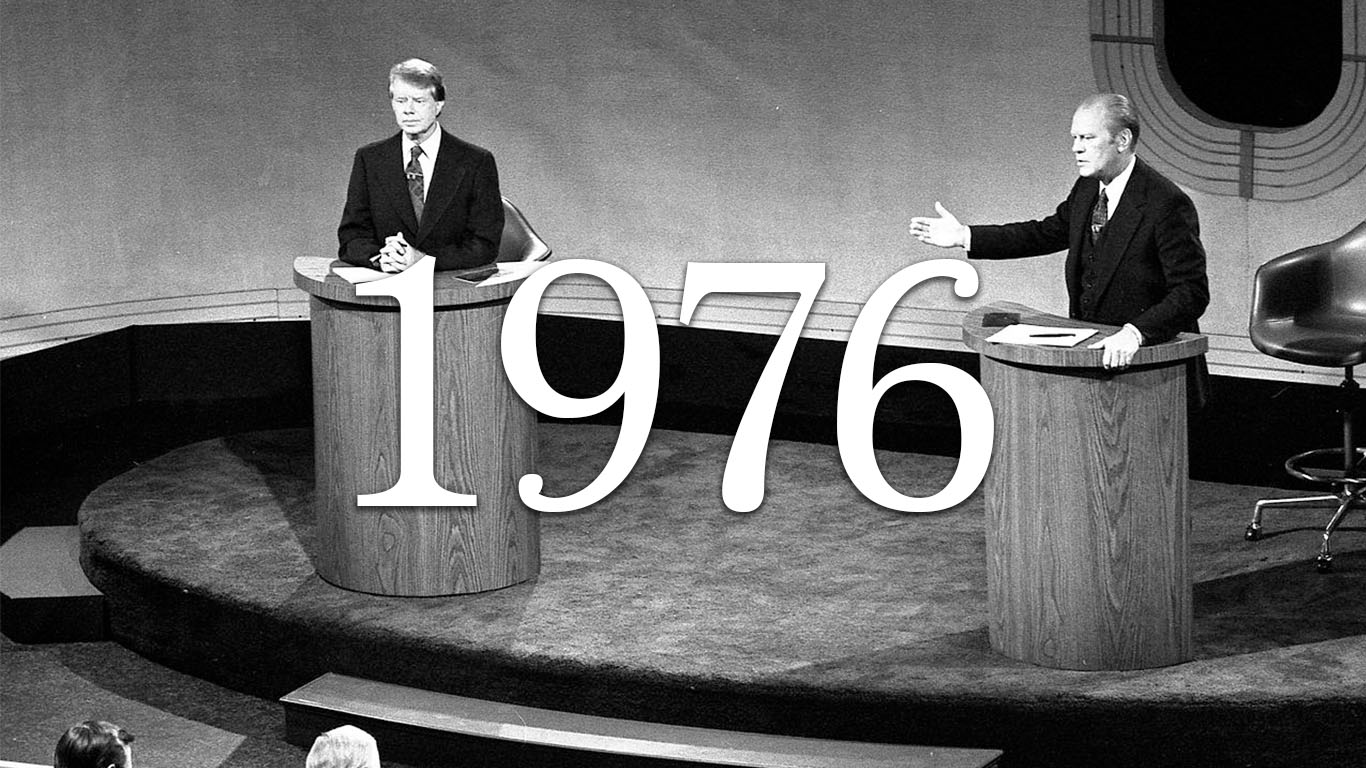
Source: White House Photograph Courtesy Gerald R. Ford Library / Wikimedia Commons
1976
> Start: 3,746.5
> End: 4,383.3
> High: 4,427.5
> Change: +17.0%
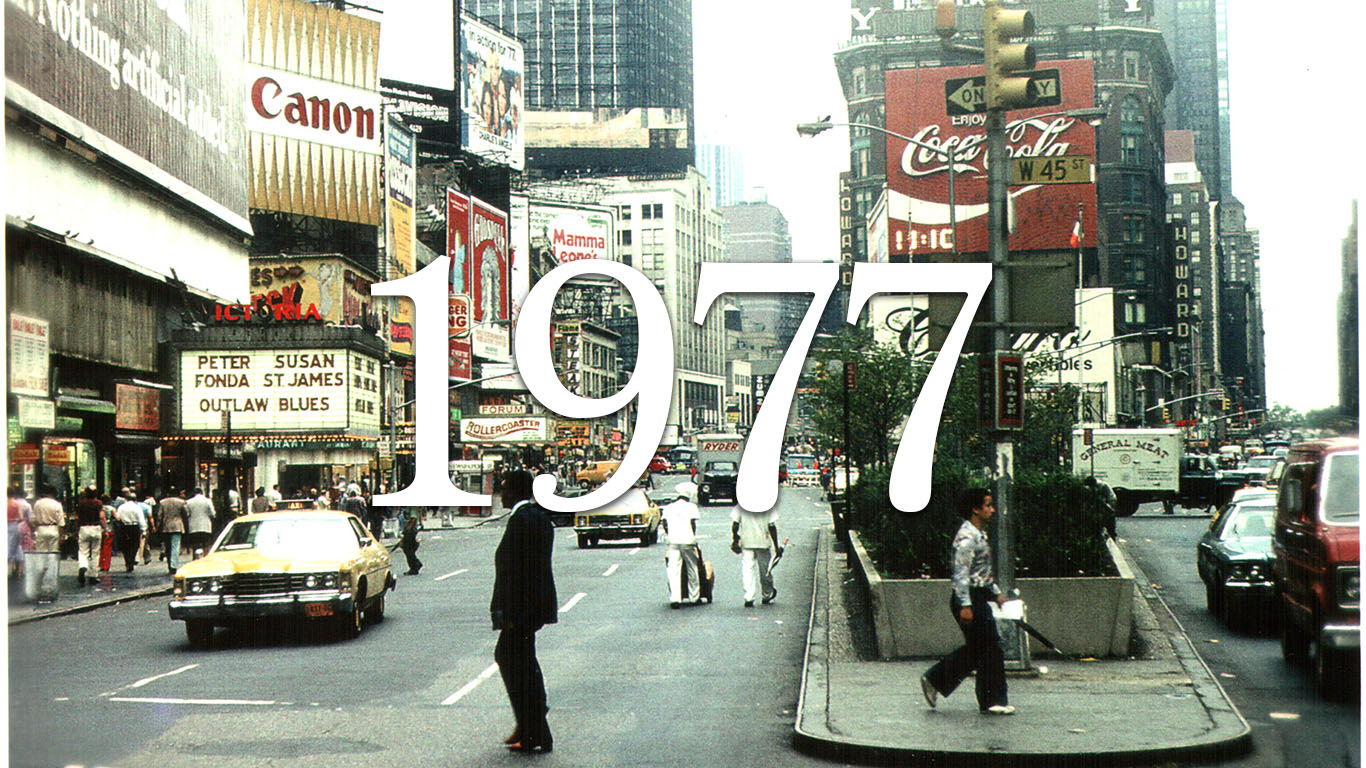
Source: Derzsi Elekes Andor / Wikimedia Commons
1977
> Start: 4,097.8
> End: 3,406.8
> High: 4,097.8
> Change: -16.9%
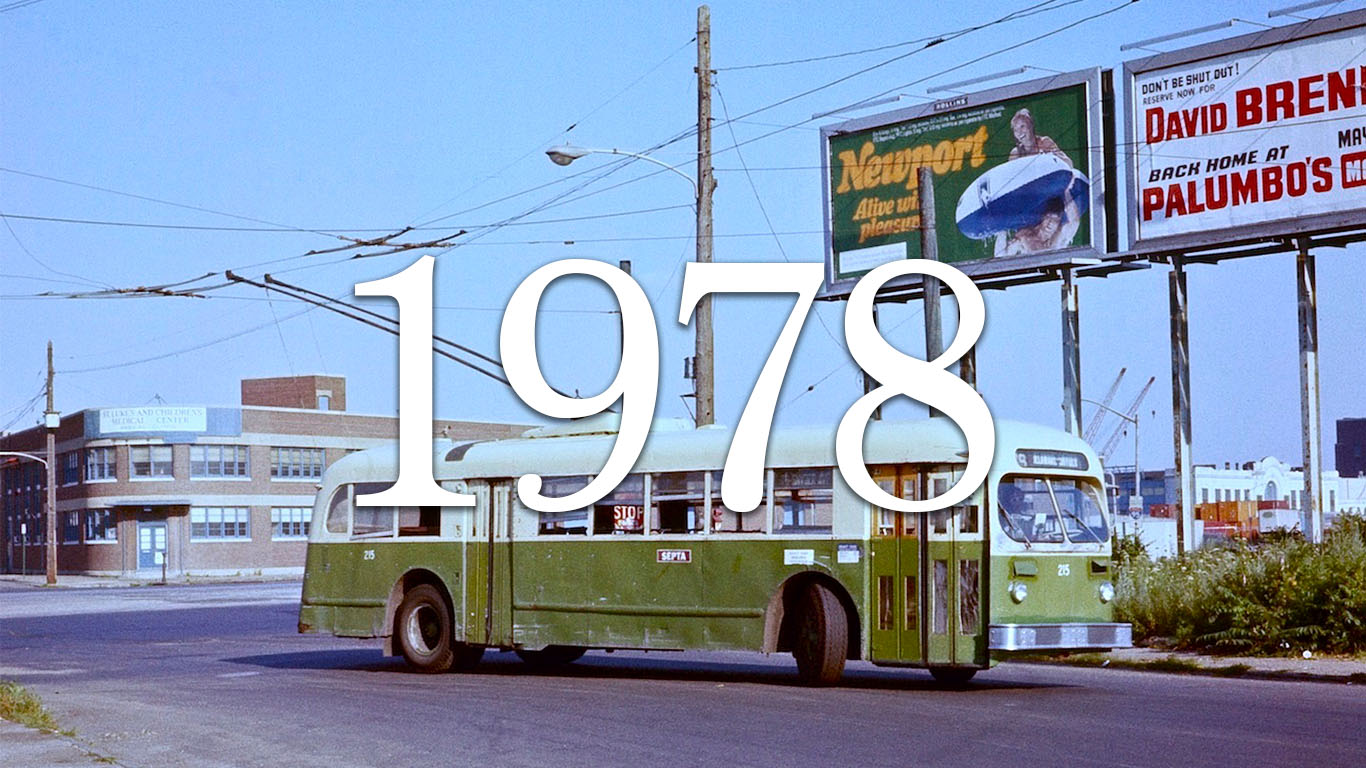
Source: Steve Morgan / Wikimedia Commons
1978
> Start: 3,114.8
> End: 3,066.4
> High: 3,457.7
> Change: -1.6%
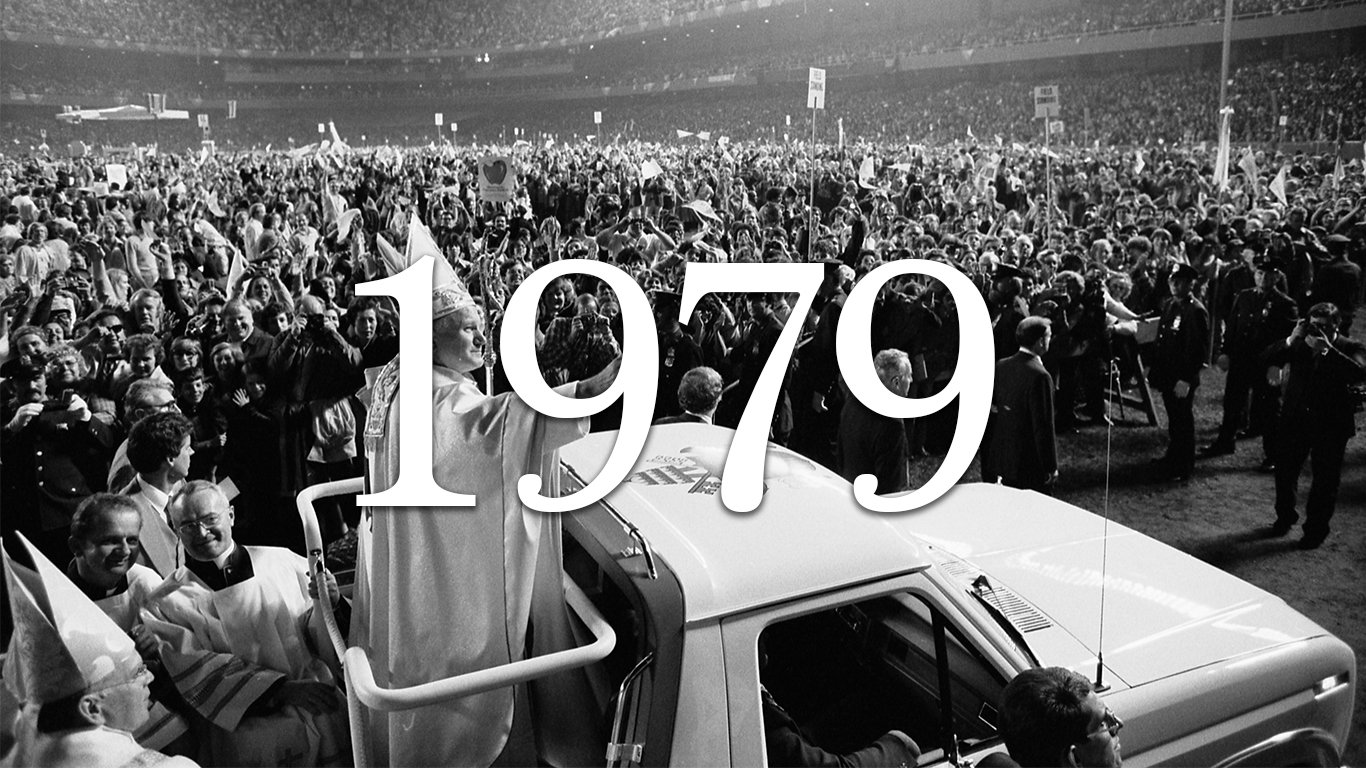
Source: Thomas J. O'Halloran, U.S. News & World Report / Library of Congress / Wikimedia Commons
1979
> Start: 2,777.7
> End: 2,871.3
> High: 3,072.8
> Change: +3.4%
[in-text-ad]
Source: Bogaerts, Rob / Anefo / Wikimedia Commons
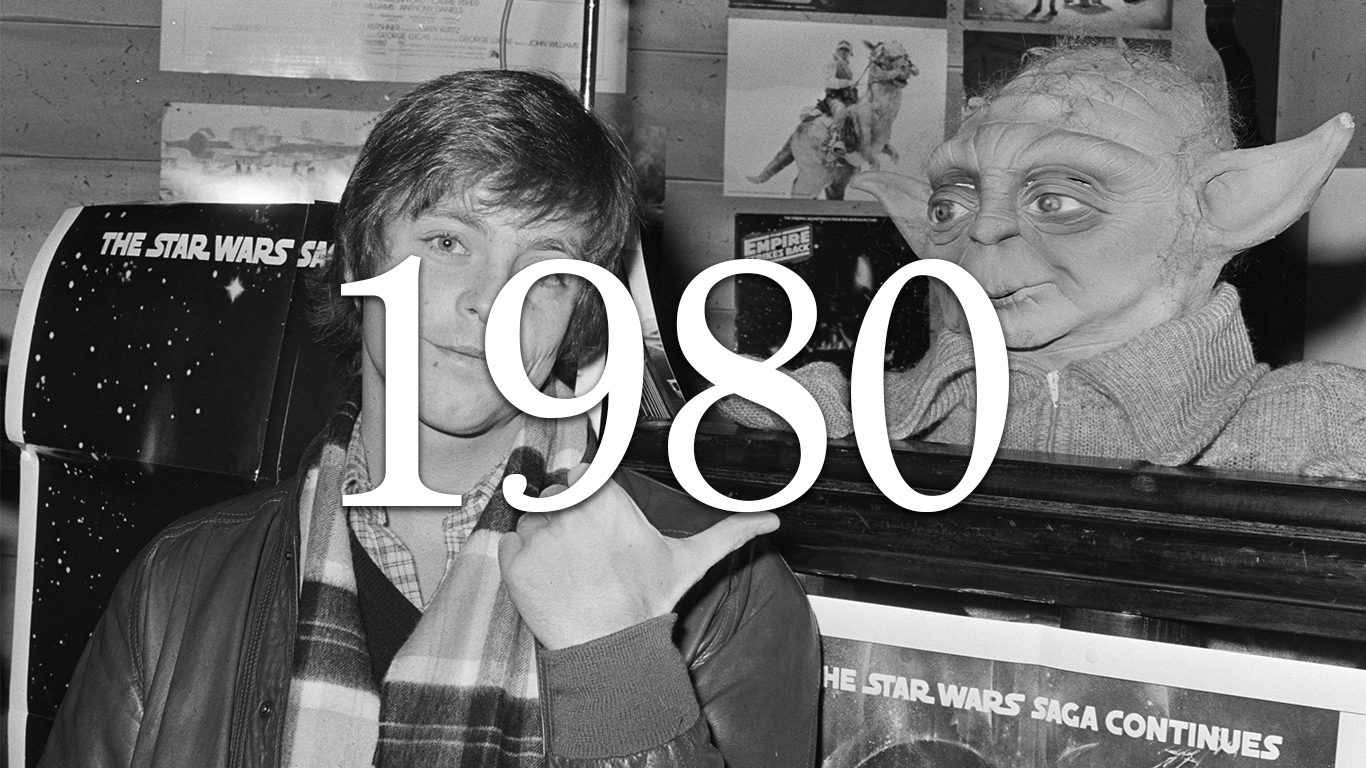
1980
> Start: 2,486.6
> End: 2,907.1
> High: 3,016.2
> Change: +16.9%
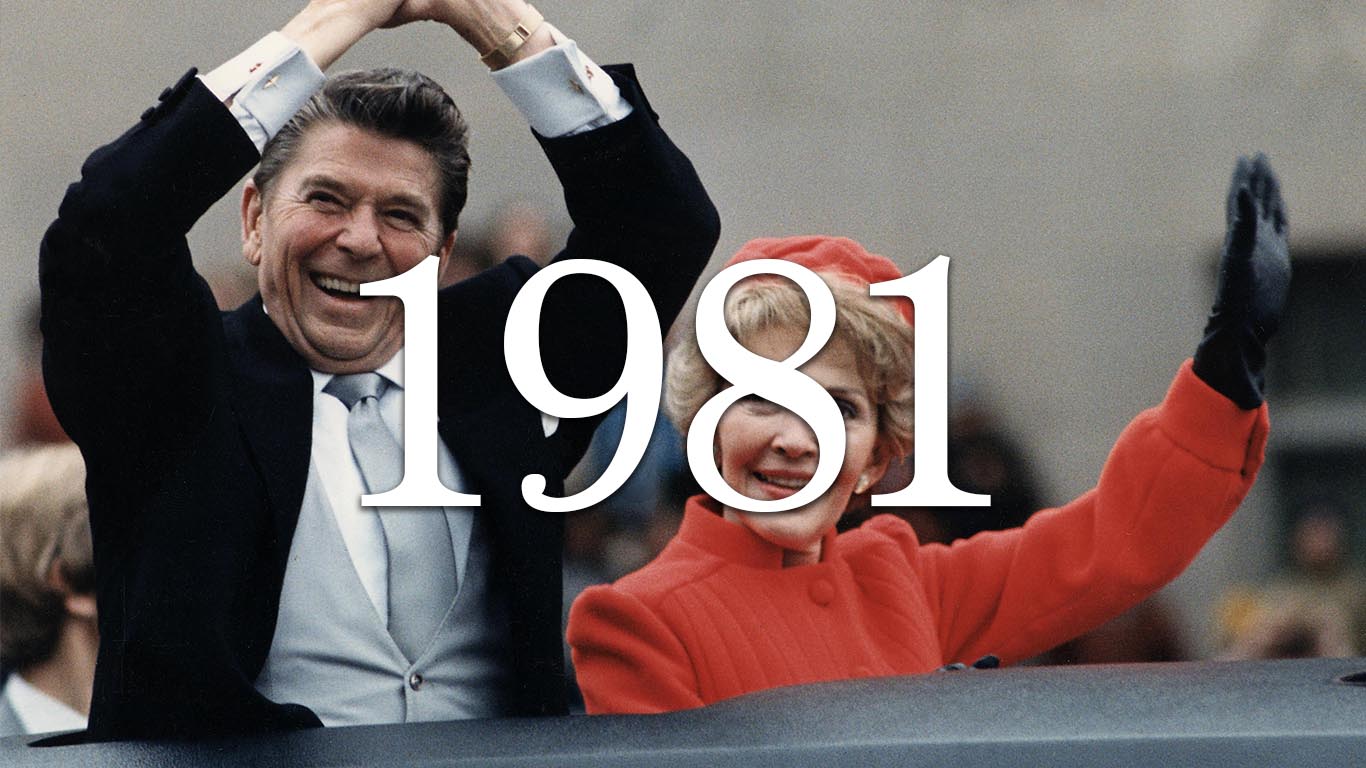
Source: White House Photographic Office / The National Archives and Records Administration / Wikimedia Commons
1981
> Start: 2,657.7
> End: 2,390.6
> High: 2,797.8
> Change: -10.1%
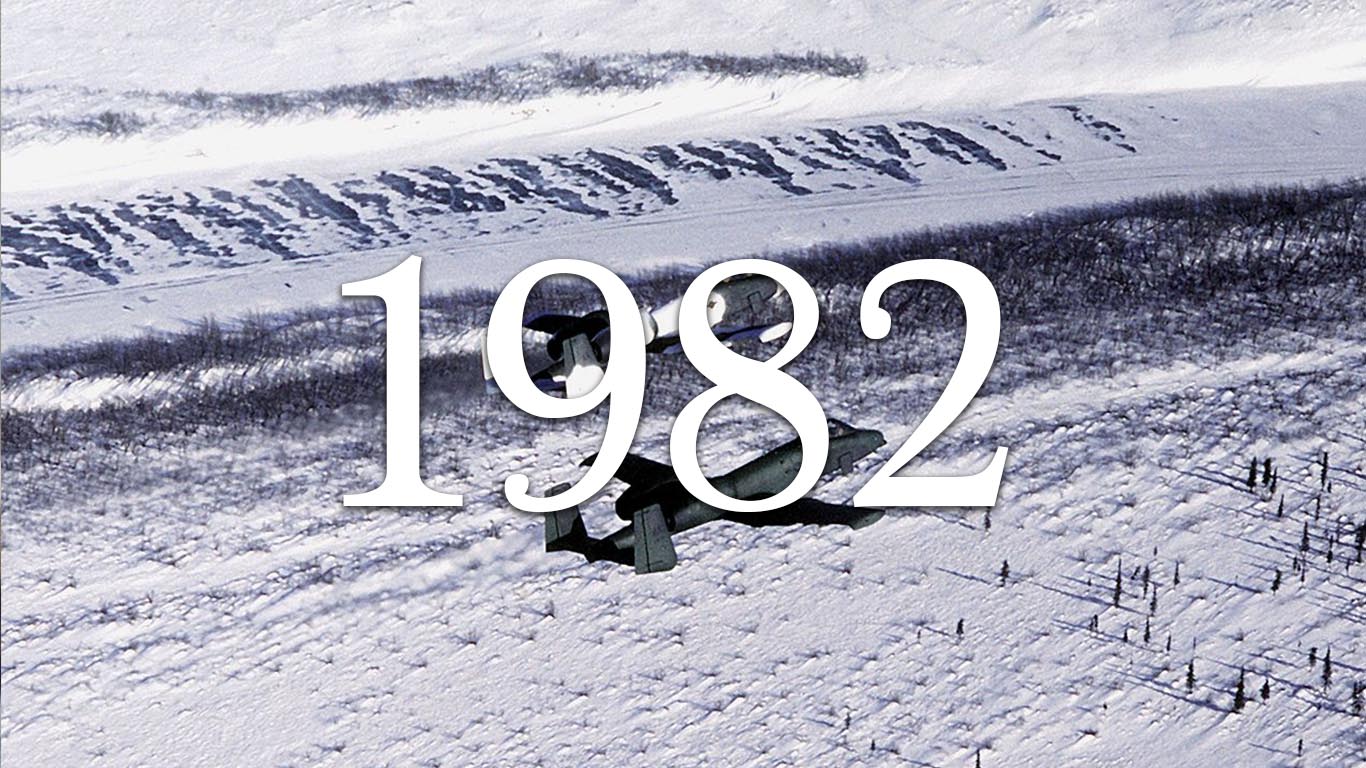
Source: Wikimedia Commons
1982
> Start: 2,272.0
> End: 2,694.2
> High: 2,756.0
> Change: +18.6%
 24/7 Wall St.
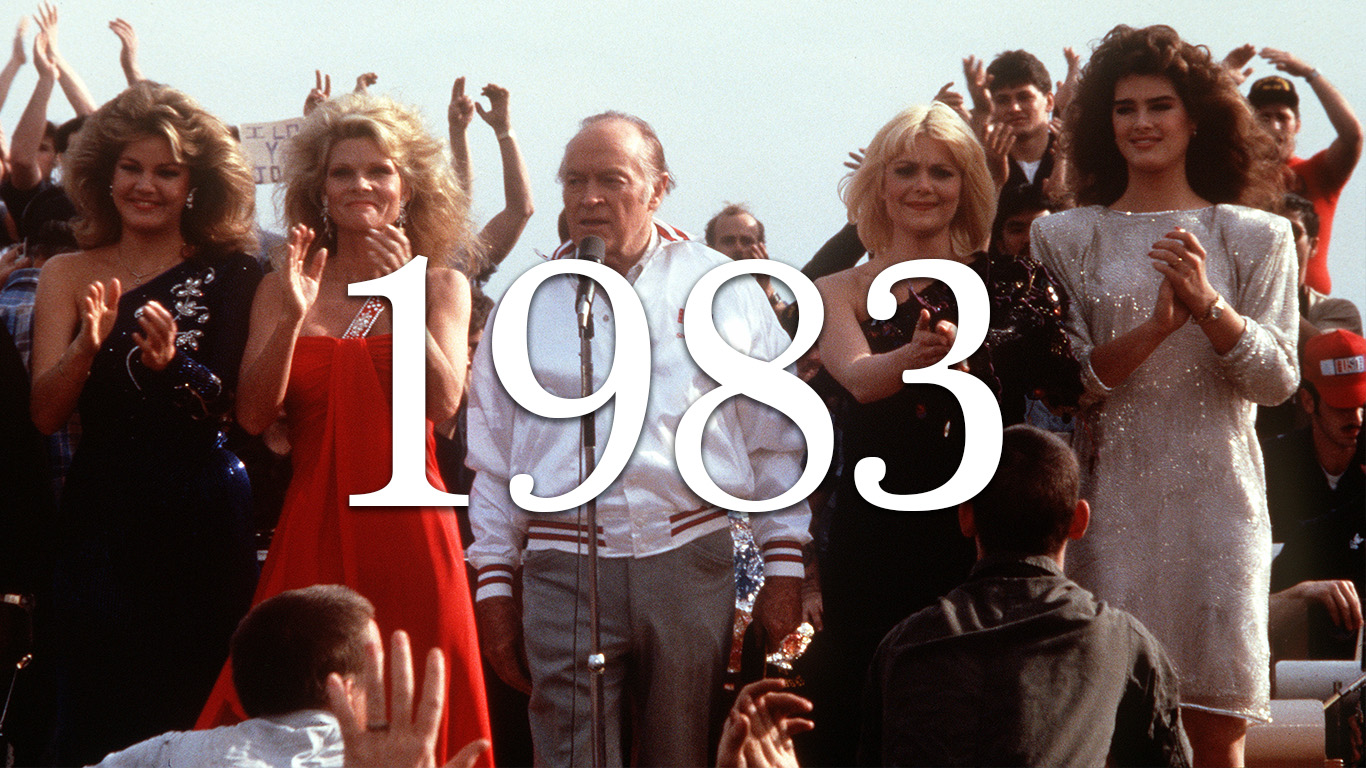
Source: Wikimedia Commons
1983
> Start: 2,561.7
> End: 3,139.4
> High: 3,210.6
> Change: +22.6%
Source: Marcin Wichary / Wikimedia Commons
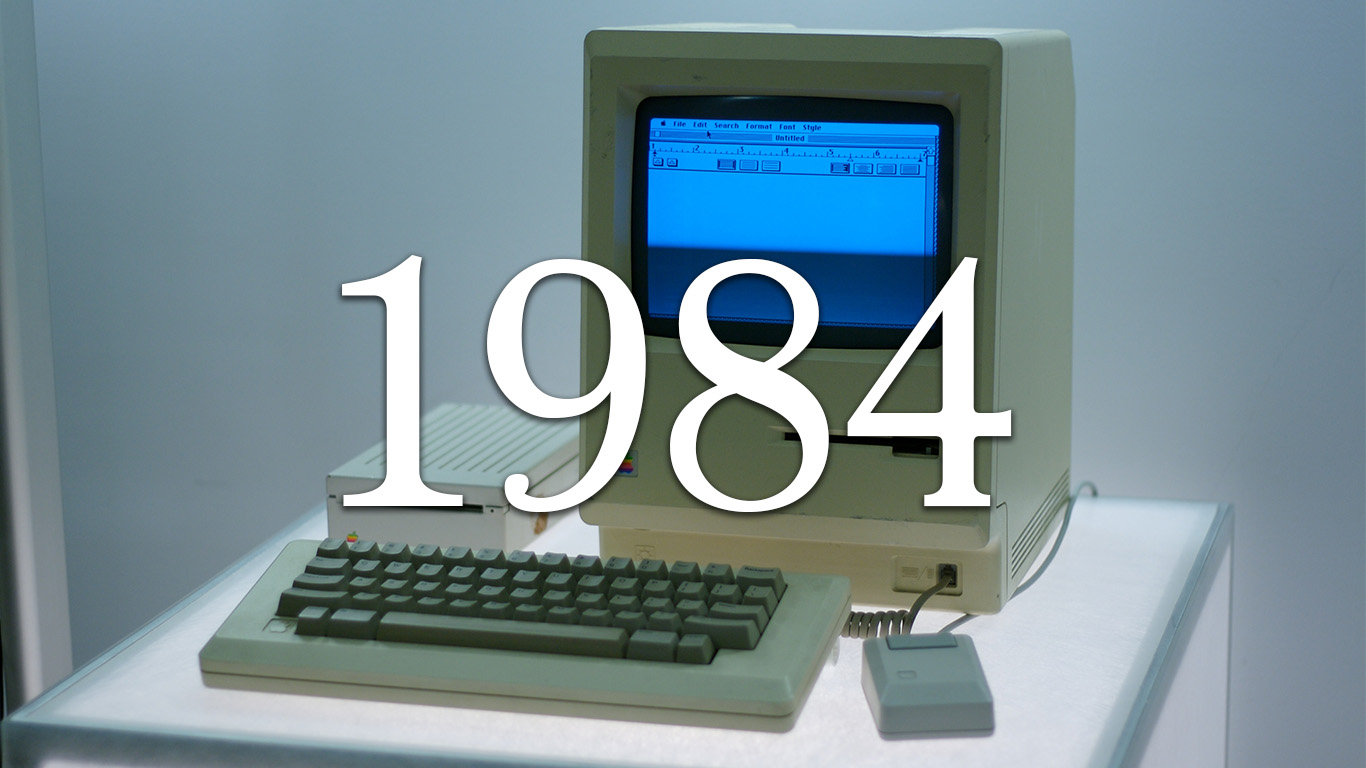
1984
> Start: 2,995.4
> End: 2,896.9
> High: 3,076.4
> Change: -3.3%
Source: Wikimedia Commons
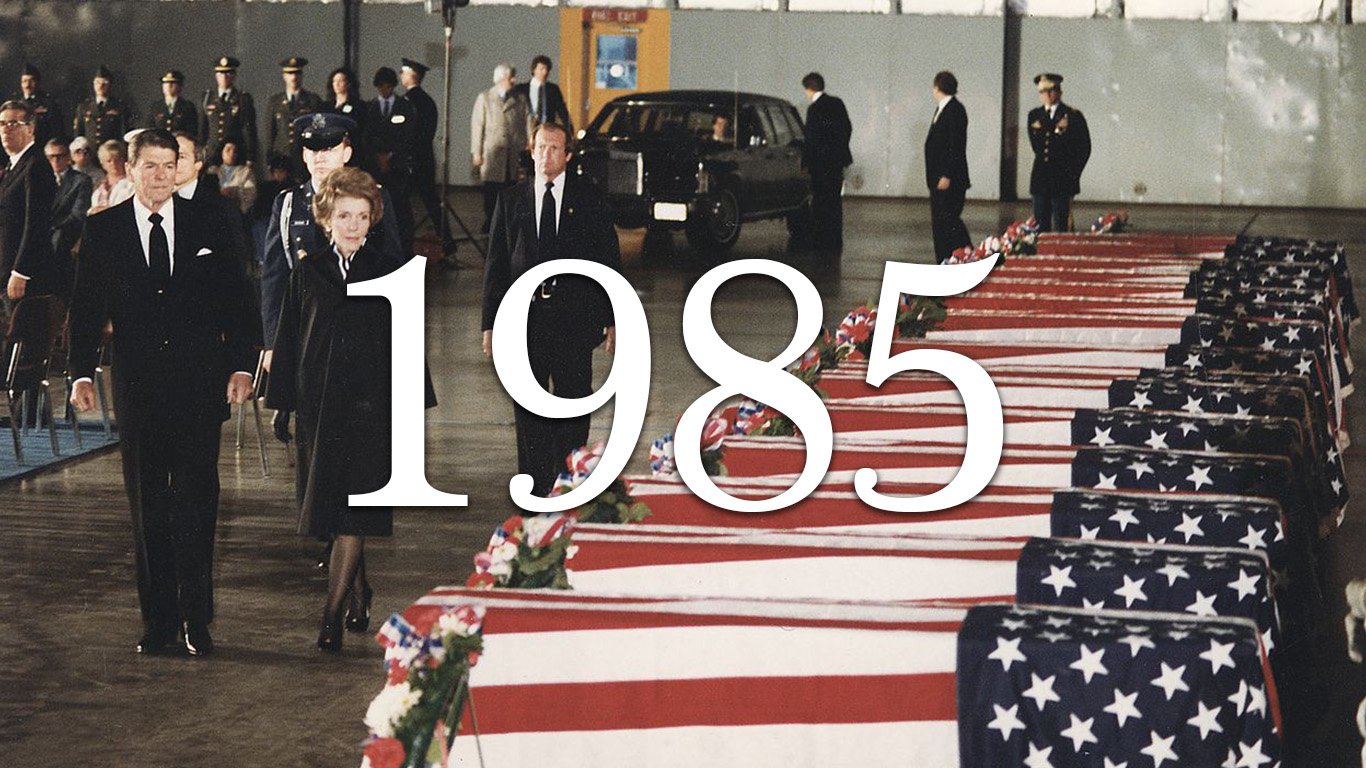
1985
> Start: 2,768.0
> End: 3,571.0
> High: 3,585.8
> Change: +29.0%
[in-text-ad-2]
Source: A1C Nancy Smelser / Wikimedia Commons
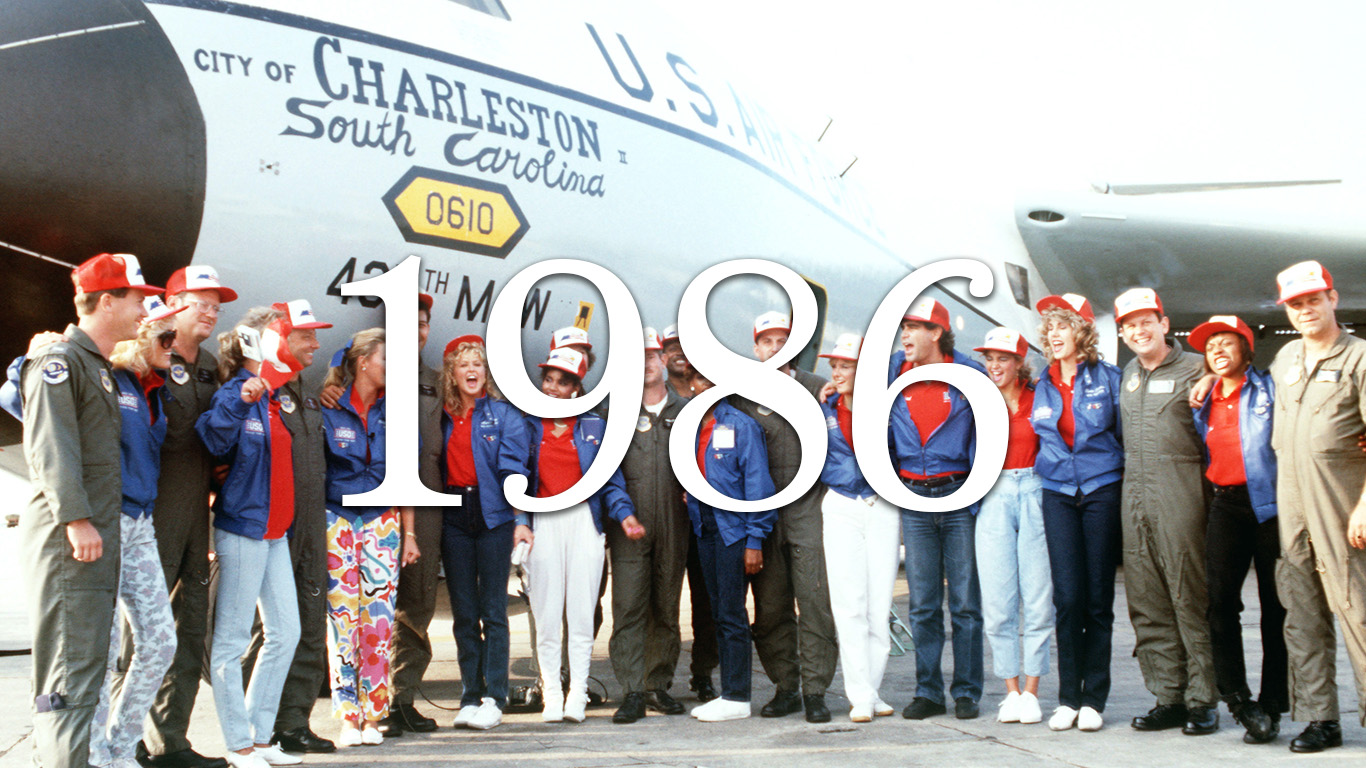
1986
> Start: 3,485.6
> End: 4,297.5
> High: 4,432.7
> Change: +23.3%

Source: Virginia Tehan / Wikimedia Commons
1987
> Start: 4,214.8
> End: 4,240.0
> High: 5,953.6
> Change: +0.6%
Source: National Park Service / Wikimedia Commons
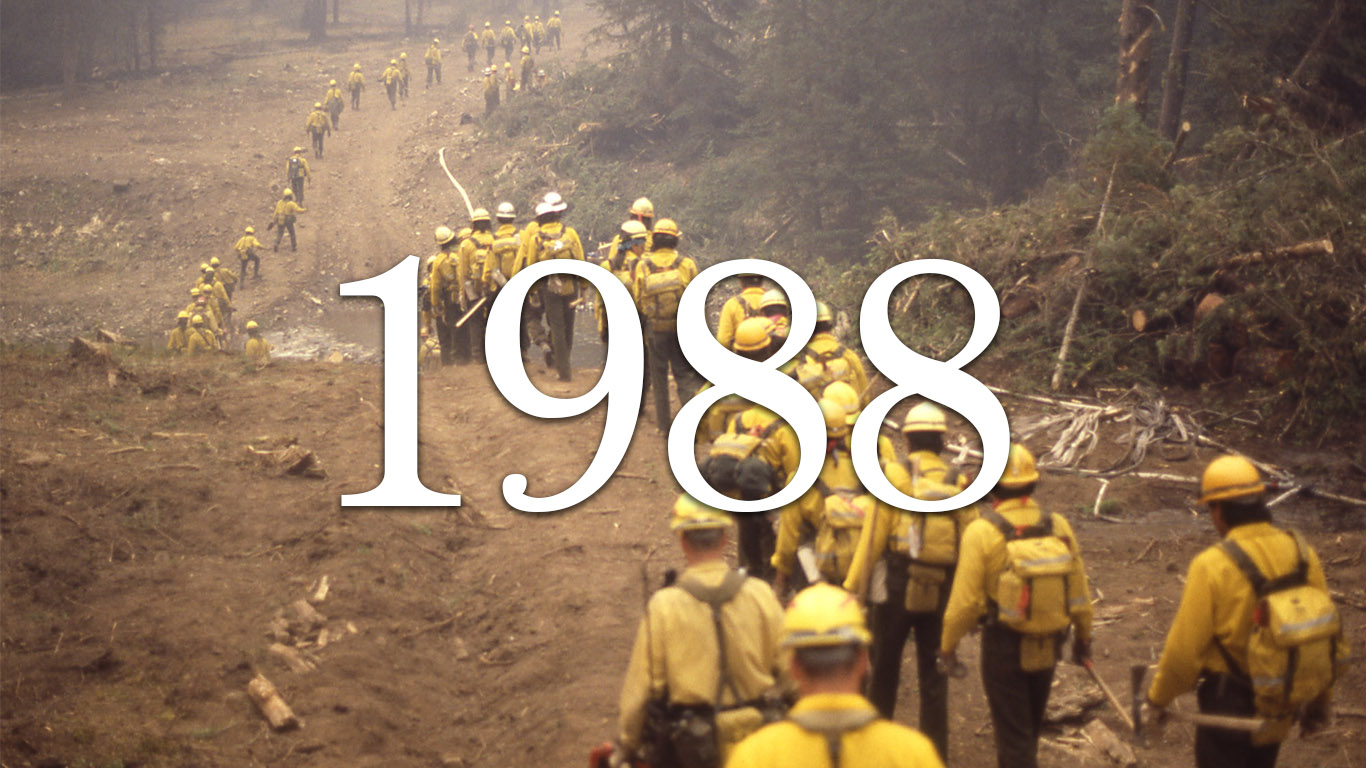
1988
> Start: 4,232.0
> End: 4,554.0
> High: 4,585.3
> Change: +7.6%
Source: Library of Congress / Wikimedia Commons
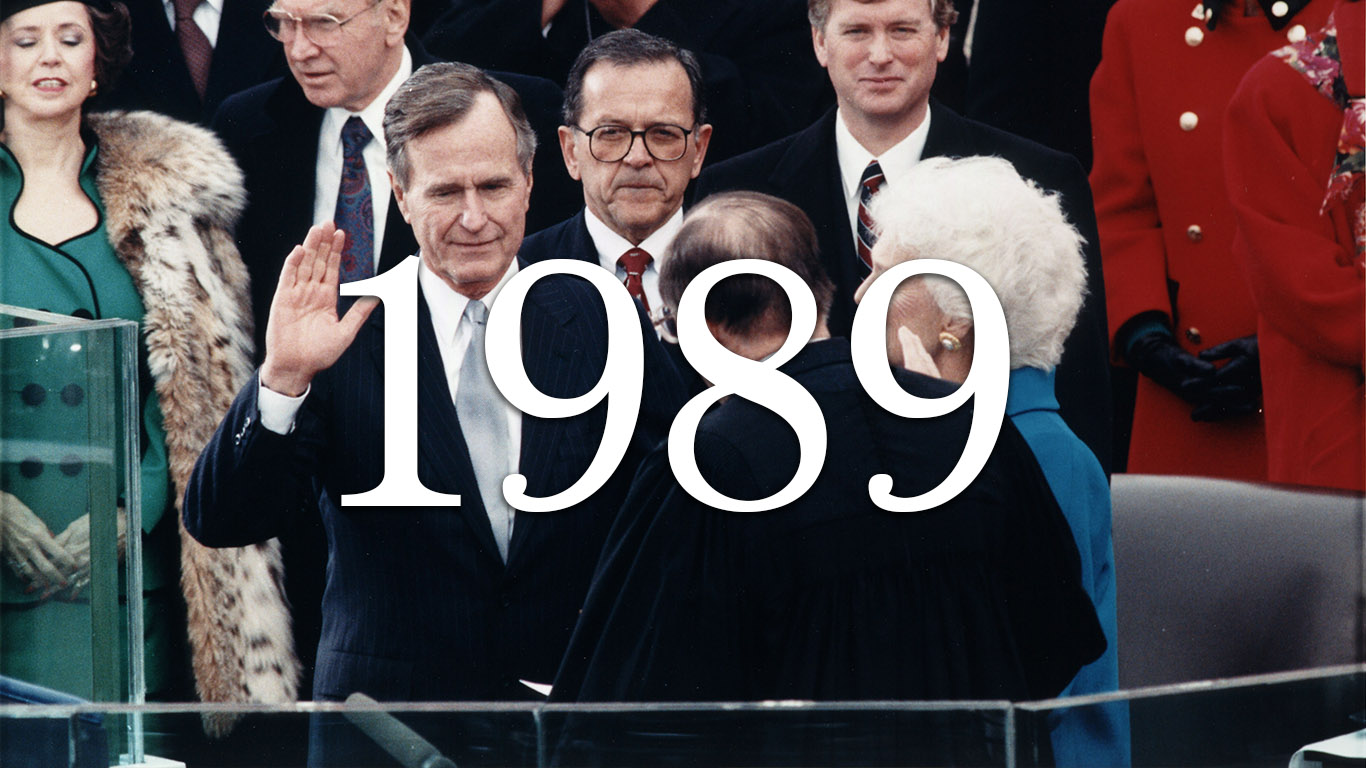
1989
> Start: 4,296.7
> End: 5,515.9
> High: 5,592.5
> Change: +28.4%
[in-text-ad]

Source: Andrew Thomas / Wikimedia Commons
1990
> Start: 5,341.4
> End: 5,005.9
> High: 5,701.8
> Change: -6.3%
Source: U.S. Air Force / Wikimedia Commons
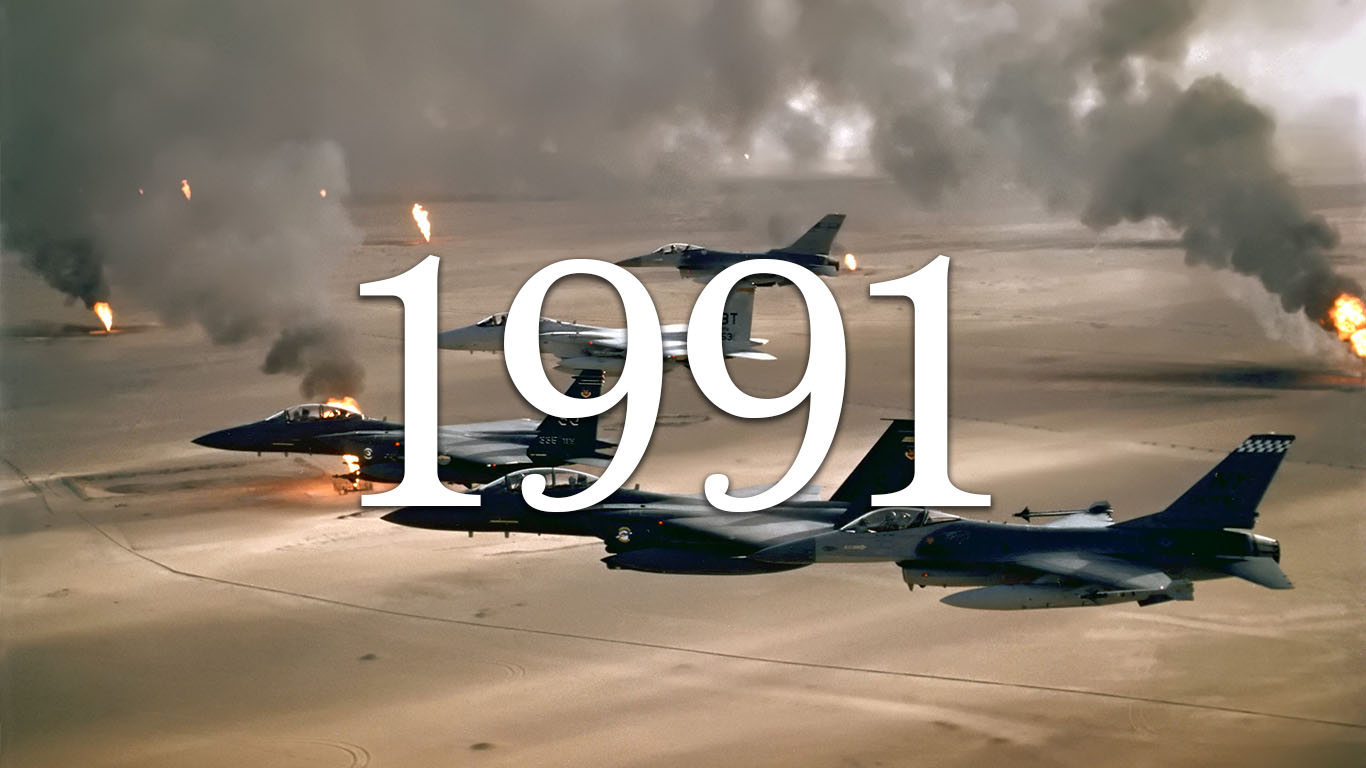
1991
> Start: 4,761.8
> End: 5,780.0
> High: 5,780.0
> Change: +21.4%
Source: Gary B. Edstrom / Wikimedia Commons
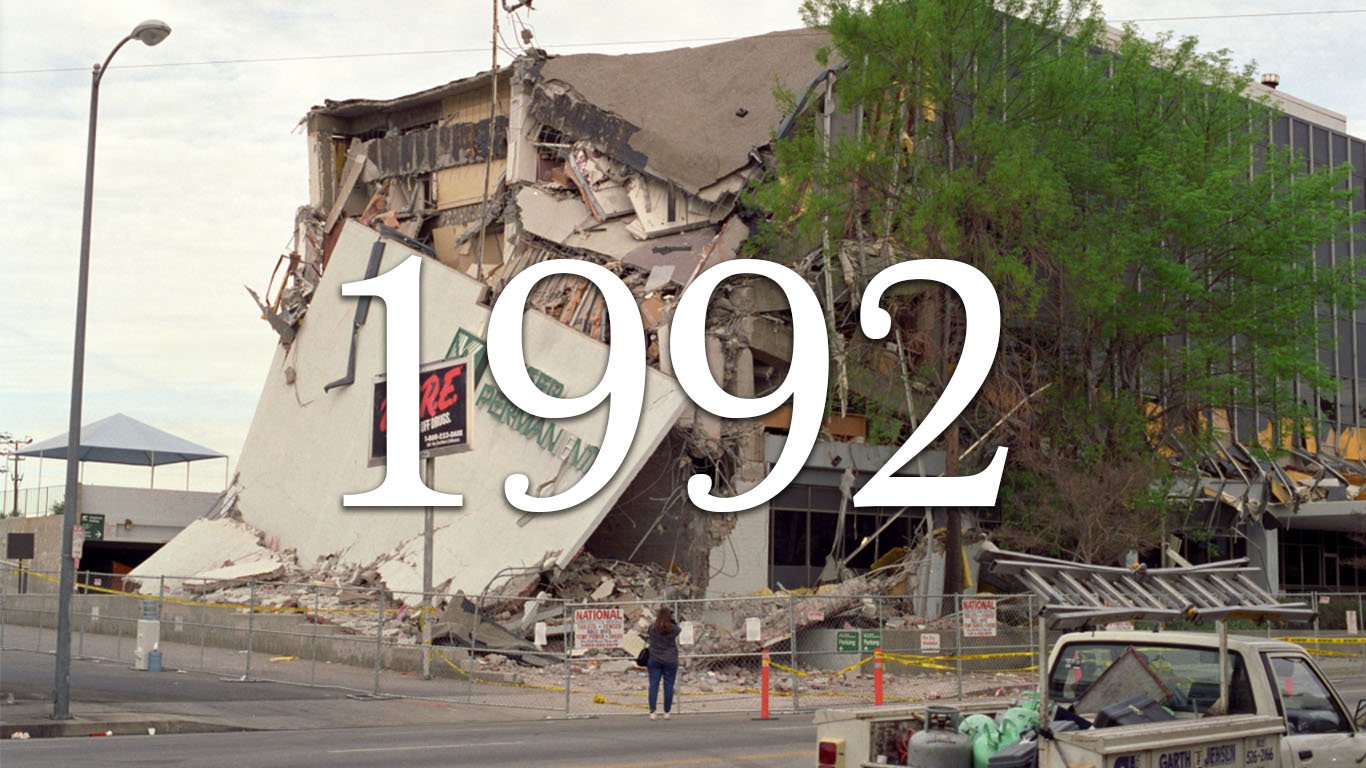
1992
> Start: 5,617.4
> End: 5,845.3
> High: 6,043.7
> Change: +4.1%
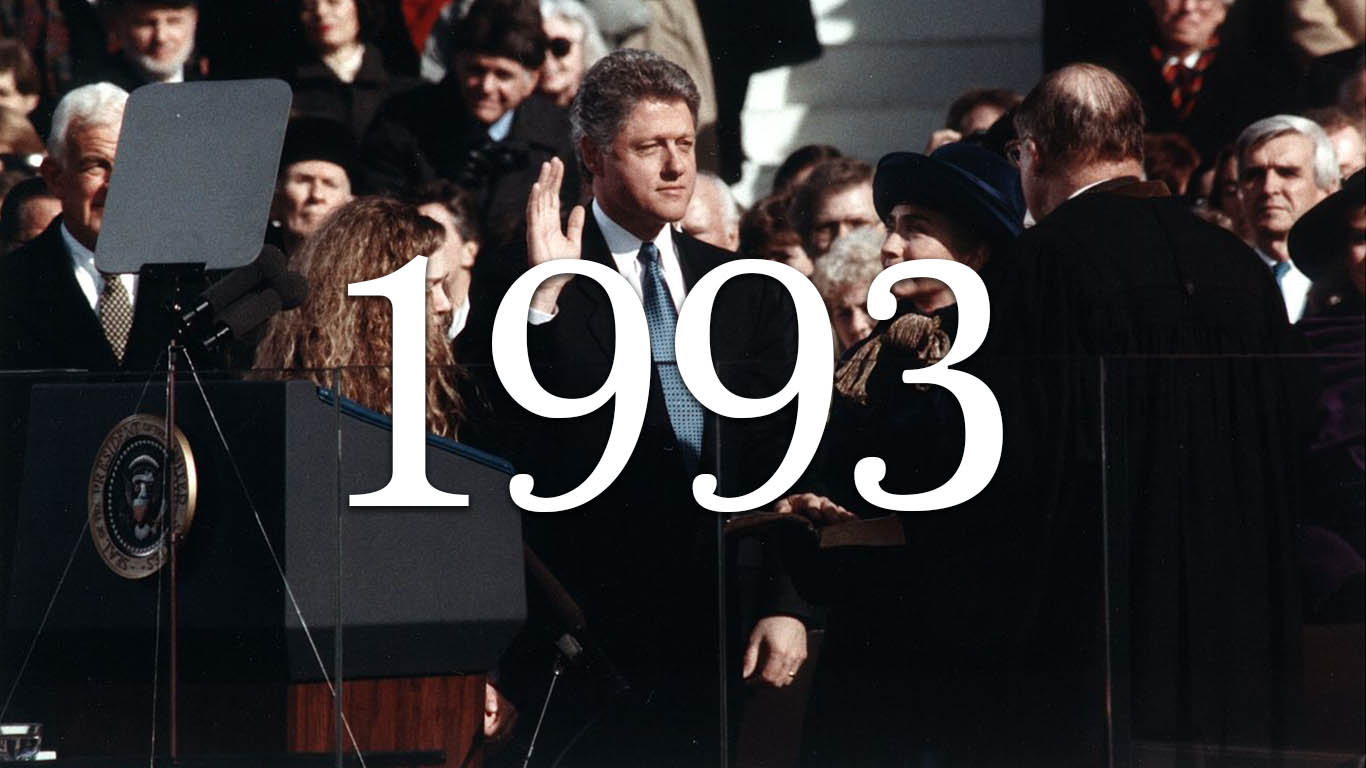
Source: Official White House photograph / Wikimedia Commons
1993
> Start: 5,689.3
> End: 6,454.2
> High: 6,523.3
> Change: +13.4%
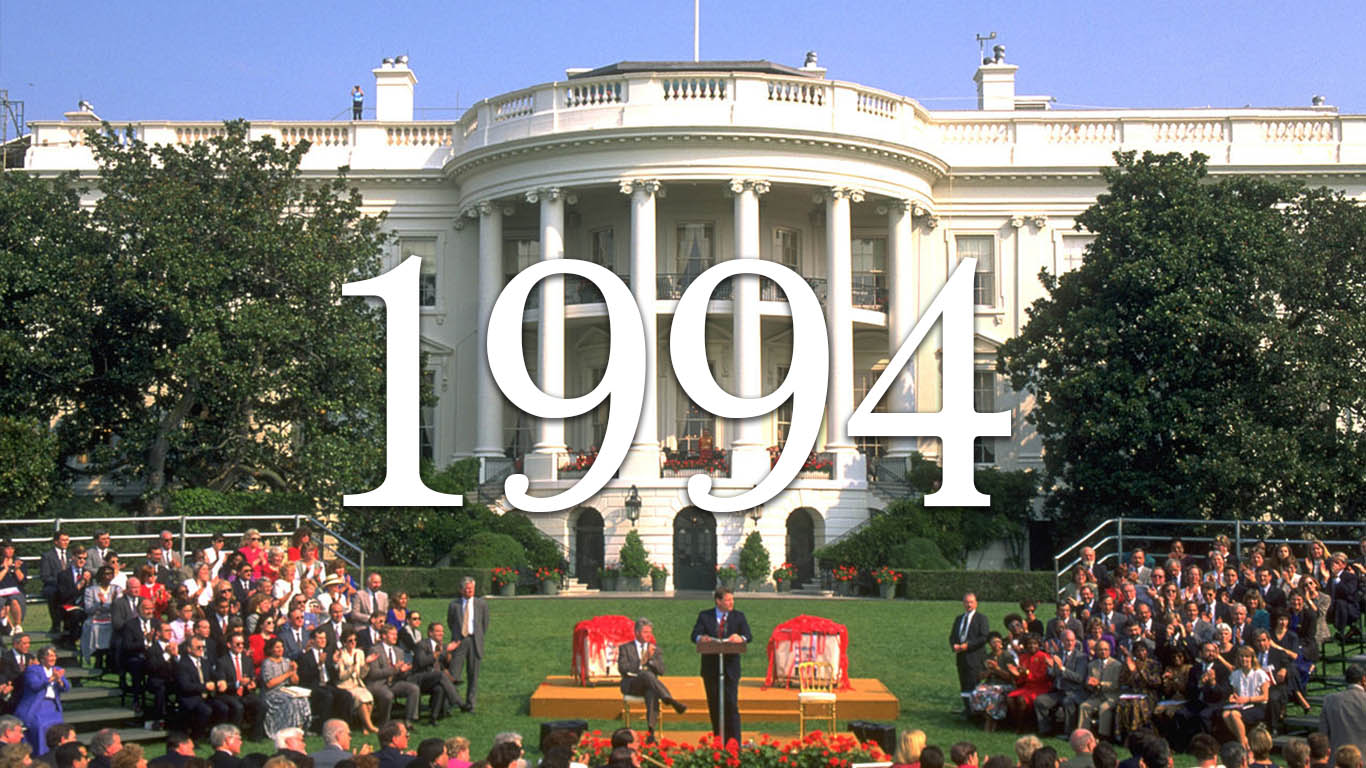
Source: Andrea Booher / FEMA / Wikimedia Commons
1994
> Start: 6,297.2
> End: 6,427.7
> High: 6,669.0
> Change: +2.1%
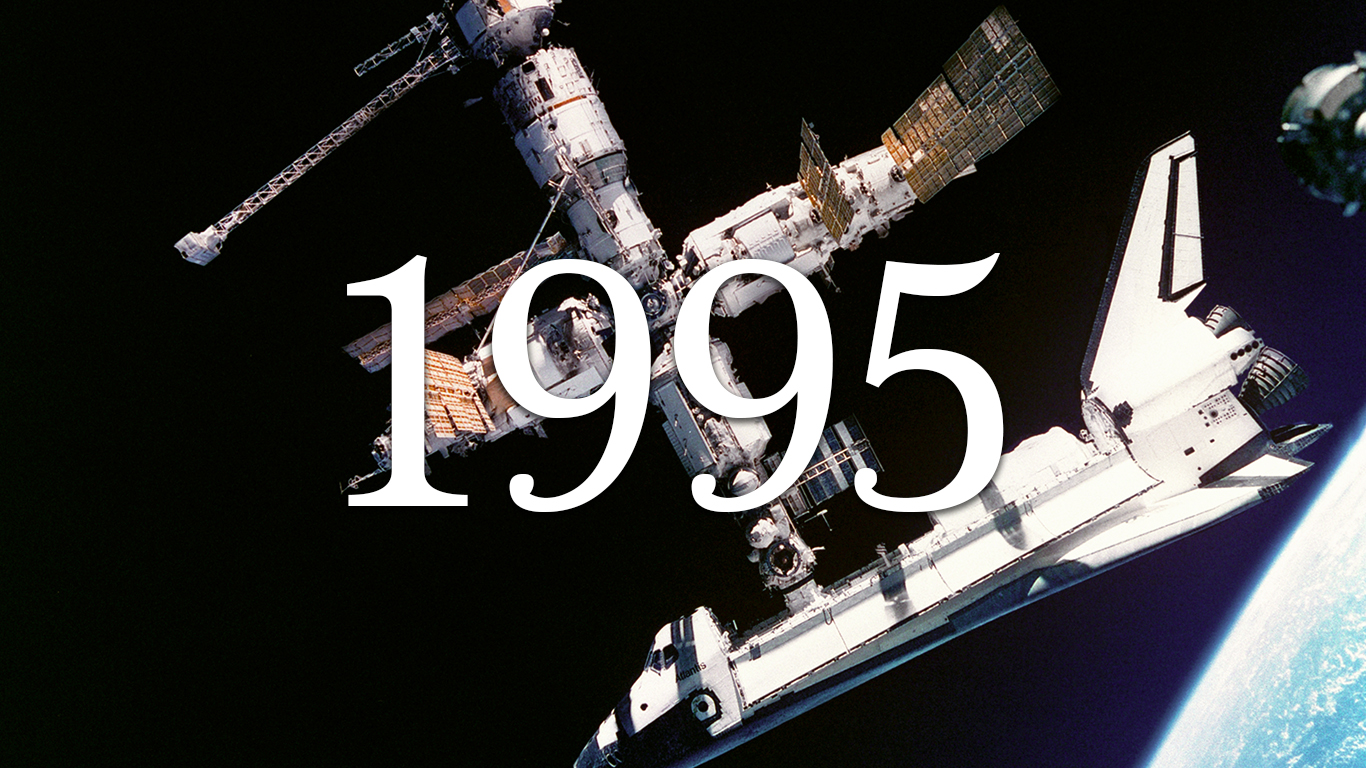
Source: NASA / Wikimedia Commons
1995
> Start: 6,257.2
> End: 8,341.5
> High: 8,503.4
> Change: +33.3%
[in-text-ad-2]
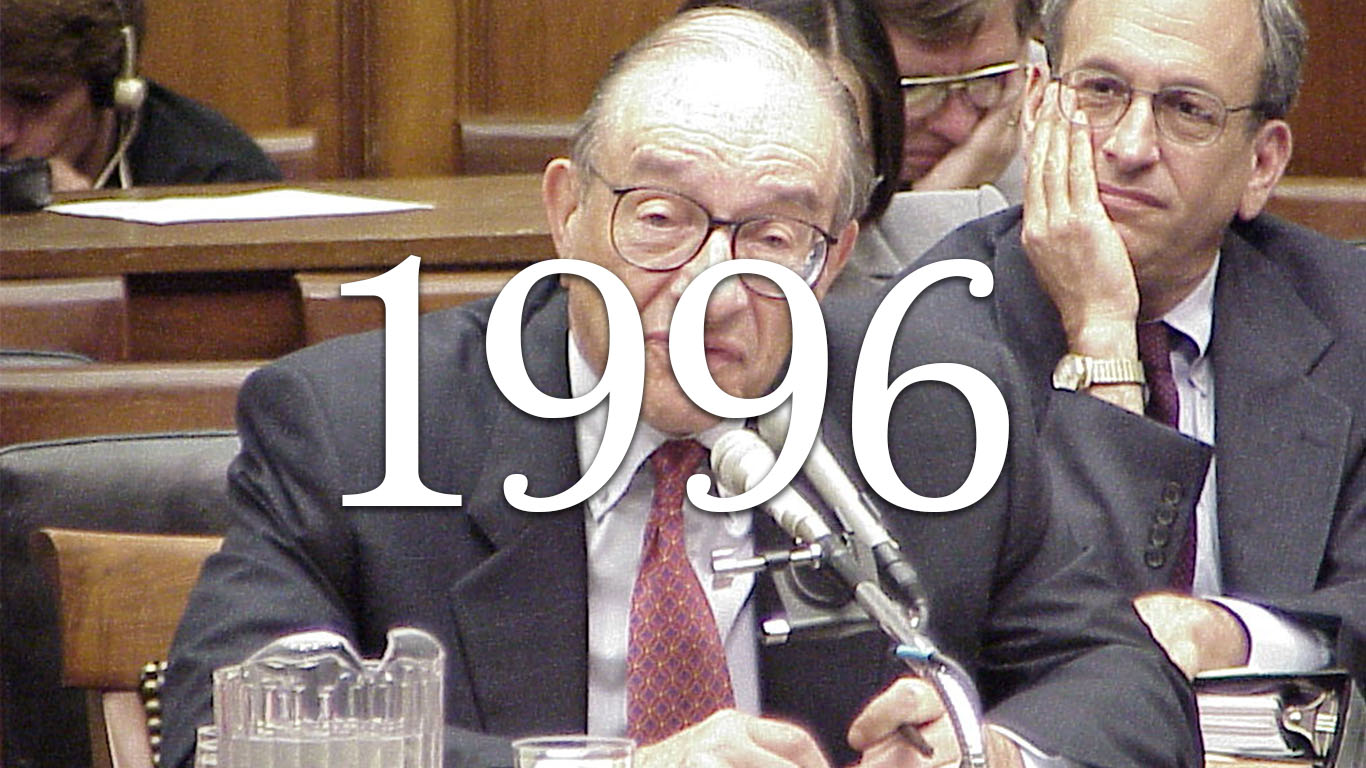
Source: Public Domain / Wikimedia Commons
1996
> Start: 8,197.8
> End: 10,209.9
> High: 10,388.3
> Change: +24.5%
Source: Kees de Vos / Wikimedia Commons
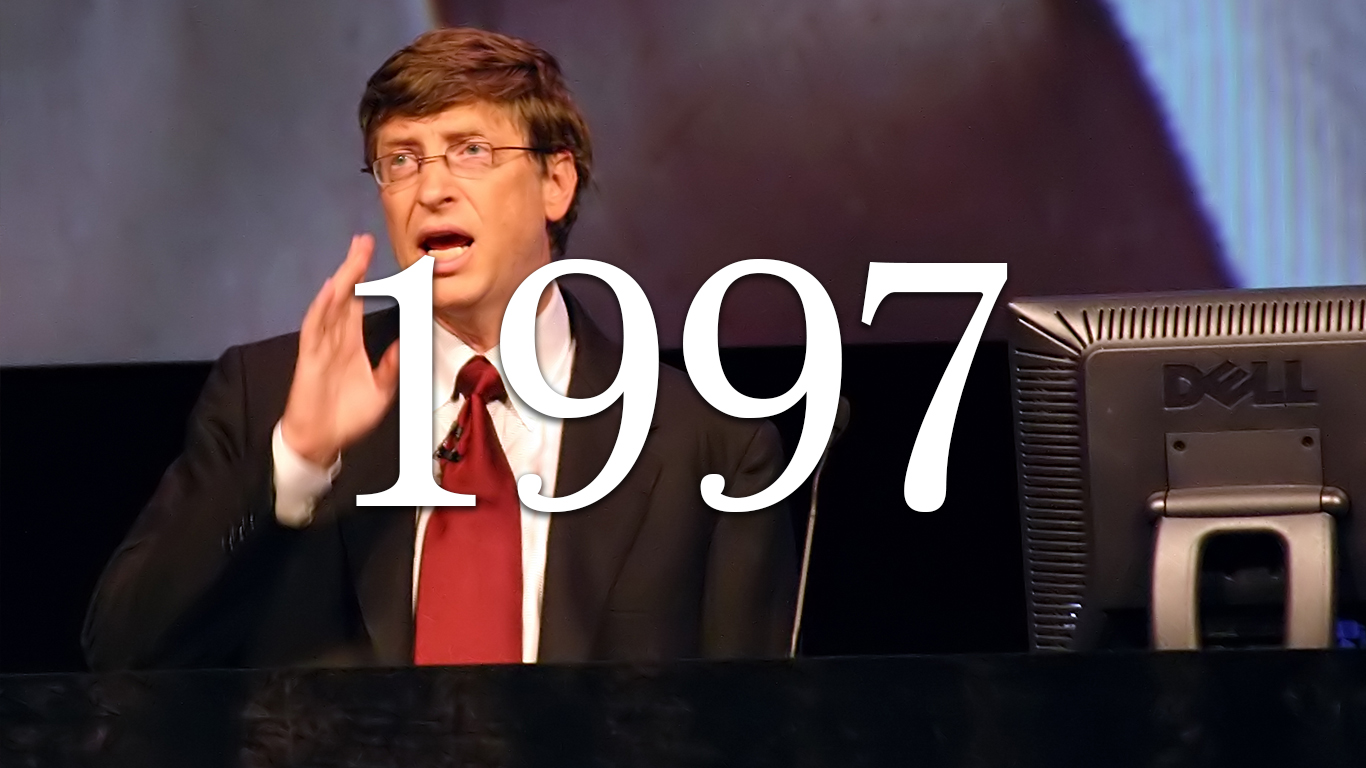
1997
> Start: 9,972.0
> End: 12,240.8
> High: 12,784.1
> Change: +22.8%
Source: Flickr user Kevin Jarrett / Wikimedia Commons
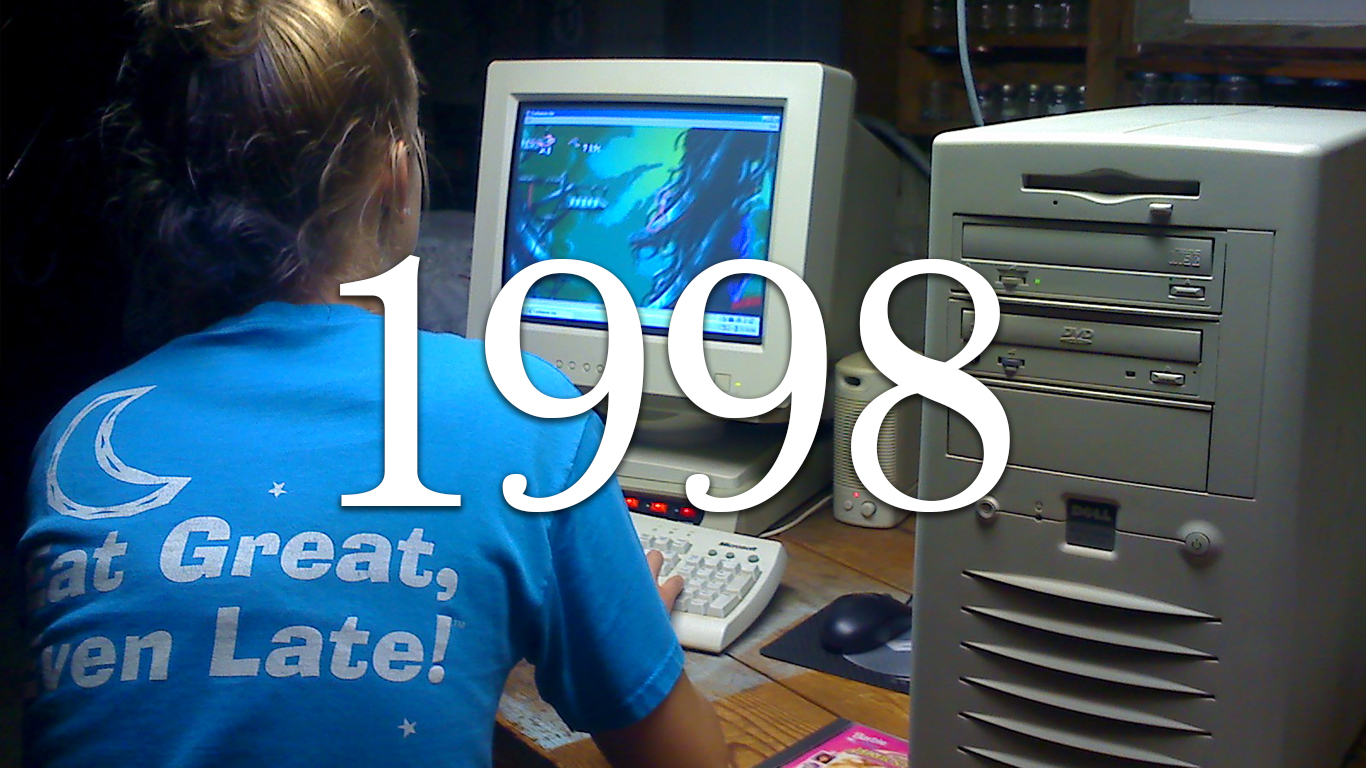
1998
> Start: 12,139.5
> End: 13,993.5
> High: 14,287.4
> Change: +15.3%
Source: Grj23 / Wikimedia Commons
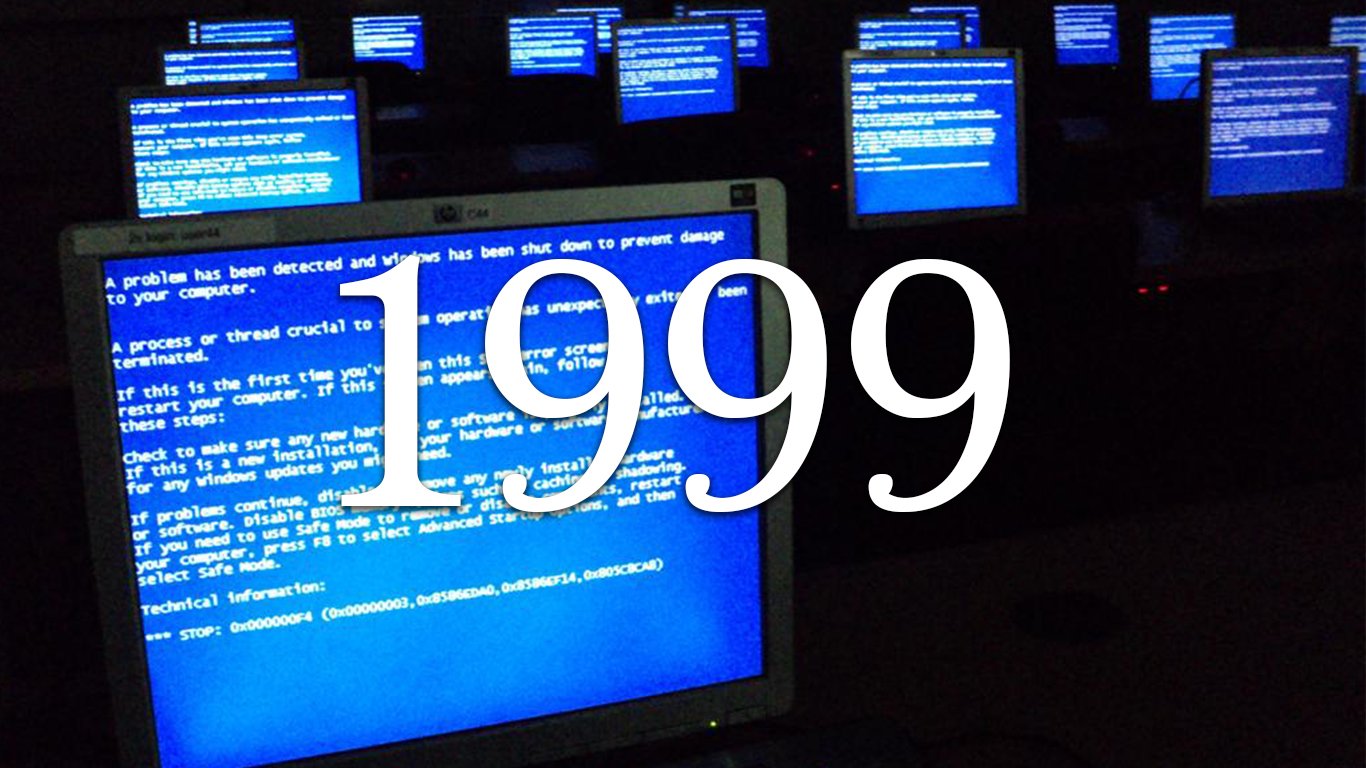
1999
> Start: 13,695.3
> End: 17,144.2
> High: 17,144.2
> Change: +25.2%
[in-text-ad]

Source: Rob Boudon / Wikimedia Commons
2000
> Start: 16,385.2
> End: 15,563.6
> High: 16,912.5
> Change: -5.0%
Source: SFC Thomas R. Roberts / Wikimedia Commons
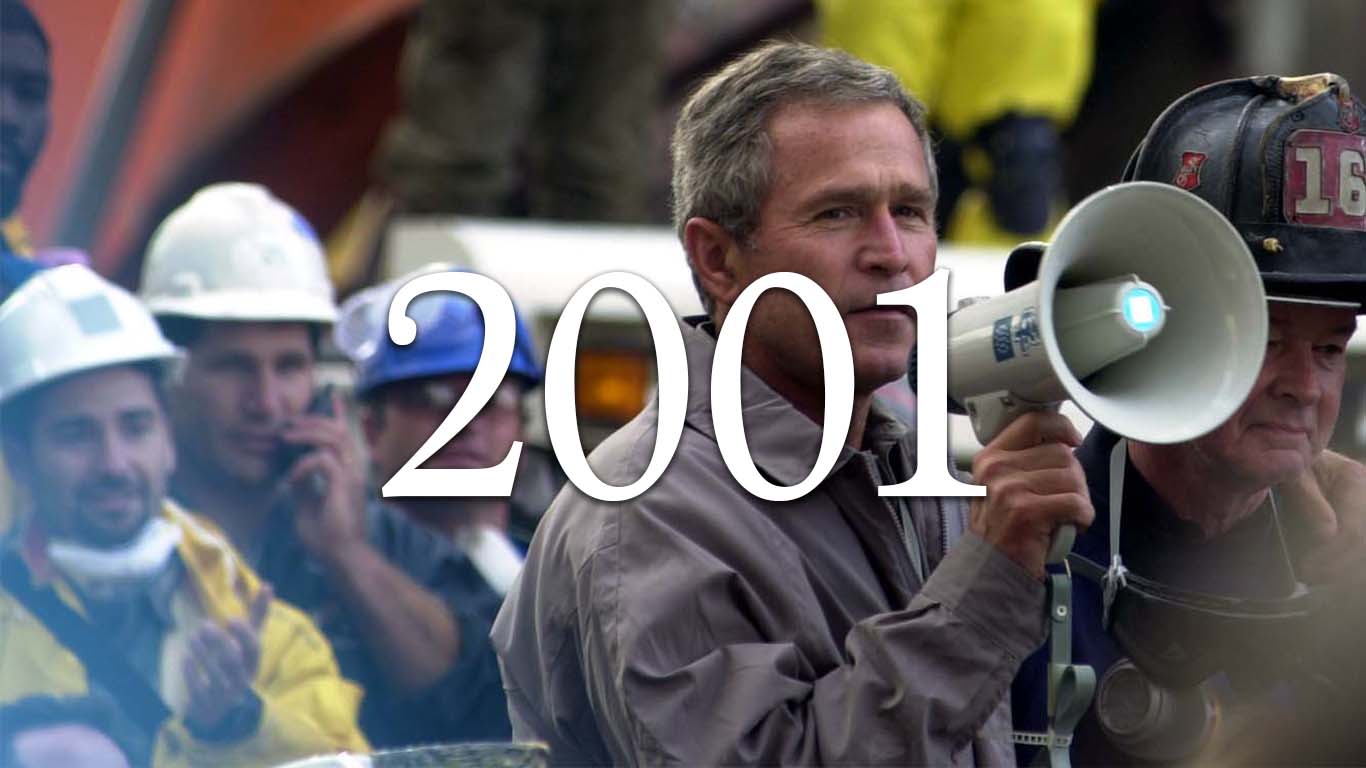
2001
> Start: 14,934.0
> End: 14,057.9
> High: 15,904.4
> Change: -5.9%
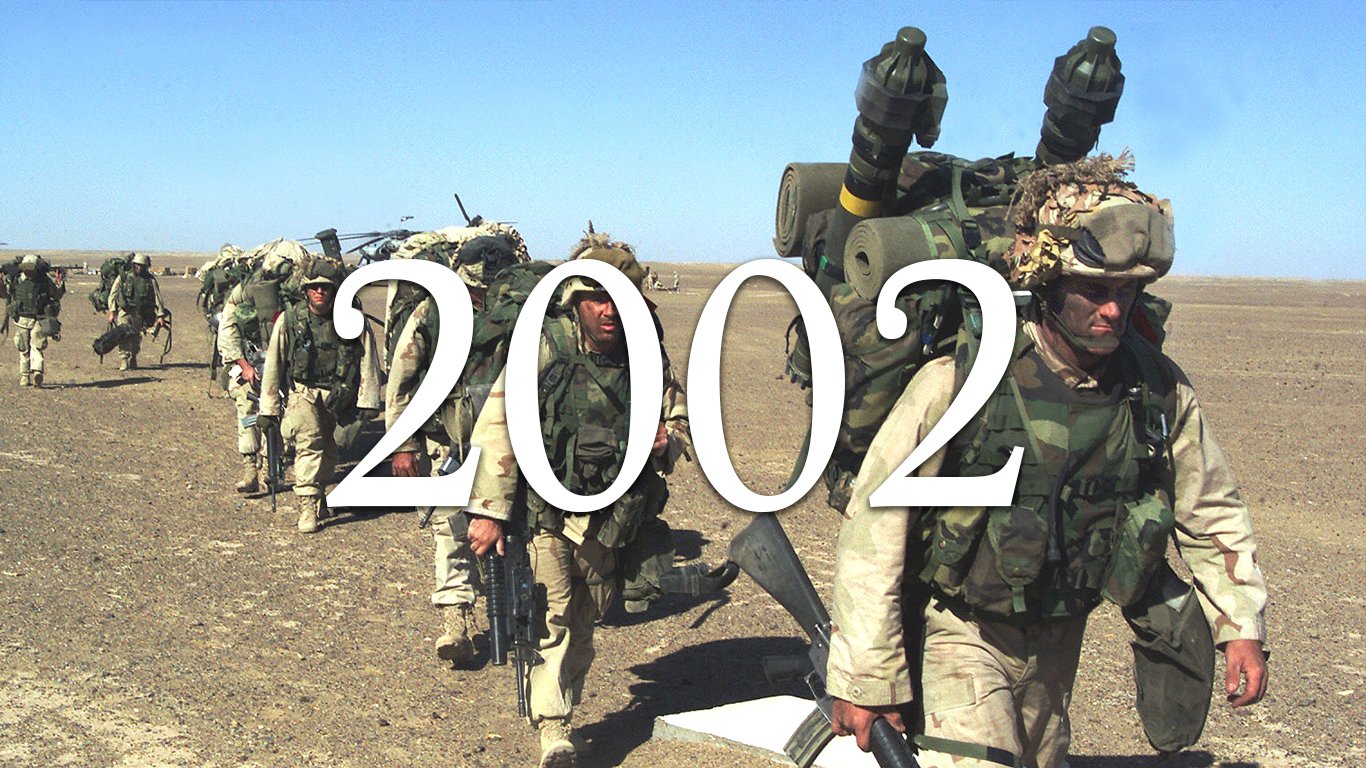
Source: Sergeant Joseph R. Chenelly, United States Marine Corps / Wikimedia Commons
2002
> Start: 13,910.6
> End: 11,519.2
> High: 14,686.5
> Change: -17.2%
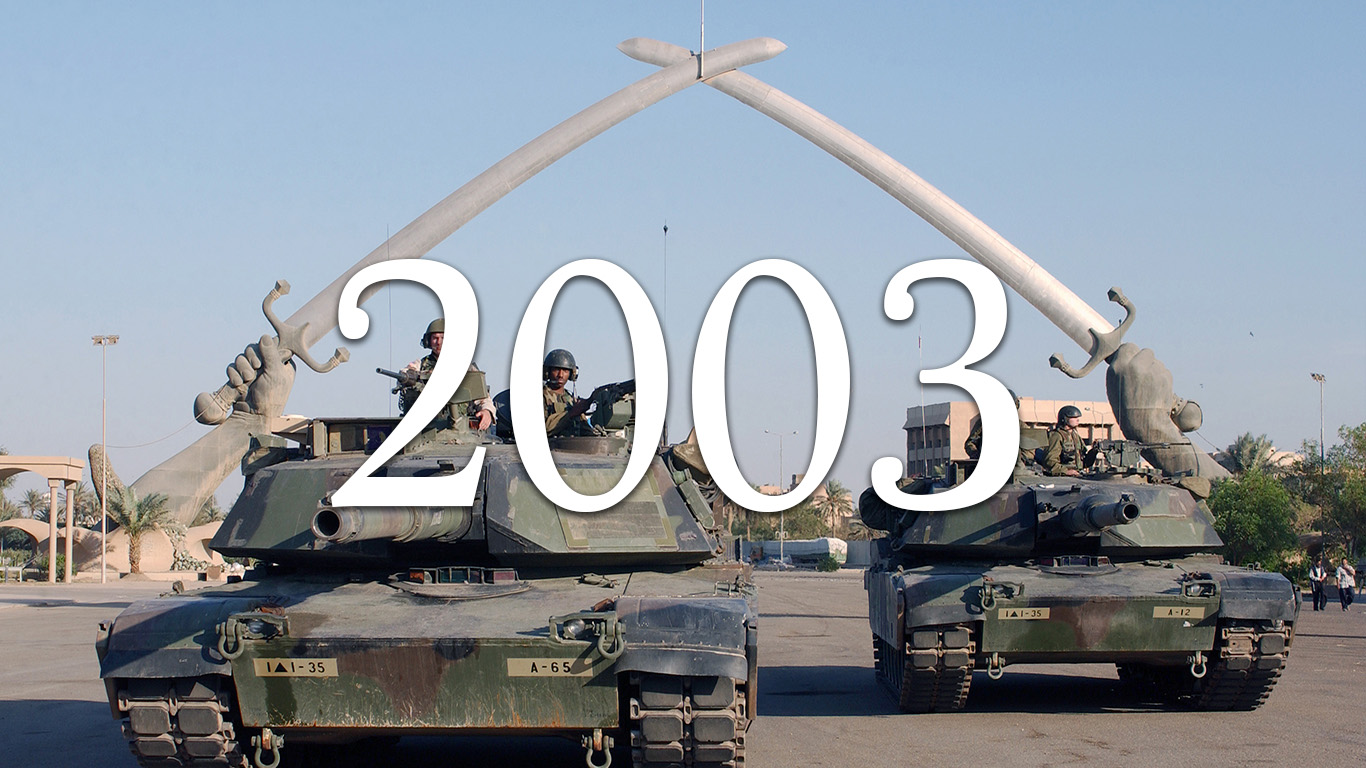
Source: National Archive Catalog / Wikimedia Commons
2003
> Start: 11,621.5
> End: 14,114.4
> High: 14,114.4
> Change: +21.5%
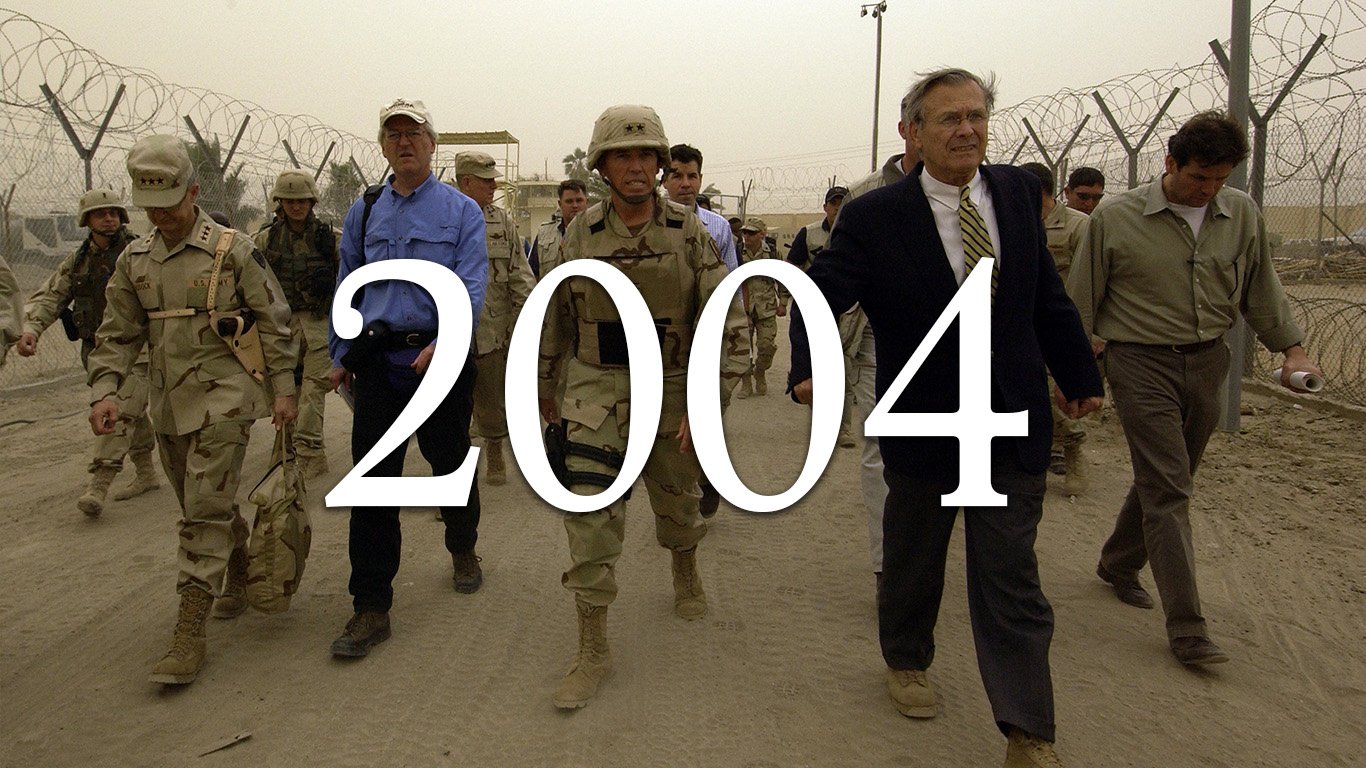
Source: Tech. Sgt. Jerry Morrison Jr., U.S. Air Force / Wikimedia Commons
2004
> Start: 13,690.4
> End: 14,181.1
> High: 14,275.2
> Change: +3.6%
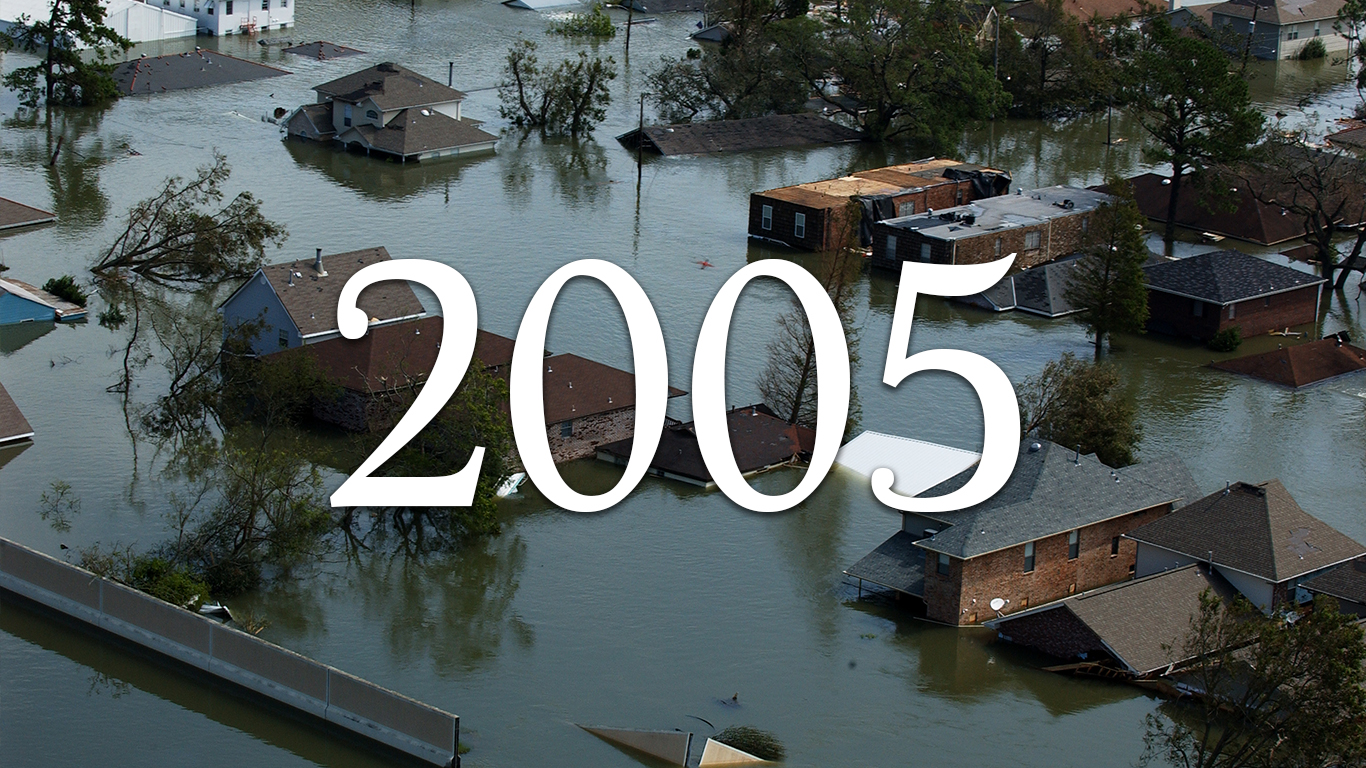
Source: Jocelyn Augustino / Wikimedia Commons
2005
> Start: 13,648.2
> End: 13,633.1
> High: 13,916.8
> Change: -0.1%
[in-text-ad-2]
Source: Kjetil Ree / Wikimedia Commons
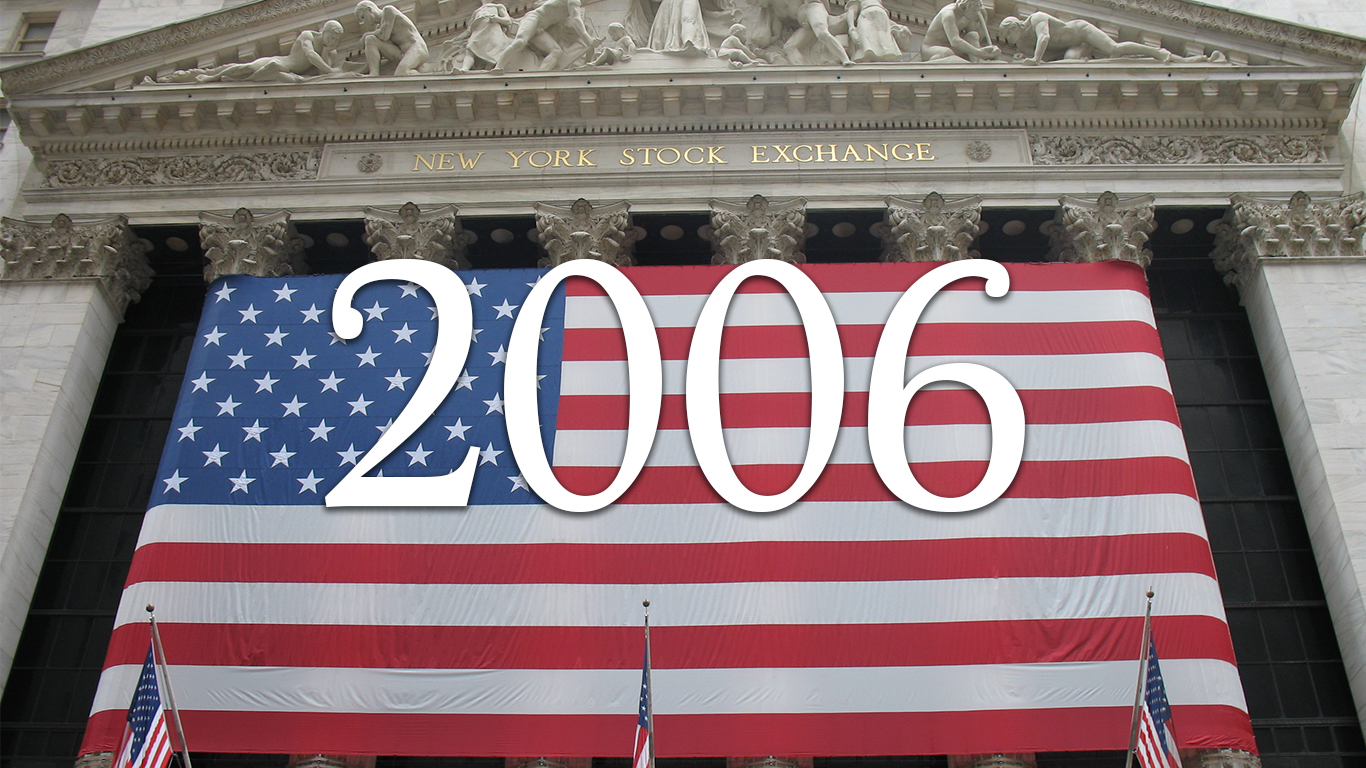
2006
> Start: 13,367.1
> End: 15,358.2
> High: 15,416.6
> Change: +14.9%
Source: Ben Stanfield / Wikimedia Commons
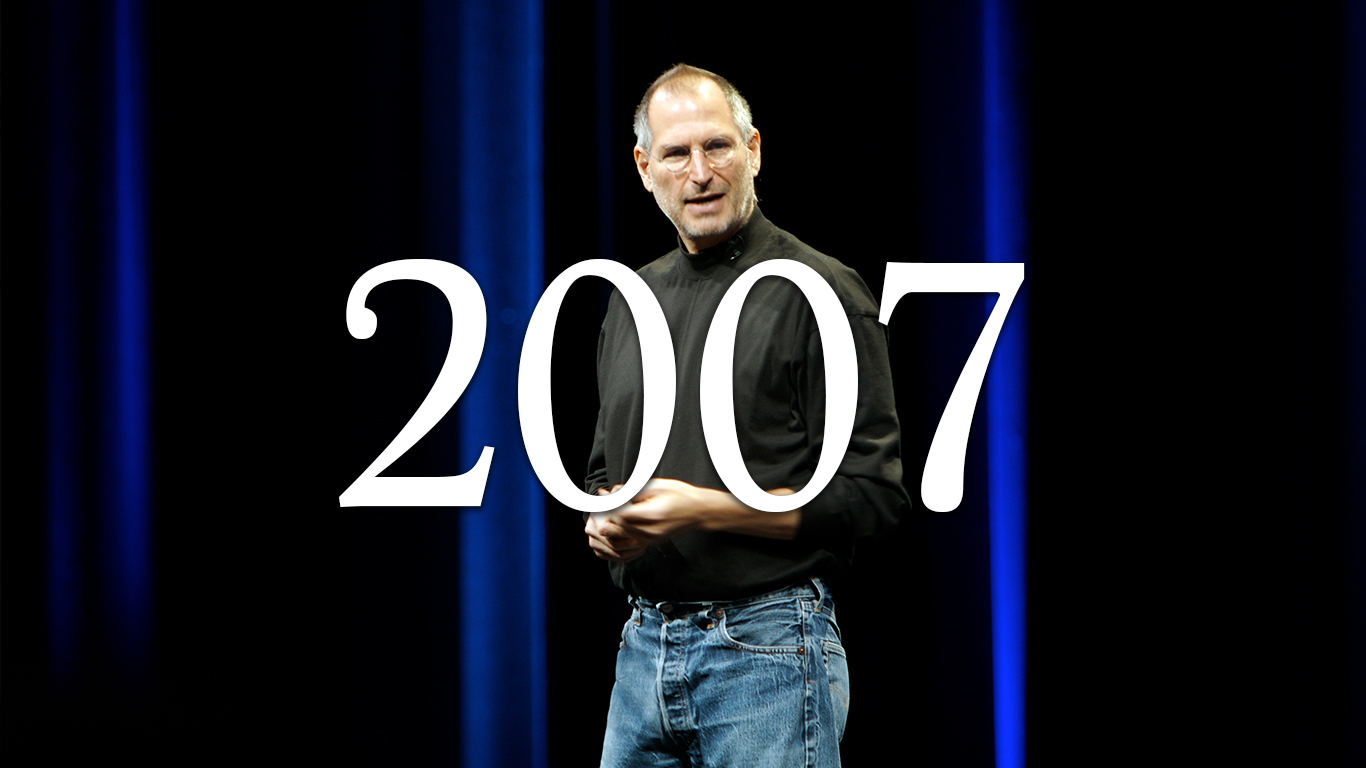
2007
> Start: 14,946.6
> End: 15,893.5
> High: 16,971.5
> Change: +6.3%
Source: CODEPINK Women For Peace / Wikimedia Commons
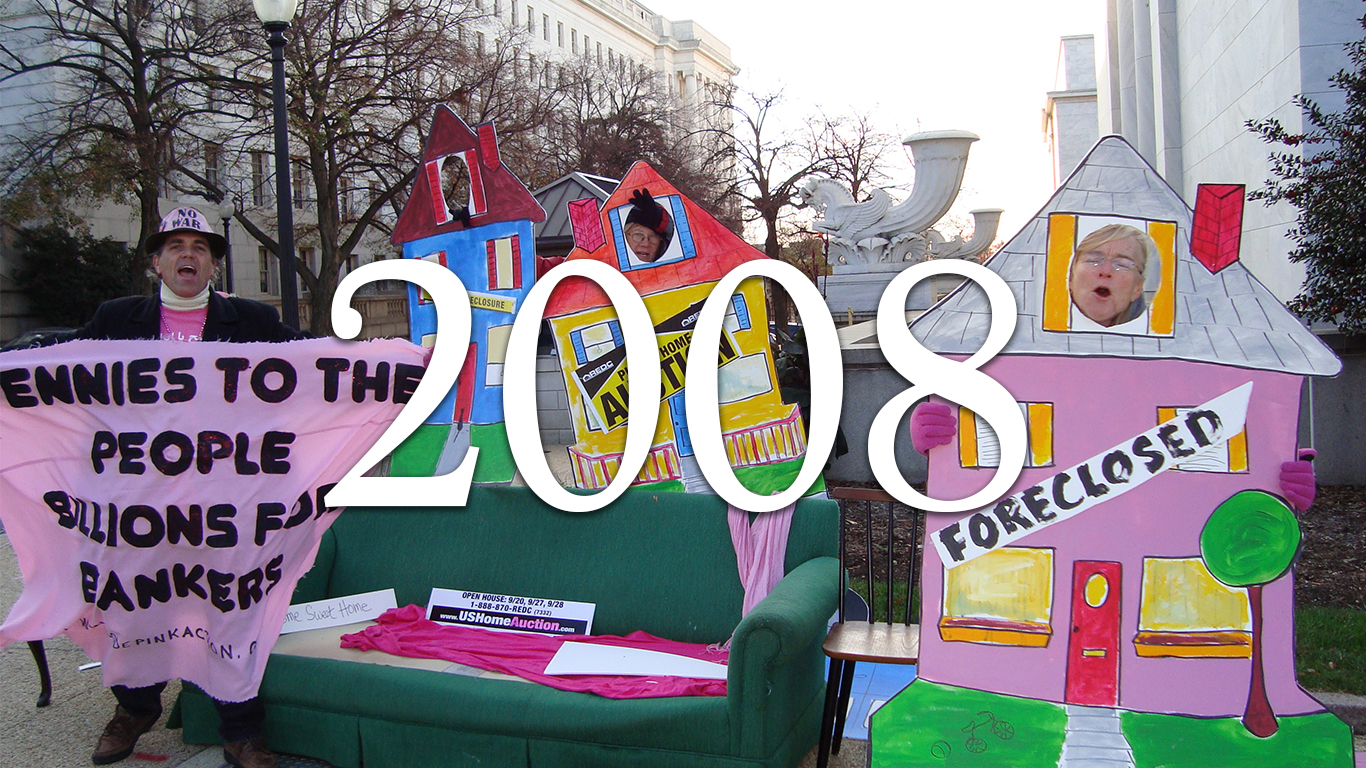
2008
> Start: 15,051.1
> End: 10,126.8
> High: 15,067.5
> Change: -32.7%
Source: Master Sgt. Cecilio Ricardo, U.S. Air Force / Wikimedia Commons
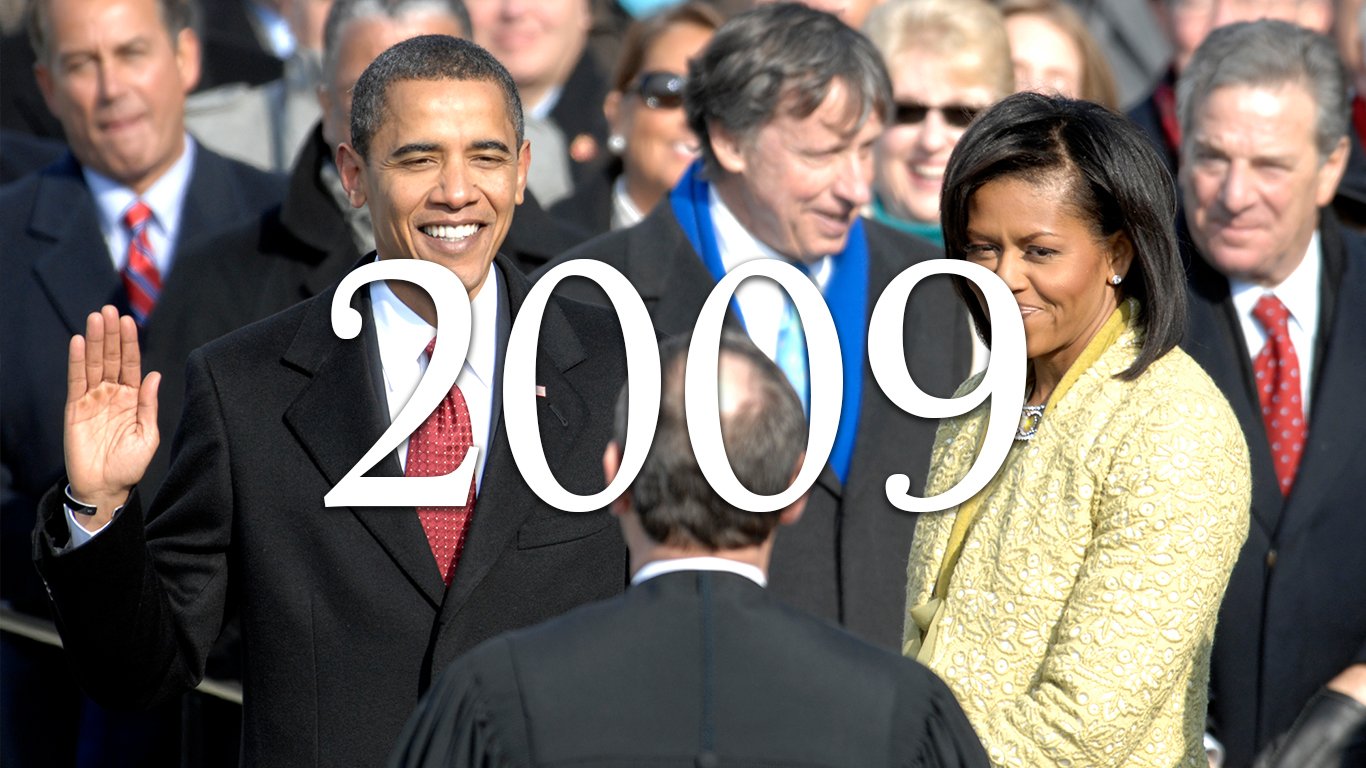
2009
> Start: 10,461.8
> End: 12,075.3
> High: 12,214.8
> Change: +15.4%
[in-text-ad]
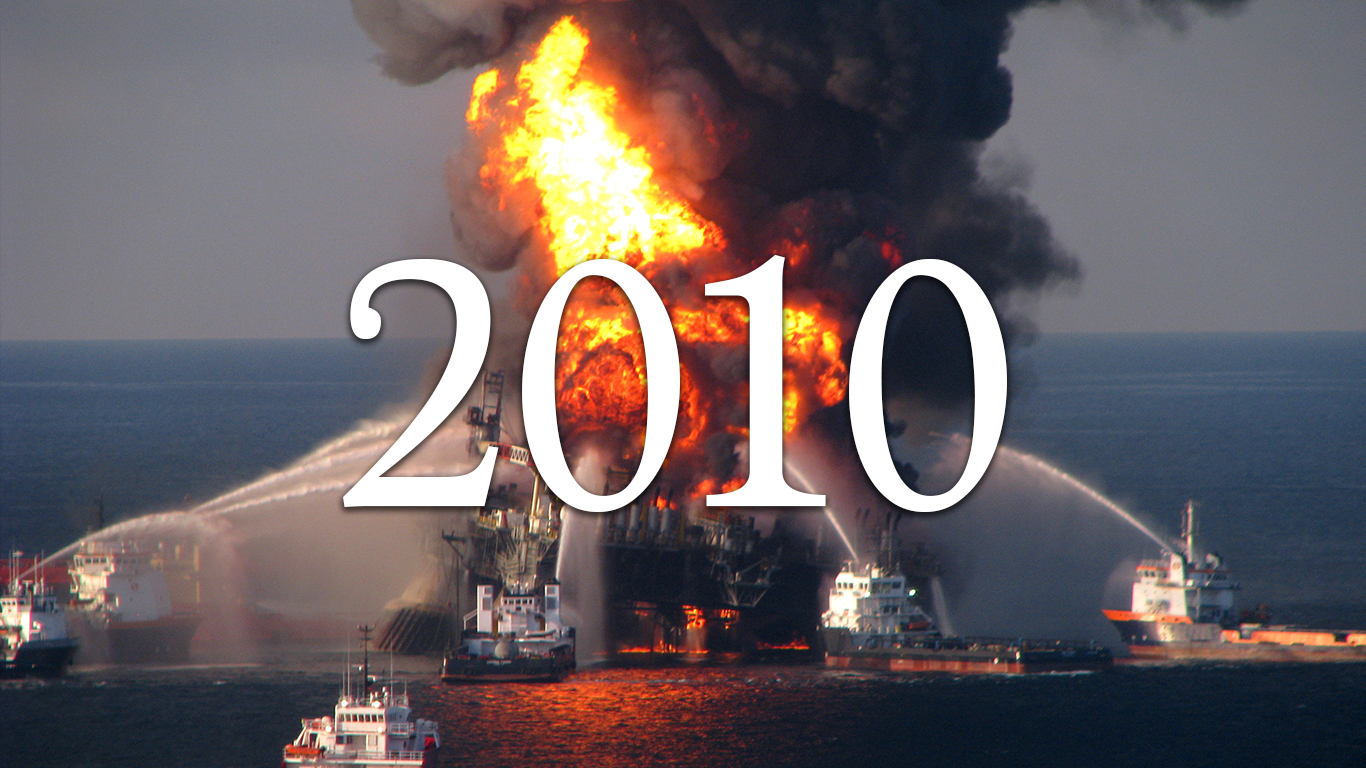
Source: U.S. Coast Guard / Wikimedia Commons
2010
> Start: 12,058.0
> End: 13,189.9
> High: 13,198.9
> Change: +9.4%
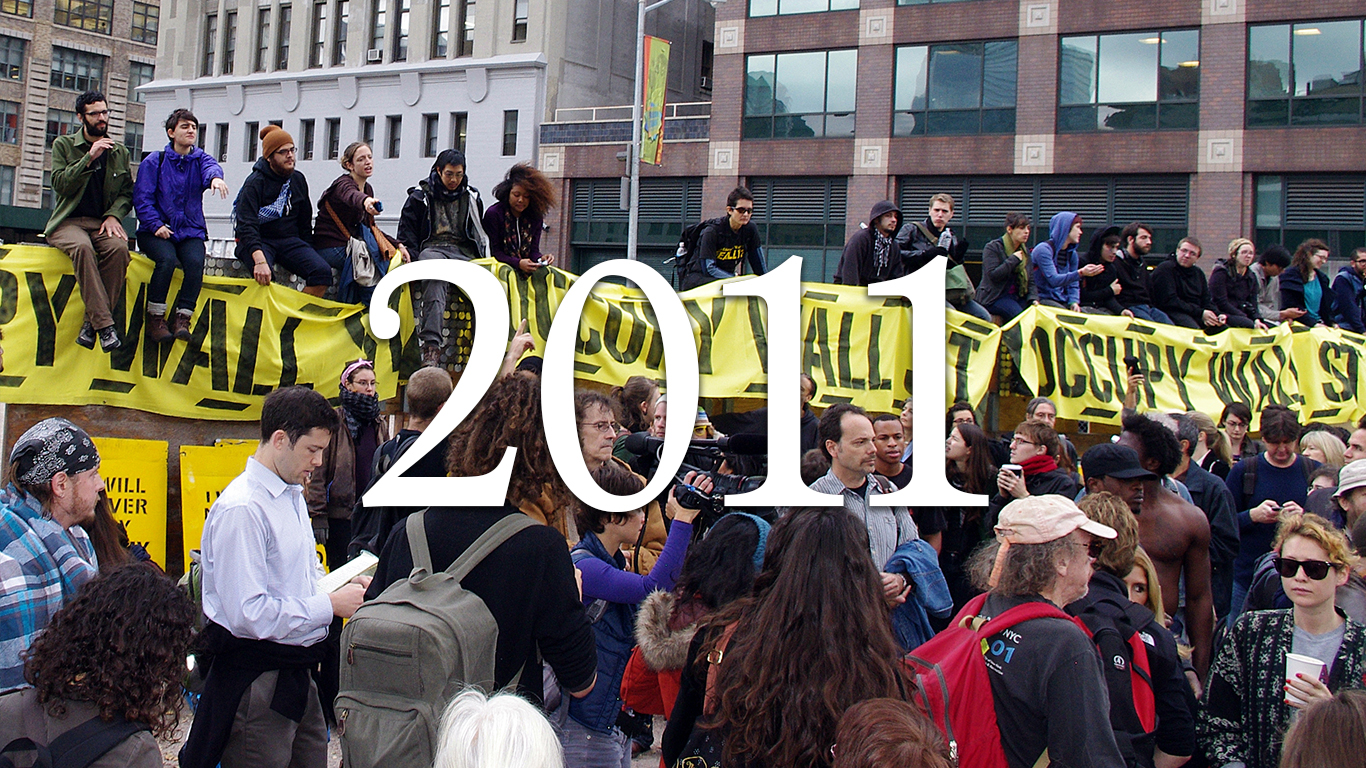
Source: David Shankbone / Wikimedia Commons
2011
> Start: 12,889.4
> End: 13,493.4
> High: 14,148.3
> Change: +4.7%
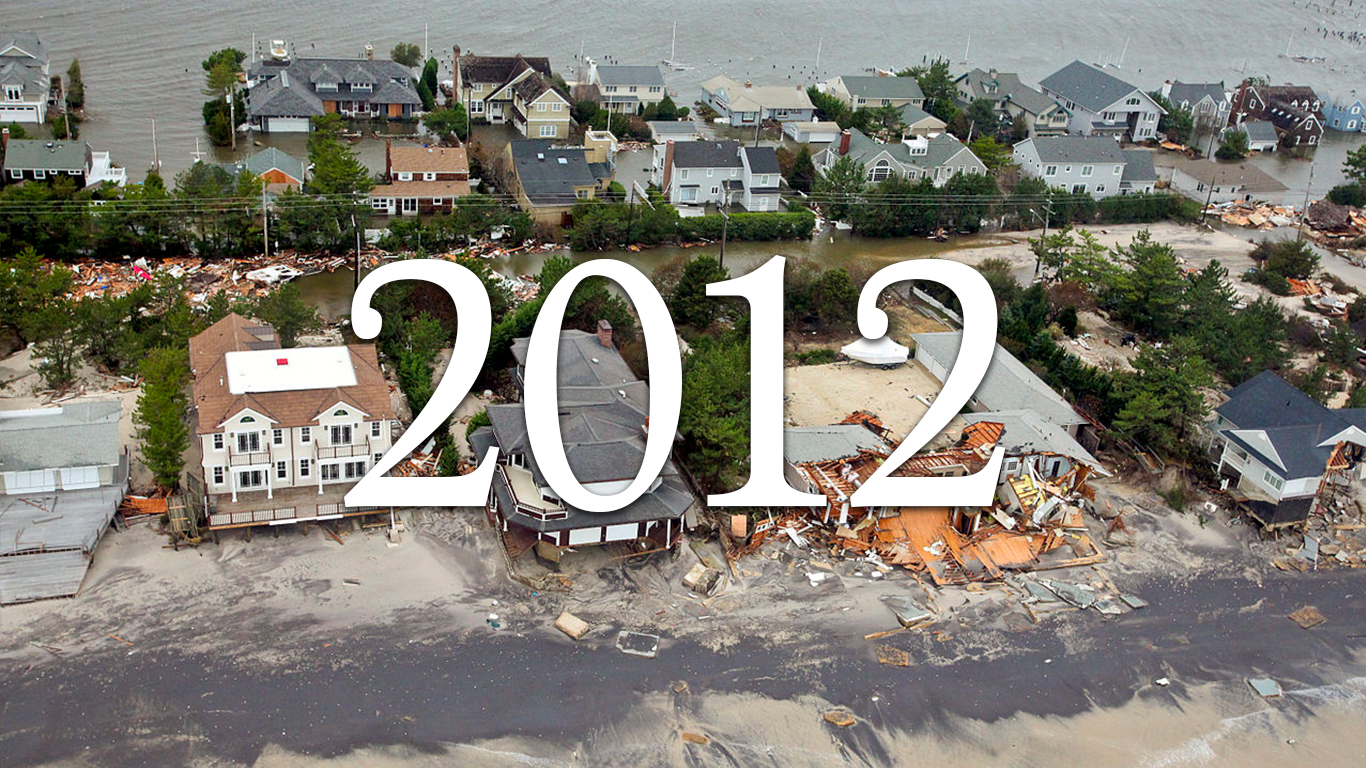
Source: New Jersey National Guard / Wikimedia Commons
2012
> Start: 13,414.6
> End: 14,179.4
> High: 14,726.9
> Change: +5.7%
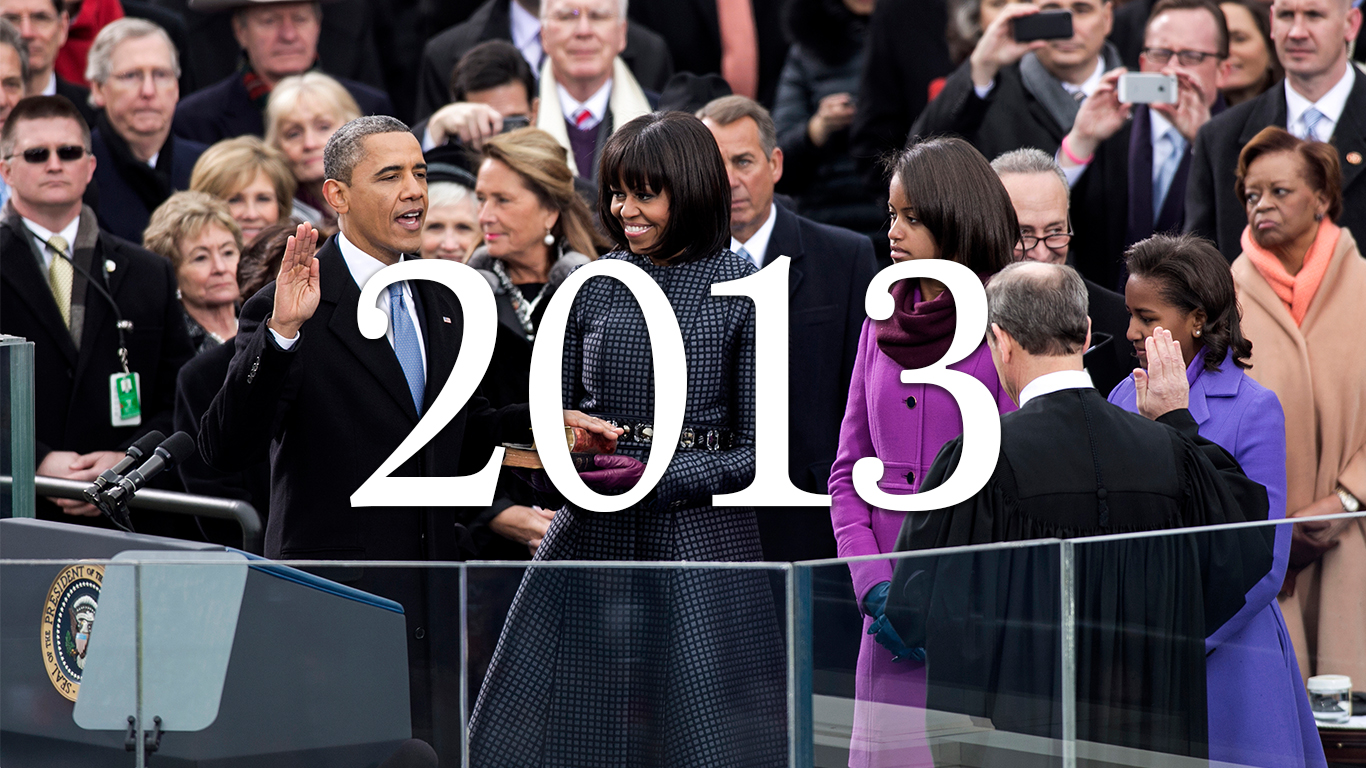
Source: White House / Sonya Hebert / Wikimedia Commons
2013
> Start: 14,303.2
> End: 17,677.4
> High: 17,677.4
> Change: +23.6%

Source: TechCrunch / Wikimedia Commons
2014
> Start: 17,253.1
> End: 18,703.1
> High: 18,945.1
> Change: +8.4%
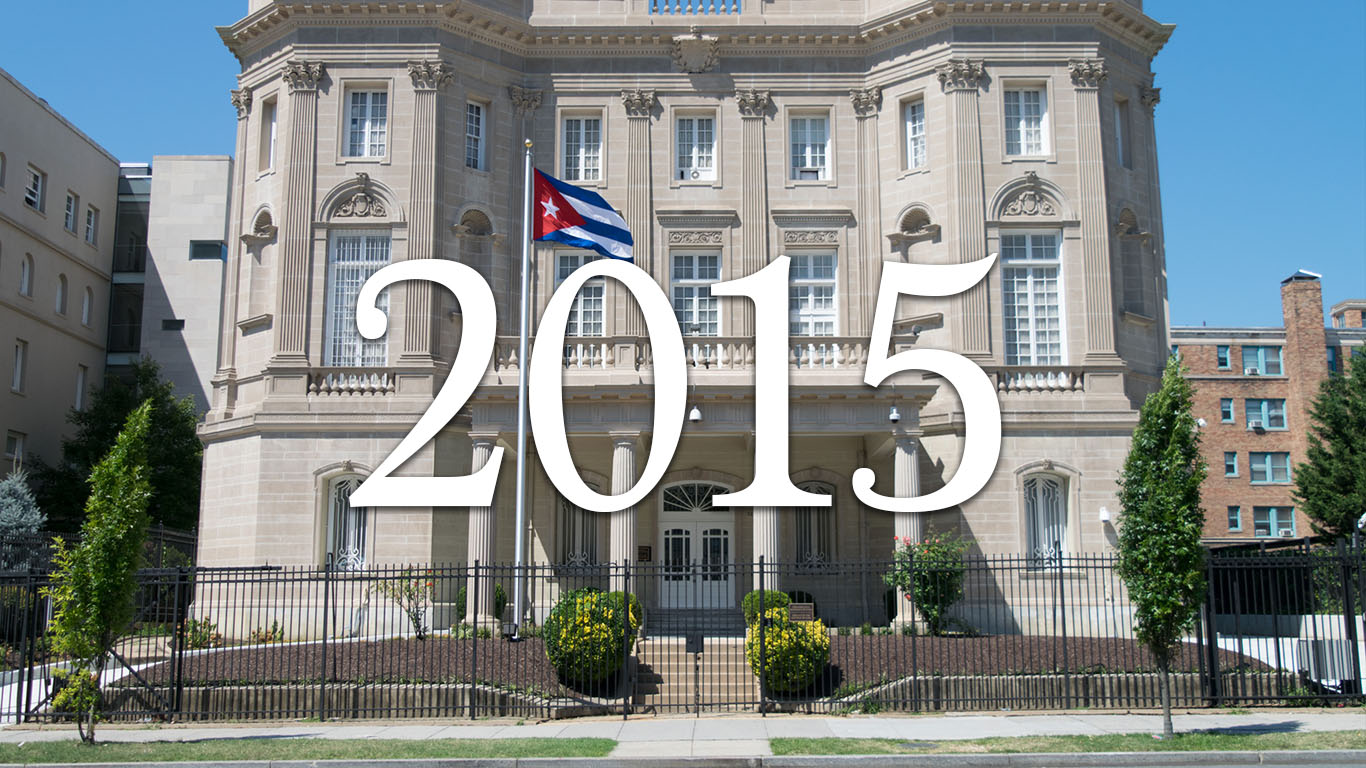
Source: Difference engine / Wikimedia Commons
2015
> Start: 18,691.4
> End: 18,263.8
> High: 19,193.9
> Change: -2.3%
[in-text-ad-2]
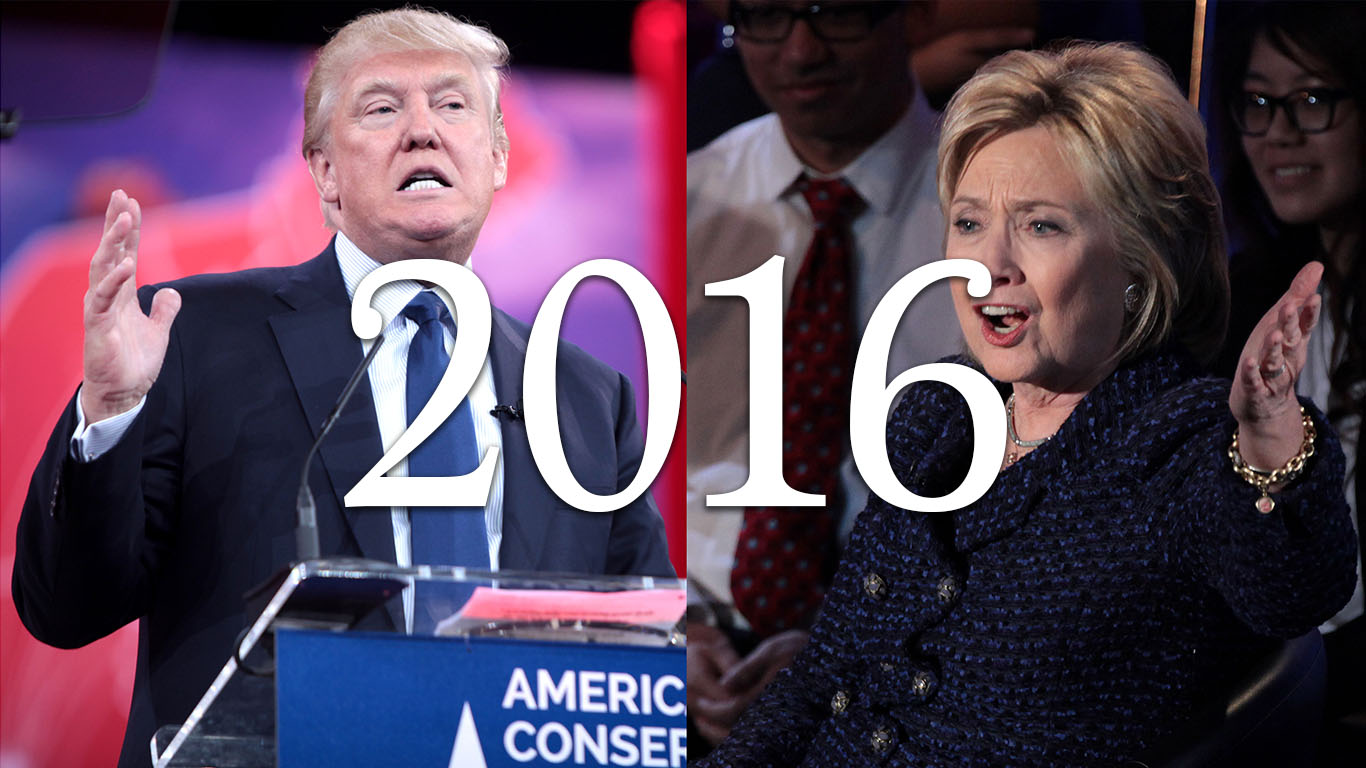
Source: Krassotkin, Gage Skidmore / Wikimedia Commons
2016
> Start: 17,750.5
> End: 20,455.8
> High: 20,675.3
> Change: +15.2%

Source: Wikimedia Commons
2017
> Start: 20,150.2
> End: 25,052.9
> High: 25,172.8
> Change: +24.3%

Source: Clive Brunskill / Getty Images
2018
> Start: 24,824.0
> End: 23,327.5
> High: 26,828.4
> Change: -6.0%
Essential Tips for Investing: Sponsored
A financial advisor can help you understand the advantages and disadvantages of investment properties. Finding a qualified financial advisor doesn’t have to be hard. SmartAsset’s free tool matches you with up to three financial advisors who serve your area, and you can interview your advisor matches at no cost to decide which one is right for you. If you’re ready to find an advisor who can help you achieve your financial goals, get started now.
Investing in real estate can diversify your portfolio. But expanding your horizons may add additional costs. If you’re an investor looking to minimize expenses, consider checking out online brokerages. They often offer low investment fees, helping you maximize your profit.
Thank you for reading! Have some feedback for us?
Contact the 24/7 Wall St. editorial team.
Editors' Picks

