

In October of last year, the Dow Jones Industrial Average peaked at 26,952, the highest point on record for the stock index. Though the DJIA comprises only 30 stocks, it is often regarded as a gauge of American business and economic prosperity. At the time of this writing, the Dow Jones sits at just over 26,000, over triple its value from a decade ago.
The DJIA is a price-weighted average of 30 large American companies. The index currently contains companies such as the world’s largest retailer Walmart, media juggernaut Disney, global financial institution J.P. Morgan, aerospace and defense giant Boeing, and as of 2015, tech behemoth Apple.
The companies comprising the Dow change over time to reflect the changing economy. Since the creator of the index, Charles Dow, was also the founding editor of The Wall Street Journal, editors at the publication select the companies that comprise the index.
Since its inception in 1896, when only 12 companies were included in the average, the Dow has changed only 50 times. The last remaining company from the original list of 12, General Electric, was finally removed in June 2018. It was replaced with drugstore chain Walgreens Boots Alliance.
To determine the value of the Dow Jones Industrial Average the year you were born, 24/7 Wall St. reviewed daily Dow figures aggregated by economic research website Macrotrends.net. Historical Dow data are inflation-adjusted using annual headline CPI in chained 2018 dollars.
Click here to see what the stock market was worth the year you were born.

1929
> Start: 4,452.4
> End: 3,603.6
> High: 5,527.9
> Change: -19.1%
[in-text-ad]
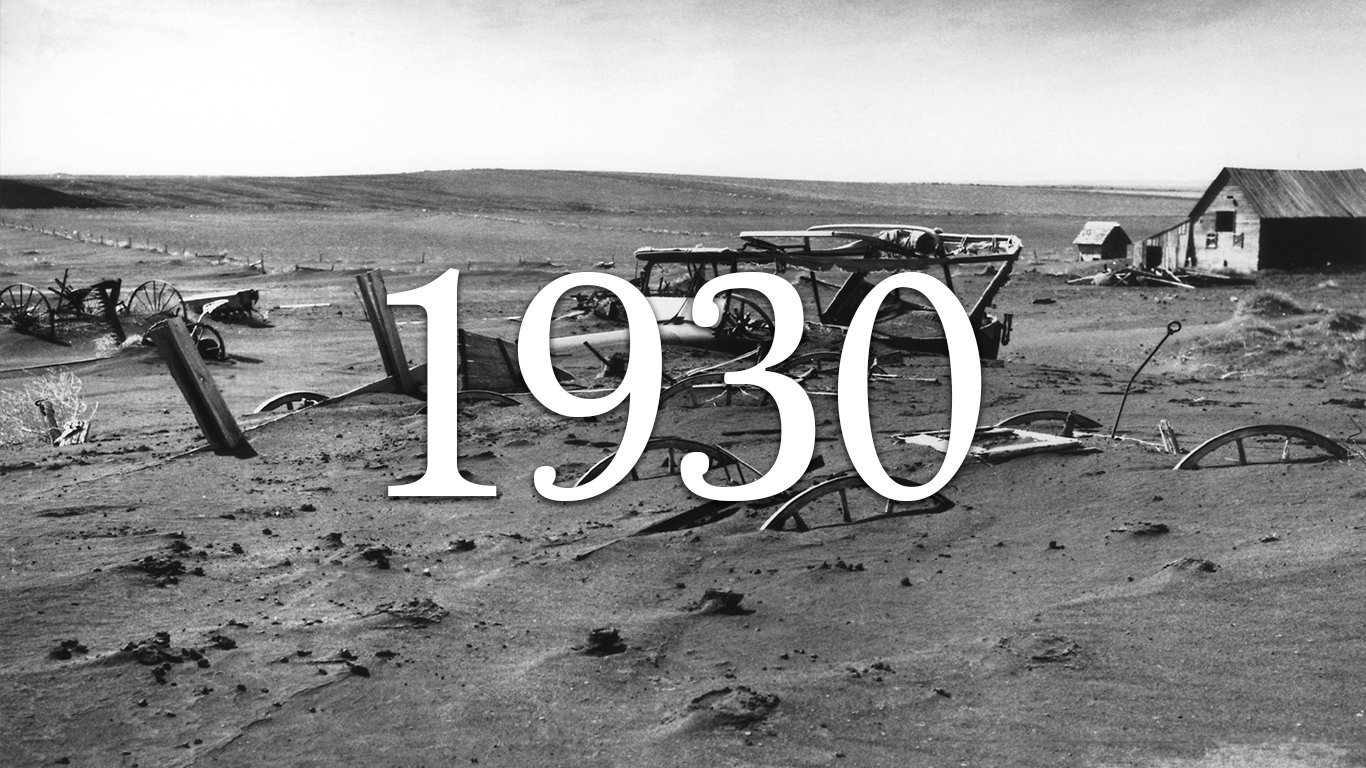
1930
> Start: 3,632.7
> End: 2,448.3
> High: 4,374.6
> Change: -32.6%

1931
> Start: 2,770.4
> End: 1,270.7
> High: 3,170.4
> Change: -54.1%

1932
> Start: 1,357.1
> End: 1,089.9
> High: 1,614.6
> Change: -19.7%

1933
> Start: 1,136.5
> End: 1,915.0
> High: 2,083.1
> Change: +68.5%

1934
> Start: 1,862.0
> End: 1,930.3
> High: 2,054.6
> Change: +3.7%

1935
> Start: 1,891.0
> End: 2,607.9
> High: 2,685.9
> Change: +37.9%
[in-text-ad-2]

1936
> Start: 2,583.4
> End: 3,224.6
> High: 3,314.2
> Change: +24.8%

1937
> Start: 3,088.4
> End: 2,090.7
> High: 3,363.1
> Change: -32.3%

1938
> Start: 2,125.8
> End: 2,728.7
> High: 2,793.0
> Change: +28.4%

1939
> Start: 2,747.9
> End: 2,687.1
> High: 2,788.7
> Change: -2.2%
[in-text-ad]

1940
> Start: 2,681.4
> End: 2,321.9
> High: 2,705.6
> Change: -13.4%
1941
> Start: 2,202.1
> End: 1,871.4
> High: 2,253.1
> Change: -15.0%

1942
> Start: 1,718.7
> End: 1,819.8
> High: 1,824.5
> Change: +5.9%

1943
> Start: 1,722.2
> End: 1,951.4
> High: 2,094.0
> Change: +13.3%

1944
> Start: 1,918.5
> End: 2,150.0
> High: 2,153.0
> Change: +12.1%
1945
> Start: 2,105.8
> End: 2,662.5
> High: 2,702.6
> Change: +26.4%
[in-text-ad-2]

1946
> Start: 2,436.7
> End: 2,252.9
> High: 2,701.7
> Change: -7.5%
1947
> Start: 1,961.5
> End: 2,014.6
> High: 2,077.8
> Change: +2.7%

1948
> Start: 1,867.8
> End: 1,829.2
> High: 1,992.8
> Change: -2.1%

1949
> Start: 1,823.2
> End: 2,084.6
> High: 2,088.7
> Change: +14.3%
[in-text-ad]

1950
> Start: 2,051.9
> End: 2,428.7
> High: 2,429.3
> Change: +18.4%

1951
> Start: 2,294.2
> End: 2,574.5
> High: 2,642.7
> Change: +12.2%

1952
> Start: 2,525.1
> End: 2,731.3
> High: 2,732.3
> Change: +8.2%

1953
> Start: 2,713.1
> End: 2,608.7
> High: 2,728.4
> Change: -3.8%

1954
> Start: 2,614.5
> End: 3,737.4
> High: 3,737.4
> Change: +42.9%

1955
> Start: 3,793.1
> End: 4,530.7
> High: 4,530.7
> Change: +19.4%
[in-text-ad-2]
1956
> Start: 4,440.1
> End: 4,565.2
> High: 4,762.5
> Change: +2.8%

1957
> Start: 4,377.6
> End: 3,845.0
> High: 4,595.9
> Change: -12.2%

1958
> Start: 3,773.4
> End: 5,013.7
> High: 5,013.7
> Change: +32.9%

1959
> Start: 5,006.0
> End: 5,787.8
> High: 5,787.8
> Change: +15.6%
[in-text-ad]

1960
> Start: 5,695.4
> End: 5,165.6
> High: 5,749.2
> Change: -9.3%
1961
> Start: 5,067.0
> End: 6,070.7
> High: 6,102.0
> Change: +19.8%

1962
> Start: 5,949.7
> End: 5,353.6
> High: 5,960.4
> Change: -10.0%

1963
> Start: 5,247.6
> End: 6,190.0
> High: 6,224.6
> Change: +18.0%
1964
> Start: 6,133.3
> End: 6,998.4
> High: 7,139.1
> Change: +14.1%

1965
> Start: 6,846.6
> End: 7,629.7
> High: 7,629.7
> Change: +11.4%
[in-text-ad-2]

1966
> Start: 7,412.6
> End: 6,013.2
> High: 7,616.3
> Change: -18.9%

1967
> Start: 5,849.3
> End: 6,732.2
> High: 7,014.6
> Change: +15.1%

1968
> Start: 6,473.7
> End: 6,737.2
> High: 7,033.2
> Change: +4.1%
1969
> Start: 6,420.6
> End: 5,422.2
> High: 6,563.7
> Change: -15.5%
[in-text-ad]

1970
> Start: 5,175.8
> End: 5,365.9
> High: 5,385.6
> Change: +3.7%

1971
> Start: 5,093.5
> End: 5,459.2
> High: 5,830.9
> Change: +7.2%

1972
> Start: 5,279.0
> End: 6,055.0
> High: 6,151.5
> Change: +14.7%

1973
> Start: 5,766.0
> End: 4,755.4
> High: 5,877.9
> Change: -17.5%

1974
> Start: 4,307.4
> End: 3,103.4
> High: 4,490.5
> Change: -28.0%
1975
> Start: 2,916.4
> End: 3,933.2
> High: 4,068.9
> Change: +34.9%
[in-text-ad-2]
1976
> Start: 3,746.5
> End: 4,383.3
> High: 4,427.5
> Change: +17.0%

1977
> Start: 4,097.8
> End: 3,406.8
> High: 4,097.8
> Change: -16.9%

1978
> Start: 3,114.8
> End: 3,066.4
> High: 3,457.7
> Change: -1.6%

1979
> Start: 2,777.7
> End: 2,871.3
> High: 3,072.8
> Change: +3.4%
[in-text-ad]

1980
> Start: 2,486.6
> End: 2,907.1
> High: 3,016.2
> Change: +16.9%

1981
> Start: 2,657.7
> End: 2,390.6
> High: 2,797.8
> Change: -10.1%
1982
> Start: 2,272.0
> End: 2,694.2
> High: 2,756.0
> Change: +18.6%
1983
> Start: 2,561.7
> End: 3,139.4
> High: 3,210.6
> Change: +22.6%
1984
> Start: 2,995.4
> End: 2,896.9
> High: 3,076.4
> Change: -3.3%

1985
> Start: 2,768.0
> End: 3,571.0
> High: 3,585.8
> Change: +29.0%
[in-text-ad-2]

1986
> Start: 3,485.6
> End: 4,297.5
> High: 4,432.7
> Change: +23.3%

1987
> Start: 4,214.8
> End: 4,240.0
> High: 5,953.6
> Change: +0.6%

1988
> Start: 4,232.0
> End: 4,554.0
> High: 4,585.3
> Change: +7.6%
1989
> Start: 4,296.7
> End: 5,515.9
> High: 5,592.5
> Change: +28.4%
[in-text-ad]

1990
> Start: 5,341.4
> End: 5,005.9
> High: 5,701.8
> Change: -6.3%

1991
> Start: 4,761.8
> End: 5,780.0
> High: 5,780.0
> Change: +21.4%

1992
> Start: 5,617.4
> End: 5,845.3
> High: 6,043.7
> Change: +4.1%

1993
> Start: 5,689.3
> End: 6,454.2
> High: 6,523.3
> Change: +13.4%

1994
> Start: 6,297.2
> End: 6,427.7
> High: 6,669.0
> Change: +2.1%

1995
> Start: 6,257.2
> End: 8,341.5
> High: 8,503.4
> Change: +33.3%
[in-text-ad-2]
1996
> Start: 8,197.8
> End: 10,209.9
> High: 10,388.3
> Change: +24.5%
1997
> Start: 9,972.0
> End: 12,240.8
> High: 12,784.1
> Change: +22.8%

1998
> Start: 12,139.5
> End: 13,993.5
> High: 14,287.4
> Change: +15.3%

1999
> Start: 13,695.3
> End: 17,144.2
> High: 17,144.2
> Change: +25.2%
[in-text-ad]

2000
> Start: 16,385.2
> End: 15,563.6
> High: 16,912.5
> Change: -5.0%

2001
> Start: 14,934.0
> End: 14,057.9
> High: 15,904.4
> Change: -5.9%
2002
> Start: 13,910.6
> End: 11,519.2
> High: 14,686.5
> Change: -17.2%

2003
> Start: 11,621.5
> End: 14,114.4
> High: 14,114.4
> Change: +21.5%

2004
> Start: 13,690.4
> End: 14,181.1
> High: 14,275.2
> Change: +3.6%
2005
> Start: 13,648.2
> End: 13,633.1
> High: 13,916.8
> Change: -0.1%
[in-text-ad-2]

2006
> Start: 13,367.1
> End: 15,358.2
> High: 15,416.6
> Change: +14.9%

2007
> Start: 14,946.6
> End: 15,893.5
> High: 16,971.5
> Change: +6.3%

2008
> Start: 15,051.1
> End: 10,126.8
> High: 15,067.5
> Change: -32.7%
2009
> Start: 10,461.8
> End: 12,075.3
> High: 12,214.8
> Change: +15.4%
[in-text-ad]

2010
> Start: 12,058.0
> End: 13,189.9
> High: 13,198.9
> Change: +9.4%

2011
> Start: 12,889.4
> End: 13,493.4
> High: 14,148.3
> Change: +4.7%

2012
> Start: 13,414.6
> End: 14,179.4
> High: 14,726.9
> Change: +5.7%

2013
> Start: 14,303.2
> End: 17,677.4
> High: 17,677.4
> Change: +23.6%

2014
> Start: 17,253.1
> End: 18,703.1
> High: 18,945.1
> Change: +8.4%

2015
> Start: 18,691.4
> End: 18,263.8
> High: 19,193.9
> Change: -2.3%
[in-text-ad-2]

2016
> Start: 17,750.5
> End: 20,455.8
> High: 20,675.3
> Change: +15.2%

2017
> Start: 20,150.2
> End: 25,052.9
> High: 25,172.8
> Change: +24.3%

2018
> Start: 24,824.0
> End: 23,327.5
> High: 26,828.4
> Change: -6.0%
Take This Retirement Quiz To Get Matched With An Advisor Now (Sponsored)
Are you ready for retirement? Planning for retirement can be overwhelming, that’s why it could be a good idea to speak to a fiduciary financial advisor about your goals today.
Start by taking this retirement quiz right here from SmartAsset that will match you with up to 3 financial advisors that serve your area and beyond in 5 minutes. Smart Asset is now matching over 50,000 people a month.
Click here now to get started.
Thank you for reading! Have some feedback for us?
Contact the 24/7 Wall St. editorial team.
 24/7 Wall St.
 24/7 Wall St.
 24/7 Wall St.
