America’s Fastest Growing Cities
March 14, 2019 by Sam StebbinsThe U.S. population grew by just 0.6% from 2017 to 2018, the lowest annual growth rate in 80 years. While population growth is slowing at an alarming rate nationwide, some U.S. cities are bucking the trend, reporting booming population growth in recent years.
Population change is the product of two factors — net migration and natural growth. Natural growth is simply the number of births over a given period less the number of deaths. Net migration is the difference between the number of new residents — either from other parts of the country or from abroad — and the number of residents who have left the area
24/7 Wall St. reviewed the percentage change in the populations of 382 U.S. metro areas between 2010 and 2017 to identify the fastest growing American cities. Over that period, some cities’ populations expanded by well over 20%.
The cities on this list tend to be concentrated in the Southeastern United States. A few of these fastest growing cities are also in Western states that, as a whole, are growing far more rapidly than much of the rest of the country.
Click here to see the fastest growing cities.
Methodology
To identify America’s 25 fastest growing cities, 24/7 Wall St. reviewed population percentage changes in U.S. metropolitan statistical areas from July 2012 to July 2017 from the U.S. Census Bureau. Median household income figures for each city are for 2017 and came from the U.S. Census Bureau’s American Community Survey. We also looked at the seasonally adjusted December 2018 unemployment rate from the Bureau of Labor Statistics. Data on the population change due to migration and natural growth from April 2010 to July 2017 came from the U.S. Census Bureau’s American Community Survey.

25. Odessa, TX
> 2010-2017 population change: +14.6% (from 137,079 to 157,087)
> 2010-2017 pop. change due to migration: +7,828
> Largest 12 month change: +5,269 (2014-2015)
> Median household income: $53,254
[in-text-ad]

24. Bismarck, ND
> 2010-2017 population change: +14.7% (from 115,253 to 132,142)
> 2010-2017 pop. change due to migration: +11,244
> Largest 12 month change: +3,652 (2012-2013)
> Median household income: $65,527

23. Hilton Head Island-Bluffton-Beaufort, SC
> 2010-2017 population change: +14.7% (from 187,776 to 215,302)
> 2010-2017 pop. change due to migration: +22,932
> Largest 12 month change: +5,506 (2014-2015)
> Median household income: $63,756

22. Dallas-Fort Worth-Arlington, TX
> 2010-2017 population change: +14.7% (from 6,451,833 to 7,399,662)
> 2010-2017 pop. change due to migration: +555,586
> Largest 12 month change: +152,393 (2015-2016)
> Median household income: $63,812
[in-text-ad-2]

21. Auburn-Opelika, AL
> 2010-2017 population change: +14.8% (from 140,806 to 161,604)
> 2010-2017 pop. change due to migration: +15,188
> Largest 12 month change: +4,201 (2011-2012)
> Median household income: $48,056

20. Boise City, ID
> 2010-2017 population change: +14.9% (from 617,980 to 709,845)
> 2010-2017 pop. change due to migration: +62,059
> Largest 12 month change: +19,035 (2016-2017)
> Median household income: $55,162
[in-text-ad]

19. San Antonio-New Braunfels, TX
> 2010-2017 population change: +14.9% (from 2,152,961 to 2,473,974)
> 2010-2017 pop. change due to migration: +210,637
> Largest 12 month change: +50,635 (2014-2015)
> Median household income: $56,105

18. Crestview-Fort Walton Beach-Destin, FL
> 2010-2017 population change: +15.0% (from 235,927 to 271,346)
> 2010-2017 pop. change due to migration: +26,348
> Largest 12 month change: +8,304 (2011-2012)
> Median household income: $58,624

17. Fargo, ND-MN
> 2010-2017 population change: +15.3% (from 209,350 to 241,356)
> 2010-2017 pop. change due to migration: +18,997
> Largest 12 month change: +6,505 (2012-2013)
> Median household income: $60,009
[in-text-ad-2]

16. Fayetteville-Springdale-Rogers, AR-MO
> 2010-2017 population change: +15.5% (from 465,290 to 537,463)
> 2010-2017 pop. change due to migration: +47,115
> Largest 12 month change: +12,287 (2016-2017)
> Median household income: $51,848

15. Naples-Immokalee-Marco Island, FL
> 2010-2017 population change: +15.6% (from 322,601 to 372,880)
> 2010-2017 pop. change due to migration: +50,154
> Largest 12 month change: +8,978 (2014-2015)
> Median household income: $61,228
[in-text-ad]

14. Houston-The Woodlands-Sugar Land, TX
> 2010-2017 population change: +15.9% (from 5,947,419 to 6,892,427)
> 2010-2017 pop. change due to migration: +533,390
> Largest 12 month change: +167,325 (2014-2015)
> Median household income: $61,708

13. Daphne-Fairhope-Foley, AL
> 2010-2017 population change: +16.1% (from 183,110 to 212,628)
> 2010-2017 pop. change due to migration: +28,263
> Largest 12 month change: +5,119 (2016-2017)
> Median household income: $56,732

12. Charleston-North Charleston, SC
> 2010-2017 population change: +16.2% (from 667,466 to 775,831)
> 2010-2017 pop. change due to migration: +81,055
> Largest 12 month change: +18,291 (2014-2015)
> Median household income: $57,659
[in-text-ad-2]

11. Provo-Orem, UT
> 2010-2017 population change: +16.5% (from 530,238 to 617,675)
> 2010-2017 pop. change due to migration: +18,739
> Largest 12 month change: +17,895 (2015-2016)
> Median household income: $69,288

10. Orlando-Kissimmee-Sanford, FL
> 2010-2017 population change: +17.3% (from 2,139,317 to 2,509,831)
> 2010-2017 pop. change due to migration: +291,358
> Largest 12 month change: +63,099 (2014-2015)
> Median household income: $52,385
[in-text-ad]

9. Raleigh, NC
> 2010-2017 population change: +17.4% (from 1,137,393 to 1,335,079)
> 2010-2017 pop. change due to migration: +139,611
> Largest 12 month change: +32,021 (2015-2016)
> Median household income: $71,685

8. Bend-Redmond, OR
> 2010-2017 population change: +18.5% (from 157,740 to 186,875)
> 2010-2017 pop. change due to migration: +26,052
> Largest 12 month change: +6,387 (2015-2016)
> Median household income: $61,870
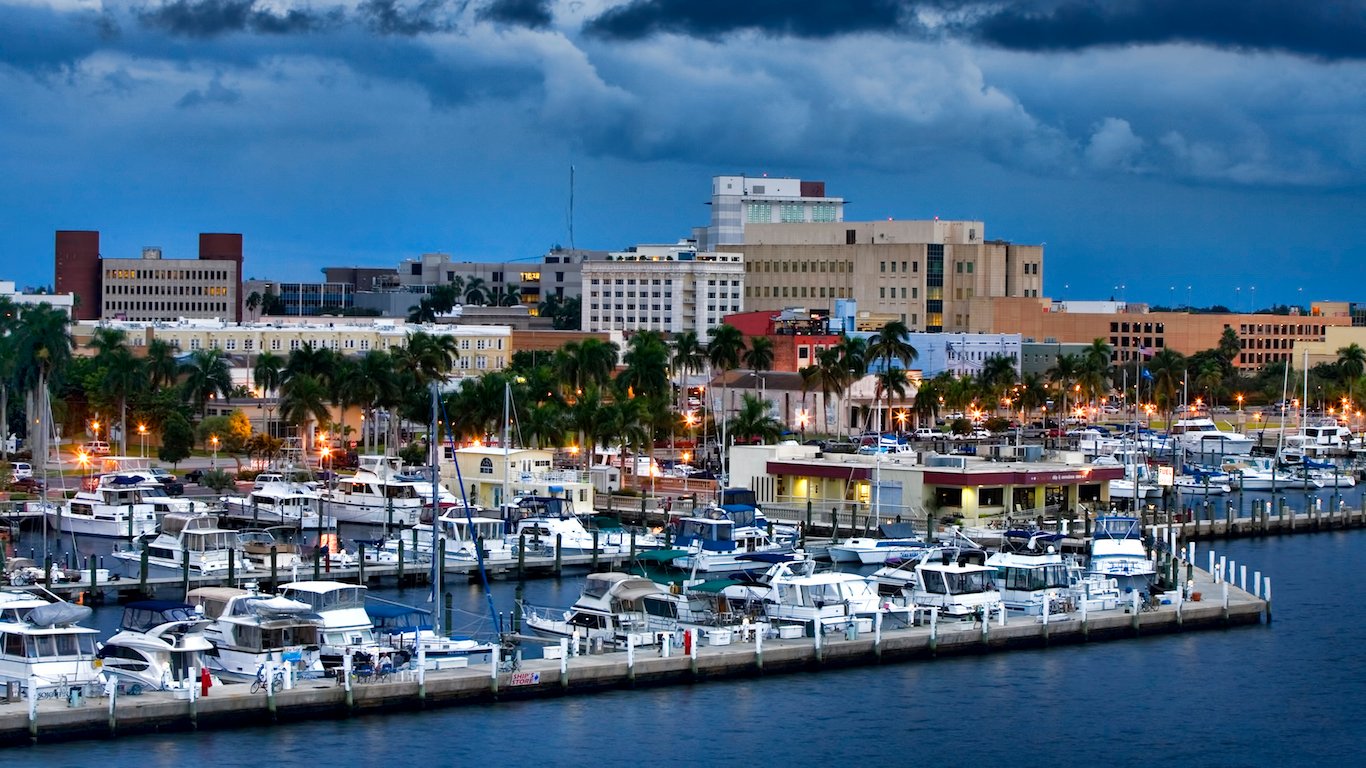
7. Cape Coral-Fort Myers, FL
> 2010-2017 population change: +19.1% (from 620,467 to 739,224)
> 2010-2017 pop. change due to migration: +119,306
> Largest 12 month change: +22,180 (2014-2015)
> Median household income: $52,909
[in-text-ad-2]

6. St. George, UT
> 2010-2017 population change: +19.7% (from 138,393 to 165,662)
> 2010-2017 pop. change due to migration: +19,813
> Largest 12 month change: +6,425 (2016-2017)
> Median household income: $55,056

5. Greeley, CO
> 2010-2017 population change: +19.8% (from 254,182 to 304,633)
> 2010-2017 pop. change due to migration: +33,972
> Largest 12 month change: +10,390 (2016-2017)
> Median household income: $63,400
[in-text-ad]

4. Midland, TX
> 2010-2017 population change: +20.4% (from 141,788 to 170,675)
> 2010-2017 pop. change due to migration: +16,322
> Largest 12 month change: +7,190 (2011-2012)
> Median household income: $65,224
 24/7 Wall St.
3. Austin-Round Rock, TX
> 2010-2017 population change: +22.5% (from 1,727,495 to 2,115,827)
> 2010-2017 pop. change due to migration: +273,662
> Largest 12 month change: +59,774 (2015-2016)
> Median household income: $71,000

2. Myrtle Beach-Conway-North Myrtle Beach, SC-NC
> 2010-2017 population change: +22.6% (from 378,506 to 464,165)
> 2010-2017 pop. change due to migration: +87,194
> Largest 12 month change: +16,372 (2016-2017)
> Median household income: $46,787
[in-text-ad-2]
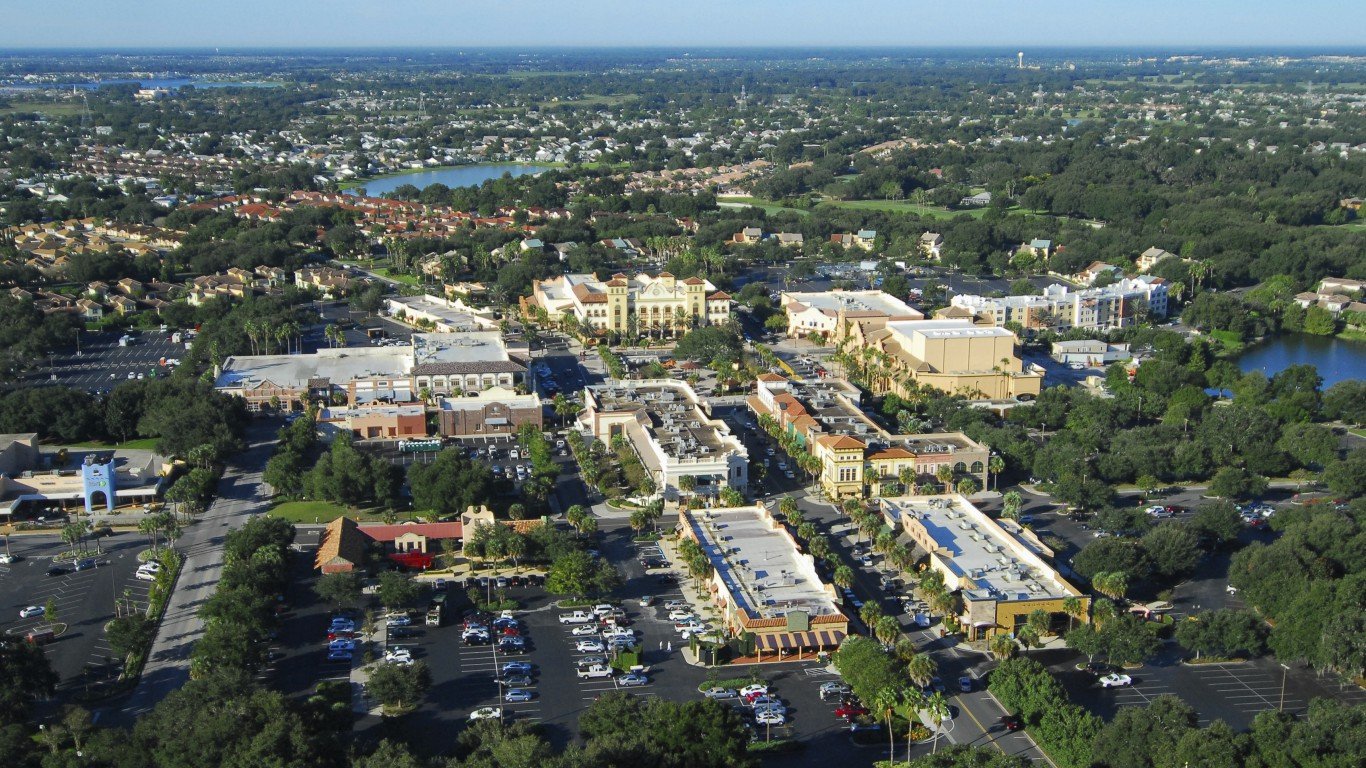
1. The Villages, FL
> 2010-2017 population change: +32.8% (from 94,279 to 125,165)
> 2010-2017 pop. change due to migration: +38,549
> Largest 12 month change: +5,392 (2013-2014)
> Median household income: $54,562
Sponsored: Attention Savvy Investors: Speak to 3 Financial Experts – FREE
Ever wanted an extra set of eyes on an investment you’re considering? Now you can speak with up to 3 financial experts in your area for FREE. By simply
clicking here you can begin to match with financial professionals who can help guide you through the financial decisions you’re making. And the best part? The first conversation with them is free.
Click here to match with up to 3 financial pros who would be excited to help you make financial decisions.