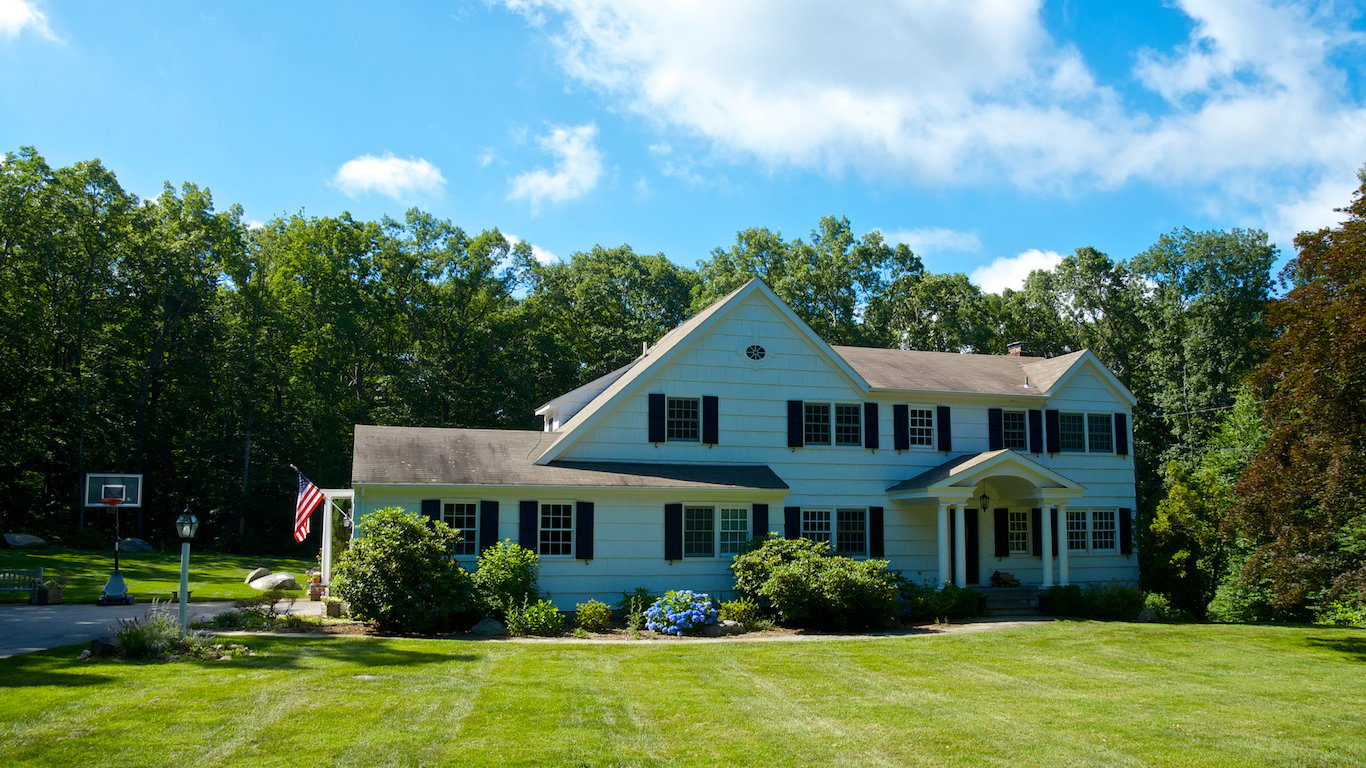
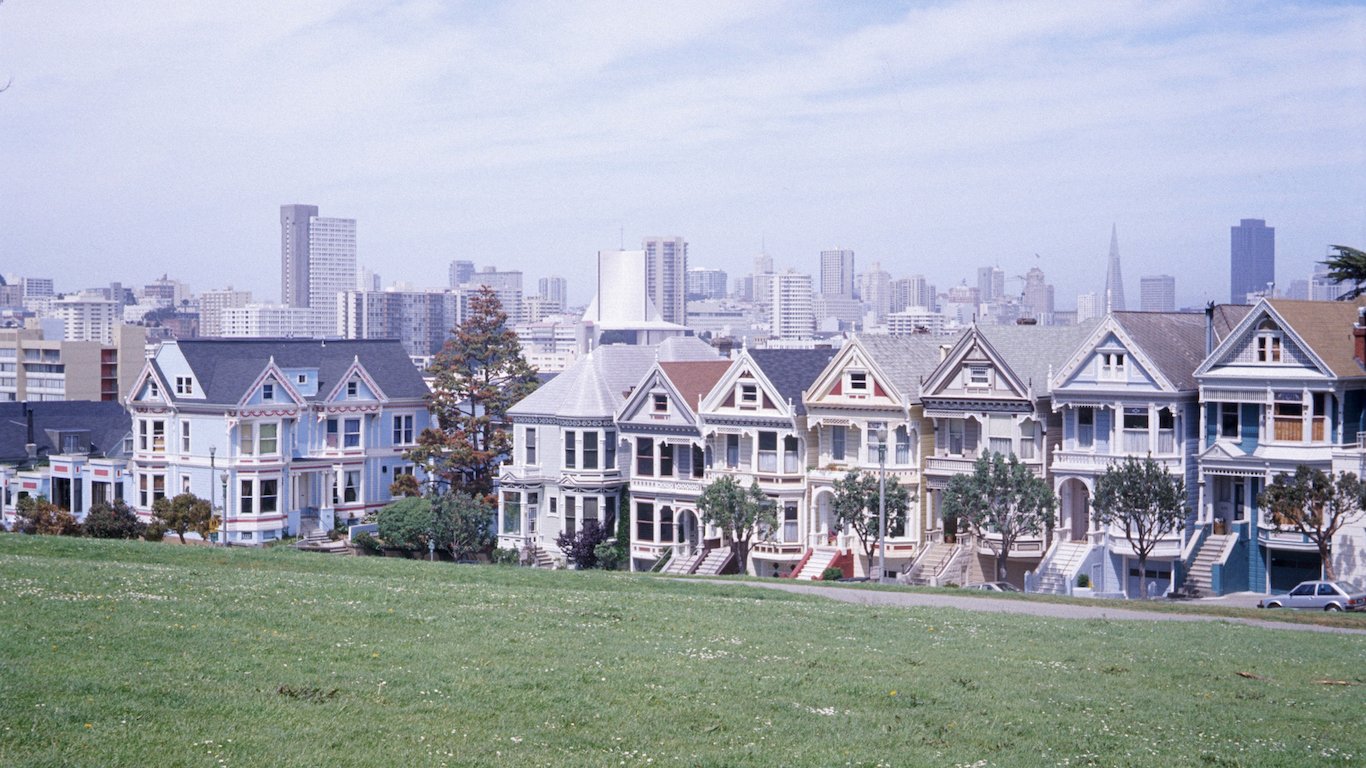
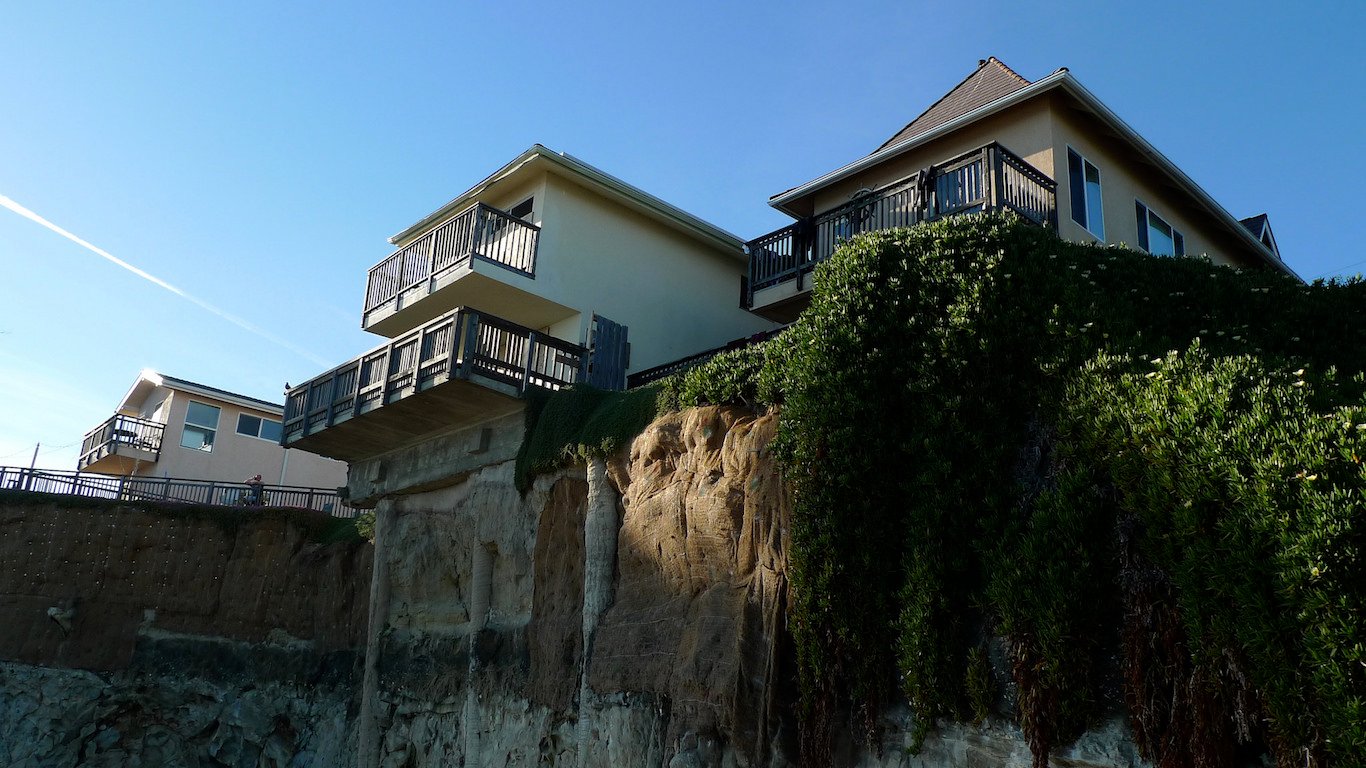
While the U.S. housing market has largely recovered from the effects of the subprime mortgage crisis, homes are being built at barely half the rate they were in the early 2000s. The history of the U.S. housing market has been one marked by periods of rampant building and of lulls, even as the population has expanded relatively steadily.
U.S. housing starts in February 2019 clocked in at a seasonally-adjusted annual rate of 1.2 million. The rate is less than half the 2.5 million housing starts in 1974 — a time when there were 100 million fewer people living in the country.
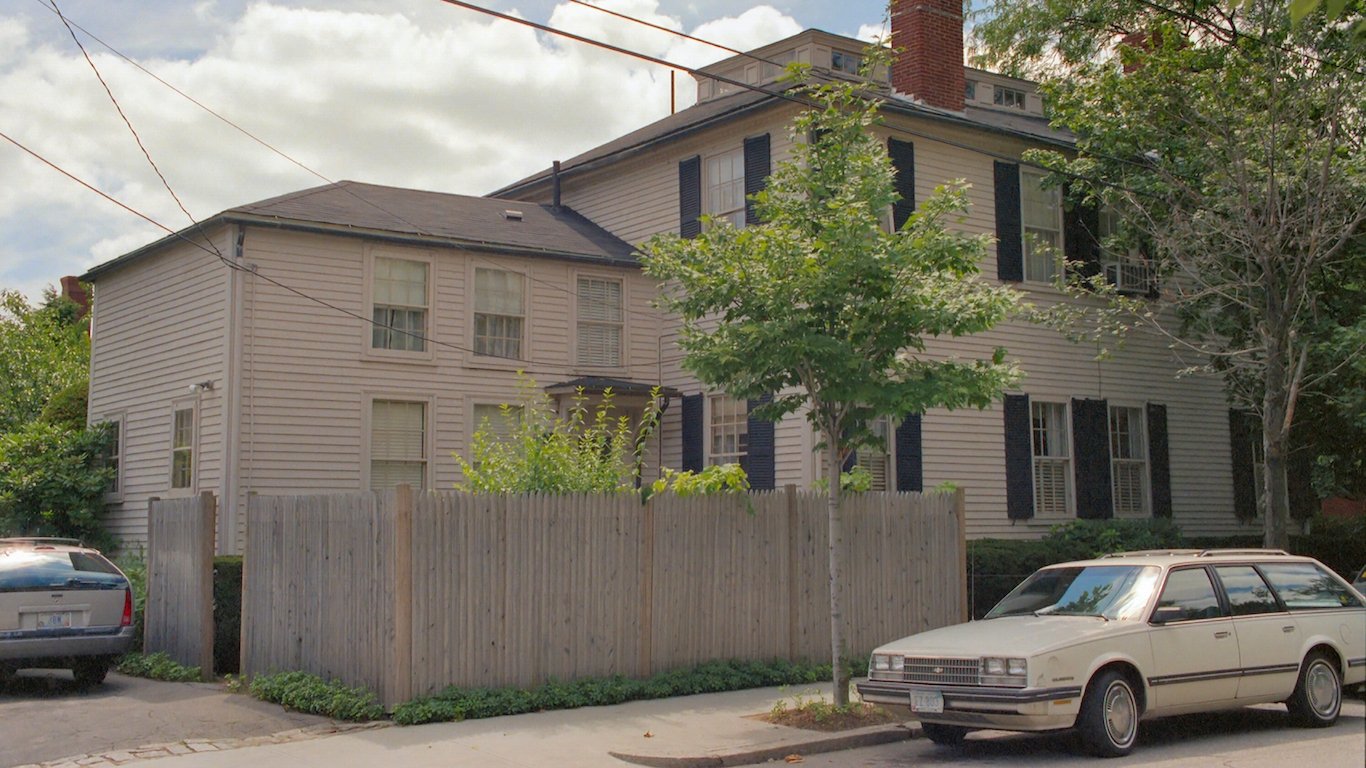
The American housing market has not only been through substantial fluctuations in the number of housing units built, but also by changes in the size of homes. Changing family size, rising incomes, and suburban expansion have all led to changes in the size of the typical single-family home.
To determine how the size of homes has changed over the past century, 24/7 Wall St. determined the size of a newly constructed single-family house between 1920 and 2017 by reviewing official U.S. Census figures and providing our own estimates for years the Census did not release numbers.
Click here to see the size of a home the year you were born.
Click here to see our detailed findings and methodology.

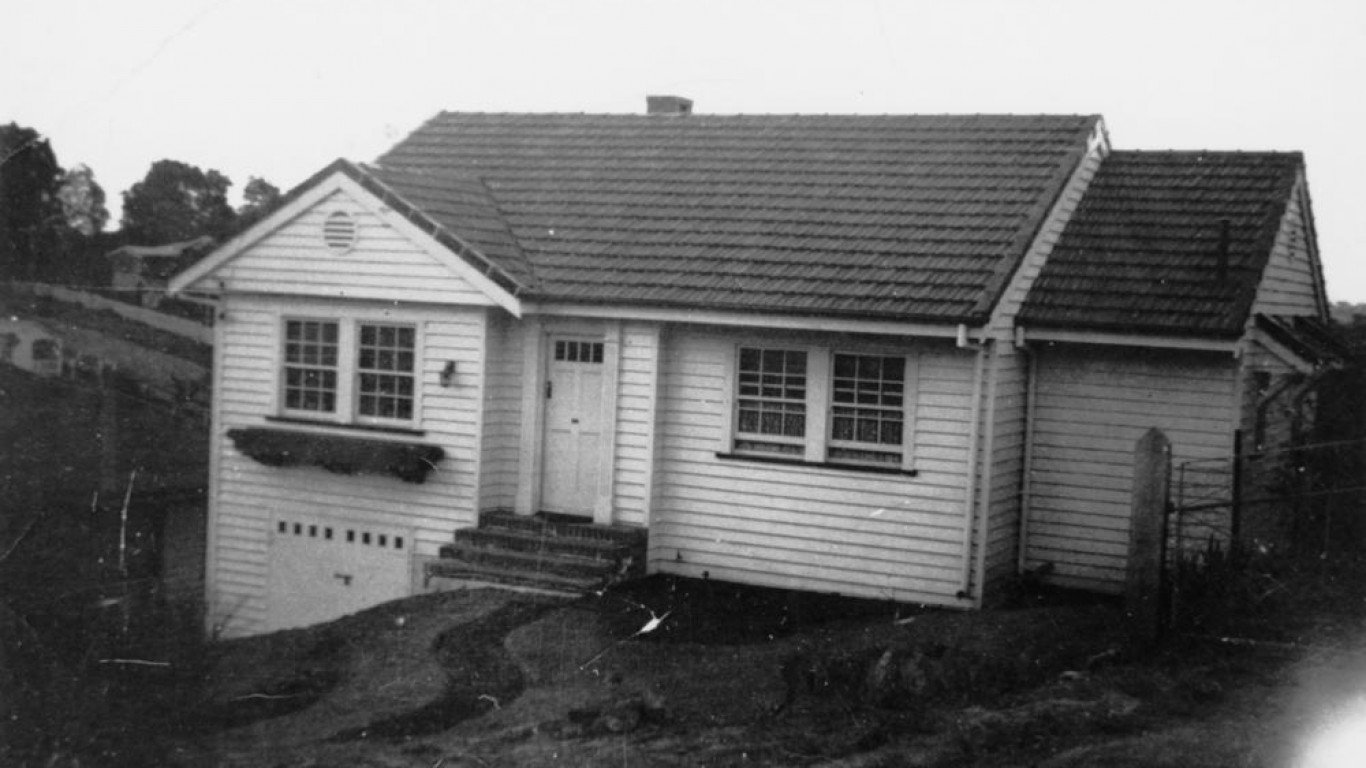
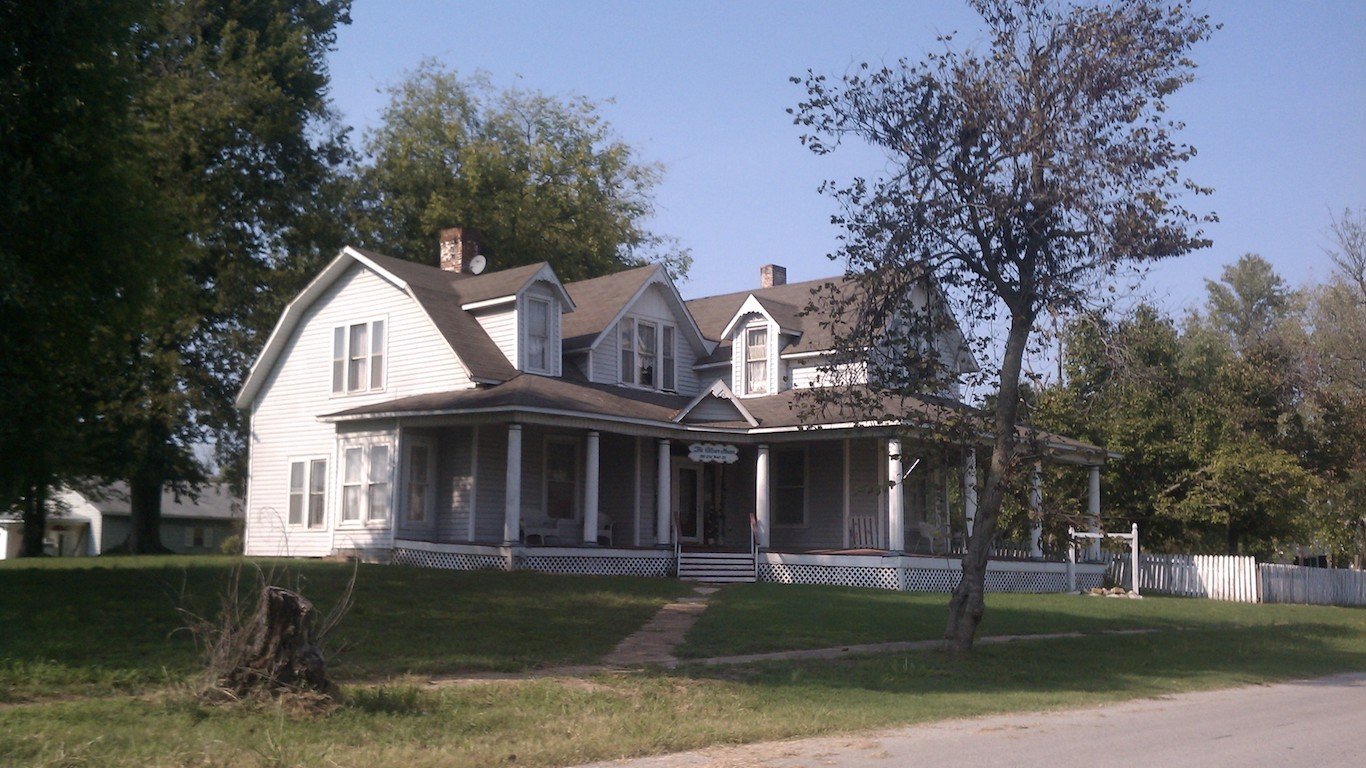
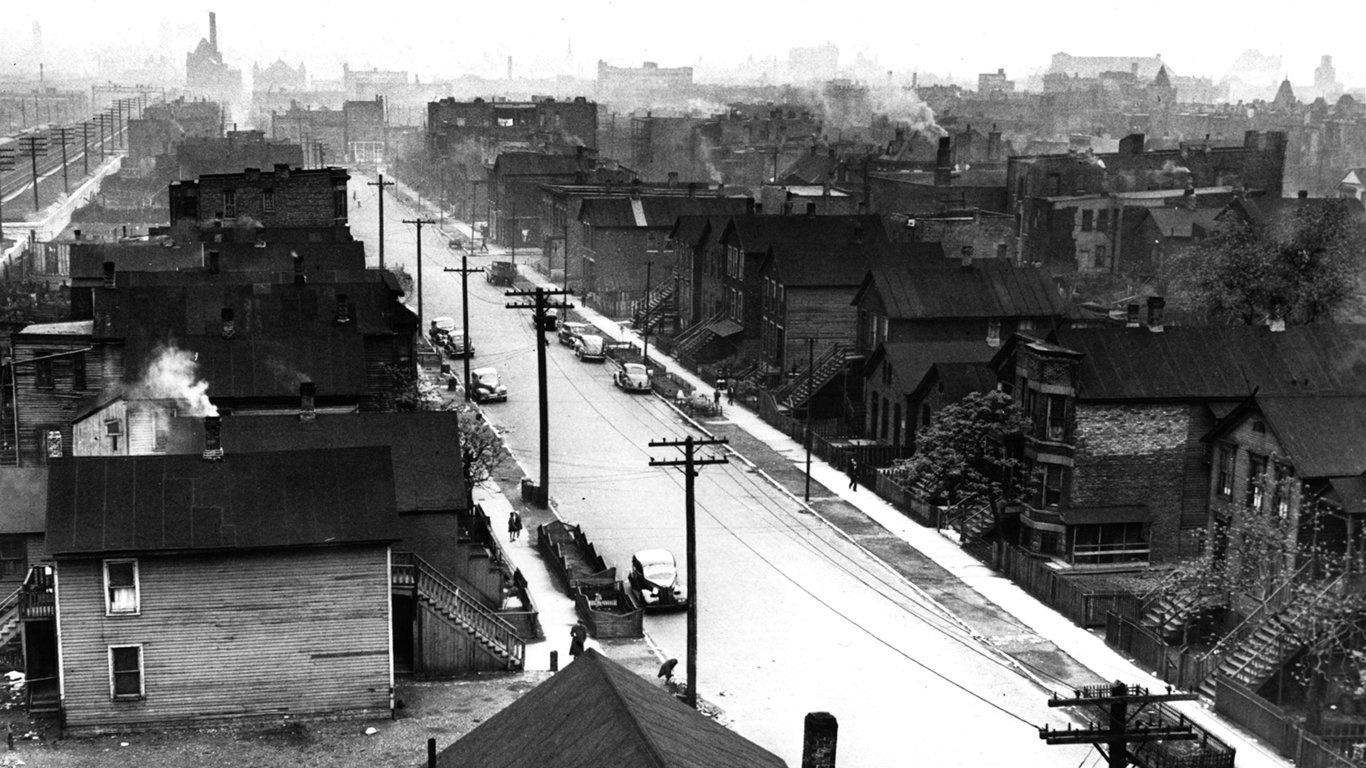
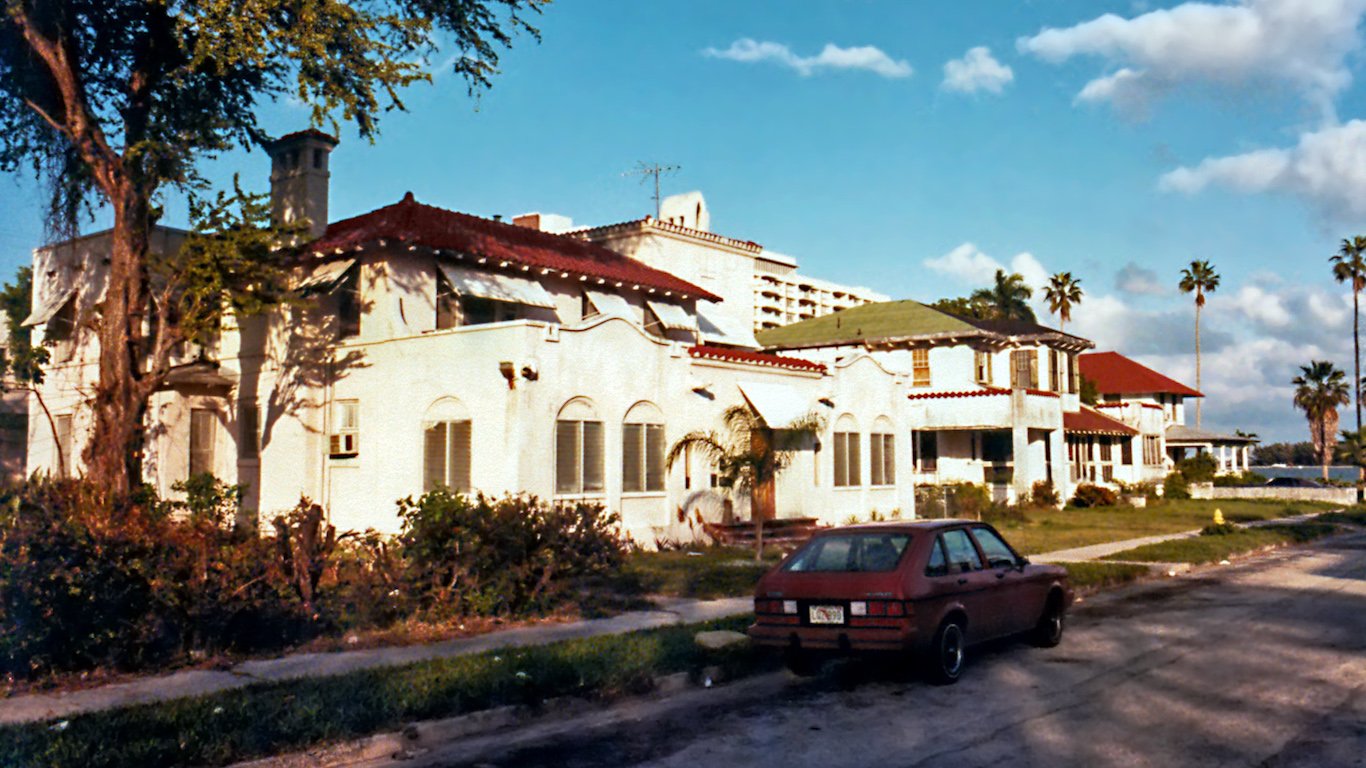
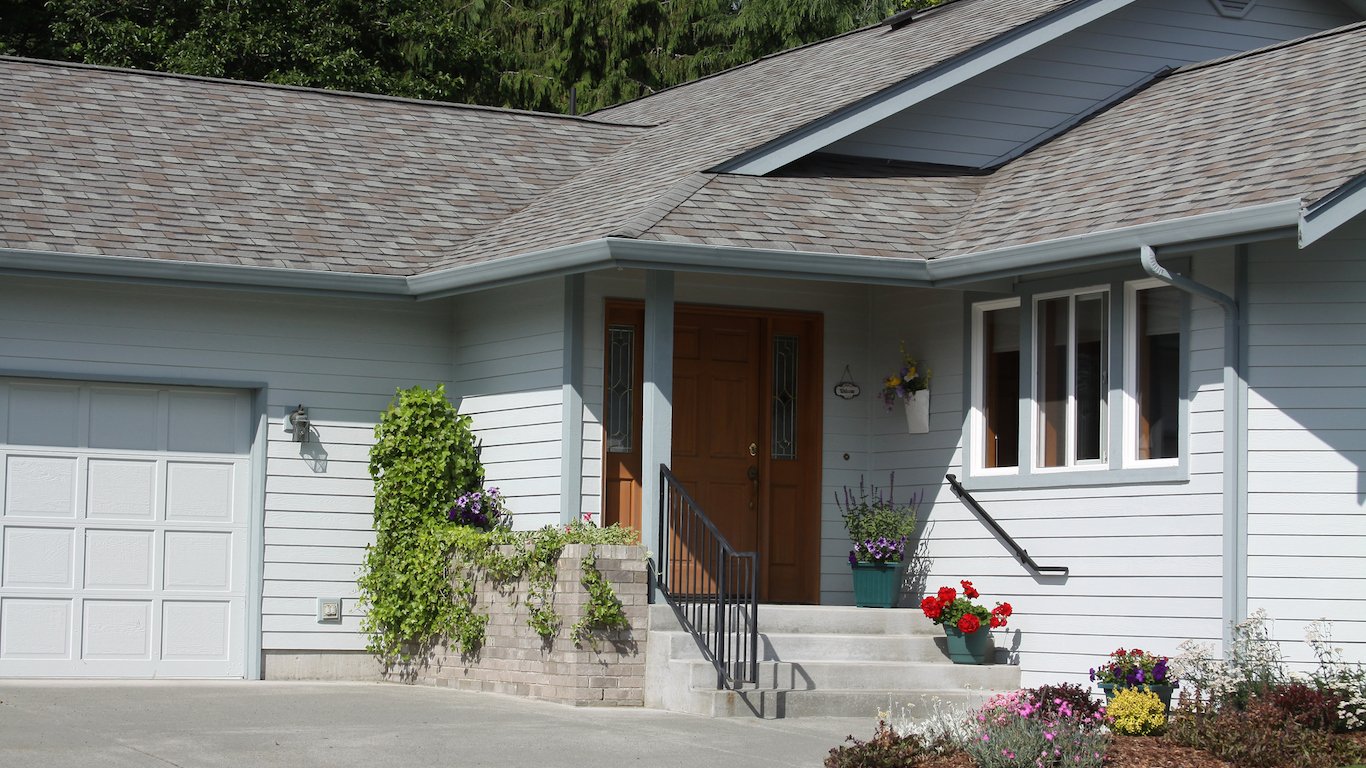
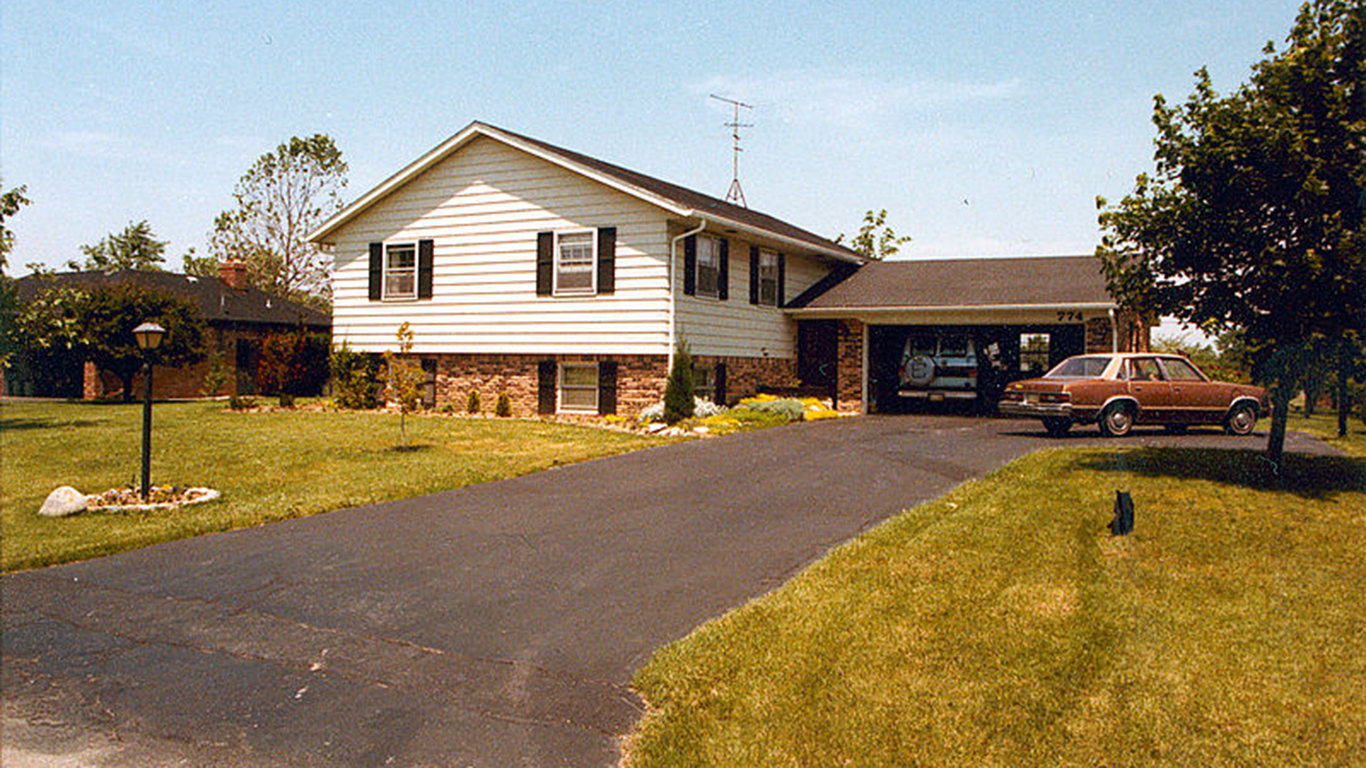
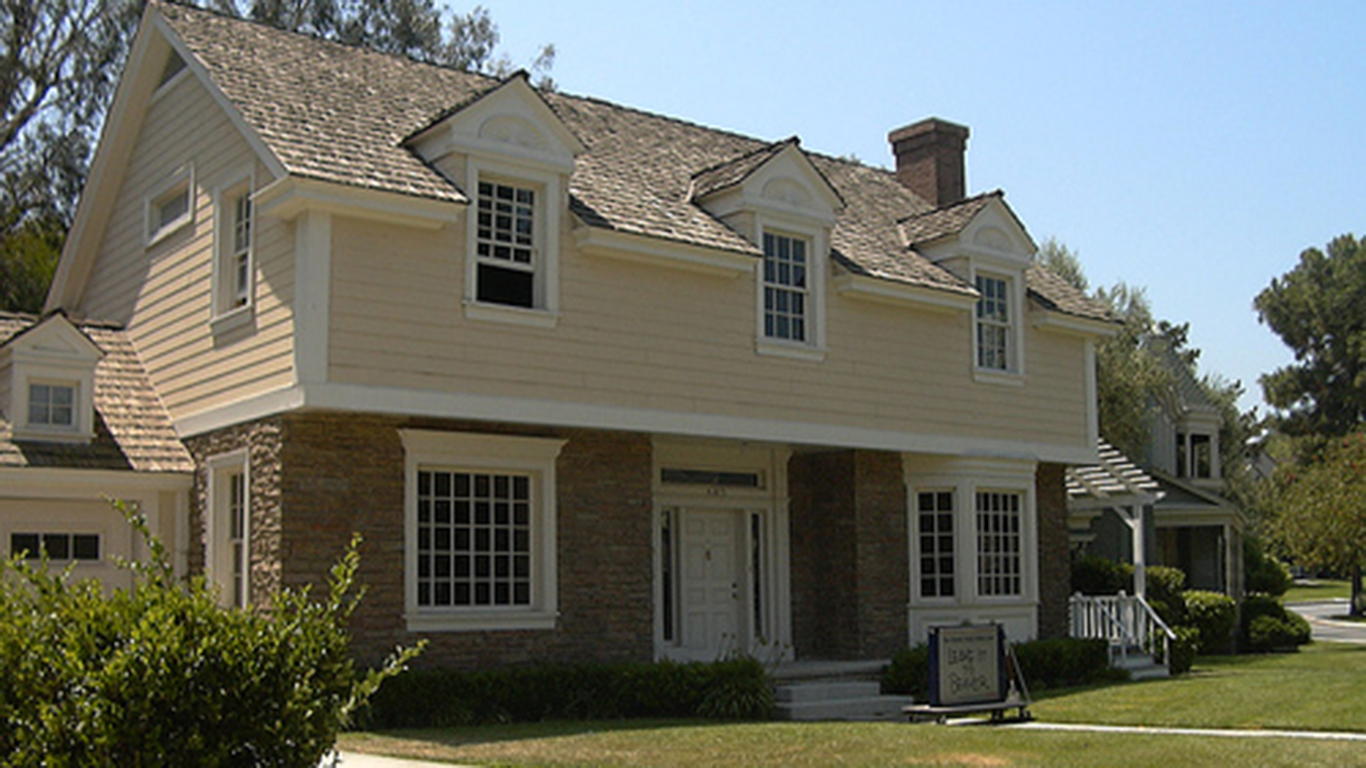
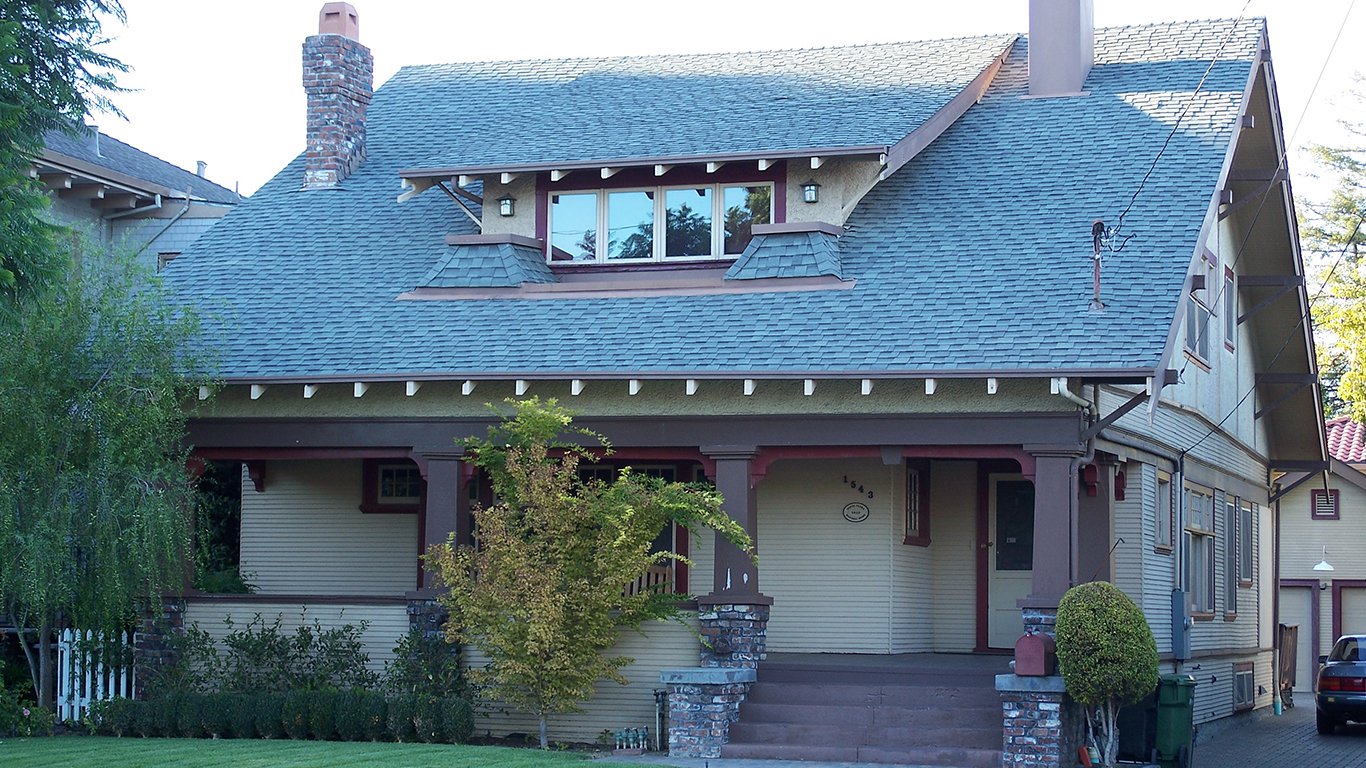
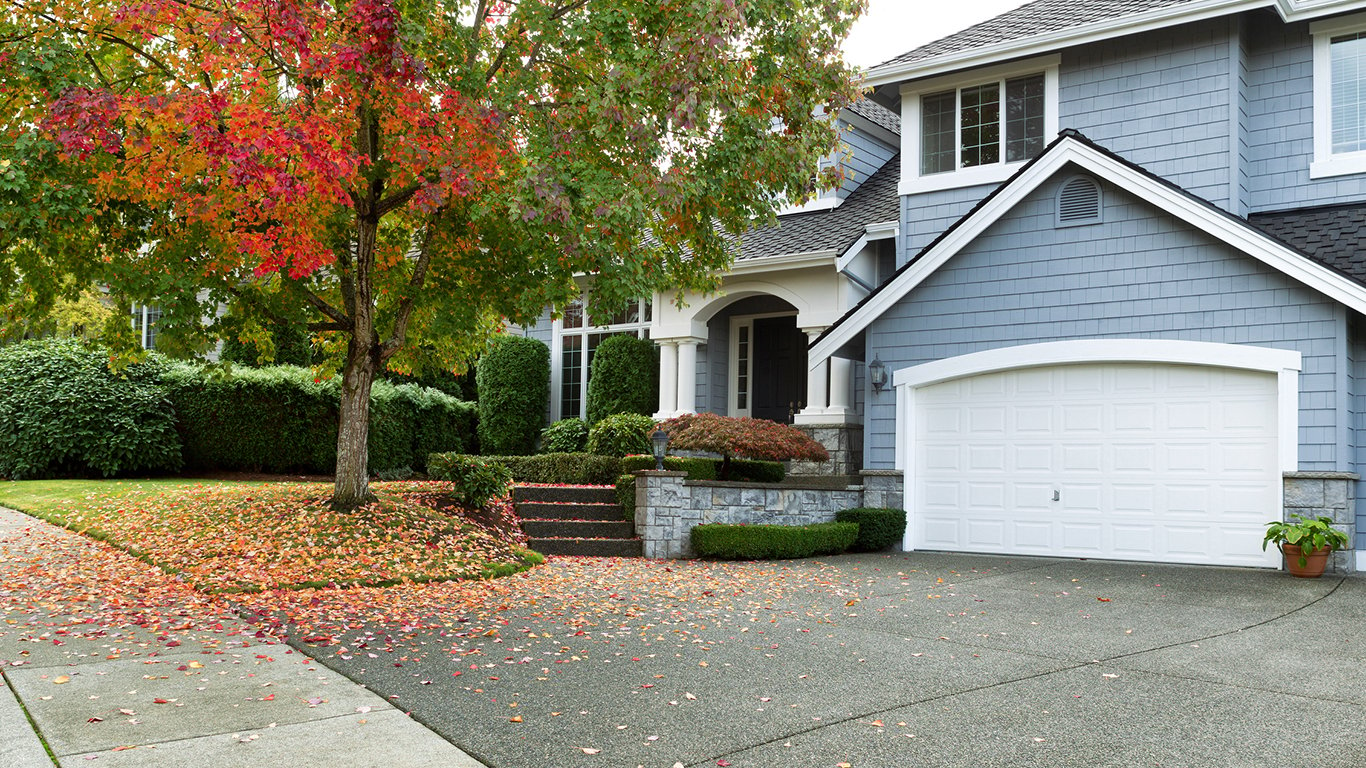
Source: Jerrye
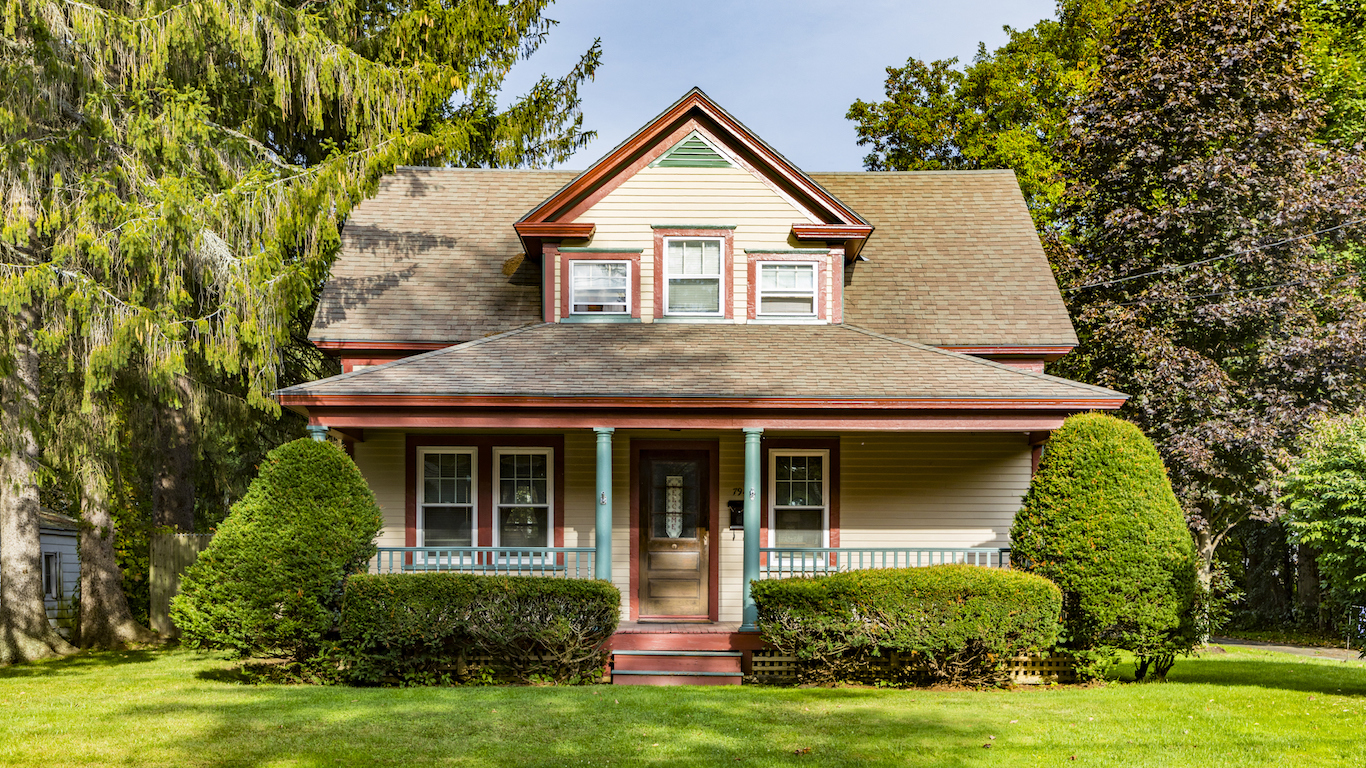
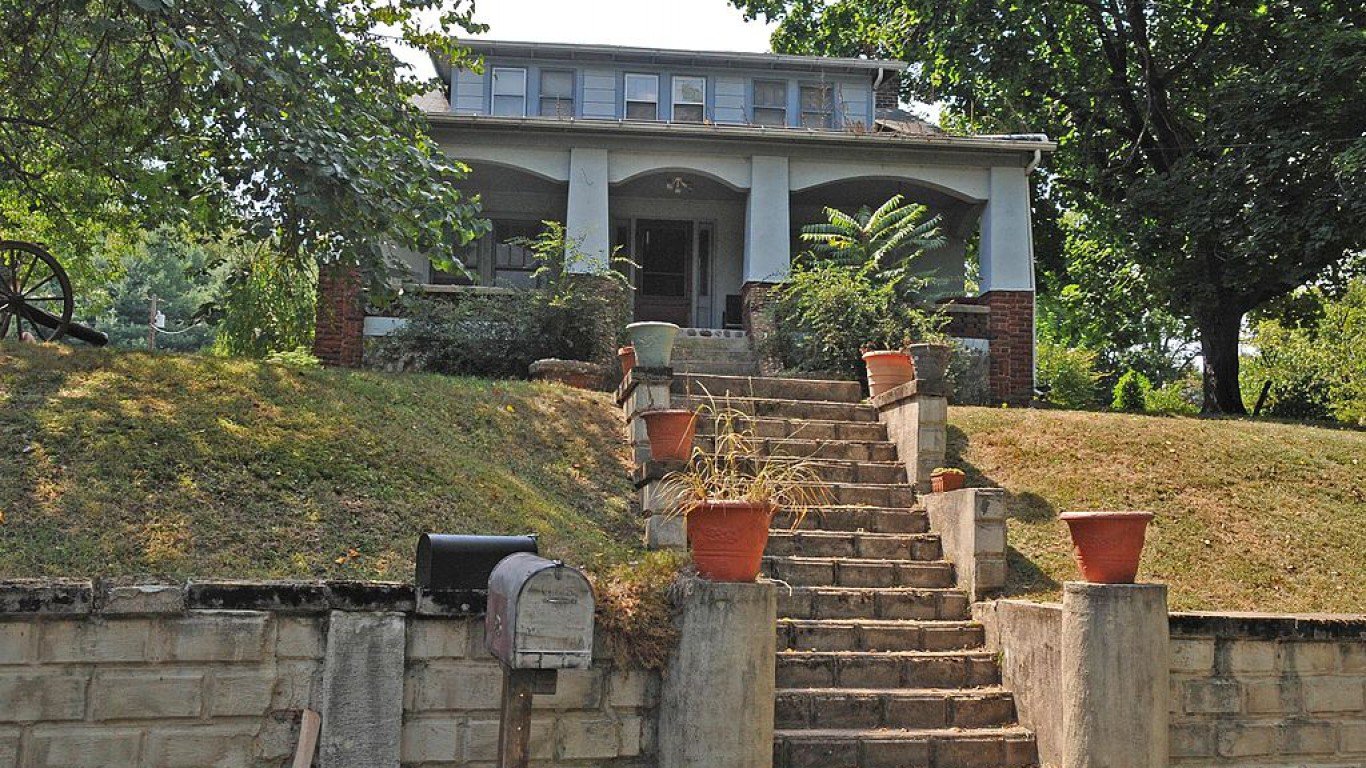
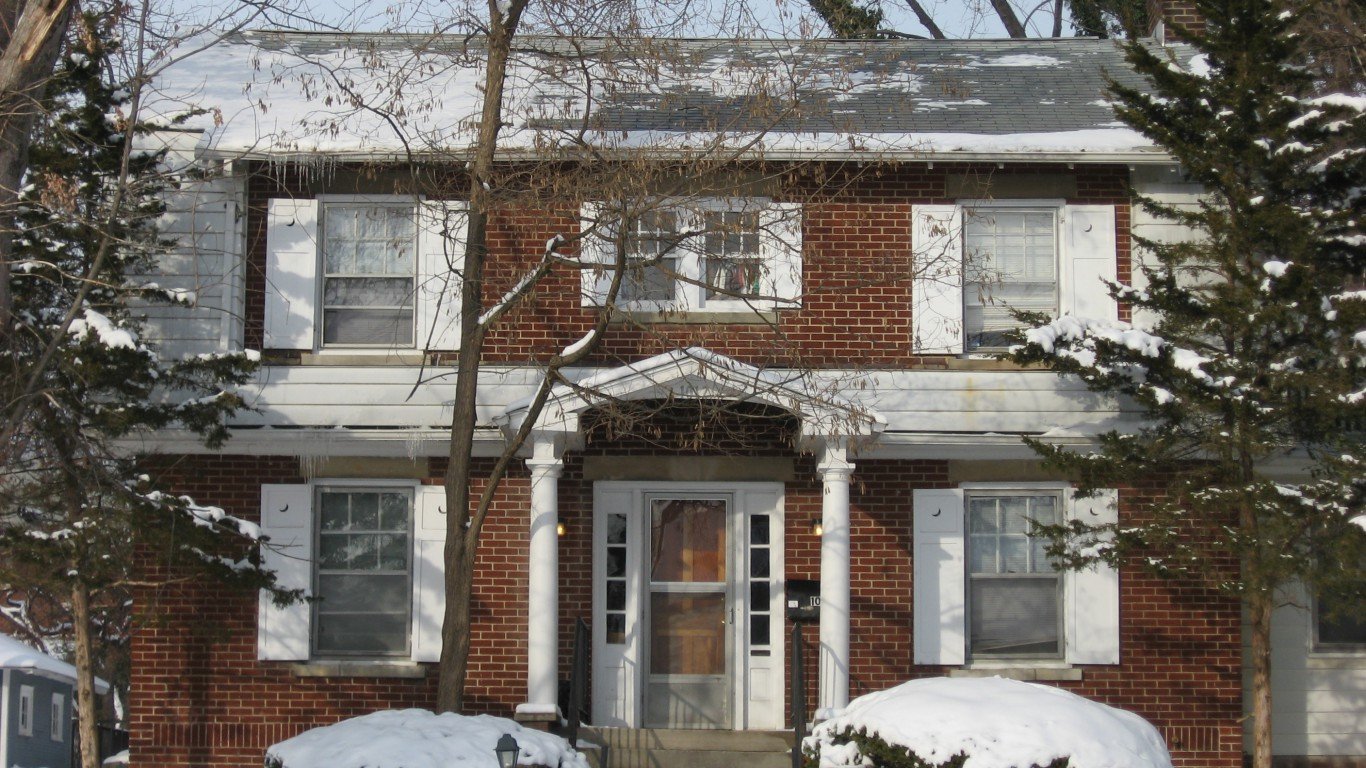
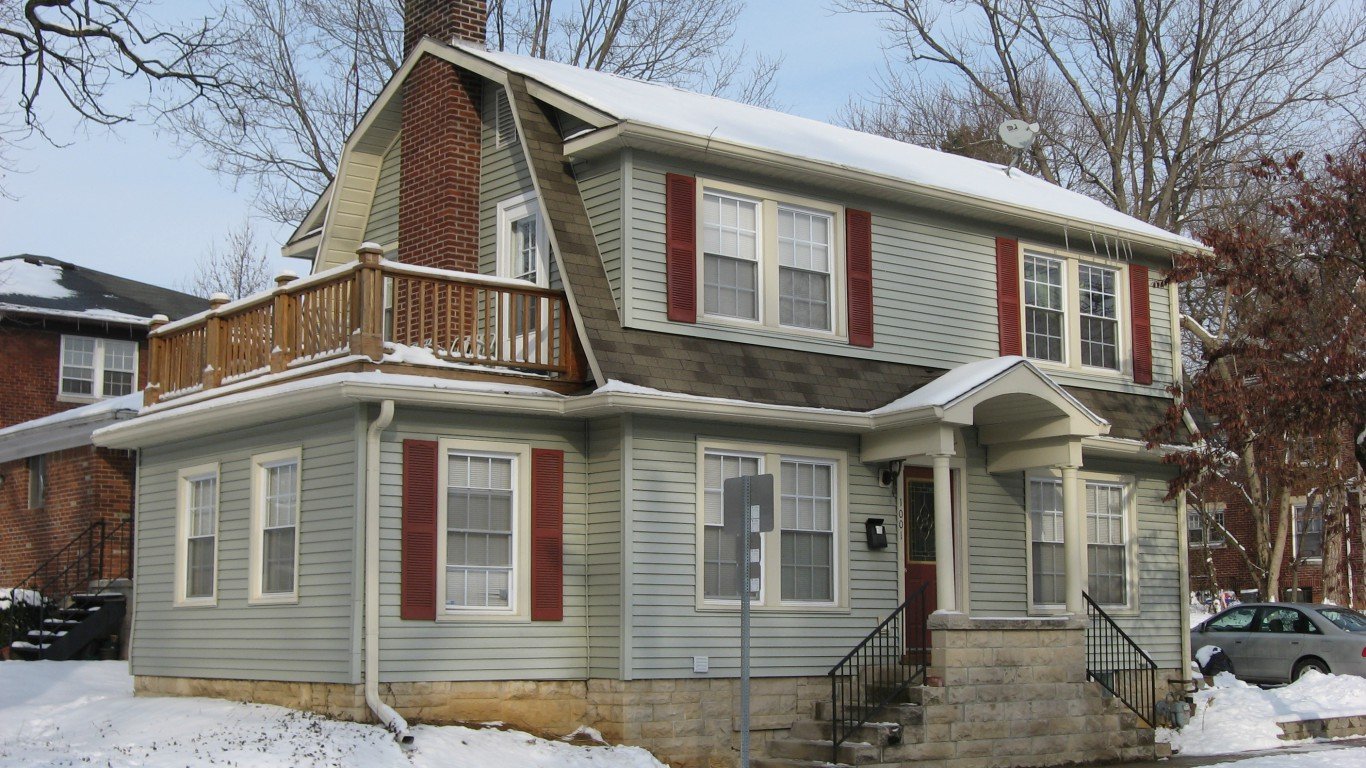
1920
Avg. floor area of a new single-family home: 1,048 sq. ft.
Avg. floor area per person: 242 sq. ft.
New homes started: 247,000
GDP per capita (inflation adjusted): $10,164
[in-text-ad]
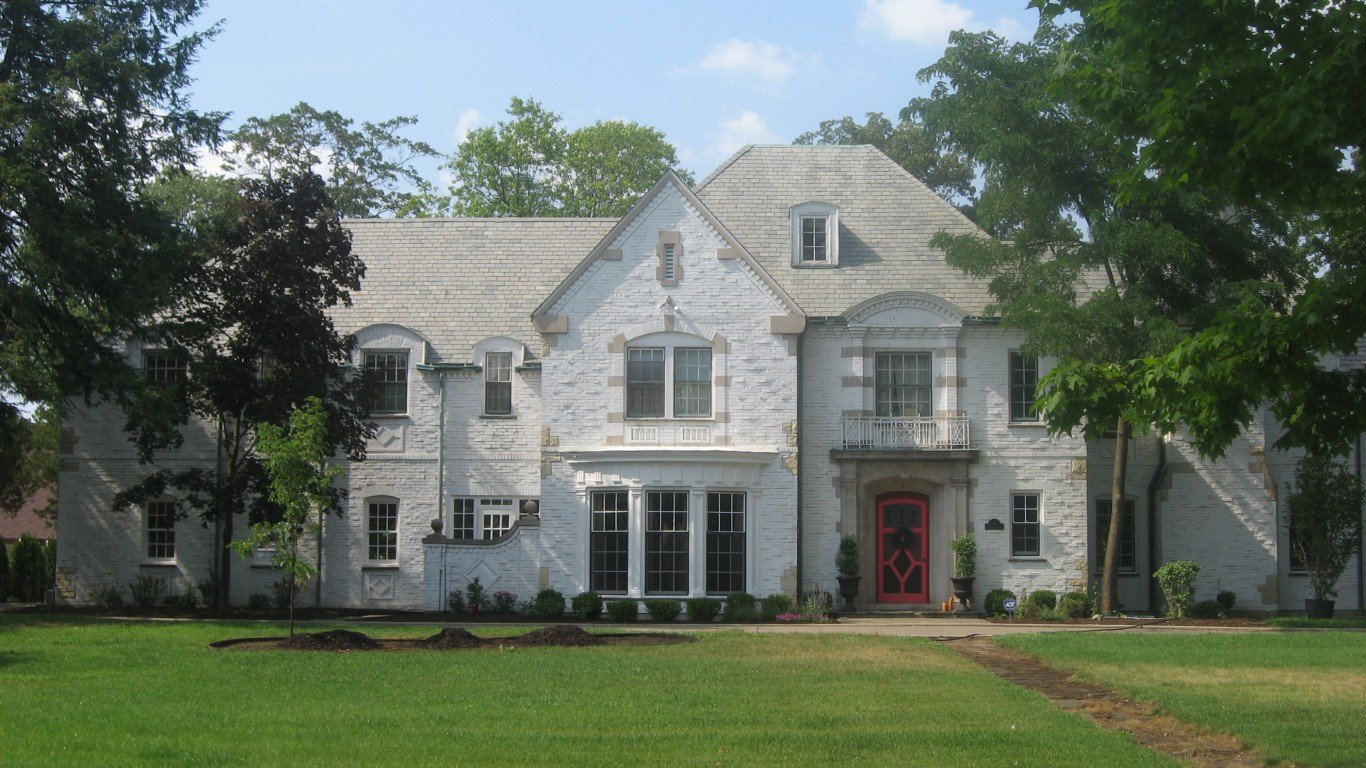
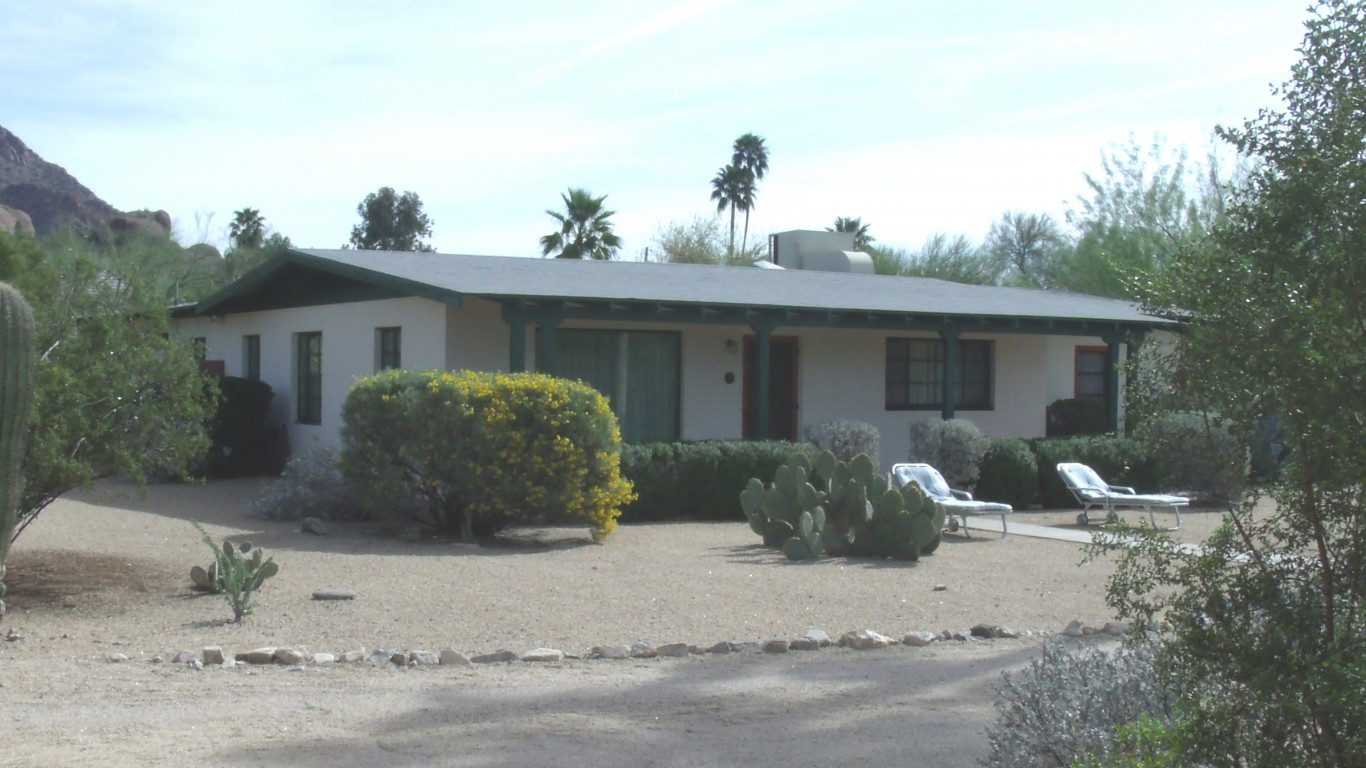
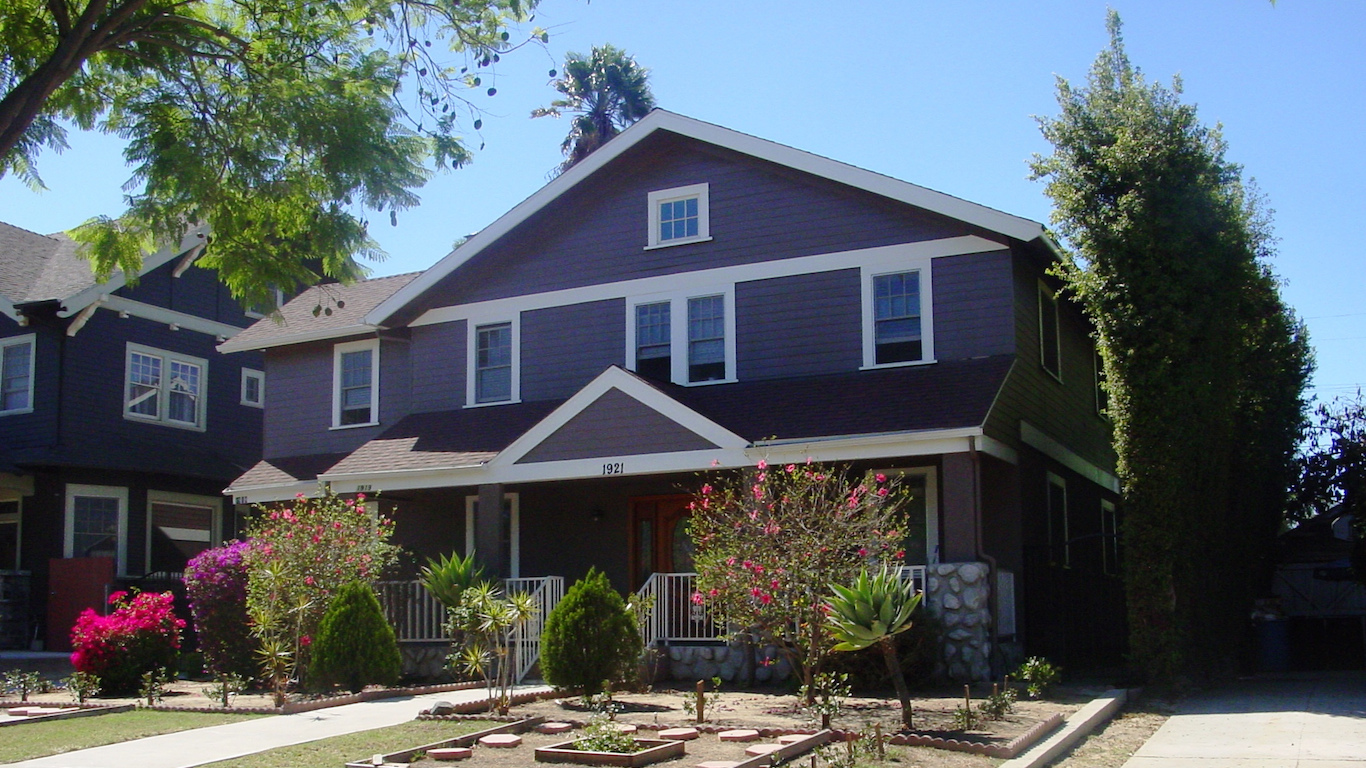
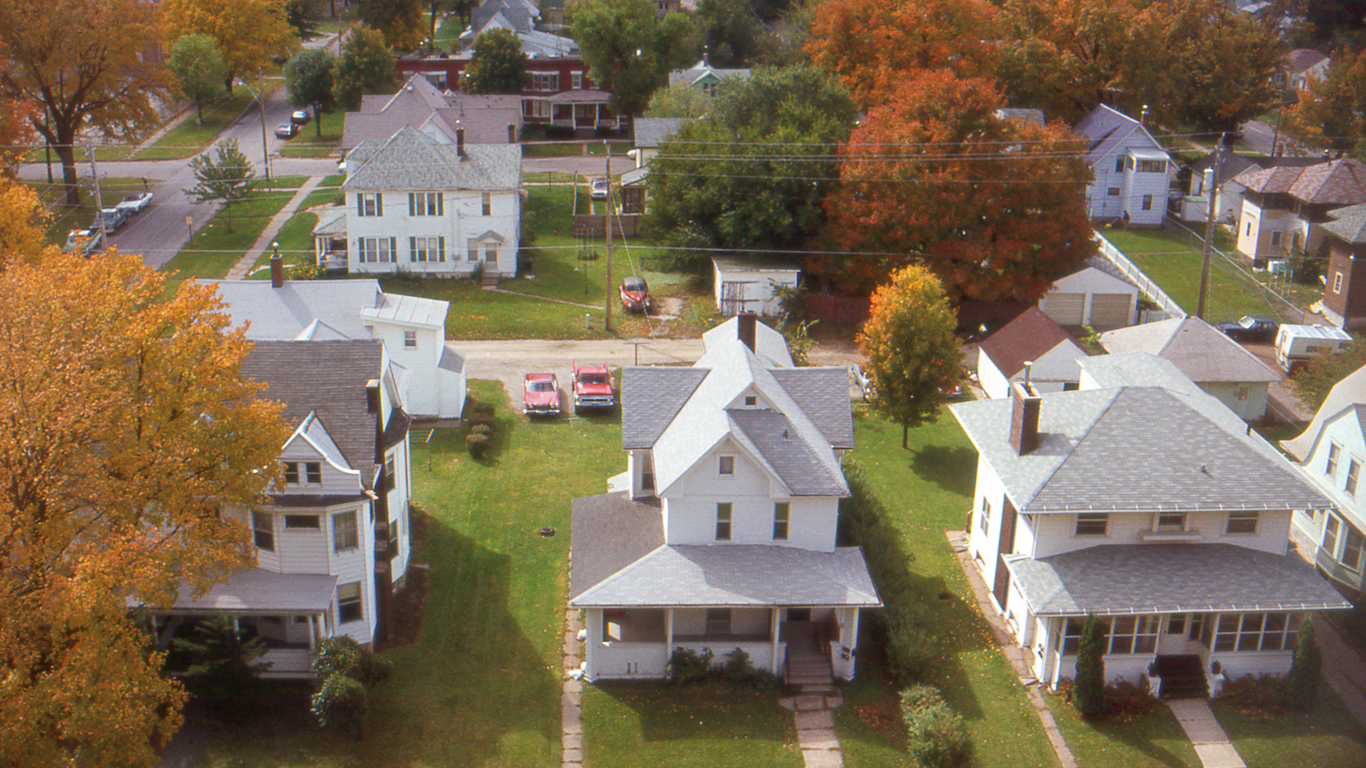
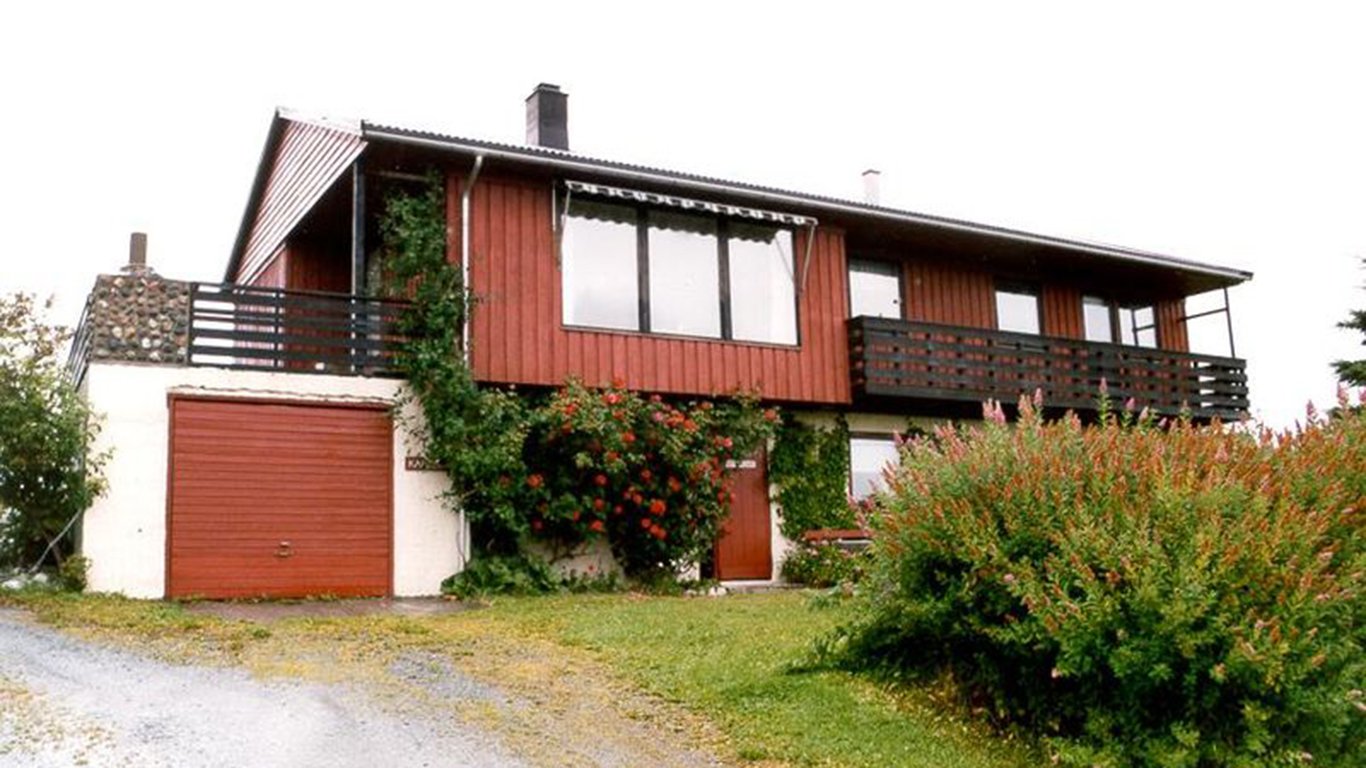
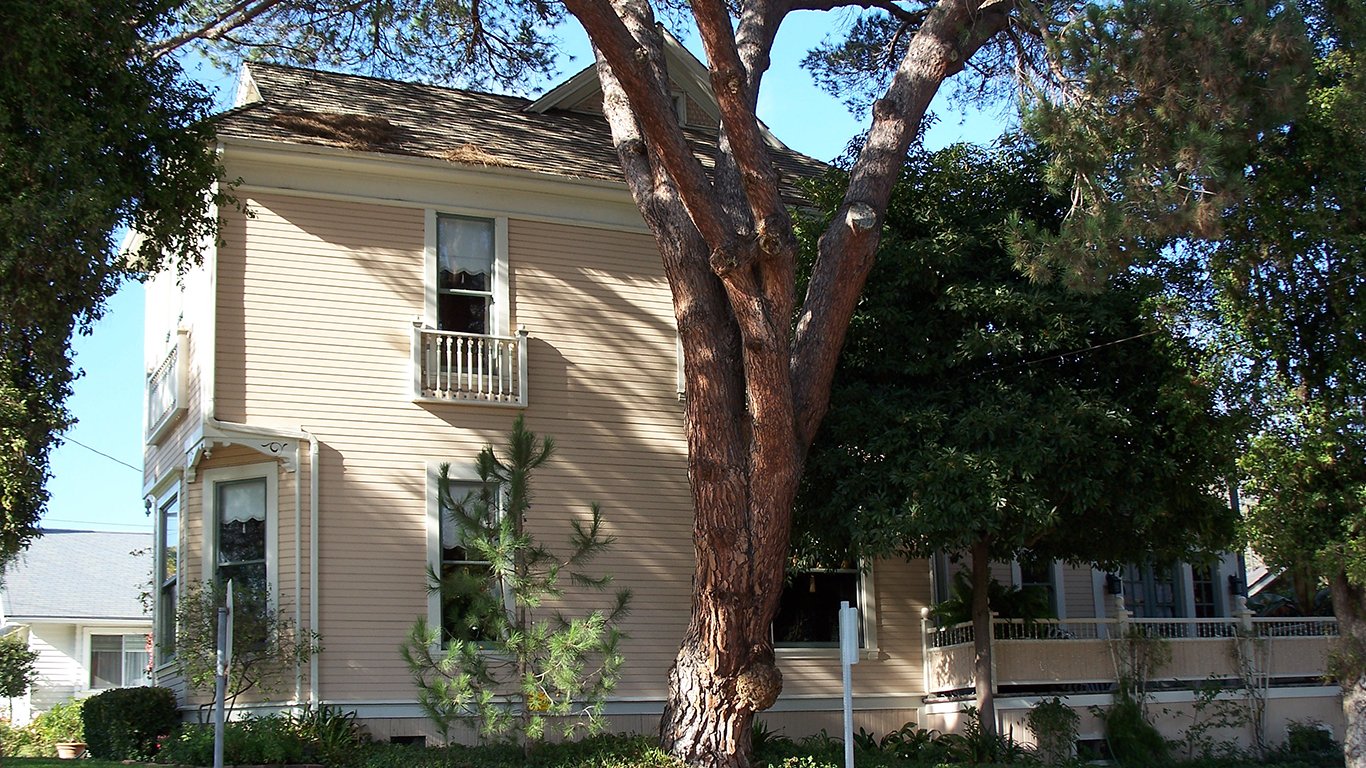
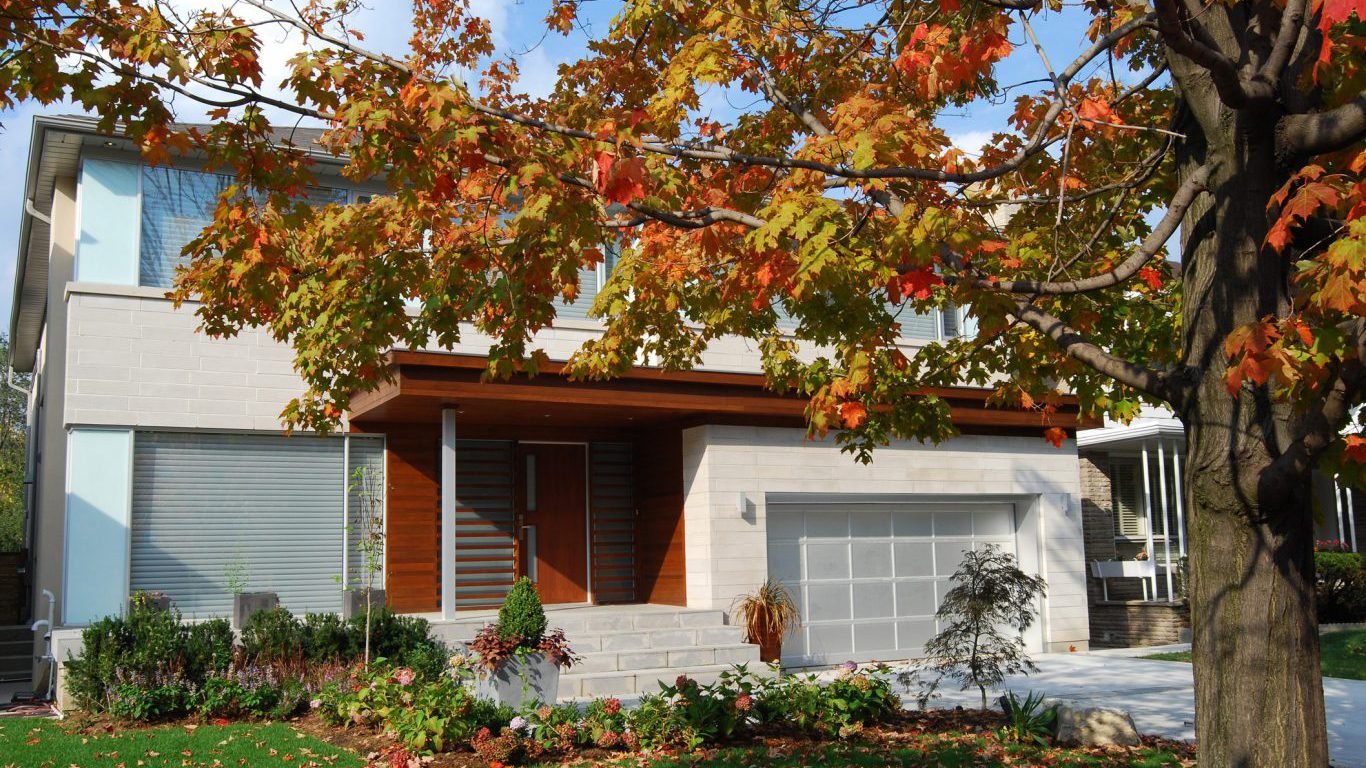
Source: JERRYE
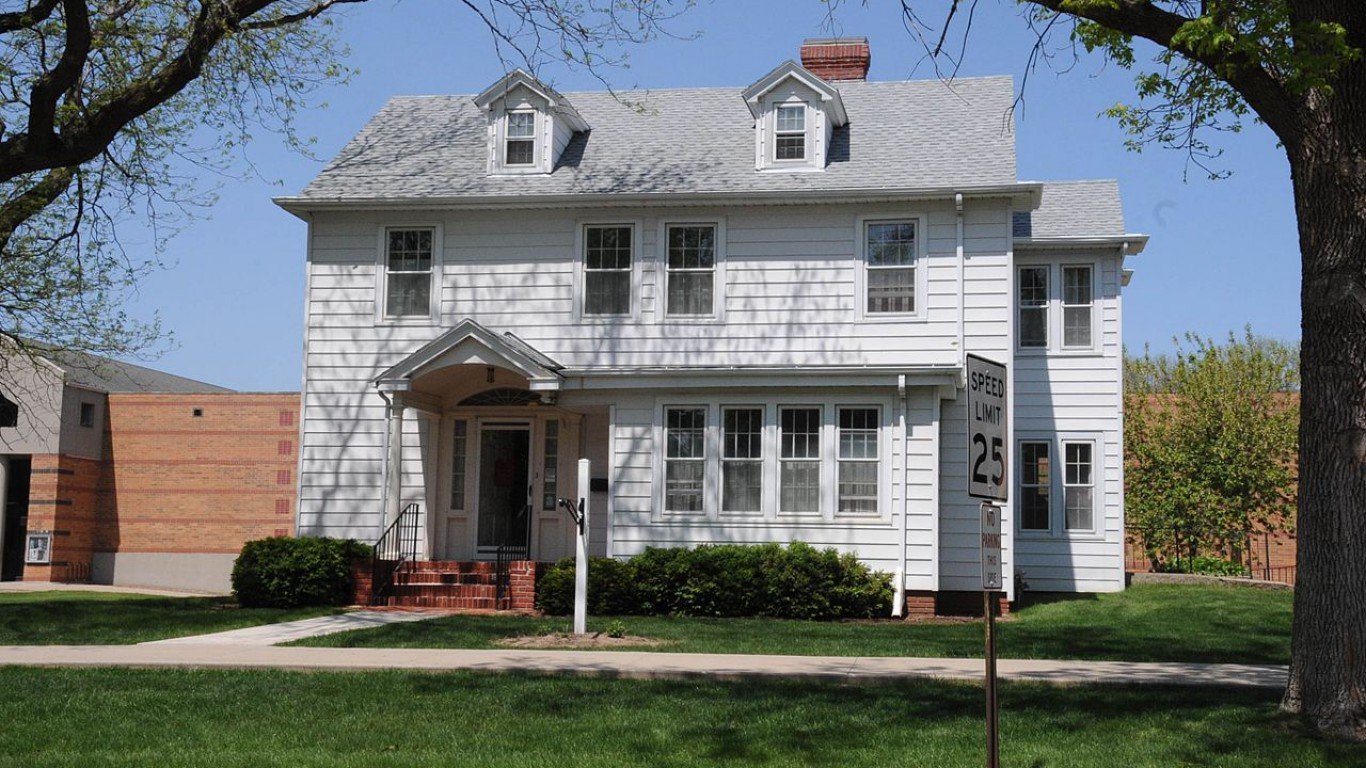
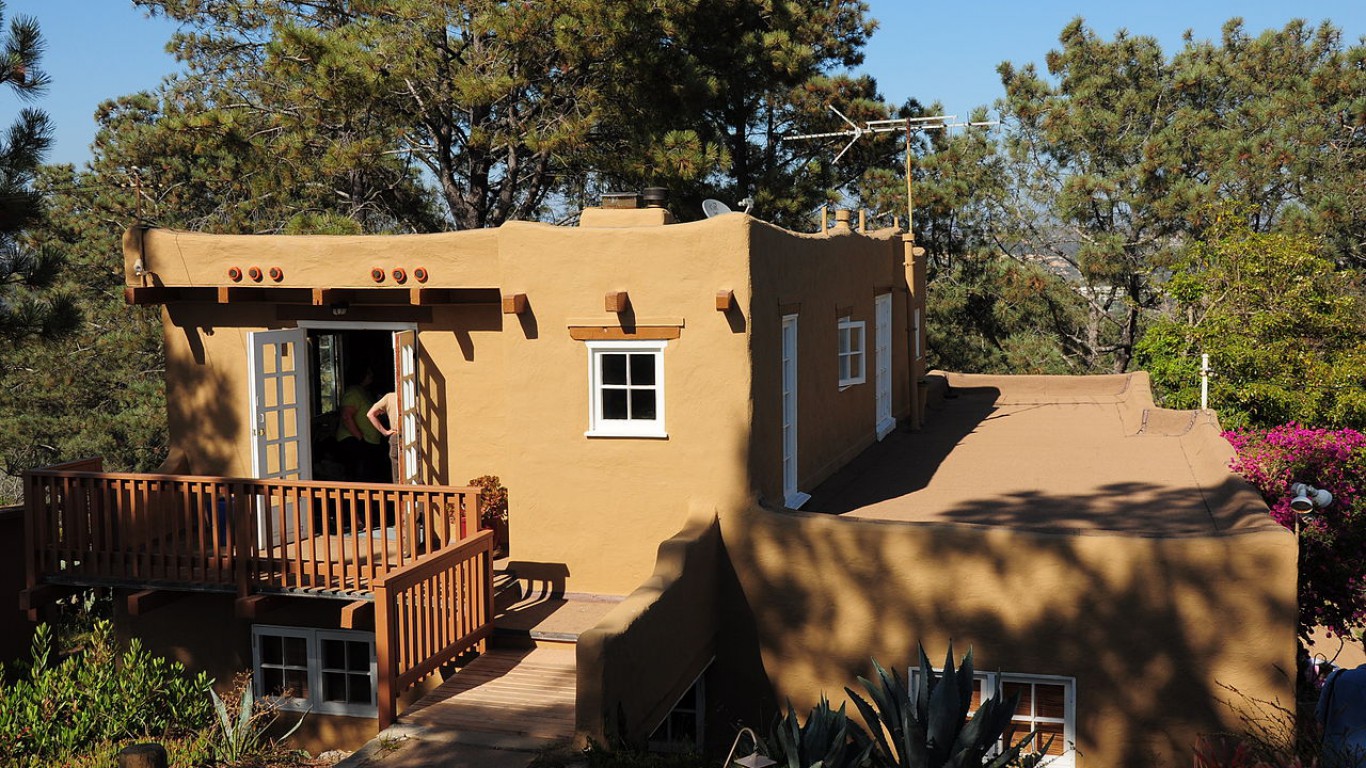
1921
Avg. floor area of a new single-family home: 1,011 sq. ft.
Avg. floor area per person: 233 sq. ft.
New homes started: 449,000
GDP per capita (inflation adjusted): $9,743

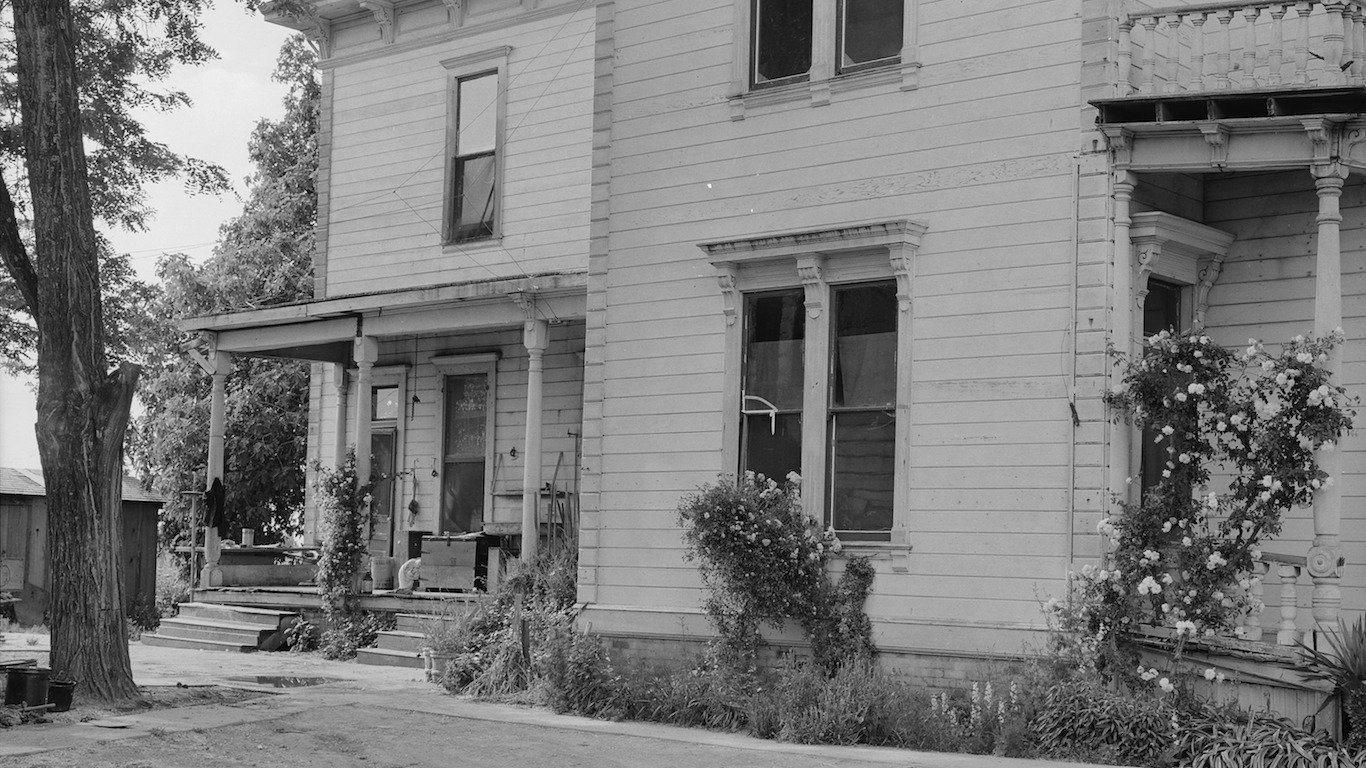
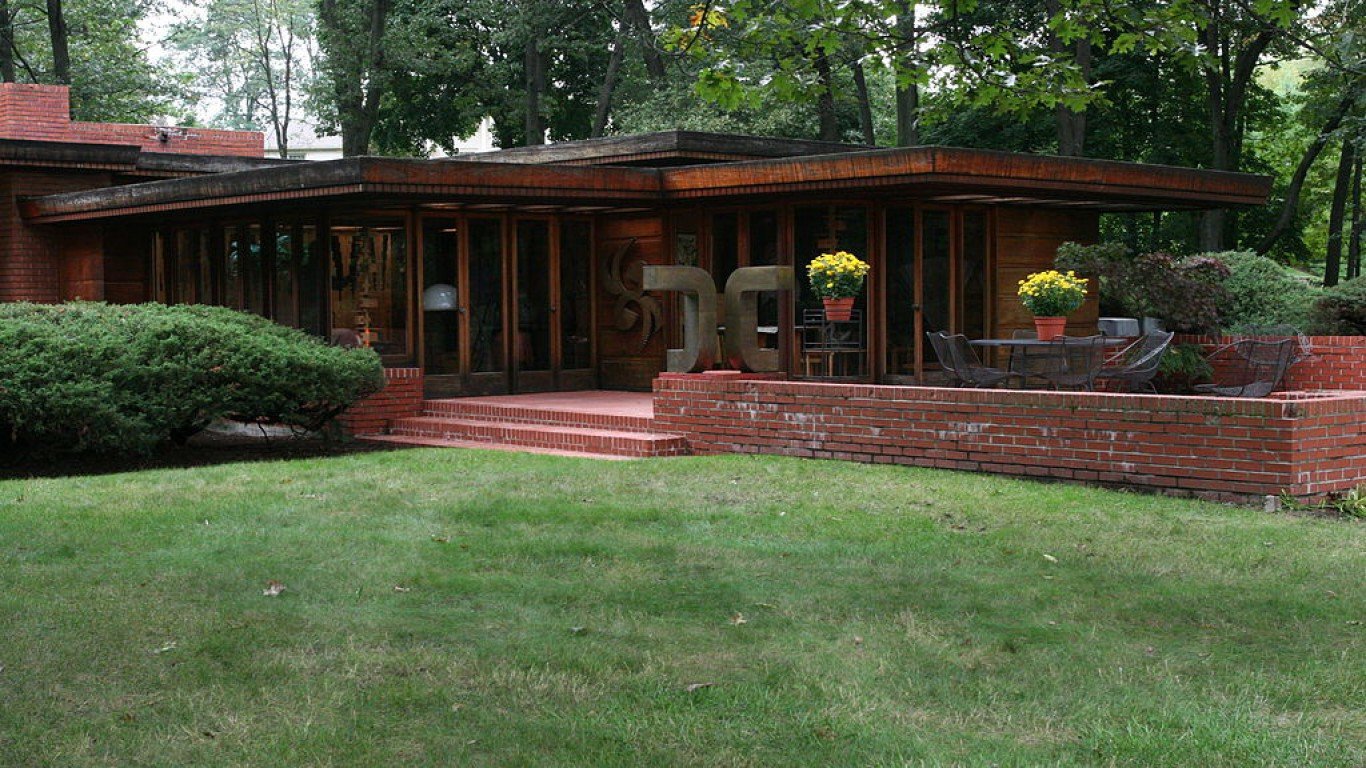
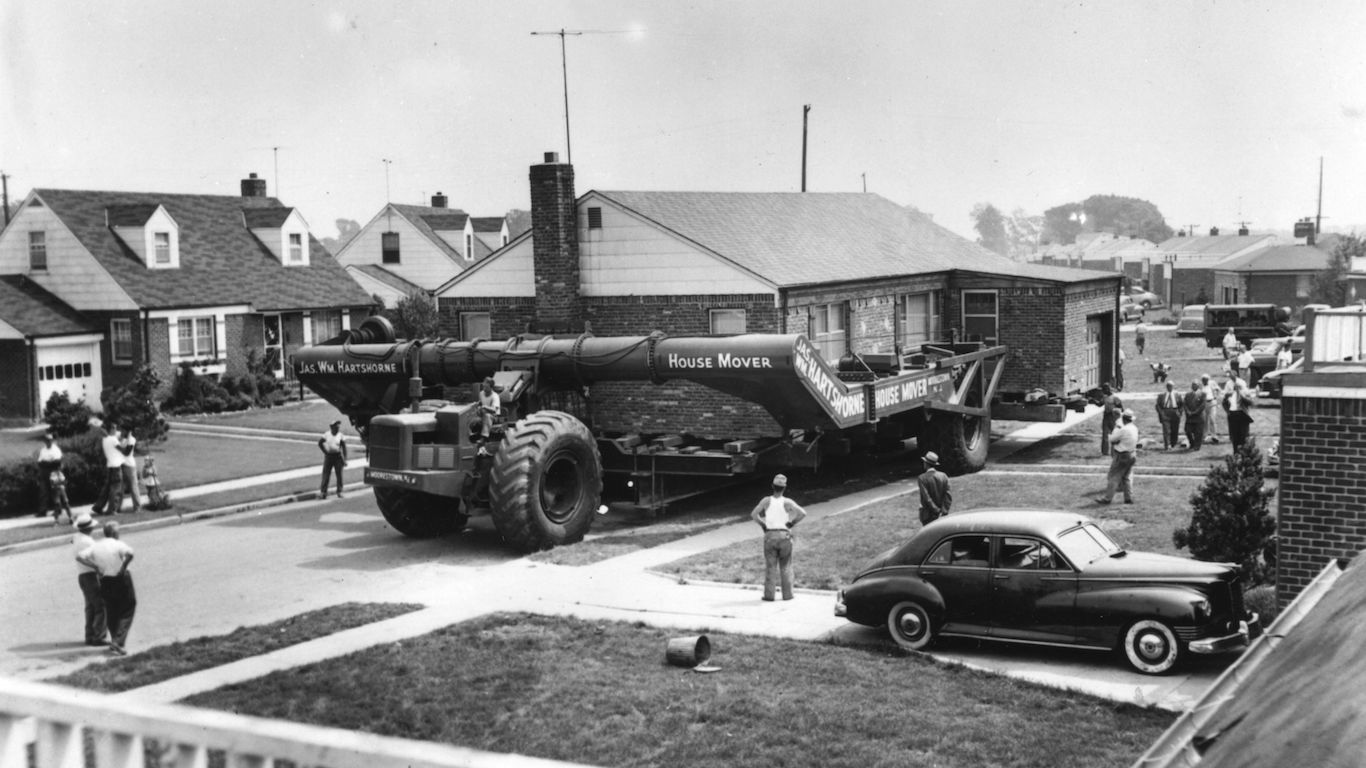
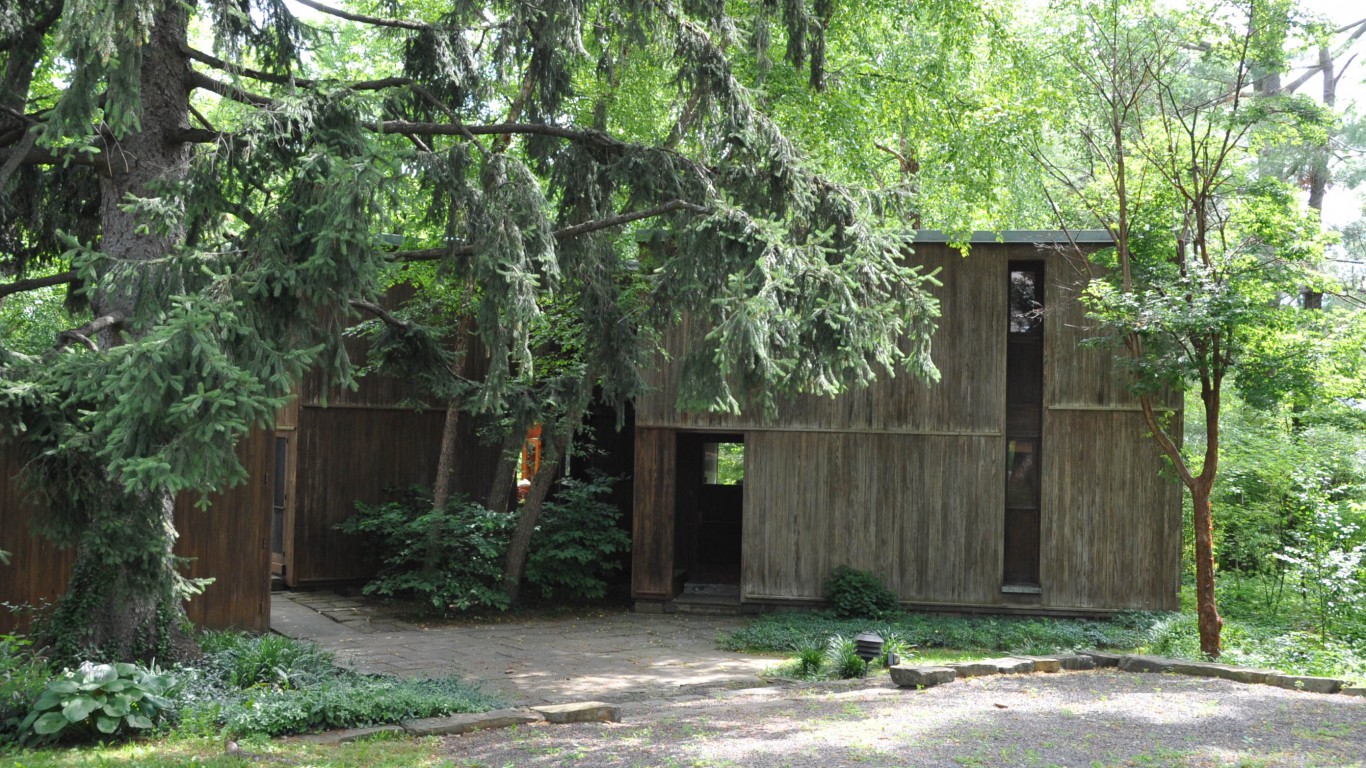
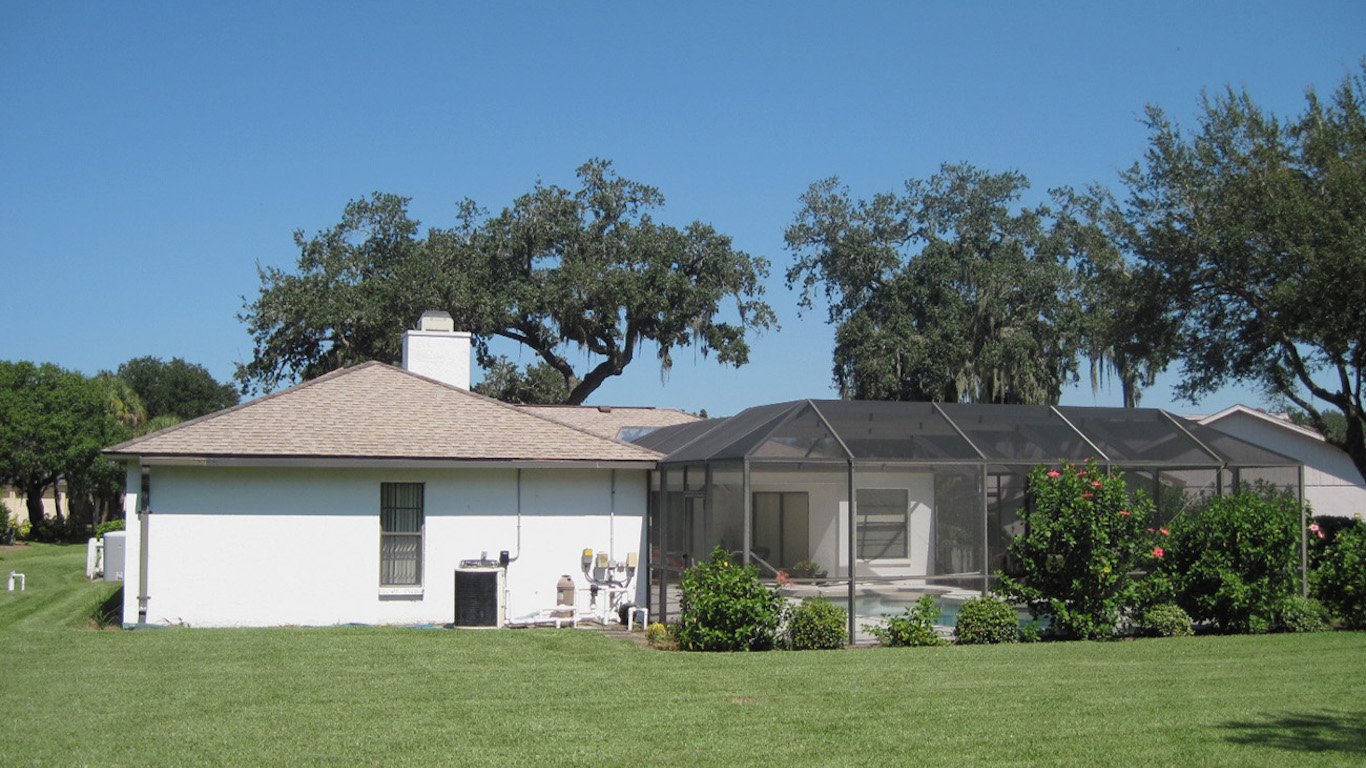
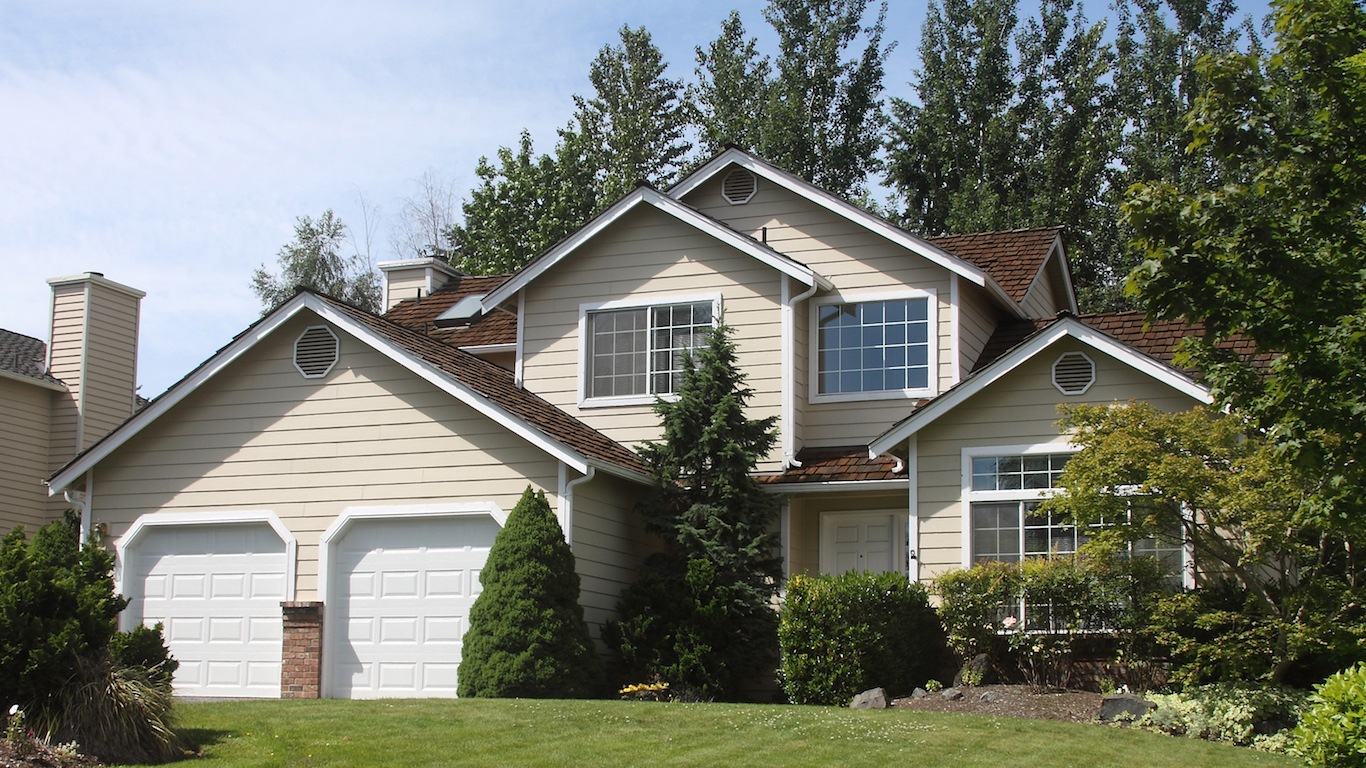
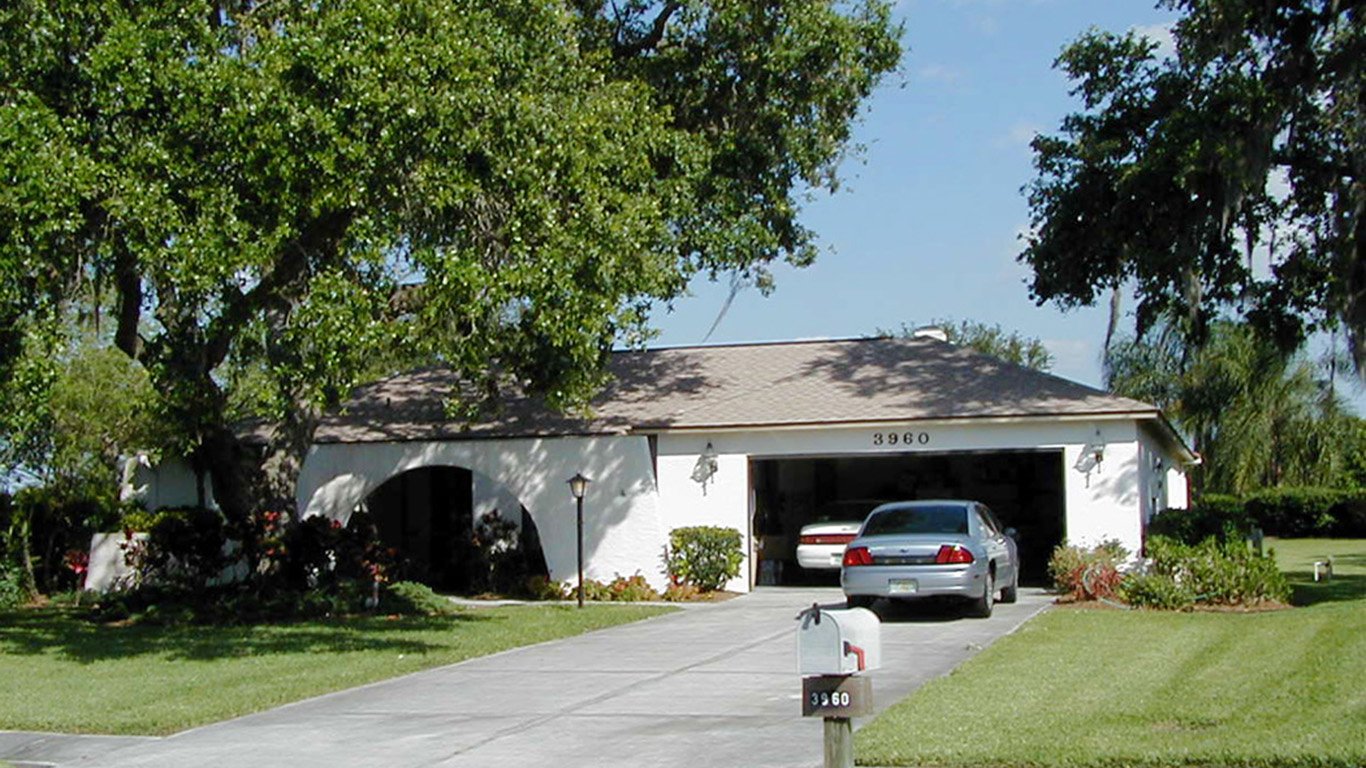
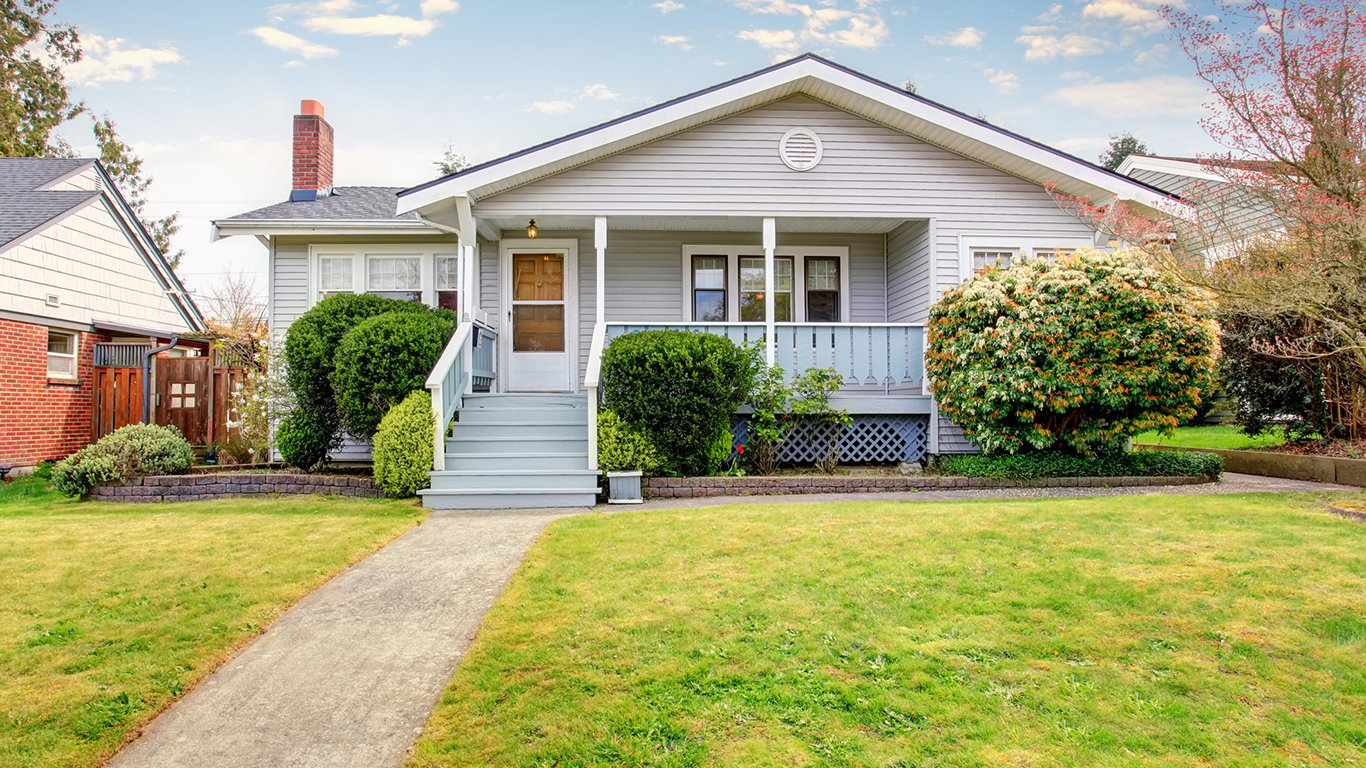
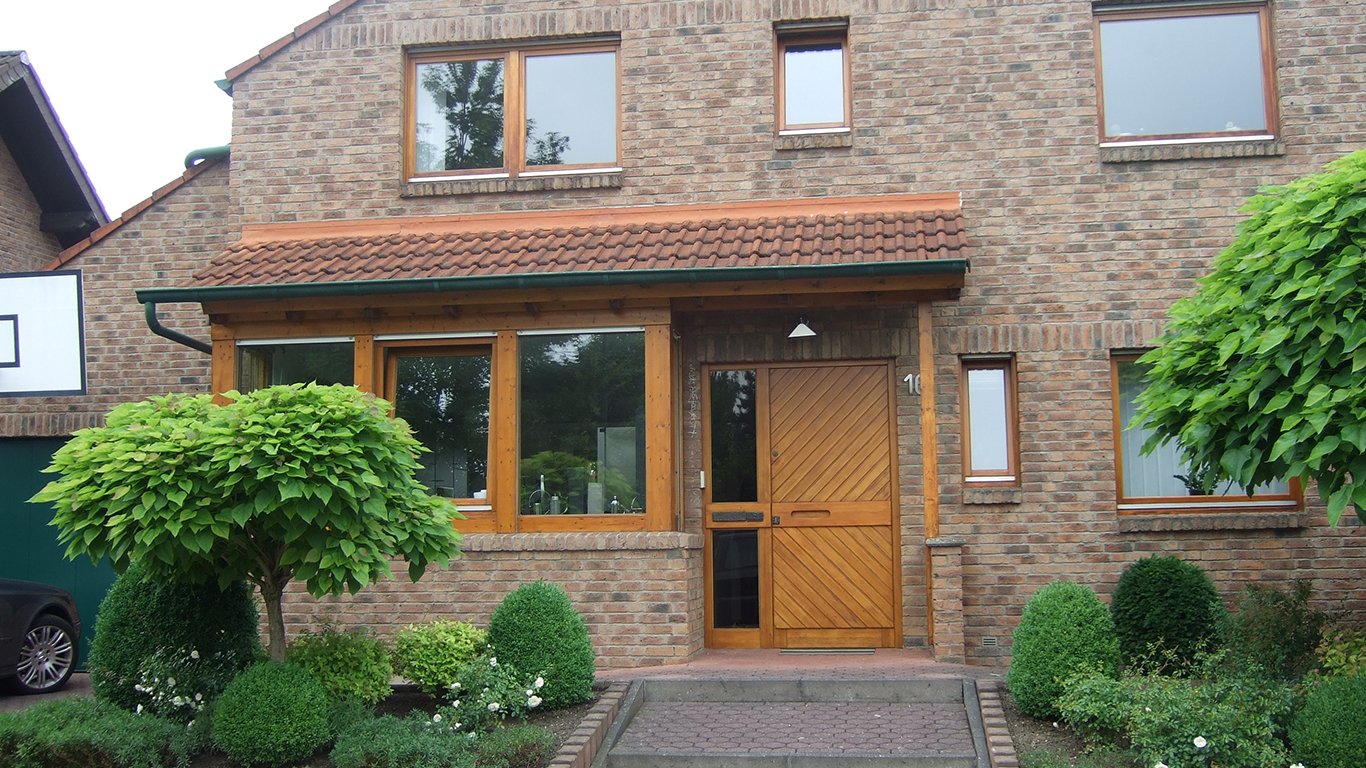
Source: Allan Ferguson / Wikimedia Commons
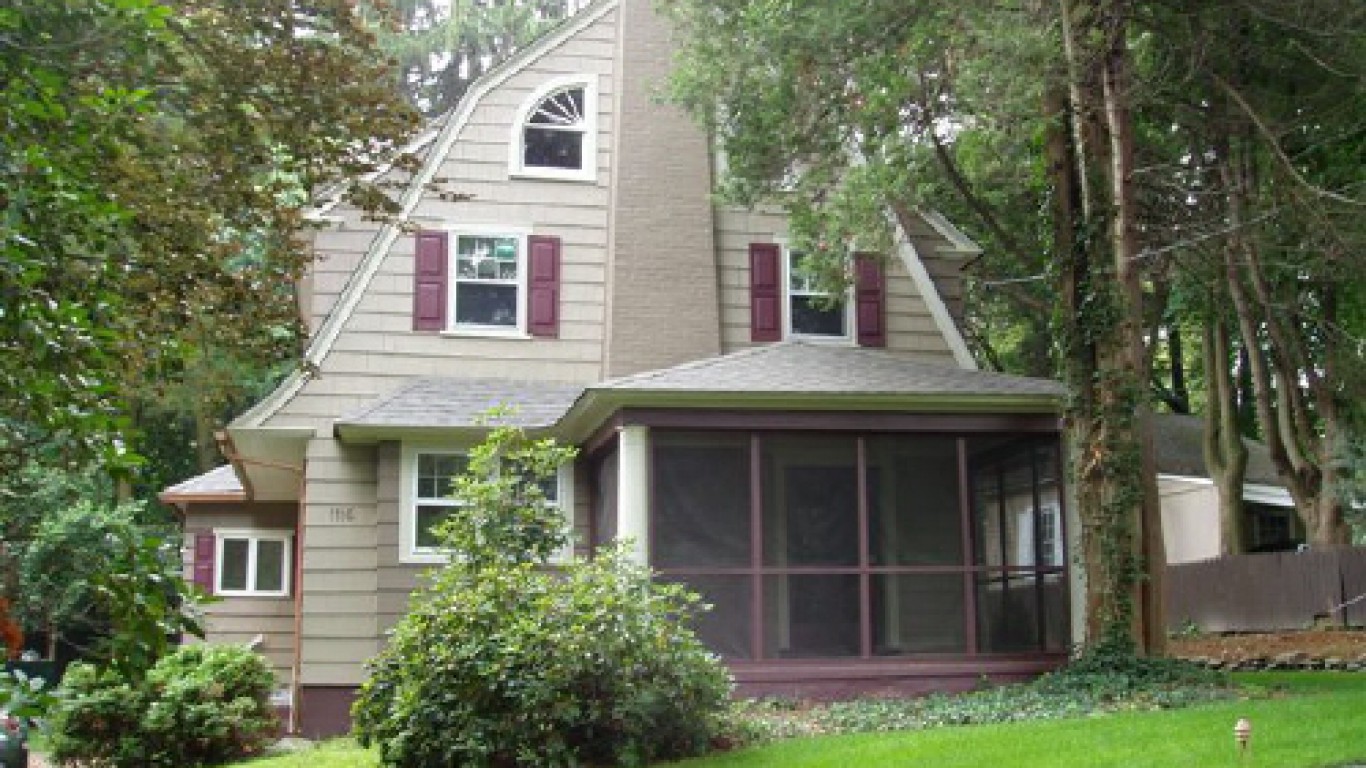
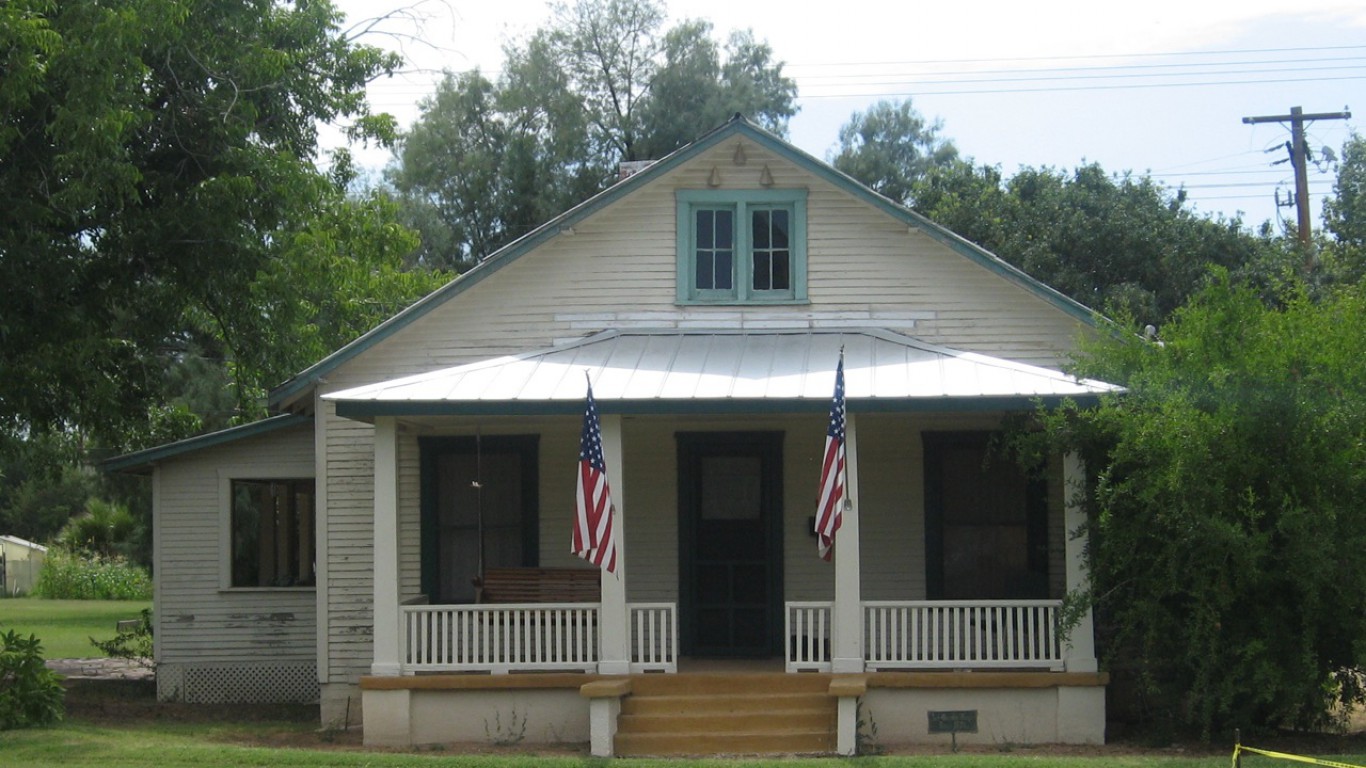
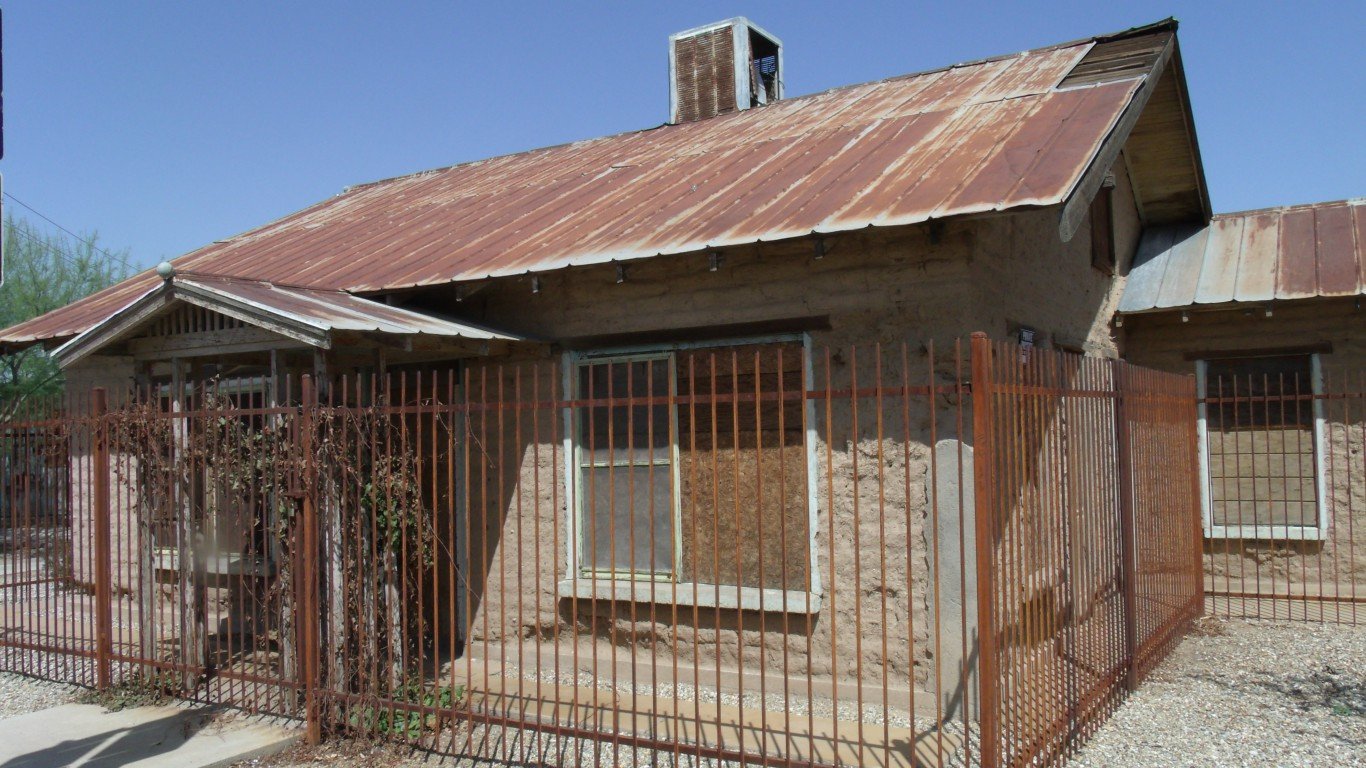
1922
Avg. floor area of a new single-family home: 818 sq. ft.
Avg. floor area per person: 188 sq. ft.
New homes started: 716,000
GDP per capita (inflation adjusted): $10,141
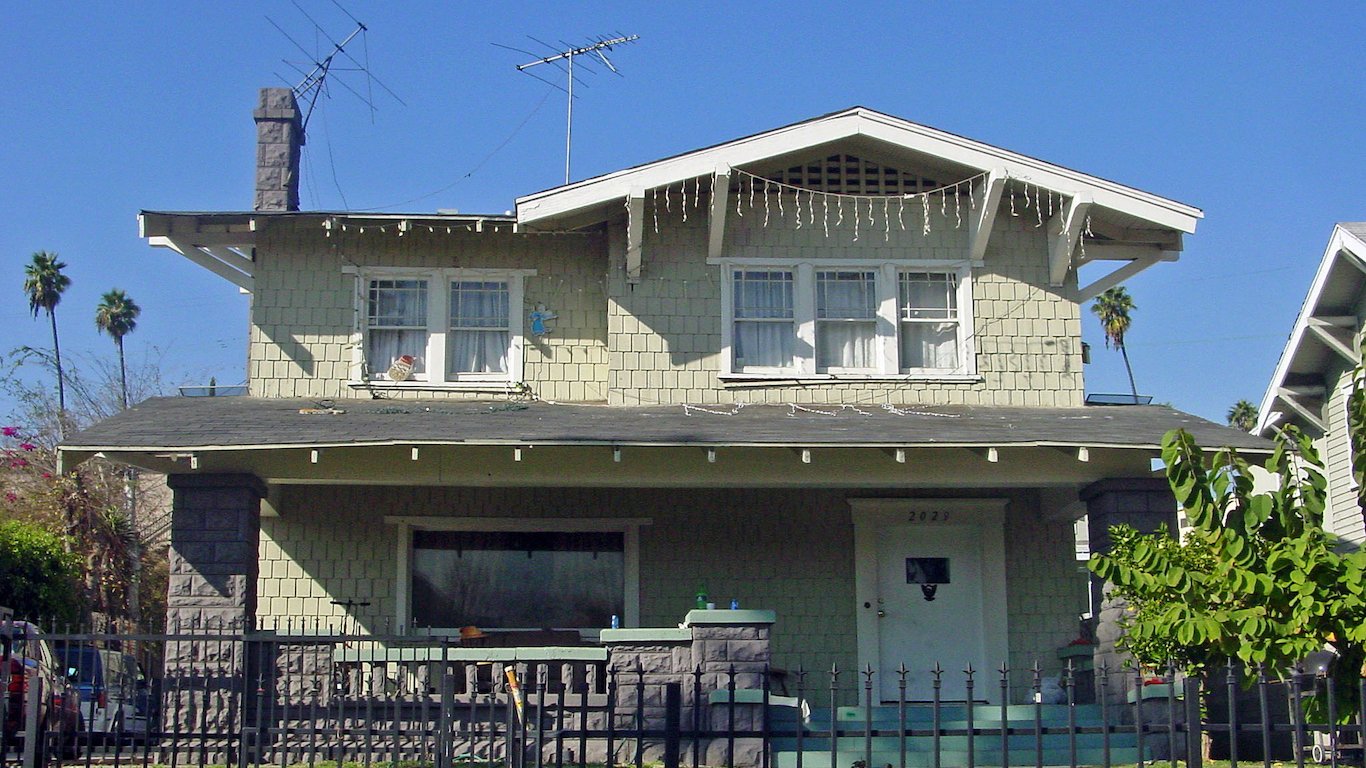
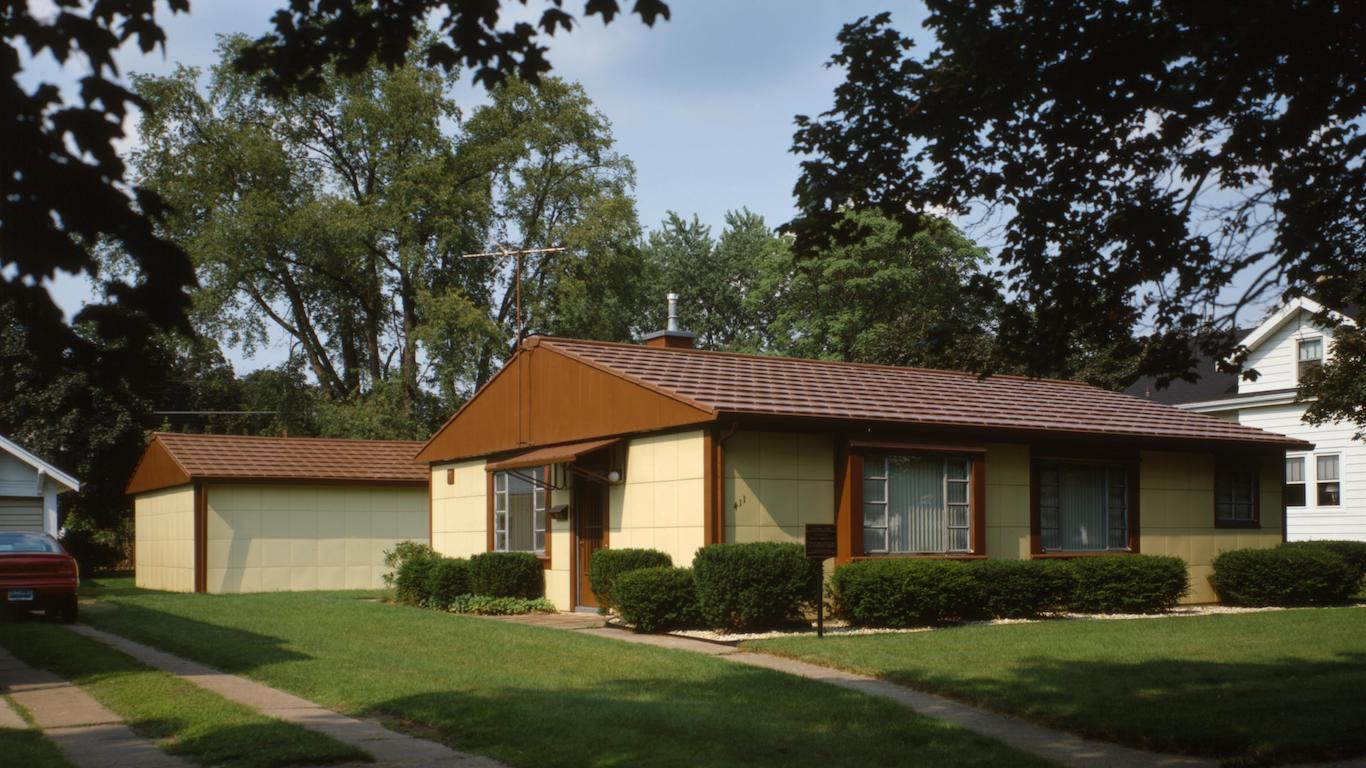
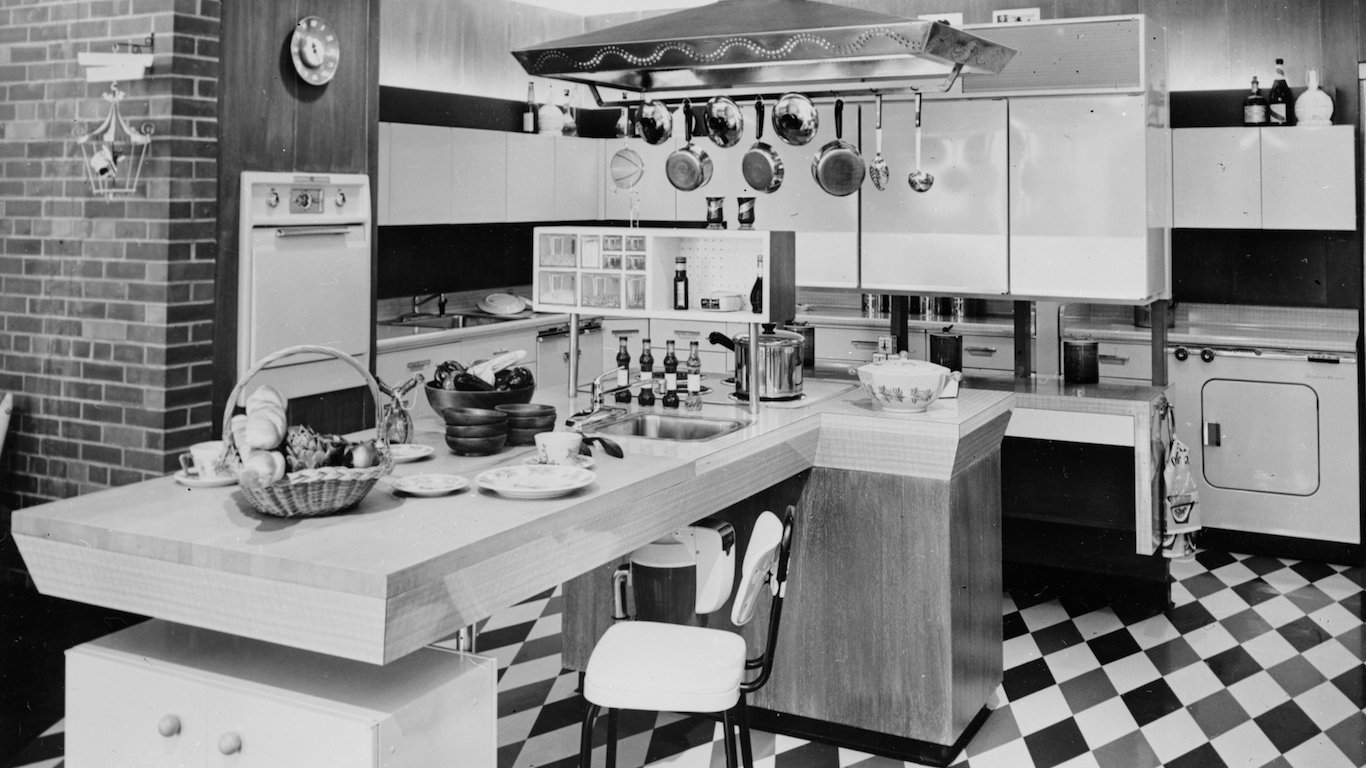
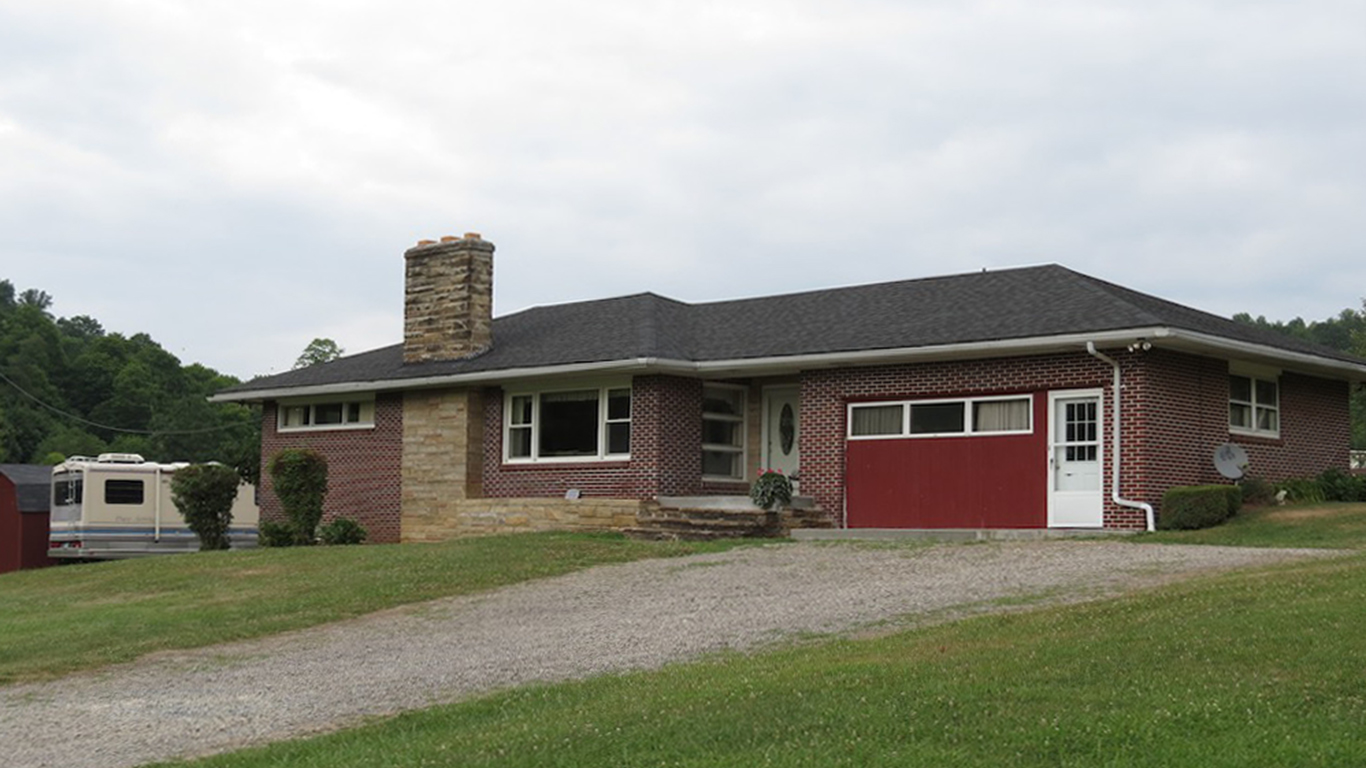
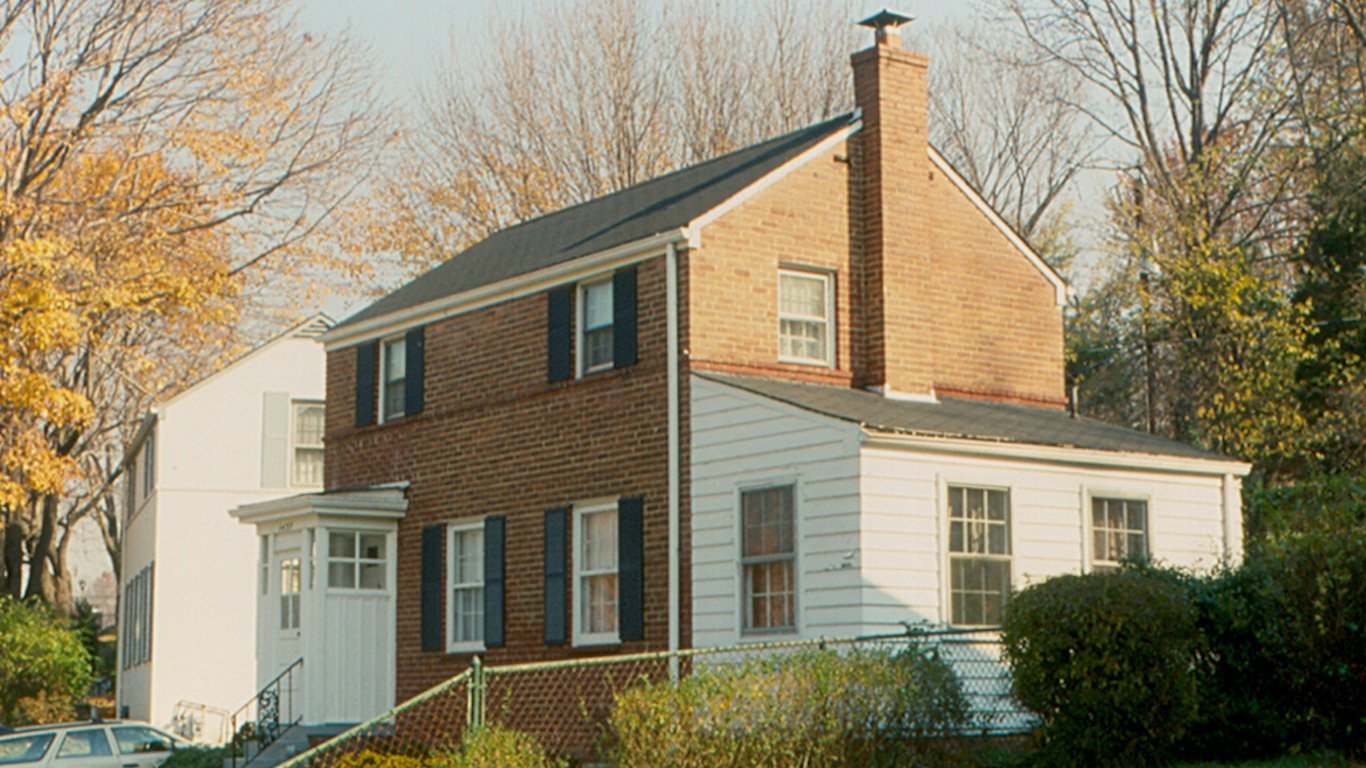
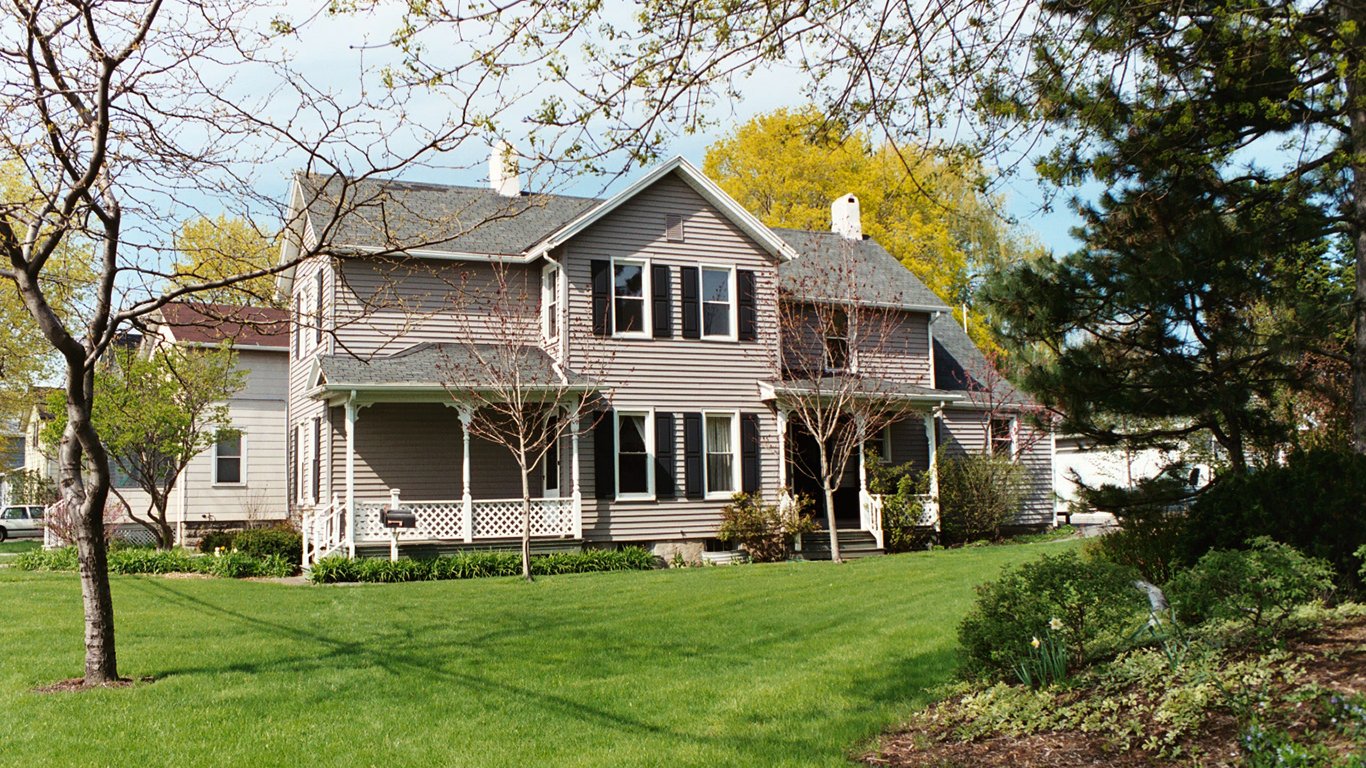
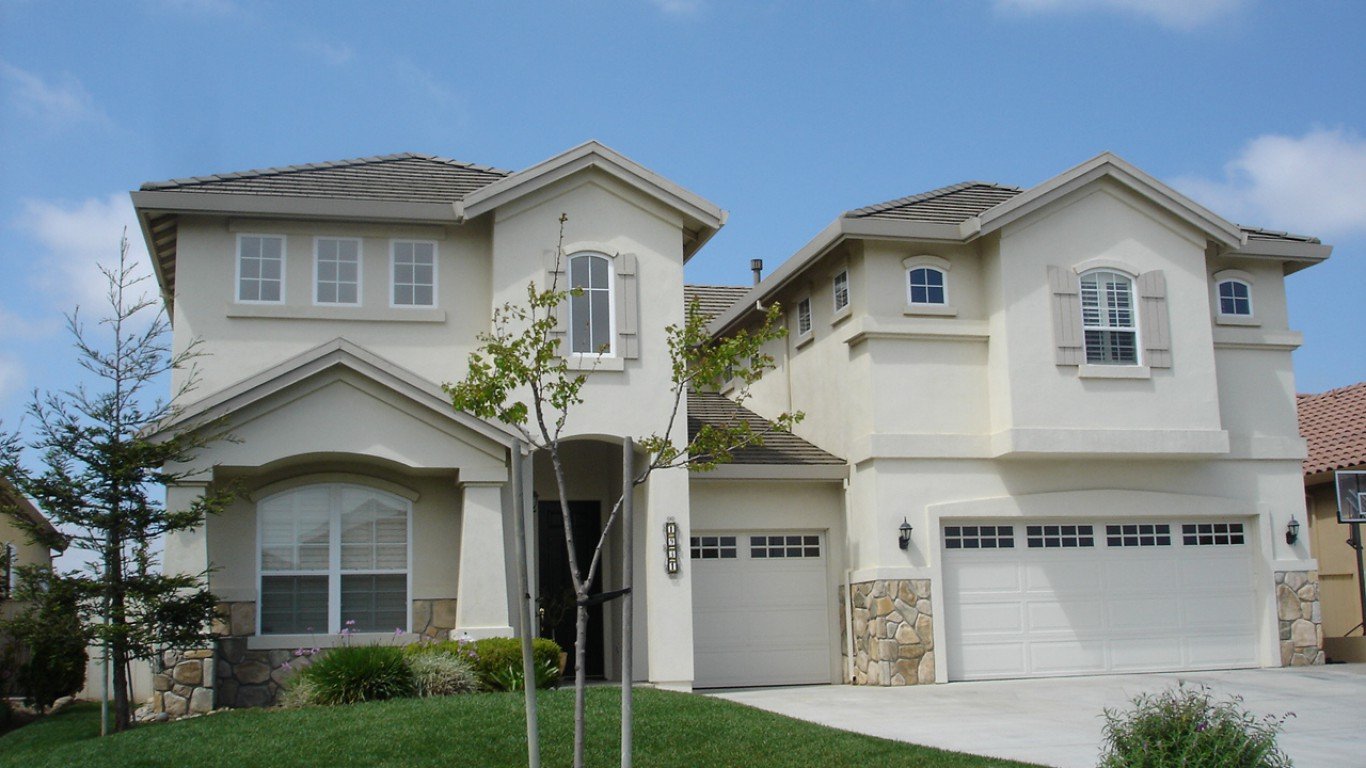
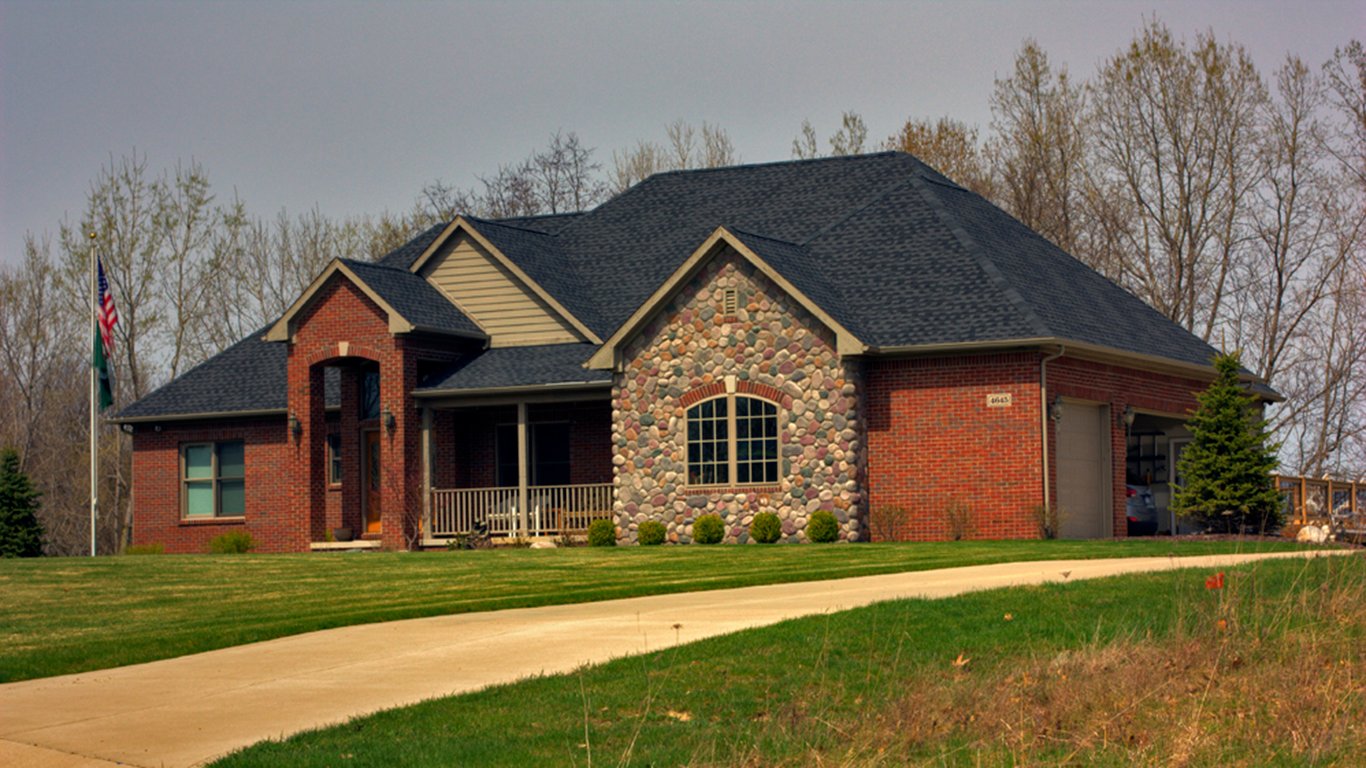
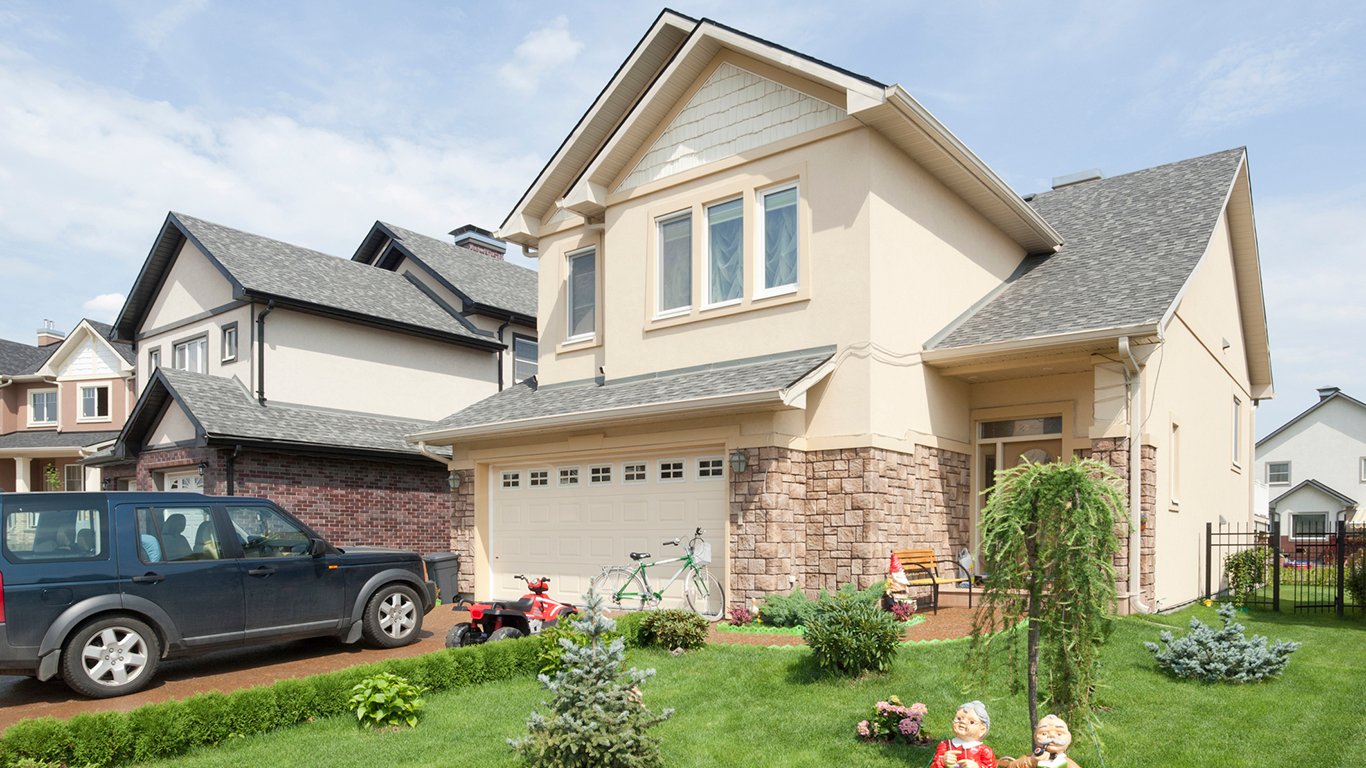
Source: Public Domain / Wikimedia Commons
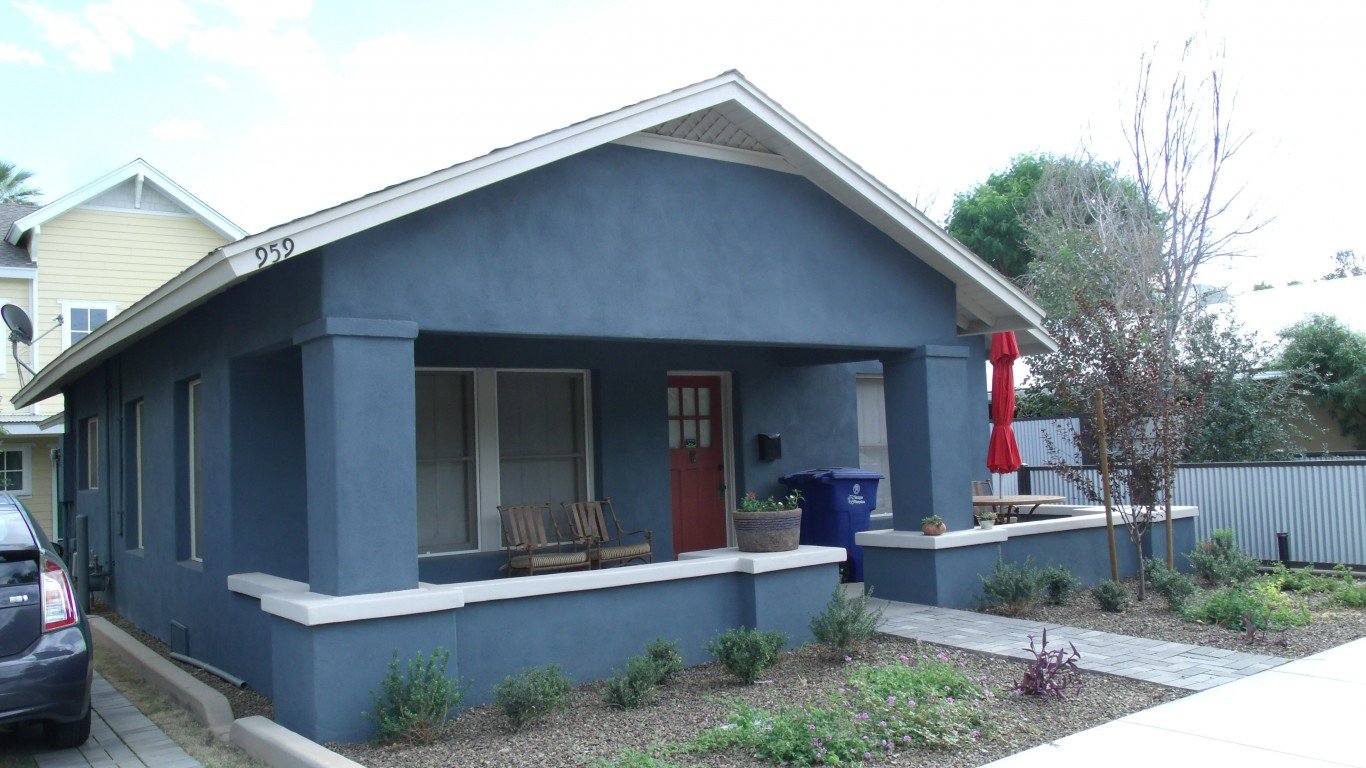
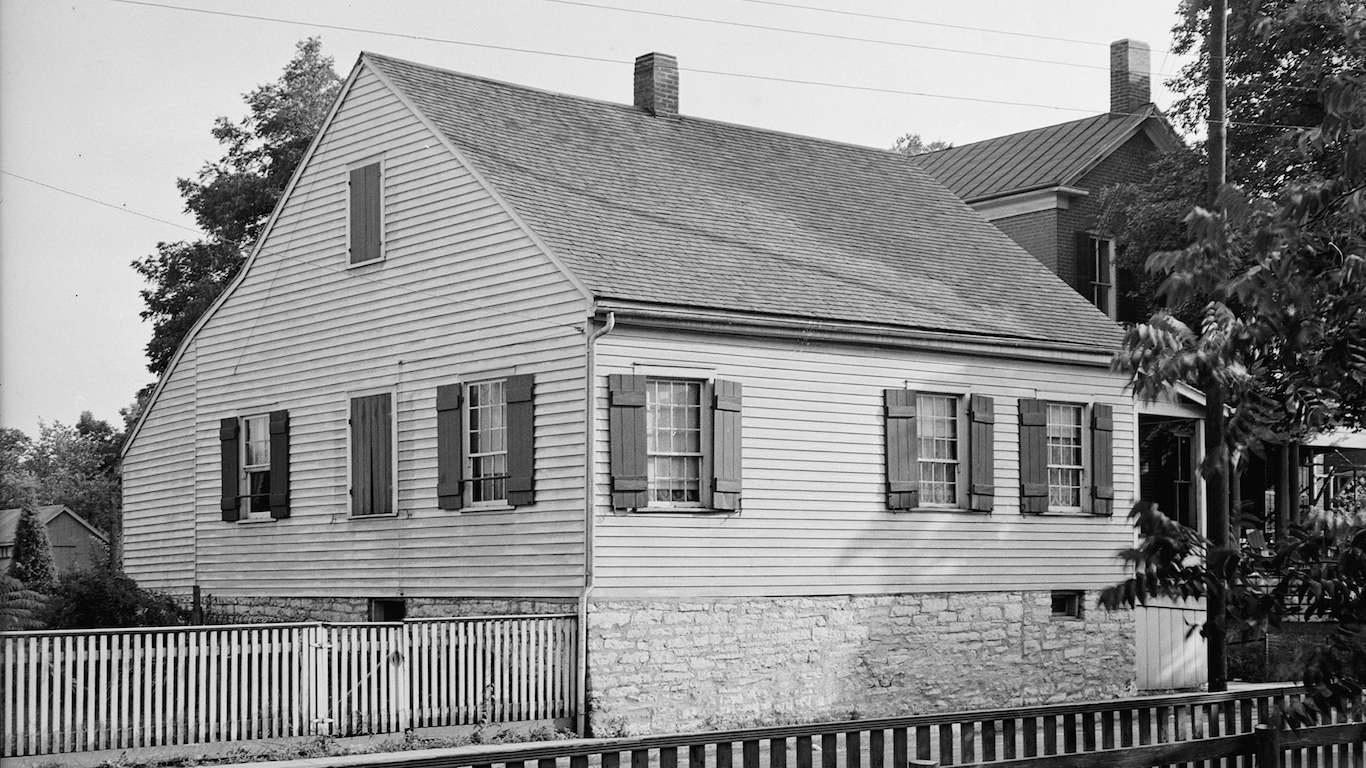
1923
Avg. floor area of a new single-family home: 742 sq. ft.
Avg. floor area per person: 171 sq. ft.
New homes started: 871,000
GDP per capita (inflation adjusted): $11,284
 24/7 Wall St.
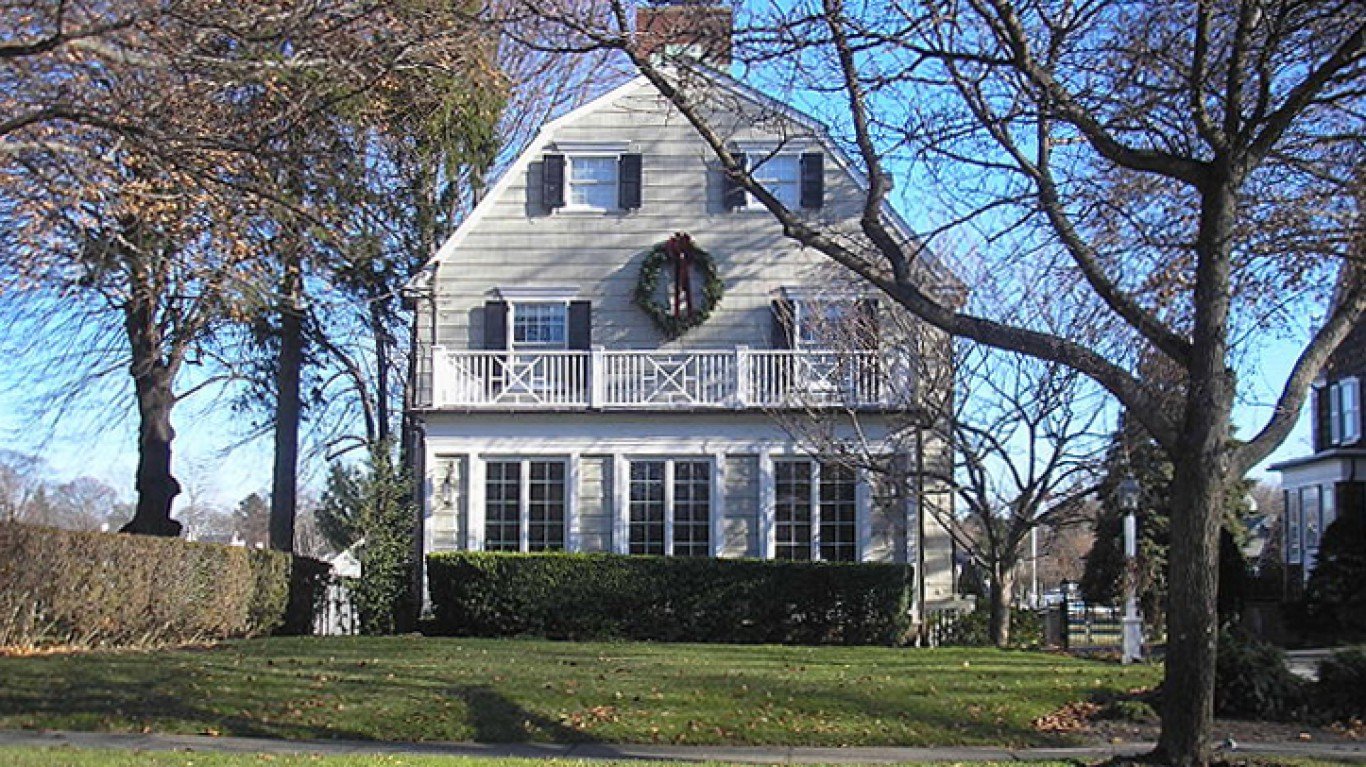
Source: Public Domain / Wikimedia Commons
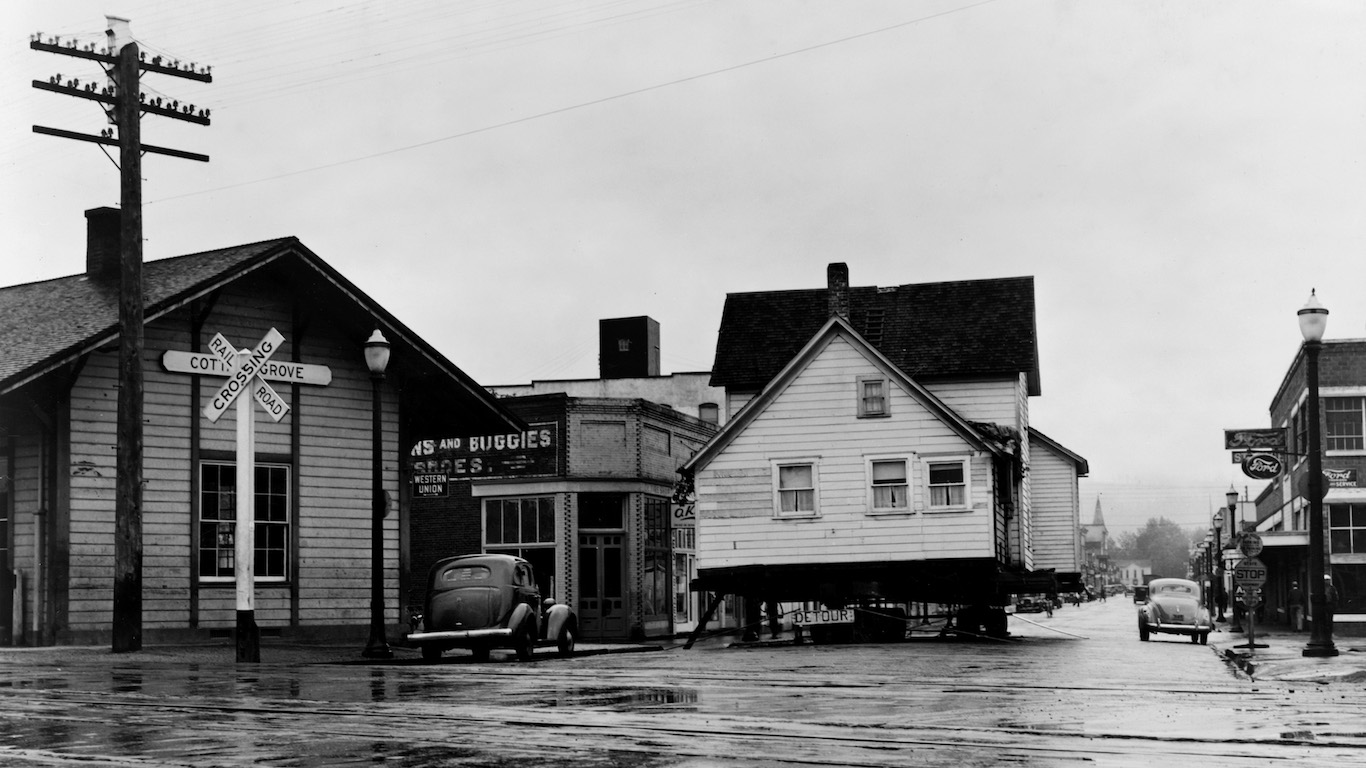
1924
Avg. floor area of a new single-family home: 777 sq. ft.
Avg. floor area per person: 179 sq. ft.
New homes started: 893,000
GDP per capita (inflation adjusted): $11,409
Source: JERRYE
1925
Avg. floor area of a new single-family home: 967 sq. ft.
Avg. floor area per person: 223 sq. ft.
New homes started: 937,000
GDP per capita (inflation adjusted): $11,500

Source: Governor Macquarie / Flickr
1926
Avg. floor area of a new single-family home: 994 sq. ft.
Avg. floor area per person: 229 sq. ft.
New homes started: 849,000
GDP per capita (inflation adjusted): $12,086
[in-text-ad-2]
Source: Racoats / Wikimedia Commons
1927
Avg. floor area of a new single-family home: 989 sq. ft.
Avg. floor area per person: 228 sq. ft.
New homes started: 810,000
GDP per capita (inflation adjusted): $12,038
Source: Mcmillin24 / Wikimedia Commons
1928
Avg. floor area of a new single-family home: 1,222 sq. ft.
Avg. floor area per person: 282 sq. ft.
New homes started: 753,000
GDP per capita (inflation adjusted): $12,025
Source: Tony the Marine / Wikimedia Commons
1929
Avg. floor area of a new single-family home: 1,233 sq. ft.
Avg. floor area per person: 284 sq. ft.
New homes started: 509,000
GDP per capita (inflation adjusted): $9,668
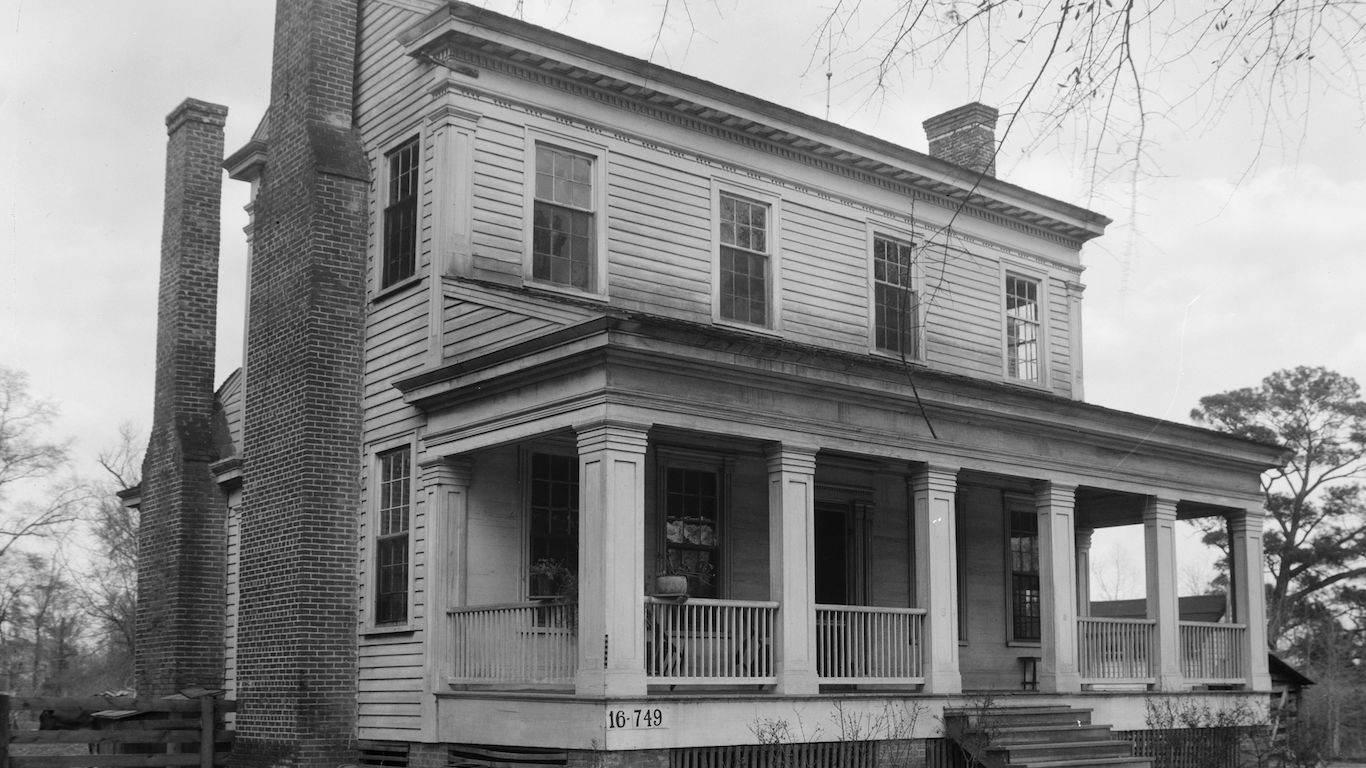
Source: W. N. Manning / Library of Congress / Wikimedia Commons
1930
Avg. floor area of a new single-family home: 1,129 sq. ft.
Avg. floor area per person: 275 sq. ft.
New homes started: 330,000
GDP per capita (inflation adjusted): $7,847
[in-text-ad]
Source: Jack Boucher / Library of Congress / Wikimedia Commons
1931
Avg. floor area of a new single-family home: 1,213 sq. ft.
Avg. floor area per person: 295 sq. ft.
New homes started: 254,000
GDP per capita (inflation adjusted): $7,288
Source: BIPS / Hulton Archive / Getty Images
1932
Avg. floor area of a new single-family home: 889 sq. ft.
Avg. floor area per person: 216 sq. ft.
New homes started: 134,000
GDP per capita (inflation adjusted): $6,308
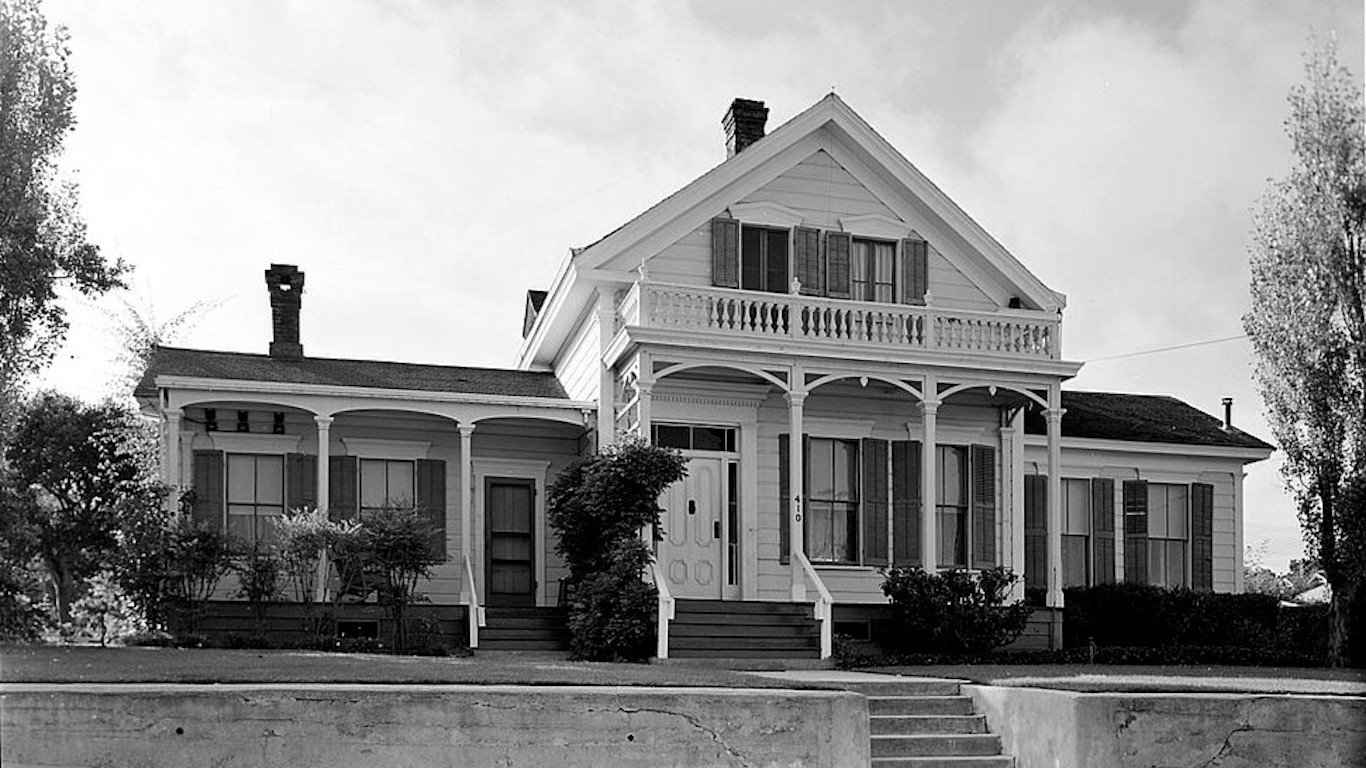
Source: The U.S. National Archives / Flickr
1933
Avg. floor area of a new single-family home: 1,267 sq. ft.
Avg. floor area per person: 308 sq. ft.
New homes started: 93,000
GDP per capita (inflation adjusted): $6,192

Source: Sasha / Getty Images
1934
Avg. floor area of a new single-family home: 826 sq. ft.
Avg. floor area per person: 201 sq. ft.
New homes started: 126,000
GDP per capita (inflation adjusted): $6,817
Source: Public Domain / Wikimedia Commons
1935
Avg. floor area of a new single-family home: 992 sq. ft.
Avg. floor area per person: 241 sq. ft.
New homes started: 221,000
GDP per capita (inflation adjusted): $7,373
Source: Tony the Marine / Wikimedia Commons
1936
Avg. floor area of a new single-family home: 1,129 sq. ft.
Avg. floor area per person: 275 sq. ft.
New homes started: 319,000
GDP per capita (inflation adjusted): $8,273
[in-text-ad-2]

Source: Bubba73 (Jud McCranie) / Wikimedia Commons
1937
Avg. floor area of a new single-family home: 1,135 sq. ft.
Avg. floor area per person: 276 sq. ft.
New homes started: 336,000
GDP per capita (inflation adjusted): $8,643
Source: Piaget-van Ravenswaay Collection / Library of Congress / Wikimedia Commons
1938
Avg. floor area of a new single-family home: 959 sq. ft.
Avg. floor area per person: 233 sq. ft.
New homes started: 406,000
GDP per capita (inflation adjusted): $8,292
Source: trialsanderrors / Flickr
1939
Avg. floor area of a new single-family home: 1,046 sq. ft.
Avg. floor area per person: 254 sq. ft.
New homes started: 515,000
GDP per capita (inflation adjusted): $8,881
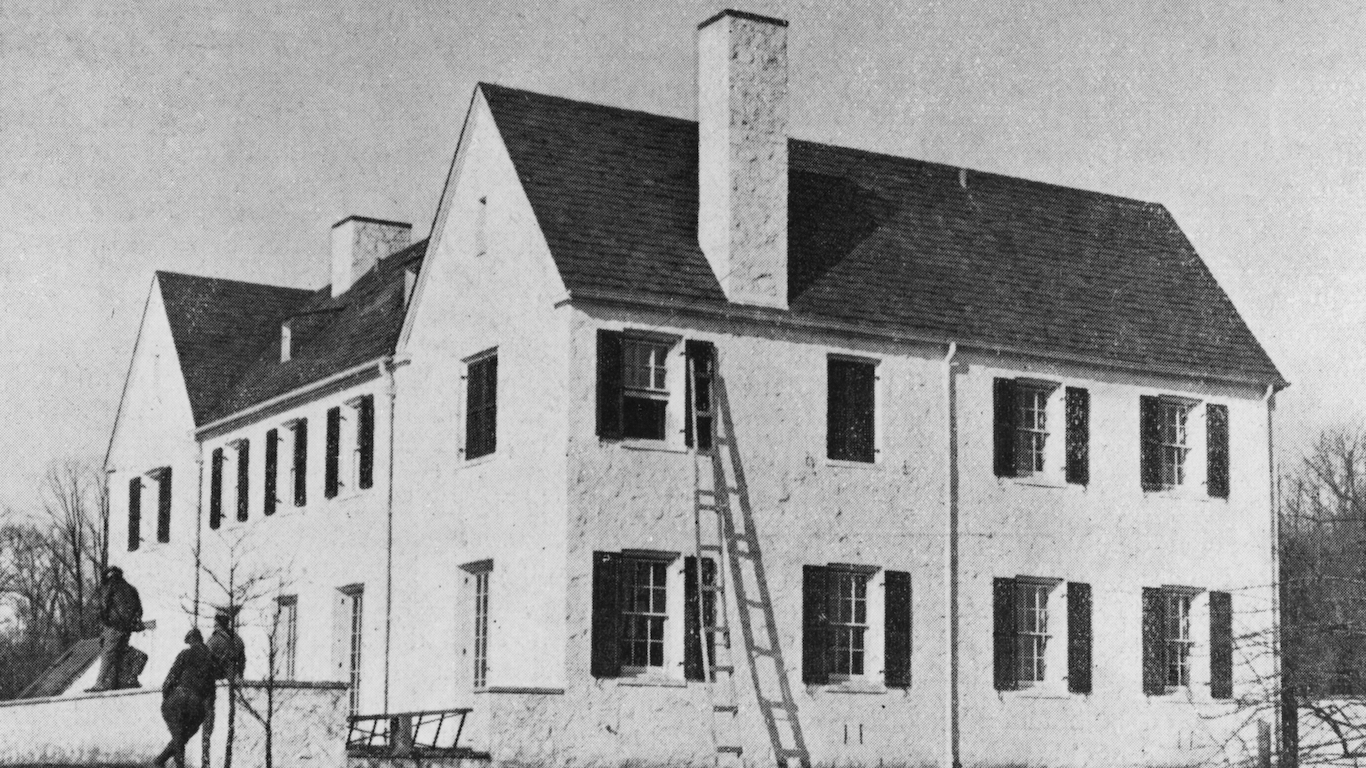
Source: Public Domain / Wikimedia Commons
1940
Avg. floor area of a new single-family home: 1,177 sq. ft.
Avg. floor area per person: 321 sq. ft.
New homes started: 603,000
GDP per capita (inflation adjusted): $9,583
[in-text-ad]
Source: Public Domain / Wikimedia Commons
1941
Avg. floor area of a new single-family home: 1,153 sq. ft.
Avg. floor area per person: 314 sq. ft.
New homes started: 706,000
GDP per capita (inflation adjusted): $11,171
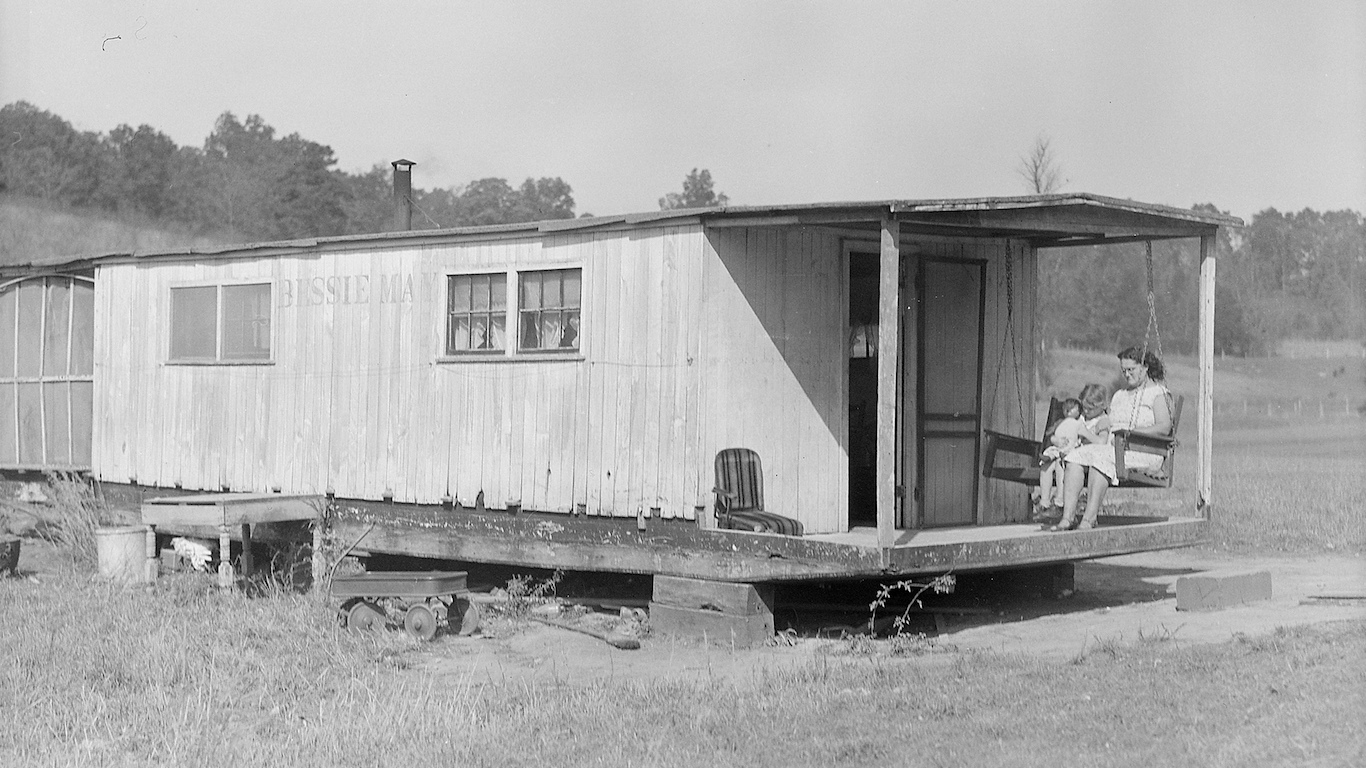
Source: Dorothea Lange / National Archives and Records Administration / Wikimedia Commons
1942
Avg. floor area of a new single-family home: 2,044 sq. ft.
Avg. floor area per person: 557 sq. ft.
New homes started: 356,000
GDP per capita (inflation adjusted): $13,138
Source: Kansas Sebastian / Flickr
1943
Avg. floor area of a new single-family home: 1,692 sq. ft.
Avg. floor area per person: 461 sq. ft.
New homes started: 191,000
GDP per capita (inflation adjusted): $15,166
 24/7 Wall St.
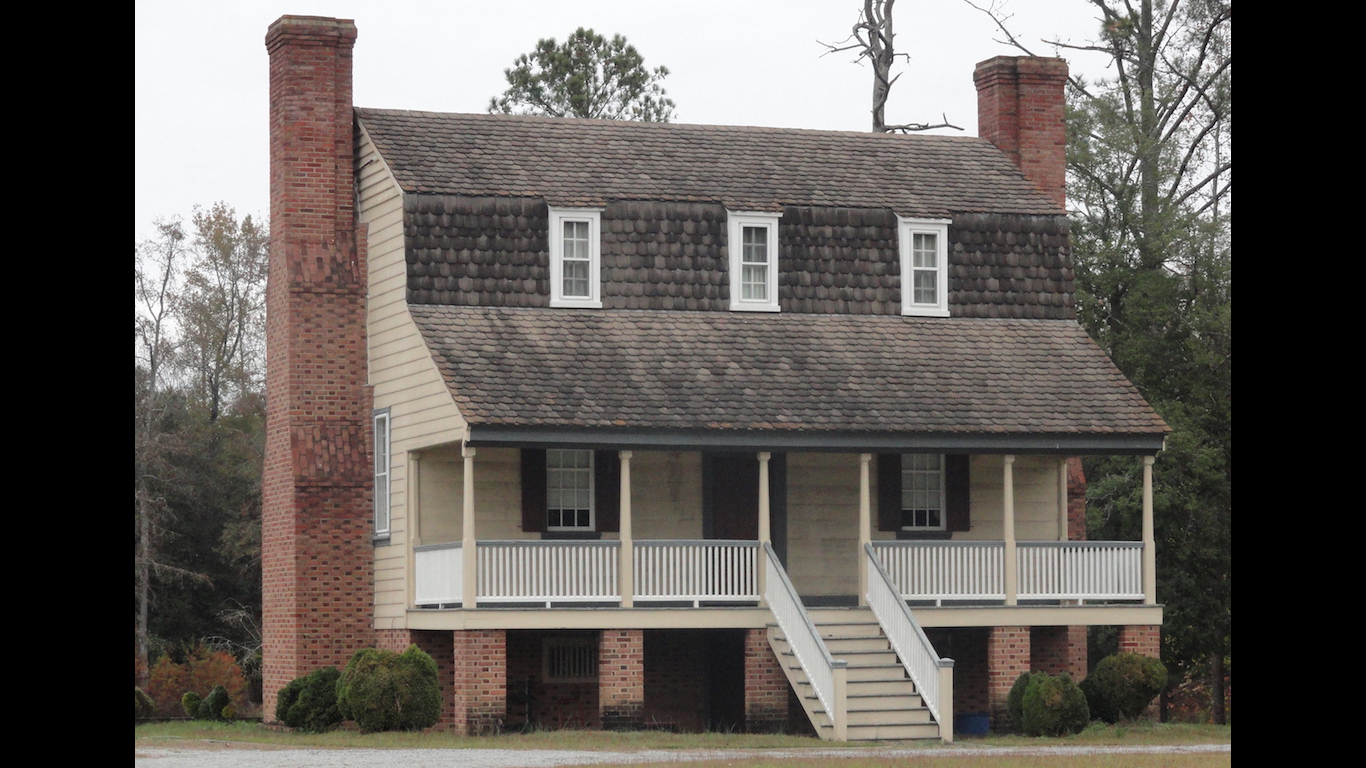
Source: Frank Womble / Wikimedia Commons
1944
Avg. floor area of a new single-family home: 837 sq. ft.
Avg. floor area per person: 228 sq. ft.
New homes started: 142,000
GDP per capita (inflation adjusted): $16,181
Source: Tony the Marine / Wikimedia Commons
1945
Avg. floor area of a new single-family home: 797 sq. ft.
Avg. floor area per person: 217 sq. ft.
New homes started: 326,000
GDP per capita (inflation adjusted): $15,850
Source: David Brossard / Wikimedia Commons
1946
Avg. floor area of a new single-family home: 817 sq. ft.
Avg. floor area per person: 223 sq. ft.
New homes started: 1,023,000
GDP per capita (inflation adjusted): $13,869
[in-text-ad-2]
Source: Jack Boucher / Historic American Buildings Survey / Wikimedia Commons
1947
Avg. floor area of a new single-family home: 903 sq. ft.
Avg. floor area per person: 254 sq. ft.
New homes started: 1,268,000
GDP per capita (inflation adjusted): $13,457
Source: Public Domain / Wikimedia Commons
1948
Avg. floor area of a new single-family home: 800 sq. ft.
Avg. floor area per person: 229 sq. ft.
New homes started: 1,362,000
GDP per capita (inflation adjusted): $13,776
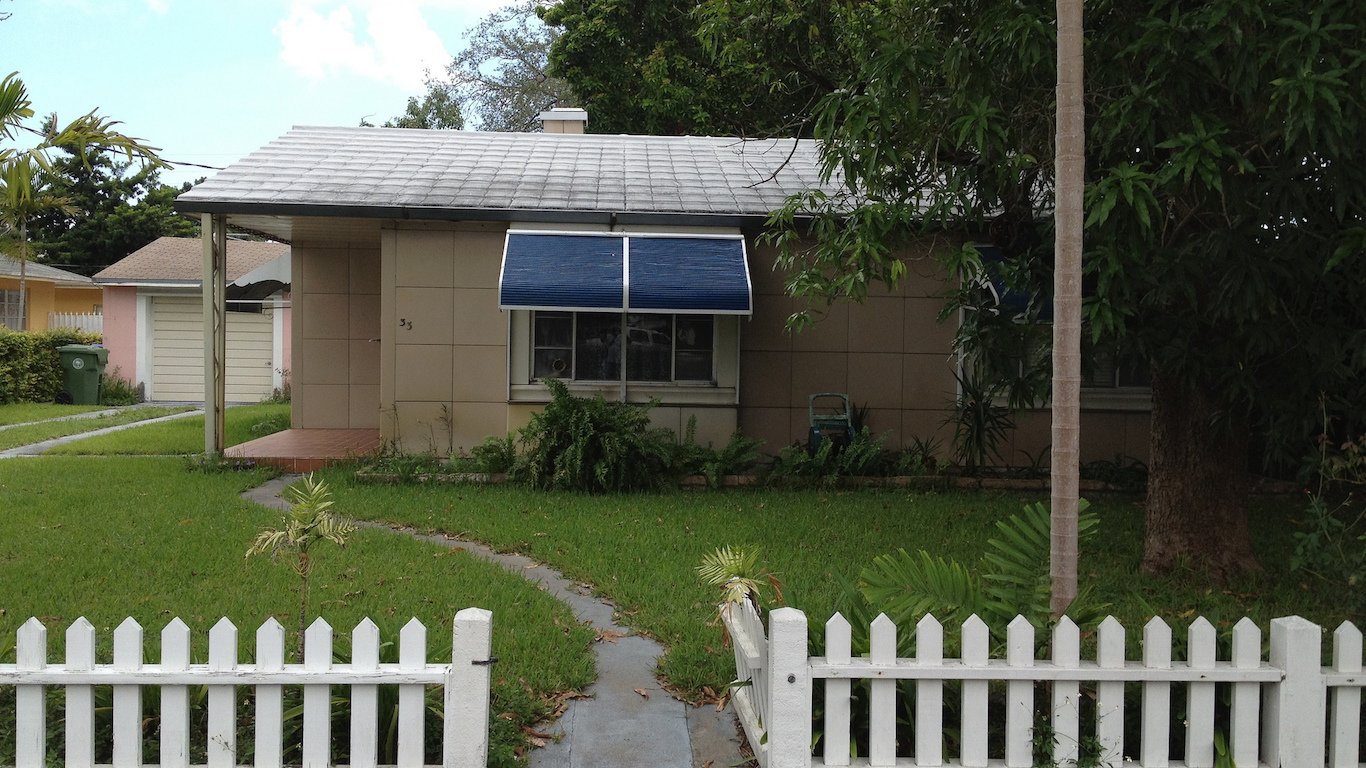
Source: Phillip Pessar / Flickr
1949
Avg. floor area of a new single-family home: 767 sq. ft.
Avg. floor area per person: 224 sq. ft.
New homes started: 1,466,000
GDP per capita (inflation adjusted): $13,466
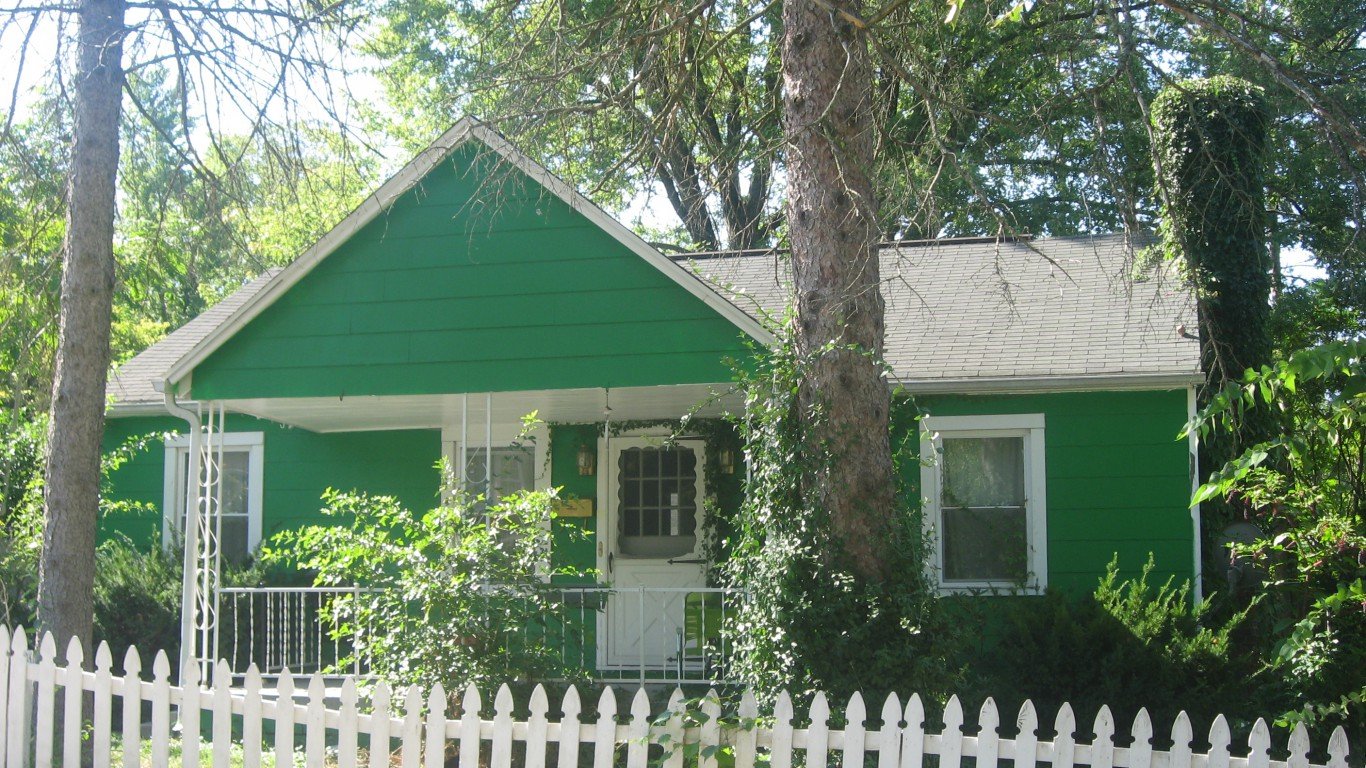
Source: Public Domain / Wikimedia Commons
1950
Avg. floor area of a new single-family home: 983 sq. ft.
Avg. floor area per person: 292 sq. ft.
New homes started: 1,952,000
GDP per capita (inflation adjusted): $14,398
[in-text-ad]
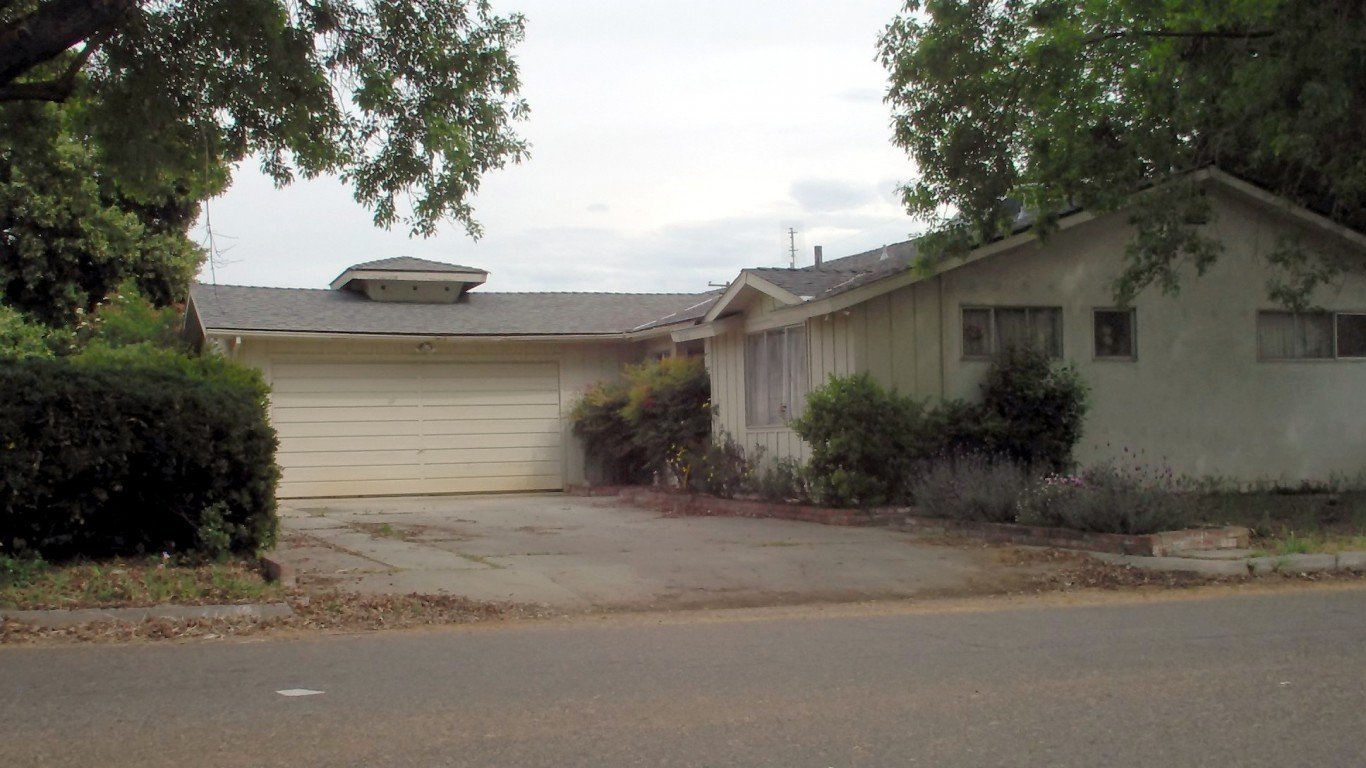
Source: Public Domain / Wikimedia Commons
1951
Avg. floor area of a new single-family home: 874 sq. ft.
Avg. floor area per person: 262 sq. ft.
New homes started: 1,491,000
GDP per capita (inflation adjusted): $15,296
Source: Rhyhey / Wikimedia Commons
1952
Avg. floor area of a new single-family home: 910 sq. ft.
Avg. floor area per person: 274 sq. ft.
New homes started: 1,504,000
GDP per capita (inflation adjusted): $15,649

Source: atlantic-kid / Getty Images
1953
Avg. floor area of a new single-family home: 917 sq. ft.
Avg. floor area per person: 279 sq. ft.
New homes started: 1,438,000
GDP per capita (inflation adjusted): $16,115
 24/7 Wall St.
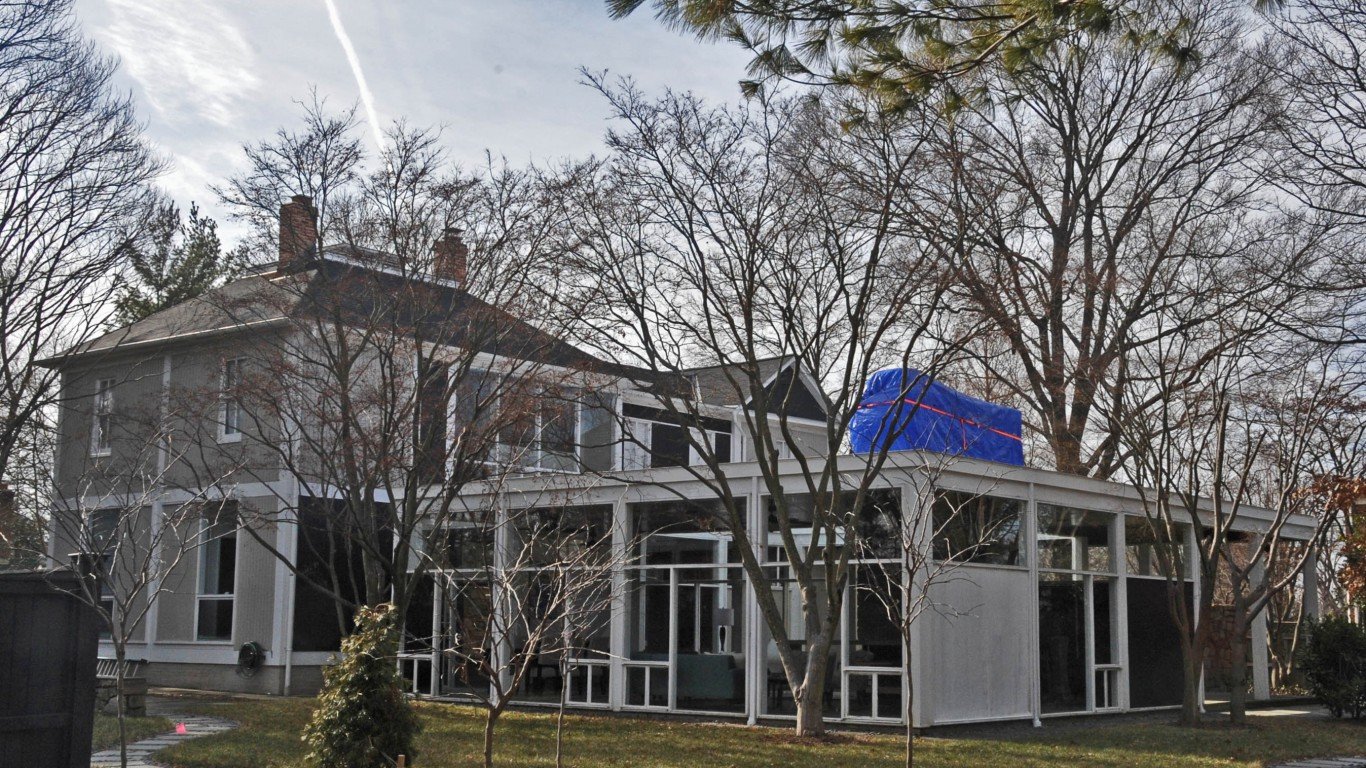
Source: Jerrye & Roy Klotz, MD / Wikimedia Commons
1954
Avg. floor area of a new single-family home: 1,140 sq. ft.
Avg. floor area per person: 341 sq. ft.
New homes started: 1,551,000
GDP per capita (inflation adjusted): $15,745
Source: Keystone / Getty Images
1955
Avg. floor area of a new single-family home: 1,170 sq. ft.
Avg. floor area per person: 351 sq. ft.
New homes started: 1,646,000
GDP per capita (inflation adjusted): $16,573
Source: Keystone Features / Getty Images
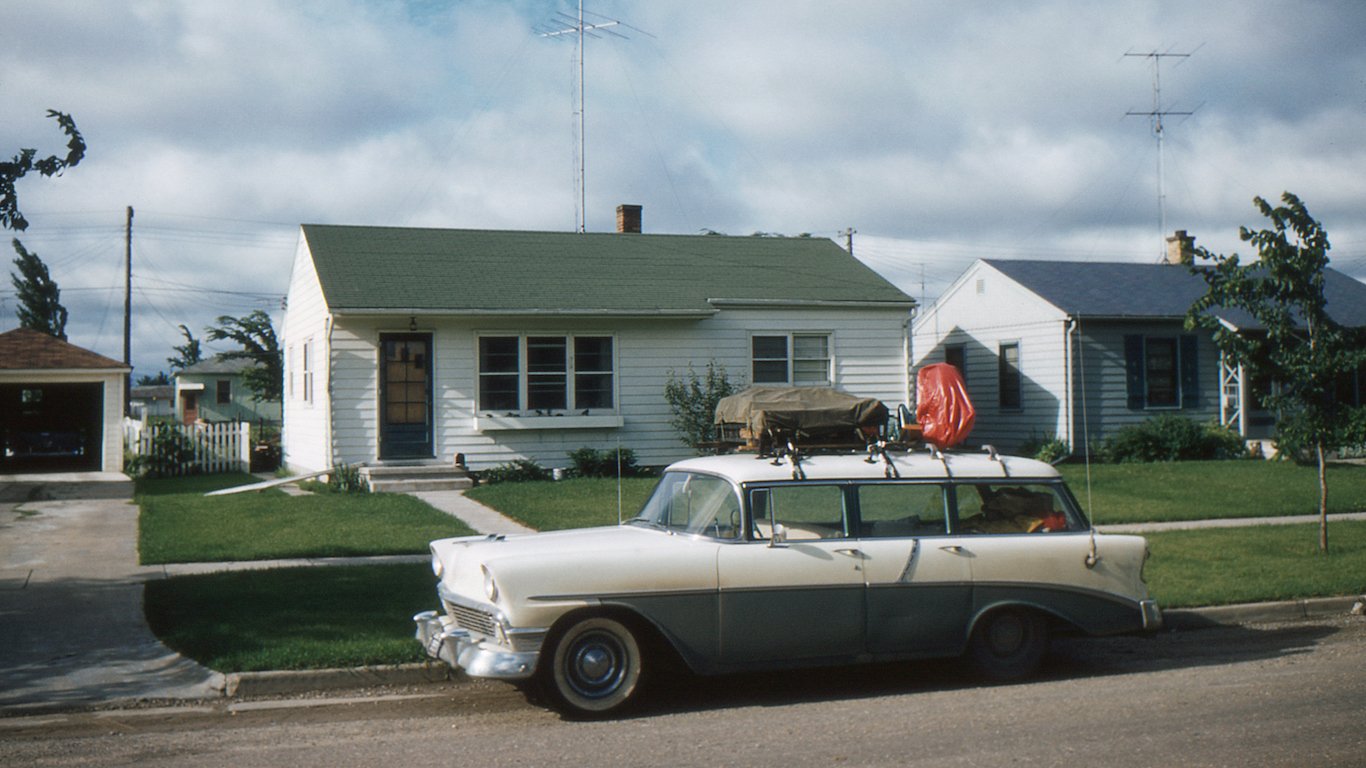
1956
Avg. floor area of a new single-family home: 1,230 sq. ft.
Avg. floor area per person: 370 sq. ft.
New homes started: 1,349,000
GDP per capita (inflation adjusted): $16,630
[in-text-ad-2]
Source: NNehring / Getty Images
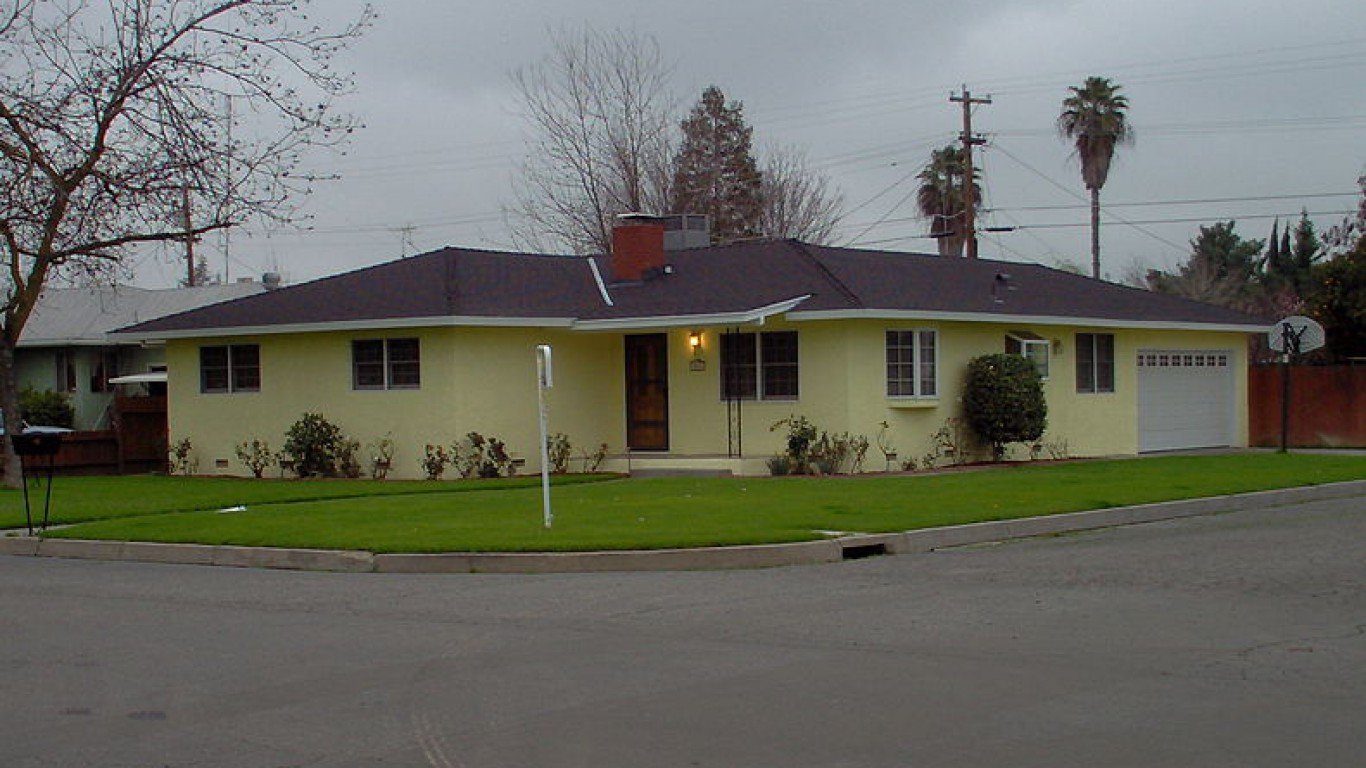
1957
Avg. floor area of a new single-family home: 1,305 sq. ft.
Avg. floor area per person: 392 sq. ft.
New homes started: 1,224,000
GDP per capita (inflation adjusted): $16,677
Source: Seattle Municipal Archives / Flickr
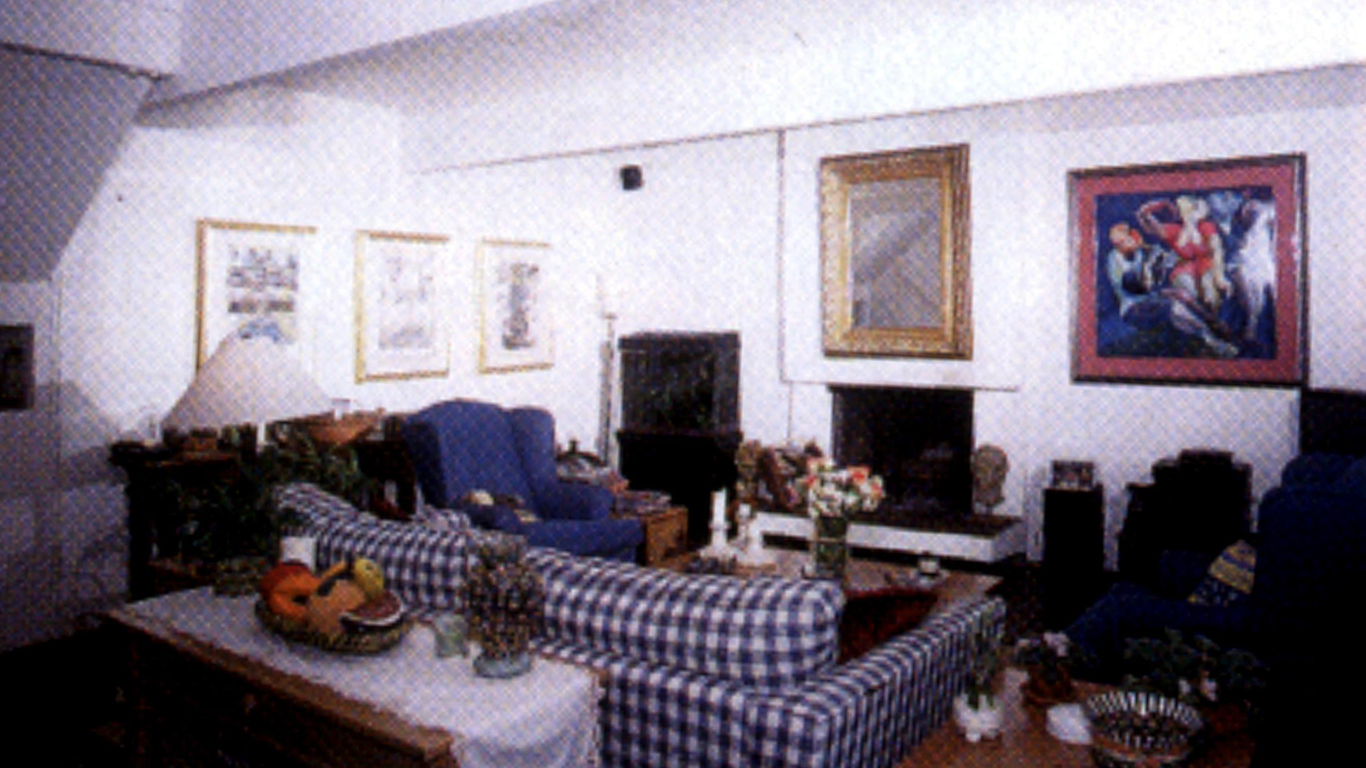
1958
Avg. floor area of a new single-family home: 1,289 sq. ft.
Avg. floor area per person: 386 sq. ft.
New homes started: 1,382,000
GDP per capita (inflation adjusted): $16,282
Source: Staff / Getty Images
1959
Avg. floor area of a new single-family home: 1,300 sq. ft.
Avg. floor area per person: 389 sq. ft.
New homes started: 1,554,000
GDP per capita (inflation adjusted): $17,112
Source: Public Domain / Wikimedia Commons
1960
Avg. floor area of a new single-family home: 1,289 sq. ft.
Avg. floor area per person: 387 sq. ft.
New homes started: 1,296,000
GDP per capita (inflation adjusted): $17,198
[in-text-ad]
Source: BoBSerrone / Wikimedia Commons
1961
Avg. floor area of a new single-family home: 1,284 sq. ft.
Avg. floor area per person: 382 sq. ft.
New homes started: 1,365,000
GDP per capita (inflation adjusted): $17,351
Source: Ron Frazier / Flickr
1962
Avg. floor area of a new single-family home: 1,309 sq. ft.
Avg. floor area per person: 396 sq. ft.
New homes started: 1,492,000
GDP per capita (inflation adjusted): $18,131
Source: DaveAlan / Getty Images
1963
Avg. floor area of a new single-family home: 1,450 sq. ft.
Avg. floor area per person: 435 sq. ft.
New homes started: 1,635,000
GDP per capita (inflation adjusted): $18,650
 24/7 Wall St.
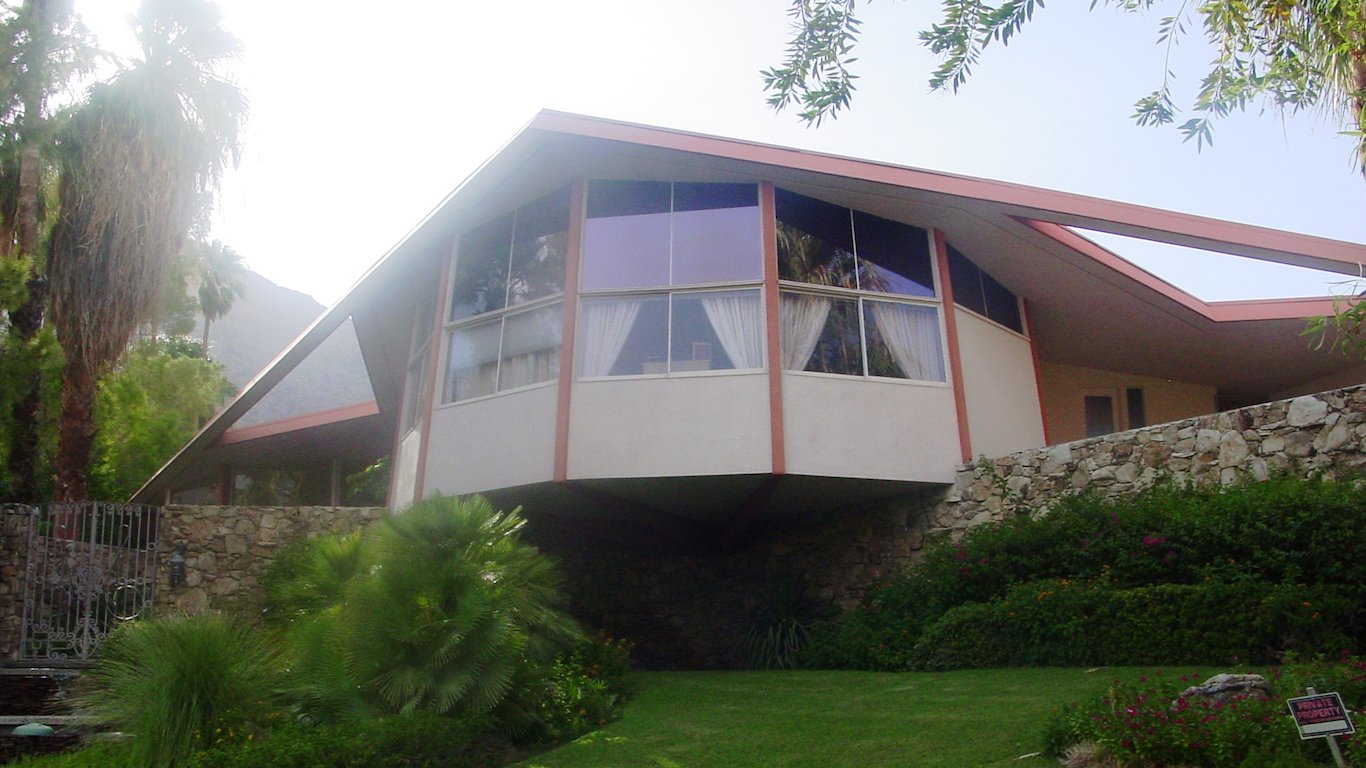
Source: Kansas Sebastian / Flickr
1964
Avg. floor area of a new single-family home: 1,470 sq. ft.
Avg. floor area per person: 441 sq. ft.
New homes started: 1,561,000
GDP per capita (inflation adjusted): $19,456
Source: Keystone / Getty Images
1965
Avg. floor area of a new single-family home: 1,525 sq. ft.
Avg. floor area per person: 461 sq. ft.
New homes started: 1,510,000
GDP per capita (inflation adjusted): $20,462
Source: Kansas Sebastian / Flickr
1966
Avg. floor area of a new single-family home: 1,570 sq. ft.
Avg. floor area per person: 476 sq. ft.
New homes started: 1,196,000
GDP per capita (inflation adjusted): $21,561
[in-text-ad-2]
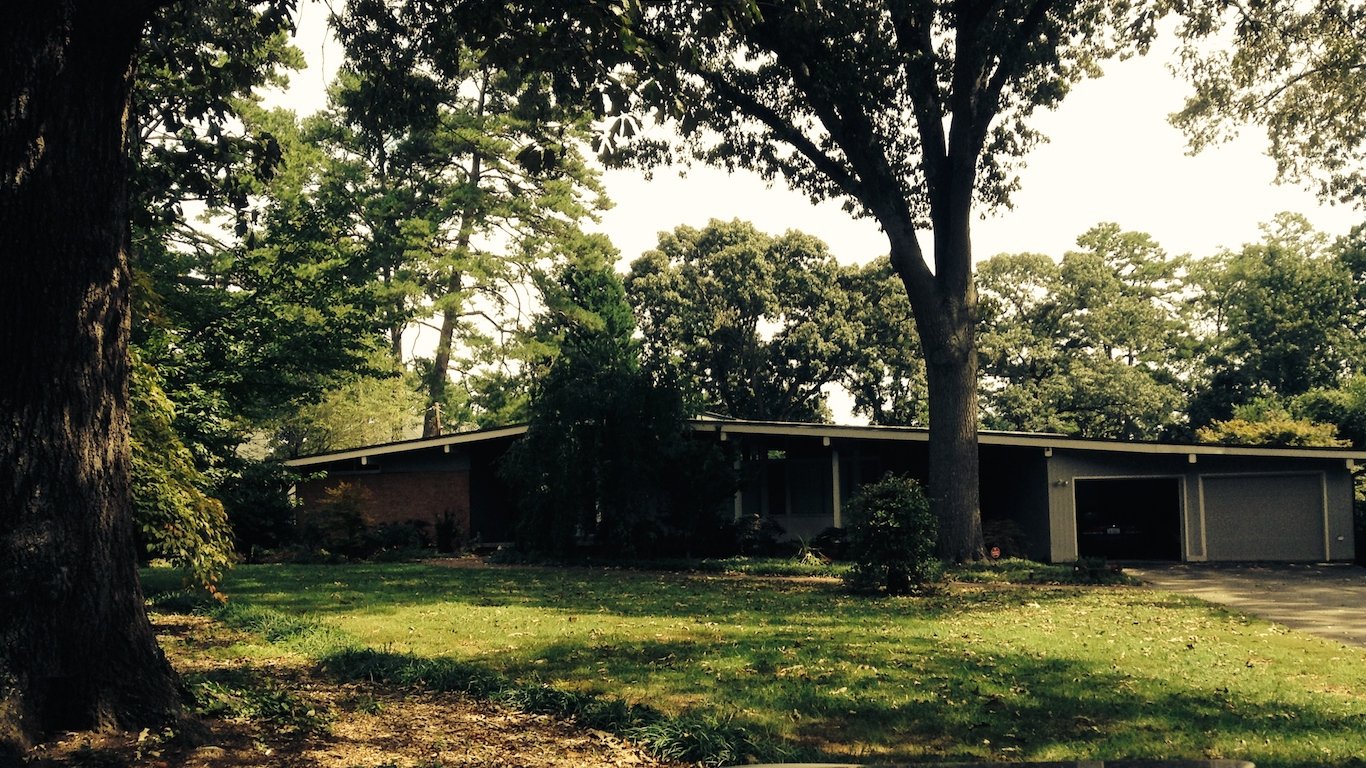
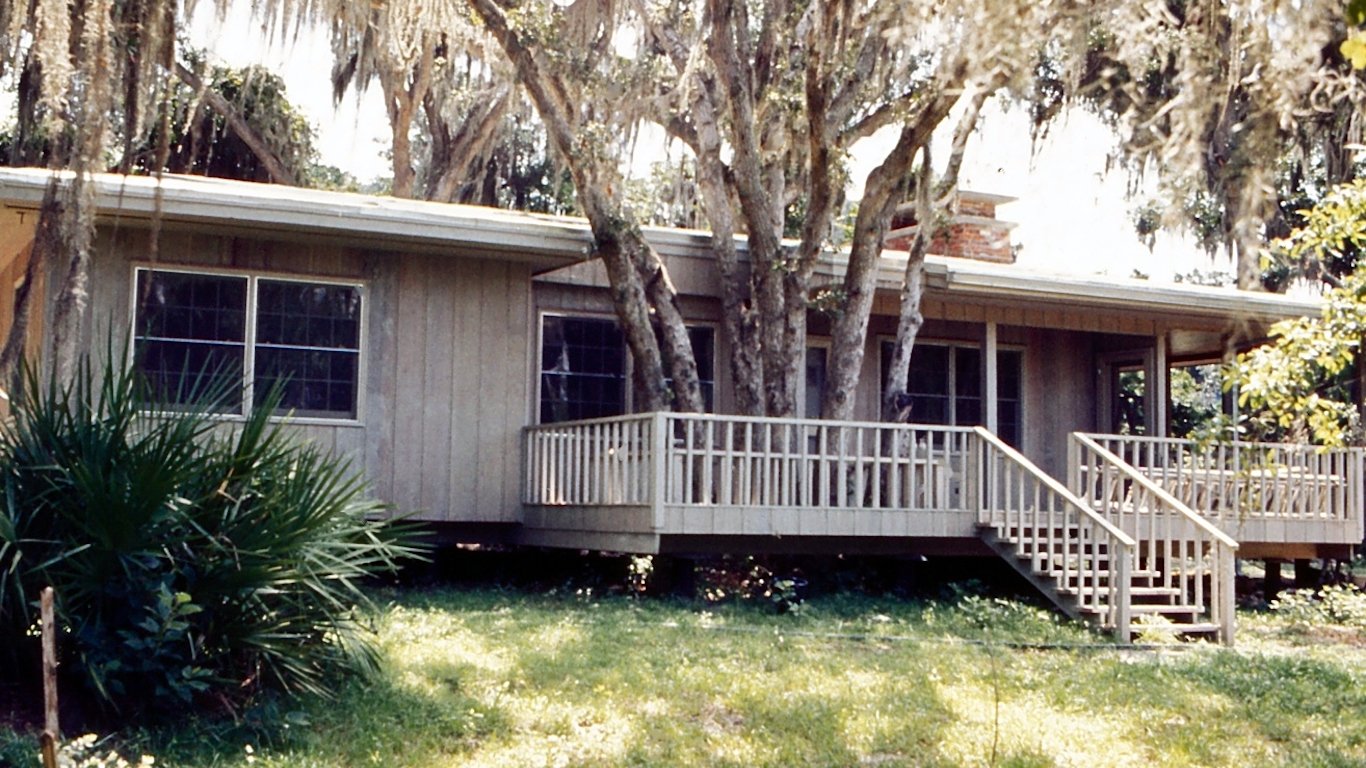
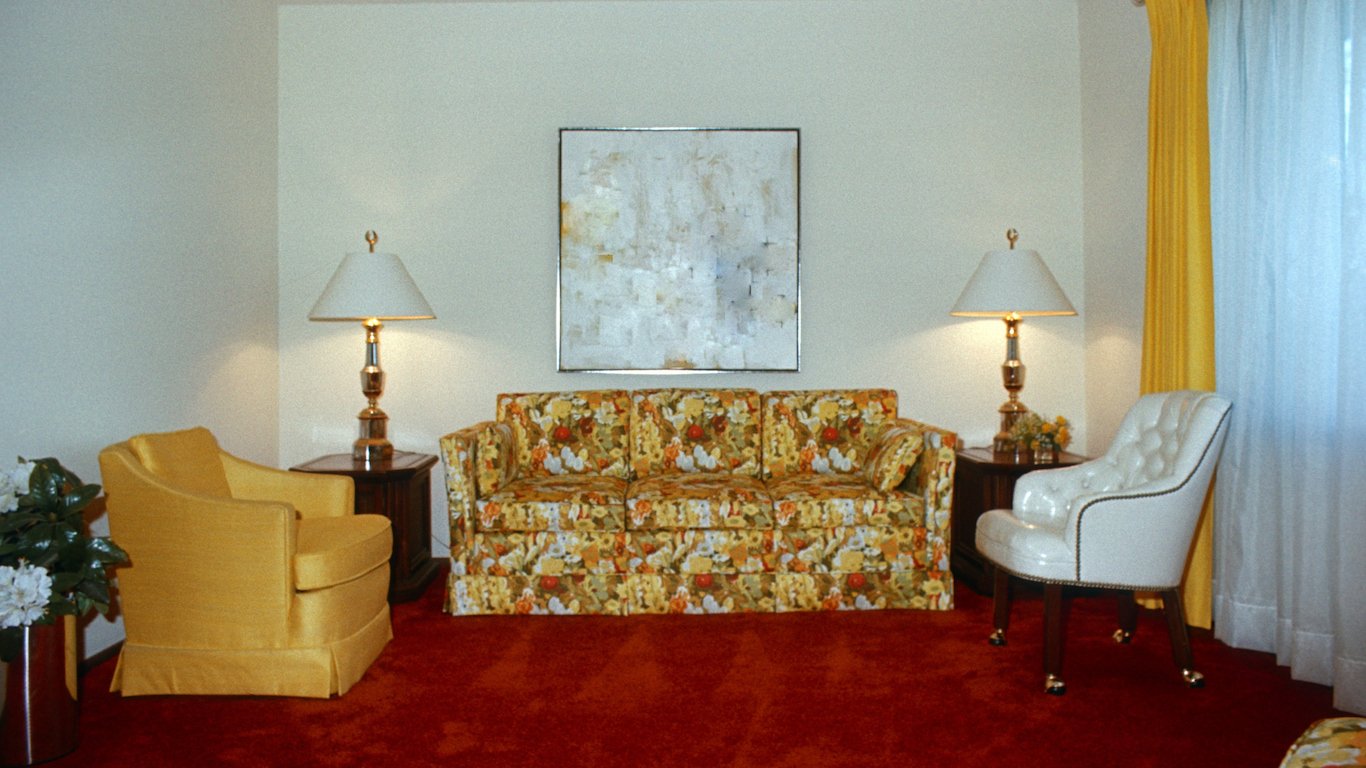
Source: Jerrye
1967
Avg. floor area of a new single-family home: 1,610 sq. ft.
Avg. floor area per person: 491 sq. ft.
New homes started: 1,322,000
GDP per capita (inflation adjusted): $21,913
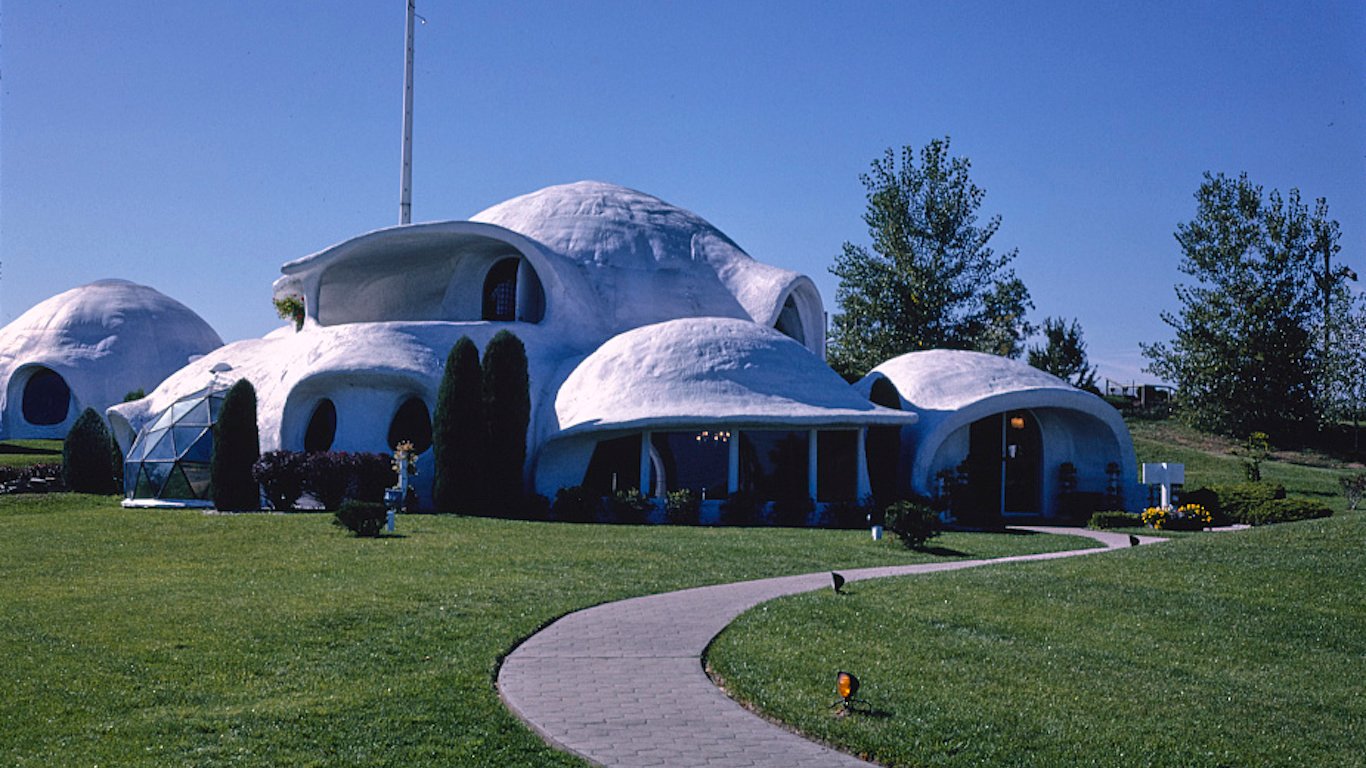
Source: Malcolm Manners / Flickr
1968
Avg. floor area of a new single-family home: 1,665 sq. ft.
Avg. floor area per person: 515 sq. ft.
New homes started: 1,545,000
GDP per capita (inflation adjusted): $22,760

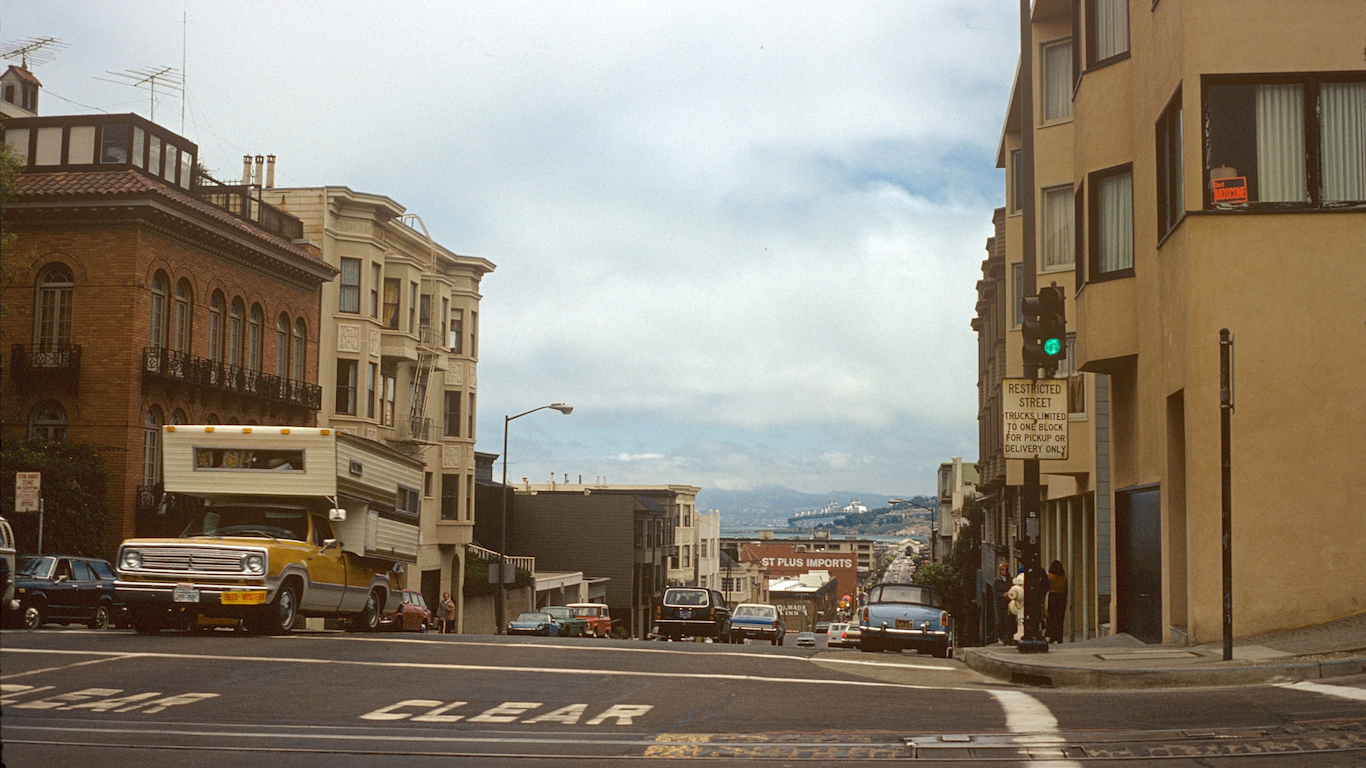
Source: Kansas Sebastian / Flickr
1969
Avg. floor area of a new single-family home: 1,640 sq. ft.
Avg. floor area per person: 514 sq. ft.
New homes started: 1,500,000
GDP per capita (inflation adjusted): $23,244
Source: JayLazarin / Getty Images
1970
Avg. floor area of a new single-family home: 1,500 sq. ft.
Avg. floor area per person: 478 sq. ft.
New homes started: 1,469,000
GDP per capita (inflation adjusted): $23,024
[in-text-ad]
Source: Barbara Ann Spengler / Flickr
1971
Avg. floor area of a new single-family home: 1,520 sq. ft.
Avg. floor area per person: 489 sq. ft.
New homes started: 2,052,200
GDP per capita (inflation adjusted): $23,485
Source: Roger W / Flickr
1972
Avg. floor area of a new single-family home: 1,555 sq. ft.
Avg. floor area per person: 508 sq. ft.
New homes started: 2,356,600
GDP per capita (inflation adjusted): $24,458
Source: onepony / iStock
1973
Avg. floor area of a new single-family home: 1,660 sq. ft.
Avg. floor area per person: 551 sq. ft.
New homes started: 2,045,000
GDP per capita (inflation adjusted): $25,593
Source: atlantic-kid / Getty Images
1974
Avg. floor area of a new single-family home: 1,695 sq. ft.
Avg. floor area per person: 571 sq. ft.
New homes started: 1,338,000
GDP per capita (inflation adjusted): $25,227

Source: vicnt / iStock
1975
Avg. floor area of a new single-family home: 1,645 sq. ft.
Avg. floor area per person: 560 sq. ft.
New homes started: 1,160,000
GDP per capita (inflation adjusted): $24,934
Source: Kevork Djansezian / Getty Images
1976
Avg. floor area of a new single-family home: 1,700 sq. ft.
Avg. floor area per person: 588 sq. ft.
New homes started: 1,538,000
GDP per capita (inflation adjusted): $26,024
[in-text-ad-2]
Source: Joe Haupt / Flickr
1977
Avg. floor area of a new single-family home: 1,720 sq. ft.
Avg. floor area per person: 601 sq. ft.
New homes started: 1,987,000
GDP per capita (inflation adjusted): $26,951
Source: TennesseePhotographer / iStock
1978
Avg. floor area of a new single-family home: 1,755 sq. ft.
Avg. floor area per person: 625 sq. ft.
New homes started: 2,020,000
GDP per capita (inflation adjusted): $28,151
Source: atlantic-kid / iStock
1979
Avg. floor area of a new single-family home: 1,760 sq. ft.
Avg. floor area per person: 633 sq. ft.
New homes started: 1,745,000
GDP per capita (inflation adjusted): $28,725
Source: The Library of Congress / Flickr
1980
Avg. floor area of a new single-family home: 1,740 sq. ft.
Avg. floor area per person: 630 sq. ft.
New homes started: 1,292,000
GDP per capita (inflation adjusted): $28,325
[in-text-ad]

Source: PhotosByPaulReitmeir / Getty Images
1981
Avg. floor area of a new single-family home: 1,720 sq. ft.
Avg. floor area per person: 630 sq. ft.
New homes started: 1,084,000
GDP per capita (inflation adjusted): $28,772
Source: atlantic-kid / Getty Images
1982
Avg. floor area of a new single-family home: 1,710 sq. ft.
Avg. floor area per person: 629 sq. ft.
New homes started: 1,062,000
GDP per capita (inflation adjusted): $27,953
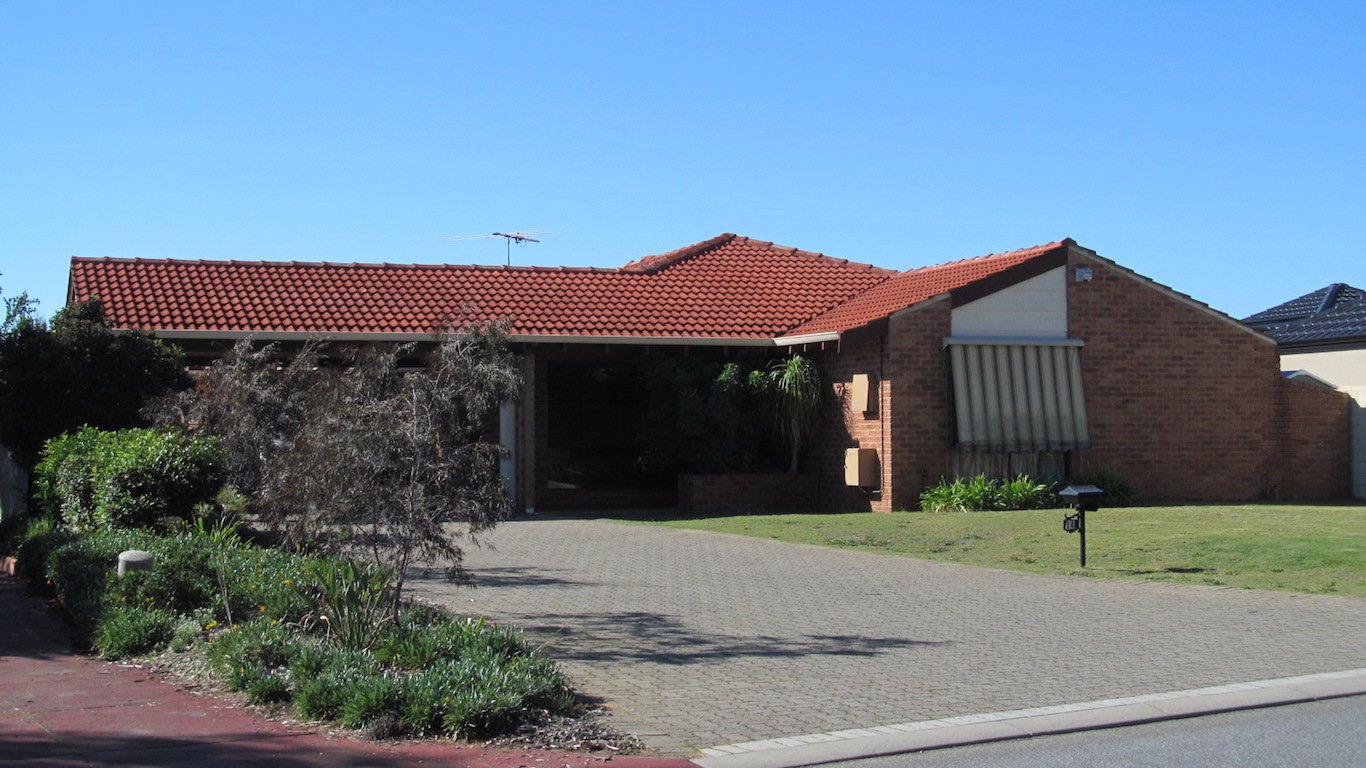
Source: Orderinchaos / Wikimedia Commons
1983
Avg. floor area of a new single-family home: 1,725 sq. ft.
Avg. floor area per person: 632 sq. ft.
New homes started: 1,703,000
GDP per capita (inflation adjusted): $28,984
Source: Steven Martin / Flickr
1984
Avg. floor area of a new single-family home: 1,780 sq. ft.
Avg. floor area per person: 657 sq. ft.
New homes started: 1,750,000
GDP per capita (inflation adjusted): $30,817
Source: NNehring / Getty Images
1985
Avg. floor area of a new single-family home: 1,785 sq. ft.
Avg. floor area per person: 664 sq. ft.
New homes started: 1,742,000
GDP per capita (inflation adjusted): $31,839
Source: Roger W / Flickr
1986
Avg. floor area of a new single-family home: 1,825 sq. ft.
Avg. floor area per person: 684 sq. ft.
New homes started: 1,805,000
GDP per capita (inflation adjusted): $32,659
[in-text-ad-2]
Source: Roger W / Flickr
1987
Avg. floor area of a new single-family home: 1,905 sq. ft.
Avg. floor area per person: 716 sq. ft.
New homes started: 1,621,000
GDP per capita (inflation adjusted): $33,489

Source: Joe Shlabotnik / Flickr
1988
Avg. floor area of a new single-family home: 1,995 sq. ft.
Avg. floor area per person: 756 sq. ft.
New homes started: 1,488,000
GDP per capita (inflation adjusted): $34,581
Source: Britta Gustafson / Flickr
1989
Avg. floor area of a new single-family home: 2,035 sq. ft.
Avg. floor area per person: 777 sq. ft.
New homes started: 1,376,000
GDP per capita (inflation adjusted): $35,517
Source: Will Hart / Flickr
1990
Avg. floor area of a new single-family home: 2,080 sq. ft.
Avg. floor area per person: 791 sq. ft.
New homes started: 1,193,000
GDP per capita (inflation adjusted): $35,794
[in-text-ad]
Source: Joe Raedle / Getty Images
1991
Avg. floor area of a new single-family home: 2,075 sq. ft.
Avg. floor area per person: 789 sq. ft.
New homes started: 1,014,000
GDP per capita (inflation adjusted): $35,295
Source: Bob Epstein / Wikimedia Commons
1992
Avg. floor area of a new single-family home: 2,095 sq. ft.
Avg. floor area per person: 800 sq. ft.
New homes started: 1,200,000
GDP per capita (inflation adjusted): $36,068
Source: davelogan / iStock
1993
Avg. floor area of a new single-family home: 2,095 sq. ft.
Avg. floor area per person: 788 sq. ft.
New homes started: 1,288,000
GDP per capita (inflation adjusted): $36,580
 24/7 Wall St.
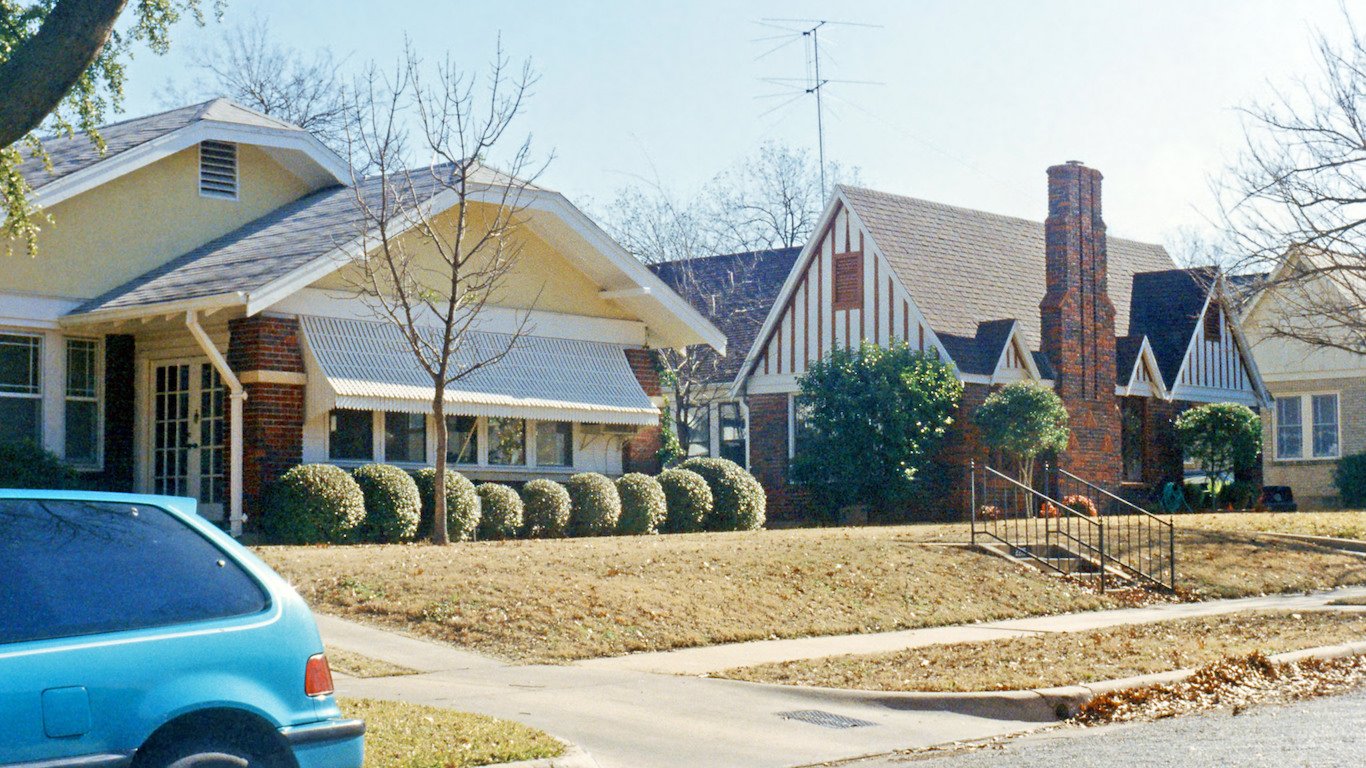
Source: Steven Martin / Flickr
1994
Avg. floor area of a new single-family home: 2,100 sq. ft.
Avg. floor area per person: 787 sq. ft.
New homes started: 1,457,000
GDP per capita (inflation adjusted): $37,598
Source: davelogan / iStock
1995
Avg. floor area of a new single-family home: 2,095 sq. ft.
Avg. floor area per person: 791 sq. ft.
New homes started: 1,354,000
GDP per capita (inflation adjusted): $38,167

Source: DarioEgidi / iStock
1996
Avg. floor area of a new single-family home: 2,120 sq. ft.
Avg. floor area per person: 800 sq. ft.
New homes started: 1,477,000
GDP per capita (inflation adjusted): $39,156
[in-text-ad-2]

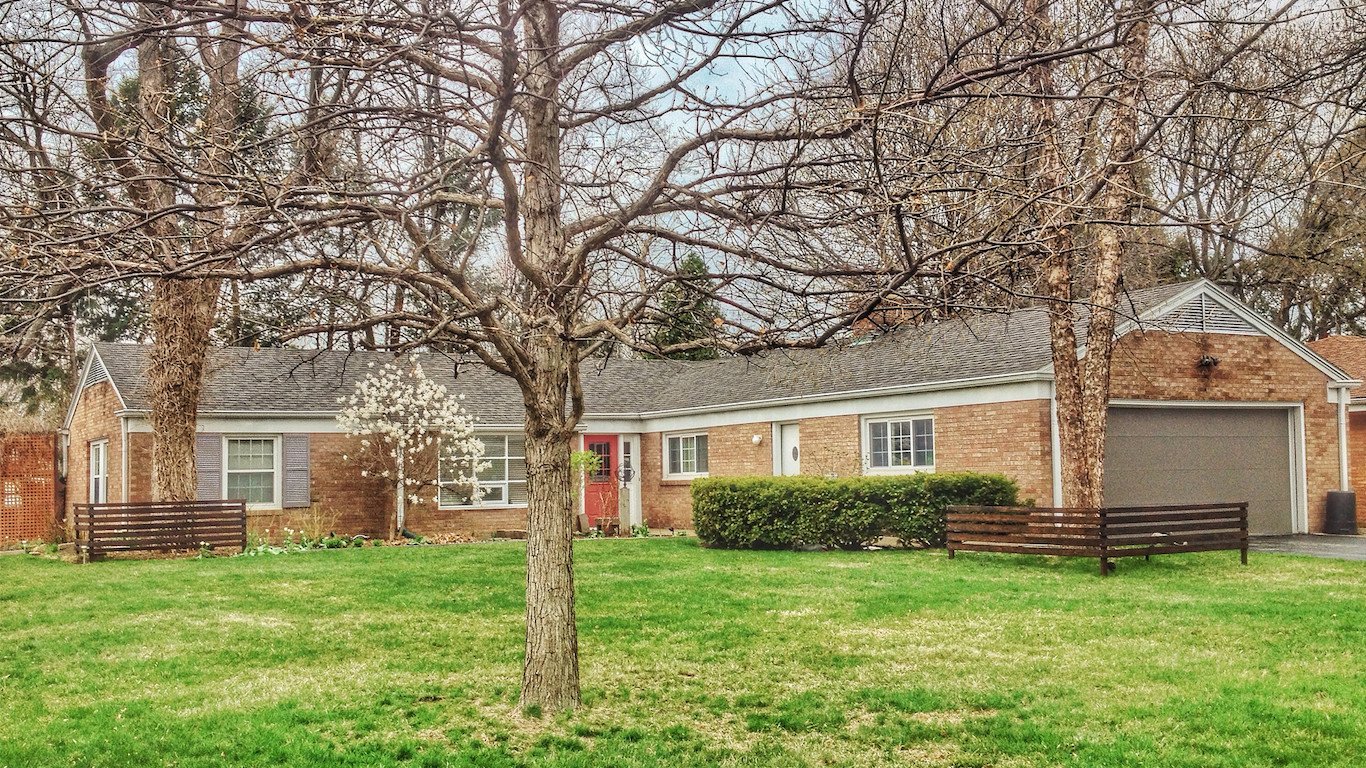
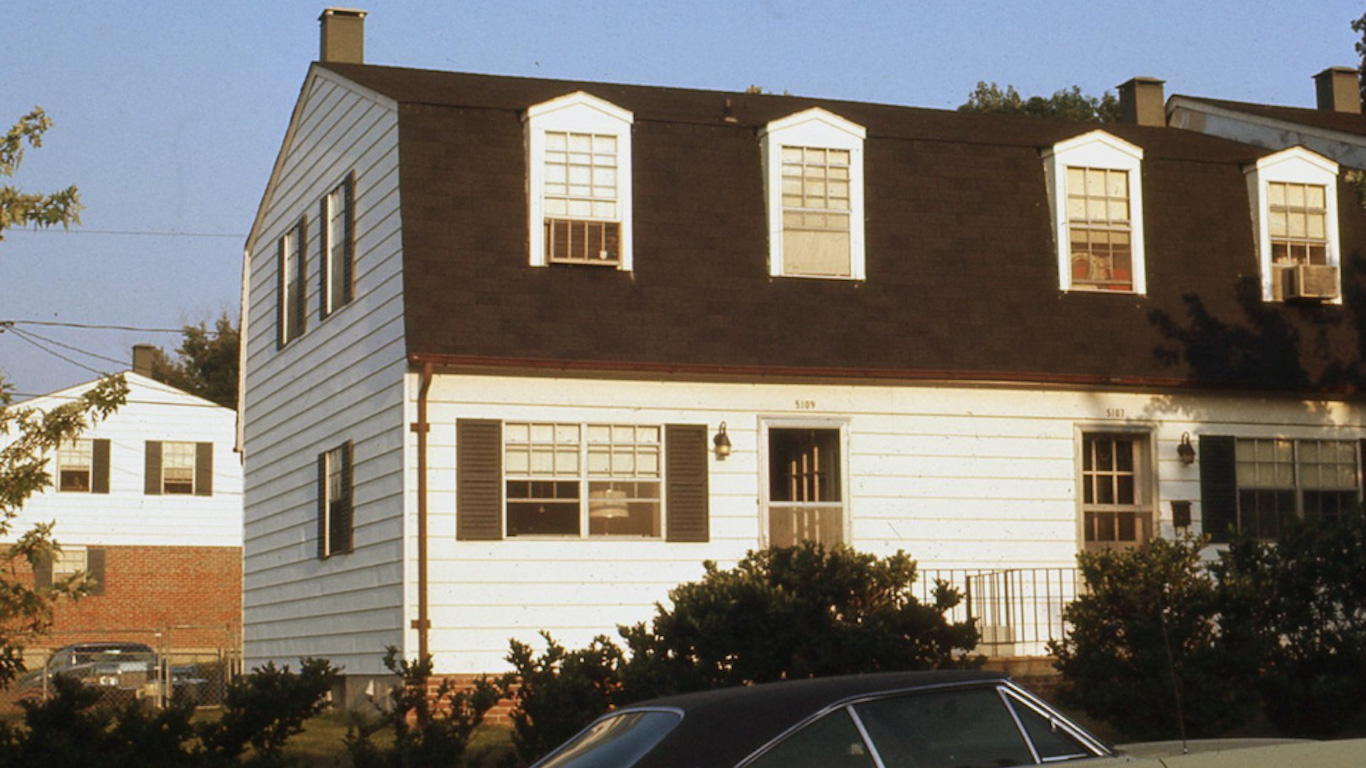
Source: http://wikivisually.com/wiki/Category:Houses_in_Greensboro,_North_Carolina
1997
Avg. floor area of a new single-family home: 2,150 sq. ft.
Avg. floor area per person: 814 sq. ft.
New homes started: 1,474,000
GDP per capita (inflation adjusted): $40,427
Source: r4mz0rz / iStock
1998
Avg. floor area of a new single-family home: 2,190 sq. ft.
Avg. floor area per person: 836 sq. ft.
New homes started: 1,617,000
GDP per capita (inflation adjusted): $41,737
Source: Bart Everson / Wikimedia Commons
1999
Avg. floor area of a new single-family home: 2,223 sq. ft.
Avg. floor area per person: 852 sq. ft.
New homes started: 1,640,900
GDP per capita (inflation adjusted): $43,196
Source: Andreas F. Borchert / Wikimedia Commons
2000
Avg. floor area of a new single-family home: 2,266 sq. ft.
Avg. floor area per person: 865 sq. ft.
New homes started: 1,568,700
GDP per capita (inflation adjusted): $44,475
[in-text-ad]
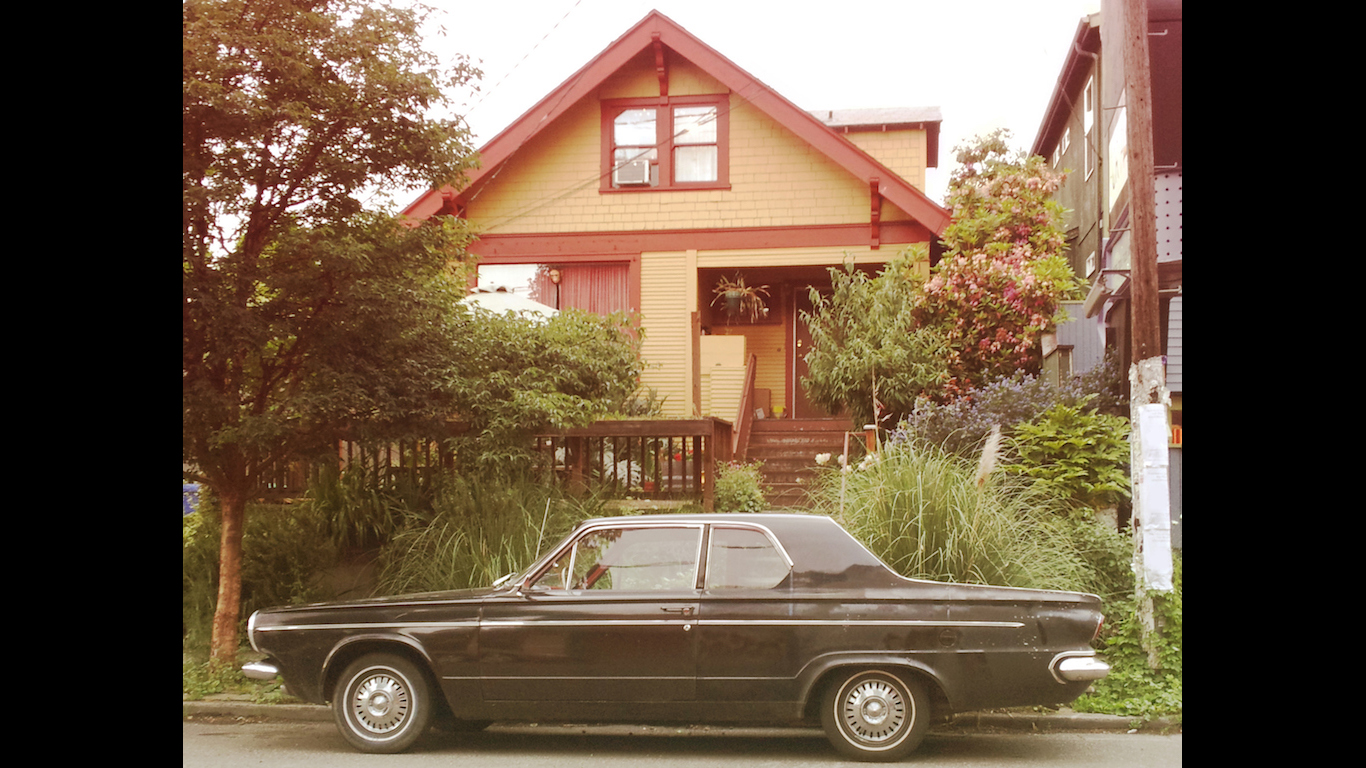
Source: Roger W / Flickr
2001
Avg. floor area of a new single-family home: 2,324 sq. ft.
Avg. floor area per person: 901 sq. ft.
New homes started: 1,602,700
GDP per capita (inflation adjusted): $44,464
Source: Andreas F. Borchert / Wikimedia Commons
2002
Avg. floor area of a new single-family home: 2,320 sq. ft.
Avg. floor area per person: 899 sq. ft.
New homes started: 1,704,900
GDP per capita (inflation adjusted): $44,829
Source: Summerworld / Wikimedia Commons
2003
Avg. floor area of a new single-family home: 2,330 sq. ft.
Avg. floor area per person: 907 sq. ft.
New homes started: 1,847,700
GDP per capita (inflation adjusted): $45,664
 24/7 Wall St.
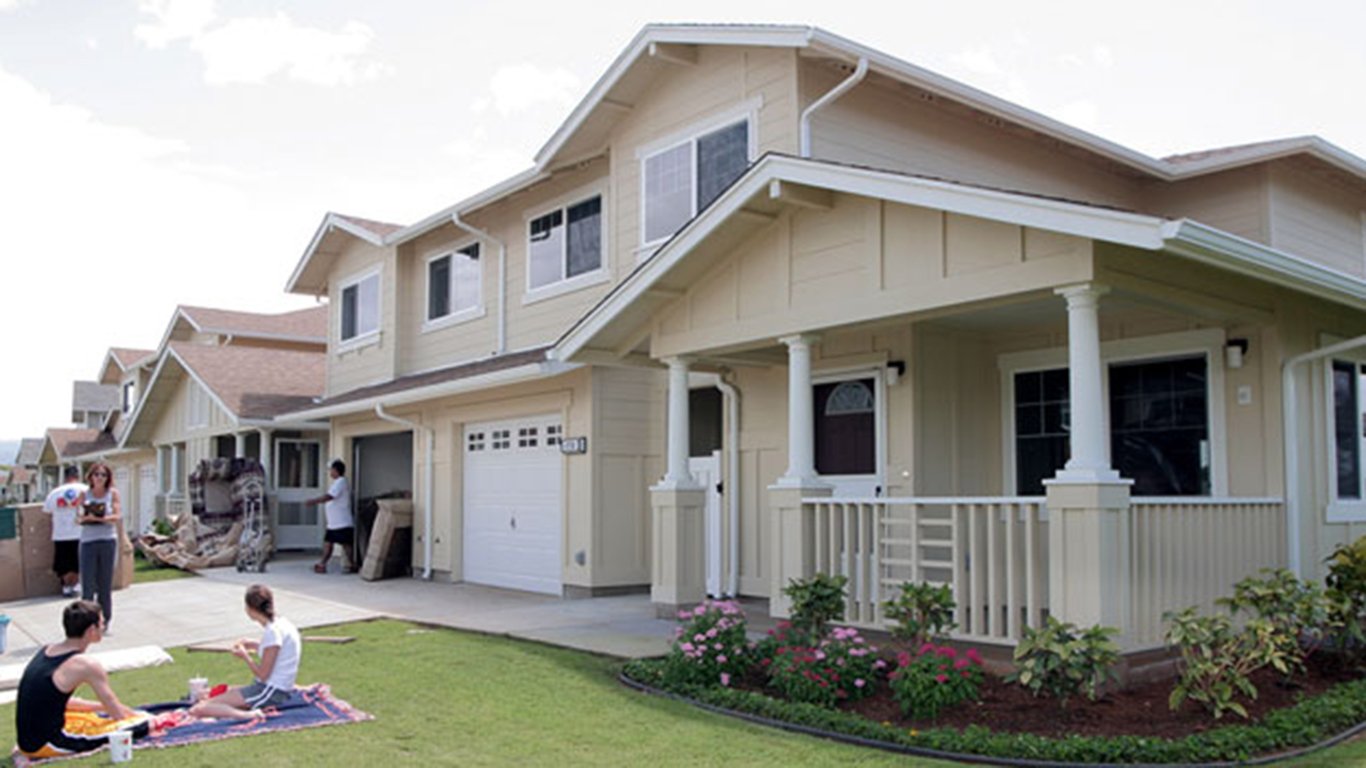
Source: U.S. Navy photo by Bob Goodwin
2004
Avg. floor area of a new single-family home: 2,349 sq. ft.
Avg. floor area per person: 914 sq. ft.
New homes started: 1,955,800
GDP per capita (inflation adjusted): $46,967
Source: irina88w / iStock
2005
Avg. floor area of a new single-family home: 2,434 sq. ft.
Avg. floor area per person: 947 sq. ft.
New homes started: 2,068,300
GDP per capita (inflation adjusted): $48,090
Source: BrendelSignature / Wikimedia Commons
2006
Avg. floor area of a new single-family home: 2,469 sq. ft.
Avg. floor area per person: 961 sq. ft.
New homes started: 1,800,900
GDP per capita (inflation adjusted): $48,905
[in-text-ad-2]
Source: EugeneZelenko / Wikimedia Commons
2007
Avg. floor area of a new single-family home: 2,521 sq. ft.
Avg. floor area per person: 985 sq. ft.
New homes started: 1,355,000
GDP per capita (inflation adjusted): $49,300
Source: Eugene Zelenko / Wikimedia Commons
2008
Avg. floor area of a new single-family home: 2,519 sq. ft.
Avg. floor area per person: 984 sq. ft.
New homes started: 905,500
GDP per capita (inflation adjusted): $48,697
Source: David Eubanks / Flickr
2009
Avg. floor area of a new single-family home: 2,438 sq. ft.
Avg. floor area per person: 949 sq. ft.
New homes started: 554,000
GDP per capita (inflation adjusted): $46,930
Source: JimmayQ / Flickr
2010
Avg. floor area of a new single-family home: 2,392 sq. ft.
Avg. floor area per person: 924 sq. ft.
New homes started: 586,900
GDP per capita (inflation adjusted): $47,721
[in-text-ad]
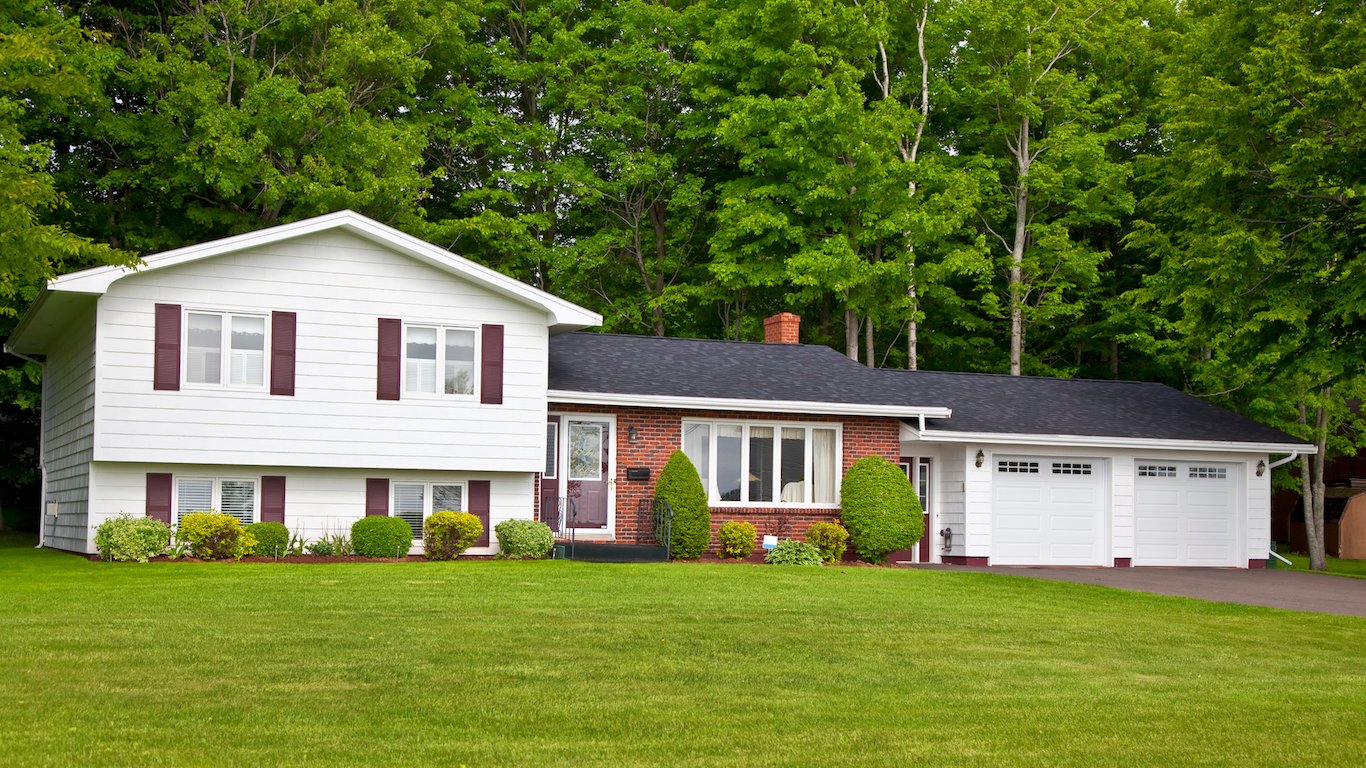
Source: tab1962 / iStock
2011
Avg. floor area of a new single-family home: 2,480 sq. ft.
Avg. floor area per person: 969 sq. ft.
New homes started: 608,800
GDP per capita (inflation adjusted): $48,128
Source: peterspiro / iStock
2012
Avg. floor area of a new single-family home: 2,505 sq. ft.
Avg. floor area per person: 982 sq. ft.
New homes started: 780,600
GDP per capita (inflation adjusted): $48,842
 24/7 Wall St.
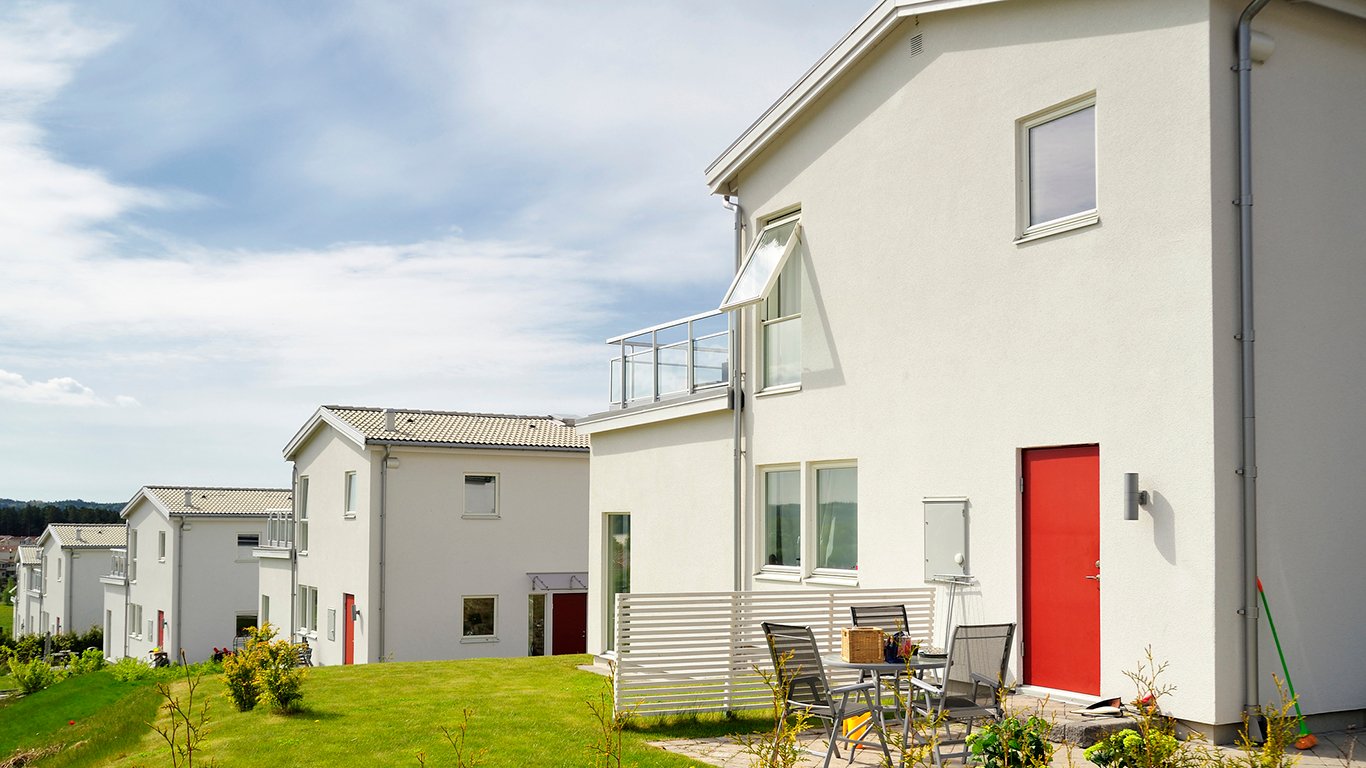
Source: a40757 / iStock
2013
Avg. floor area of a new single-family home: 2,598 sq. ft.
Avg. floor area per person: 1,023 sq. ft.
New homes started: 924,900
GDP per capita (inflation adjusted): $49,312
Source: IP Galanternik D.U. / iStock
2014
Avg. floor area of a new single-family home: 2,657 sq. ft.
Avg. floor area per person: 1,046 sq. ft.
New homes started: 1,003,300
GDP per capita (inflation adjusted): $50,206
[in-text-ad-2]
Source: hikesterson / iStock
2015
Avg. floor area of a new single-family home: 2,687 sq. ft.
Avg. floor area per person: 1,058 sq. ft.
New homes started: 1,111,800
GDP per capita (inflation adjusted): $51,262

Source: Korisbo / iStock
2016
Avg. floor area of a new single-family home: 2,640 sq. ft.
Avg. floor area per person: 1,039 sq. ft.
New homes started: 1,173,800
GDP per capita (inflation adjusted): $51,646
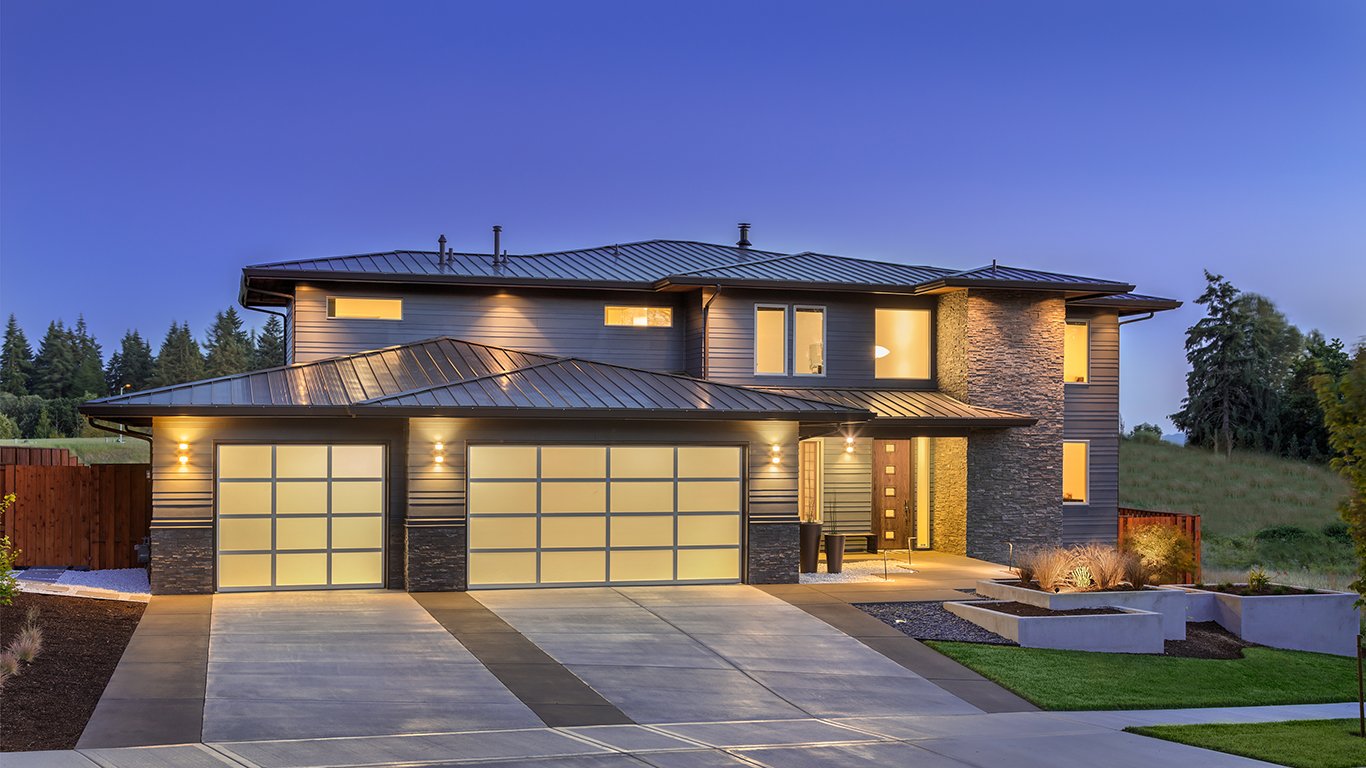
Source: KenWiedemann / Getty Images
2017
Avg. floor area of a new single-family home: 2,631 sq. ft.
Avg. floor area per person: 1,035 sq. ft.
New homes started: 1,152,900
GDP per capita (inflation adjusted): $53,128
Methodology
To determine the average size of a newly constructed single-family home between 1971 and 2017, 24/7 Wall St. used survey data from the Census Bureau’s American Housing Survey. For the years 1963 and 1970 we used data from the Census Bureau’s U.S. Department of Housing and Urban Development’s 1969 “Characteristics of New One-Family Homes” construction report. For the years 1940, 1950, and 1954 to 1956, we used the Bureau of Labor Statistics New Housing and its Materials 1940-56 report. For all other years, we estimated the average size of a newly constructed home using construction data on residential housing starts and total residential floor space constructed in a given year from the Census Bureau’s annual “Statistical Abstracts of the United States” and its “Historical Statistics of the United States, Colonial Times to 1970” report. We took the quotient of total residential floor space and total residential housing starts and made adjustments to account for the inclusion of multi-family housing units and exclusion of various states in the national tally of total floor space constructed. We also adjusted housing starts to better approximate housing completions. Average household size also came from the Census Bureau. GDP per capita figures for years 1929 to 2017 are from the Bureau of Economic Analysis. GDP per capita figures for years 1920 to 1928, which were not available from the BEA, came from estimates by the Maddison Project.
Sponsored: Attention Savvy Investors: Speak to 3 Financial Experts – FREE
Ever wanted an extra set of eyes on an investment you’re considering? Now you can speak with up to 3 financial experts in your area for FREE. By simply
clicking here you can begin to match with financial professionals who can help guide you through the financial decisions you’re making. And the best part? The first conversation with them is free.
Click here to match with up to 3 financial pros who would be excited to help you make financial decisions.
Thank you for reading! Have some feedback for us?
Contact the 24/7 Wall St. editorial team.
Editors' Picks

