
The share of American workers in unions fell once again in 2018, from 10.7% in 2017 to 10.5%. The decline is part of a much longer-term trend of the slow and steady disintegration of organized labor in the United States. In 1983, according to the Bureau of Labor Statistics, 20.1% of American workers were union members.
Labor unions exist to increase the collective bargaining power of their members to negotiate higher wages and better benefits. And historically, they have done just that. According to the Bureau of Labor Statistics, the typical non-union worker earns just under 80% of the wages of the typical unionized worker on a weekly basis. Labor unions have also helped to greatly improve benefits and reduce pay inequality along racial and gender lines.
While unions provide some benefits to workers, anti-union advocates argue that unions stifle economic growth, limit corporate competitiveness, and unfairly pass higher costs down to the consumer or taxpayer. They argue that states that have passed right-to-work legislation — laws that prohibit unions from requiring workers in certain trades to be due-paying members — are better states for business. Currently, 27 states have passed right-to-work laws.
Labor unions are an inherently political issue, and some states are more likely to be receptive to collective bargaining than others. 24/7 Wall St. reviewed data from the Bureau of Labor Statistics to identify the states where union membership is the strongest and the weakest.
The public sector is much more heavily unionized than the private sector — 33.9% of public-sector workers are union members compared to 6.4% of those in the private sector. For this reason, states where government employment represents a larger share of total workers tend to have stronger overall union representation.
Methodology
Based on figures published by Unionstats.com, an online union membership and coverage database, 24/7 Wall St. identified the states with the highest and lowest union membership as a percentage of total employment. The database, which analyzes Bureau of Labor Statistics’ Current Population Survey, provides labor force and union membership figures in both the public and private sectors. Annual average wages by state came from Bureau of Economic Analysis. Rates of change in union membership were calculated over the period of 2008 to 2018.
Click here to see the states with the strongest and weakest unions.

Source: maximkabb / Getty Images
1. Hawaii
> Pct. of workers in unions: 23.1%
> Change in union membership (2008-2018): -1.2 ppt. (25th largest decrease)
> Union workers: 138,854 (24th fewest)
> Avg. annual wage: $50,968 (22nd highest)
[in-text-ad]
Source: Ultima_Gaina / Getty Images
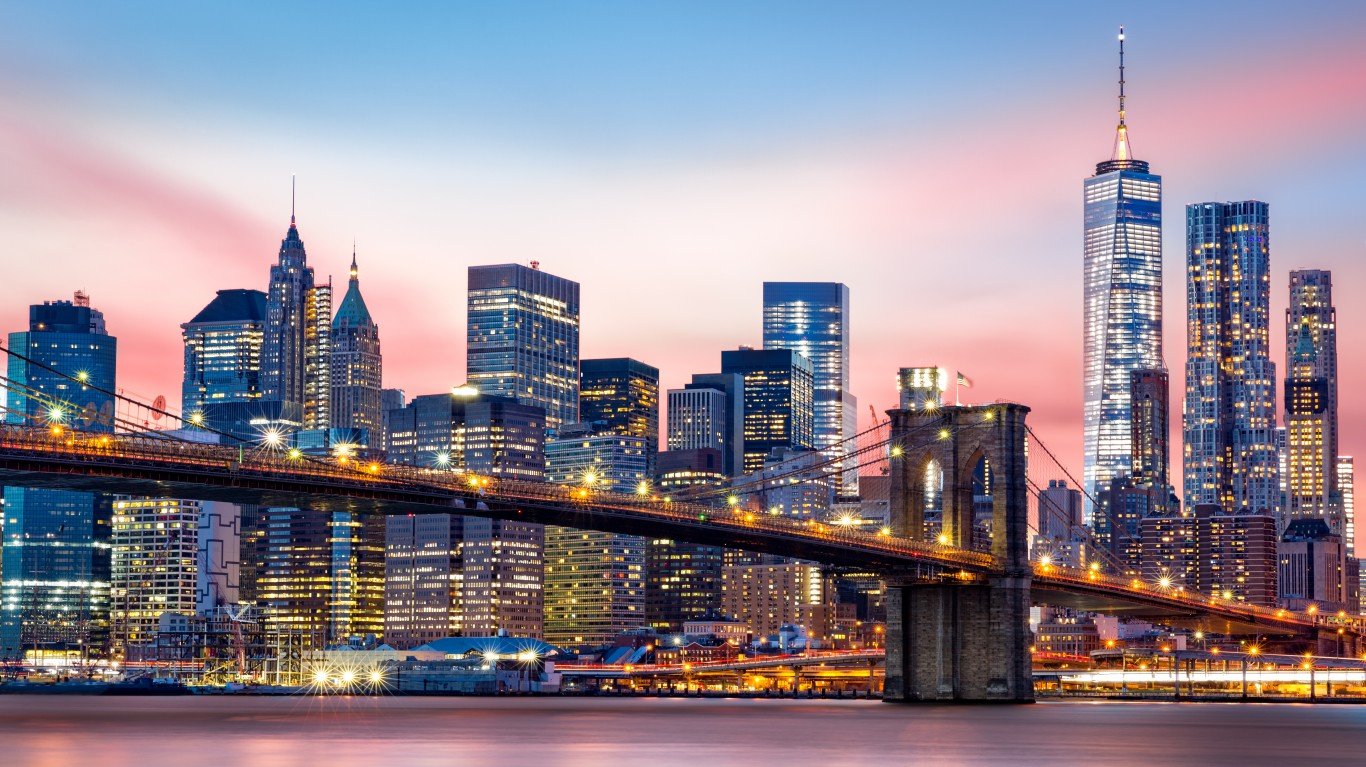
2. New York
> Pct. of workers in unions: 22.3%
> Change in union membership (2008-2018): -2.6 ppt. (15th largest decrease)
> Union workers: 1,873,880 (2nd most)
> Avg. annual wage: $69,947 (the highest)
[Need Manual Image]
3. Washington
> Pct. of workers in unions: 19.8%
> Change in union membership (2008-2018): unchanged
> Union workers: 648,139 (5th most)
> Avg. annual wage: $61,893 (6th highest)

Source: Leieng / Getty Images
4. Alaska
> Pct. of workers in unions: 18.4%
> Change in union membership (2008-2018): -5.1 ppt. (2nd largest decrease)
> Union workers: 55,148 (8th fewest)
> Avg. annual wage: $57,052 (11th highest)
[in-text-ad-2]
Source: DenisTangneyJr / Getty Images
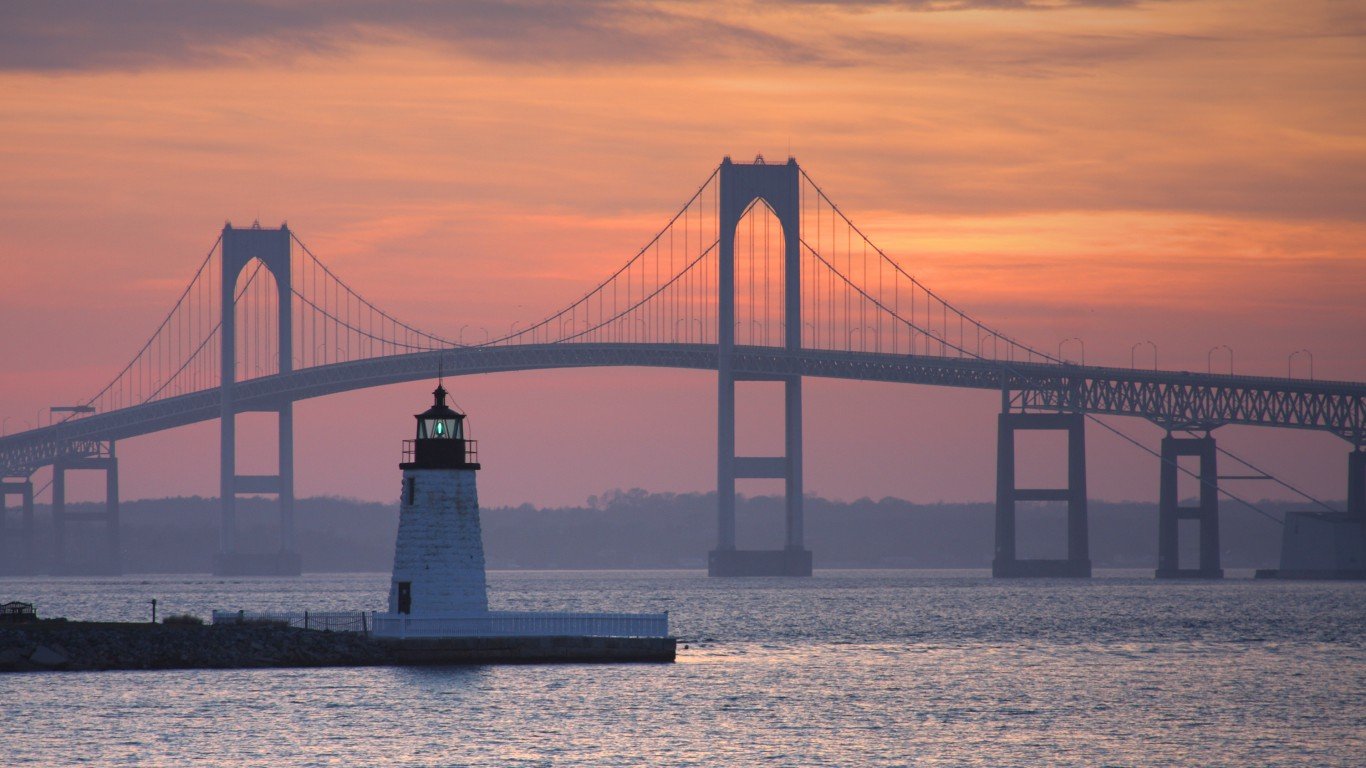
5. Rhode Island
> Pct. of workers in unions: 17.3%
> Change in union membership (2008-2018): +0.8 ppt. (2nd largest increase)
> Union workers: 83,165 (18th fewest)
> Avg. annual wage: $53,408 (16th highest)
Source: SeanPavonePhoto / Getty Images
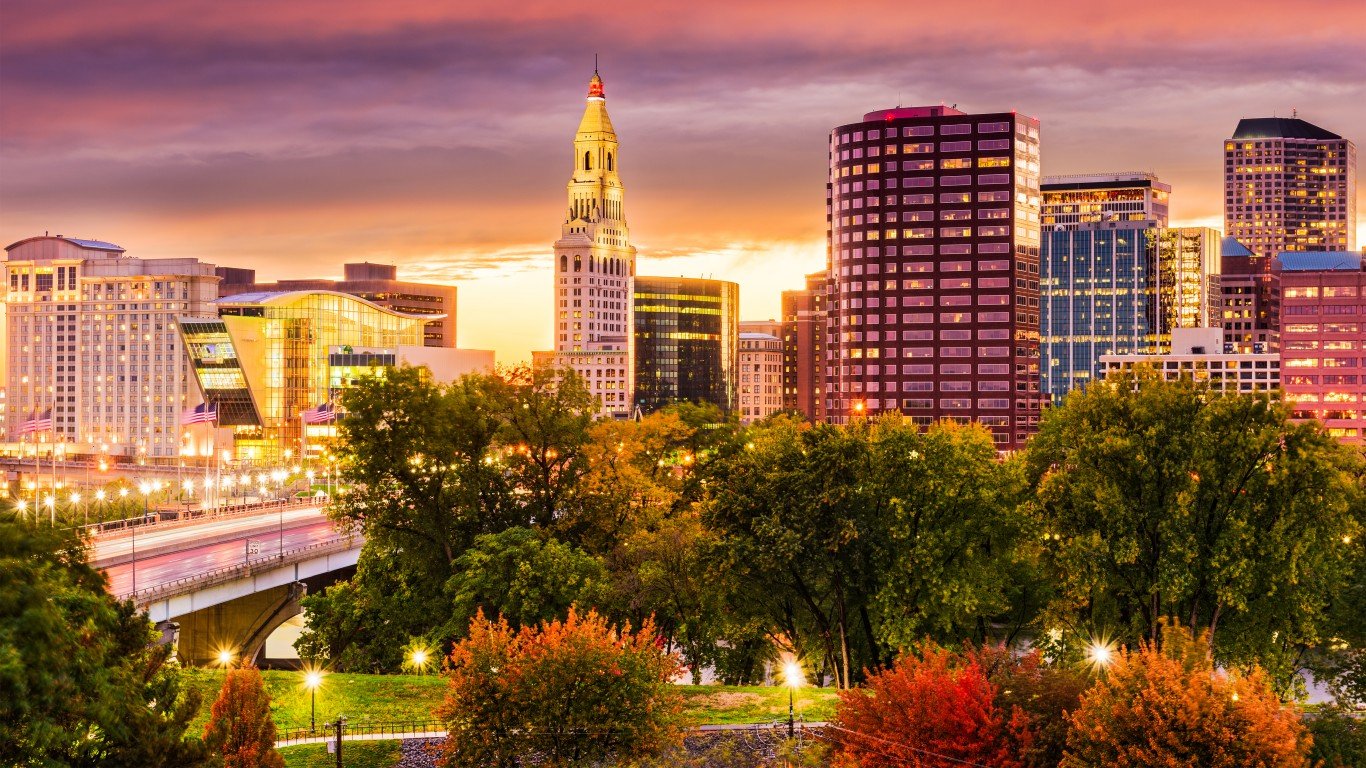
6. Connecticut
> Pct. of workers in unions: 15.9%
> Change in union membership (2008-2018): -1.0 ppt. (11th smallest decrease)
> Union workers: 267,222 (16th most)
> Avg. annual wage: $65,748 (4th highest)
[in-text-ad]
Source: AndreyKrav / Getty Images
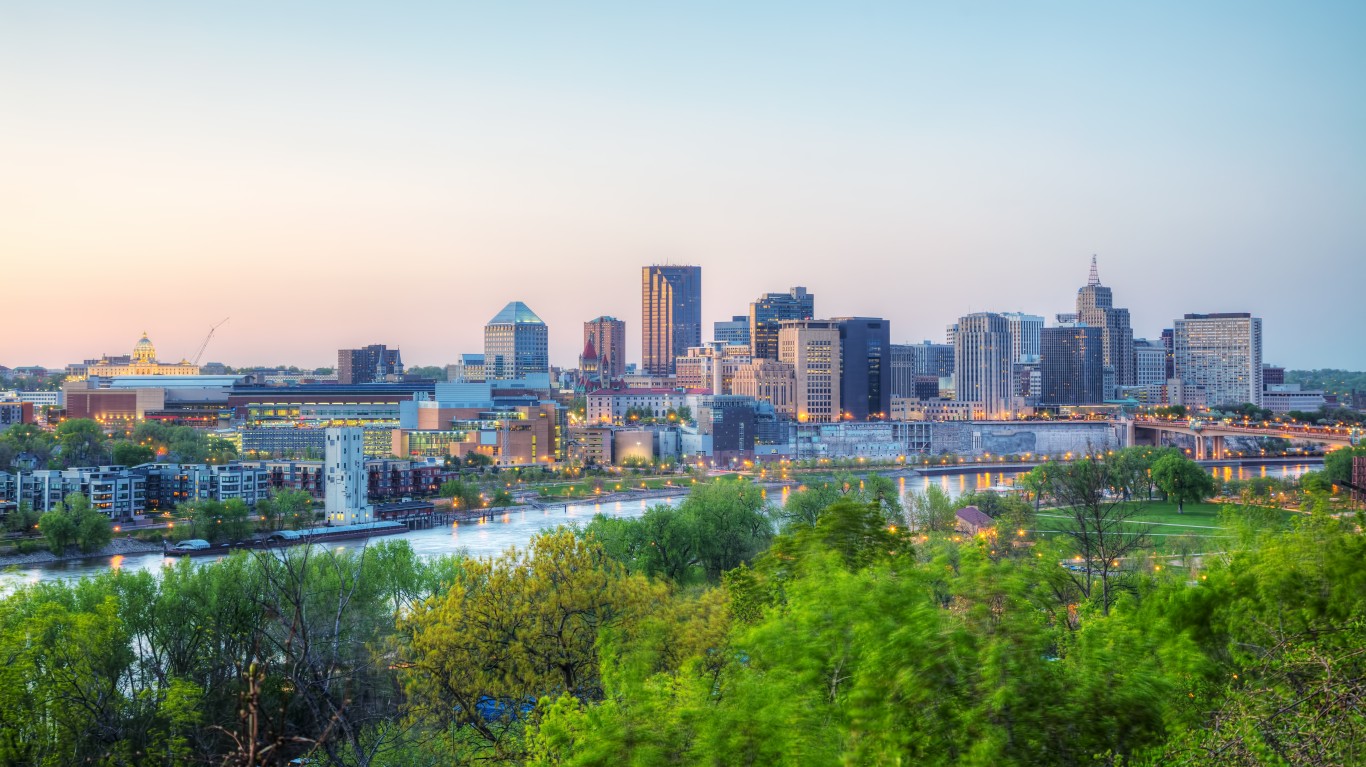
7. Minnesota
> Pct. of workers in unions: 15.0%
> Change in union membership (2008-2018): -1.1 ppt. (13th smallest decrease)
> Union workers: 395,407 (12th most)
> Avg. annual wage: $55,310 (13th highest)
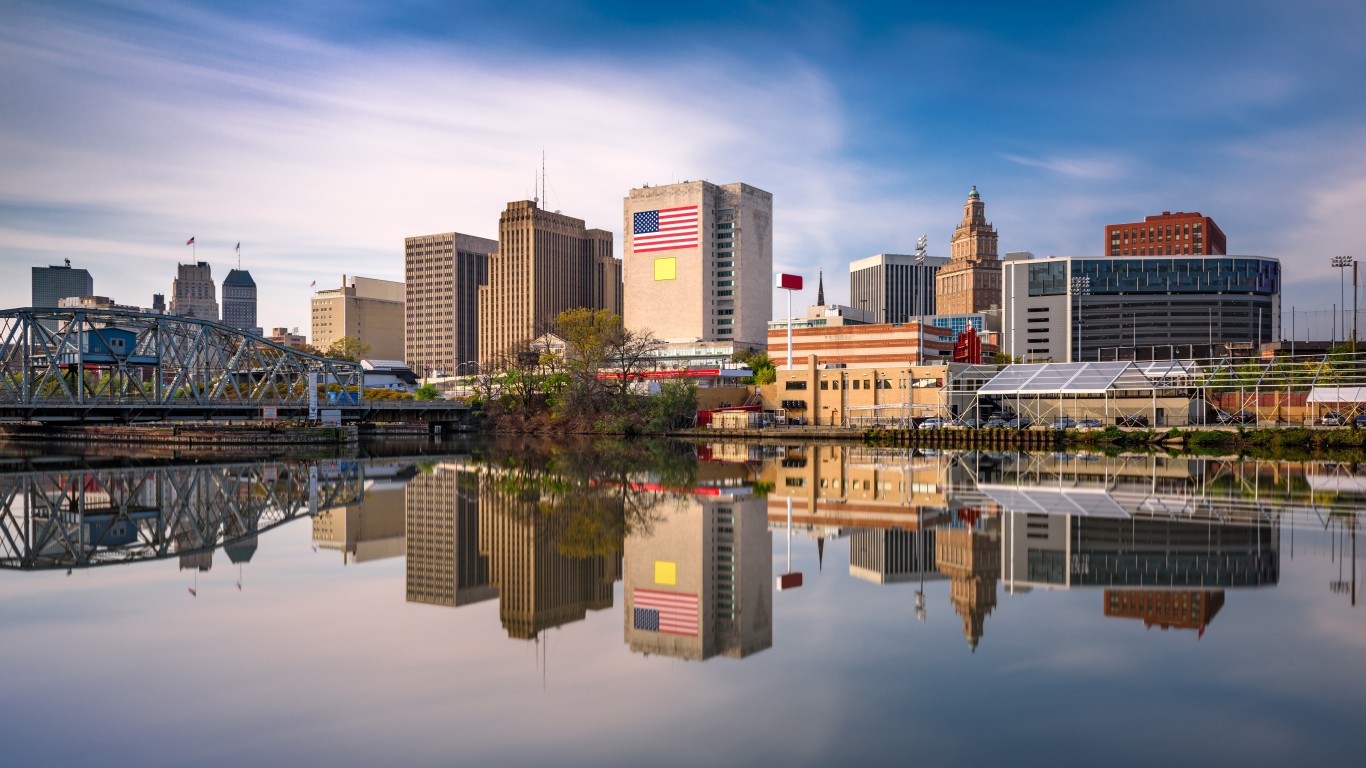
Source: SeanPavonePhoto / Getty Images
8. New Jersey
> Pct. of workers in unions: 14.9%
> Change in union membership (2008-2018): -3.4 ppt. (8th largest decrease)
> Union workers: 587,219 (8th most)
> Avg. annual wage: $63,563 (5th highest)
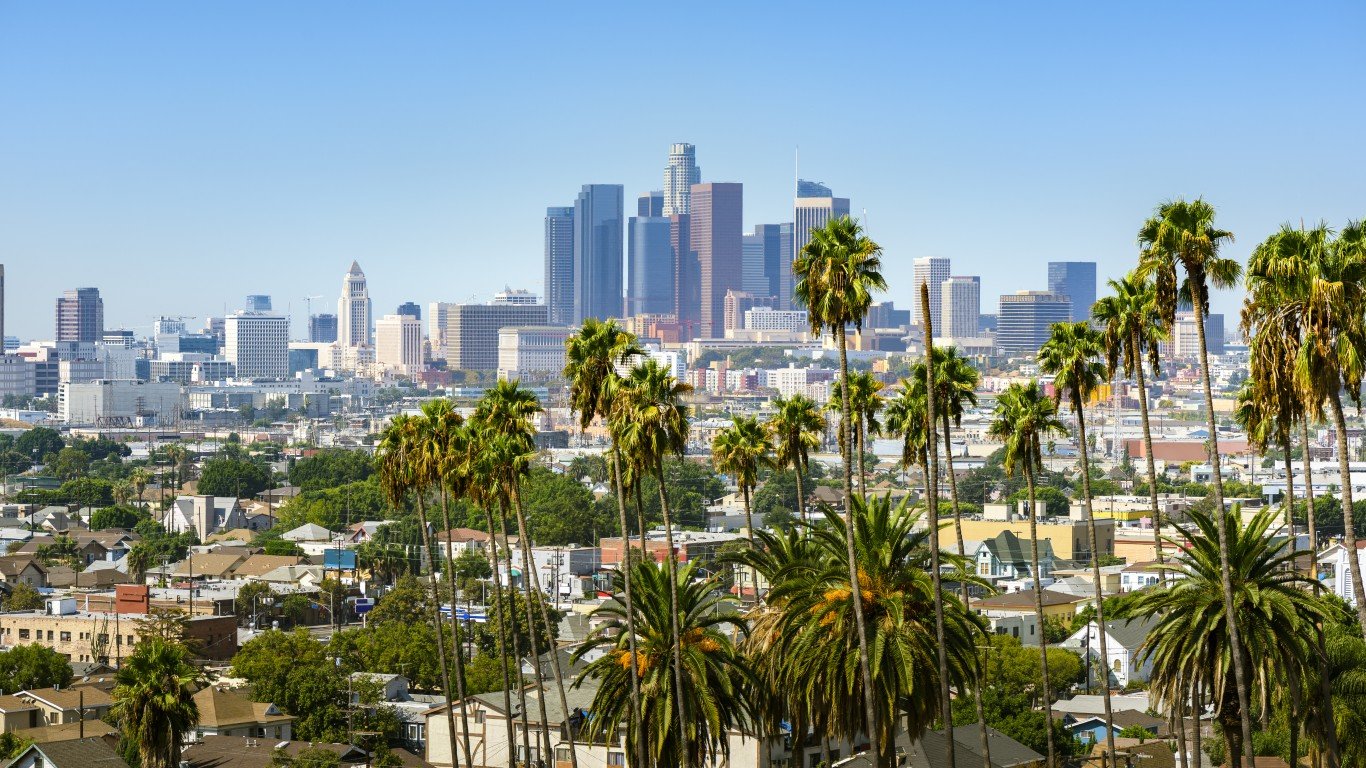
Source: choness / Getty Images
9. California
> Pct. of workers in unions: 14.7%
> Change in union membership (2008-2018): -3.7 ppt. (5th largest decrease)
> Union workers: 2,404,888 (the most)
> Avg. annual wage: $66,308 (3rd highest)
[in-text-ad-2]
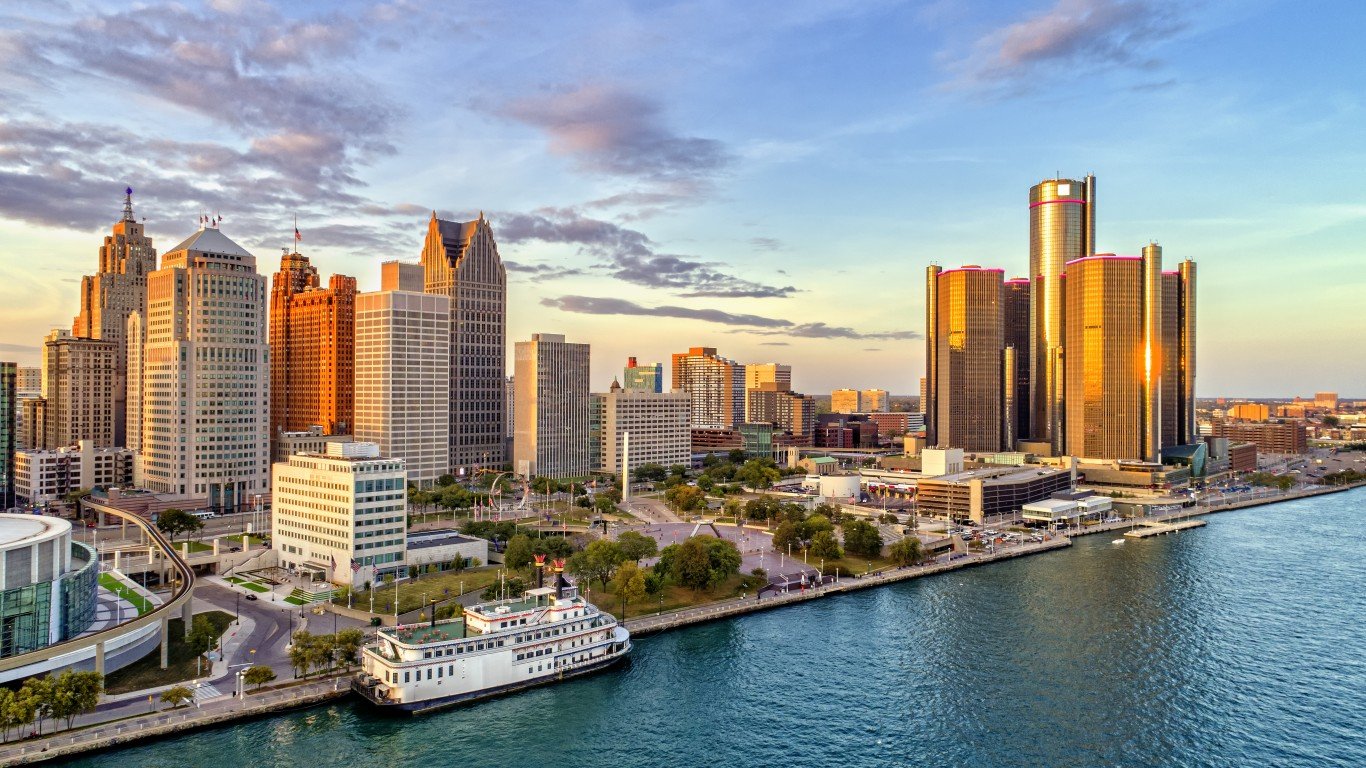
Source: pawel.gaul / Getty Images
10. Michigan
> Pct. of workers in unions: 14.5%
> Change in union membership (2008-2018): -4.3 ppt. (3rd largest decrease)
> Union workers: 624,598 (7th most)
> Avg. annual wage: $52,069 (19th highest)
[Need Manual Image]
11. Oregon
> Pct. of workers in unions: 13.9%
> Change in union membership (2008-2018): -2.7 ppt. (14th largest decrease)
> Union workers: 241,150 (18th most)
> Avg. annual wage: $51,951 (20th highest)
[in-text-ad]
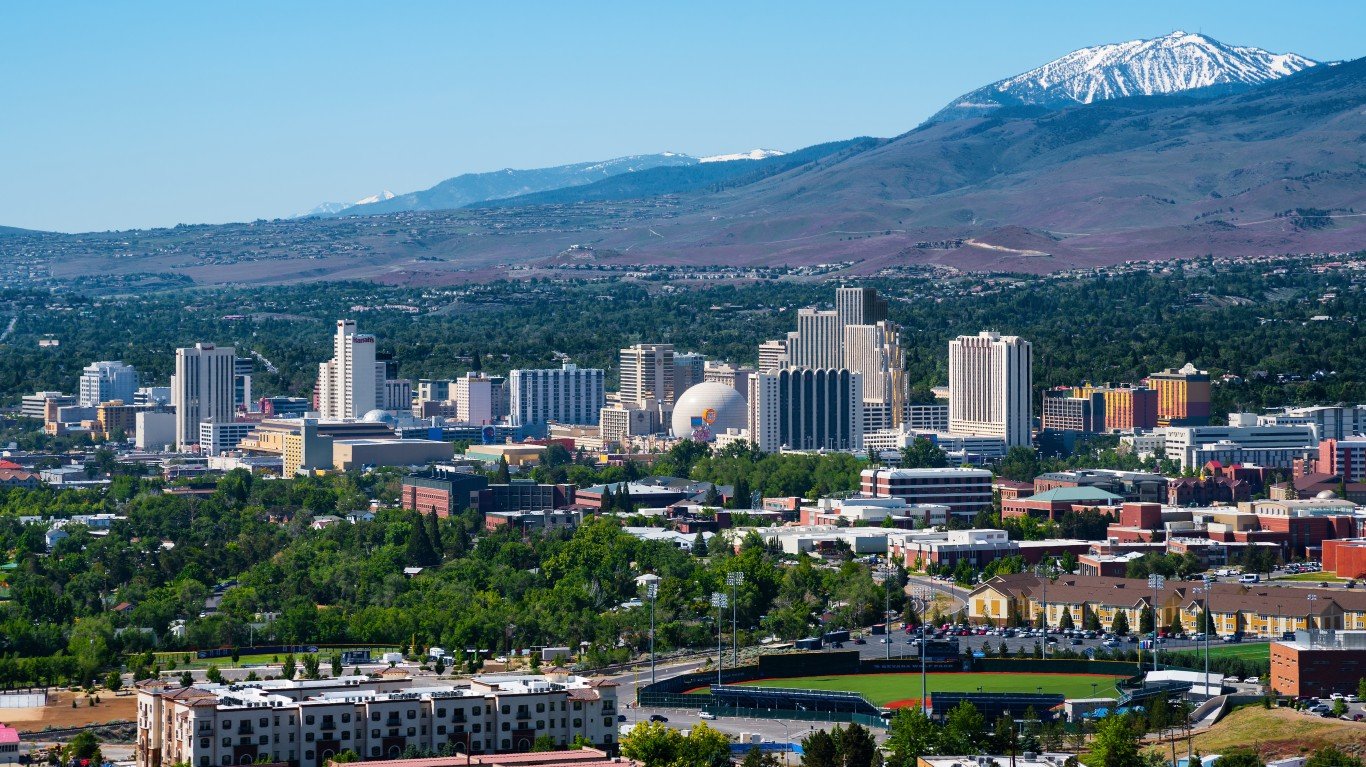
Source: photoquest7 / Getty Images
12. Nevada
> Pct. of workers in unions: 13.9%
> Change in union membership (2008-2018): -2.8 ppt. (13th largest decrease)
> Union workers: 190,774 (21st most)
> Avg. annual wage: $49,316 (24th lowest)
Source: RudyBalasko / Getty Images
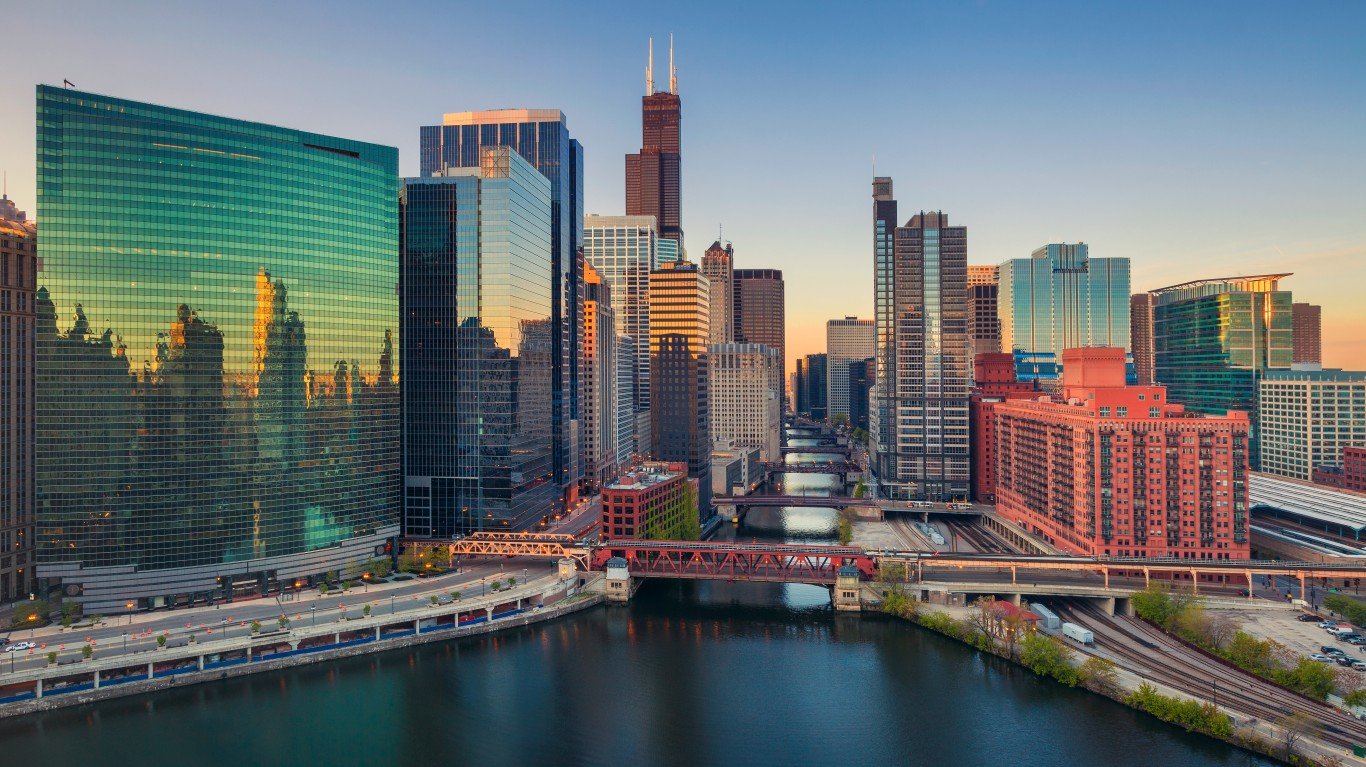
13. Illinois
> Pct. of workers in unions: 13.8%
> Change in union membership (2008-2018): -2.8 ppt. (12th largest decrease)
> Union workers: 785,966 (3rd most)
> Avg. annual wage: $59,191 (8th highest)
Source: Sean Pavone / Getty Images
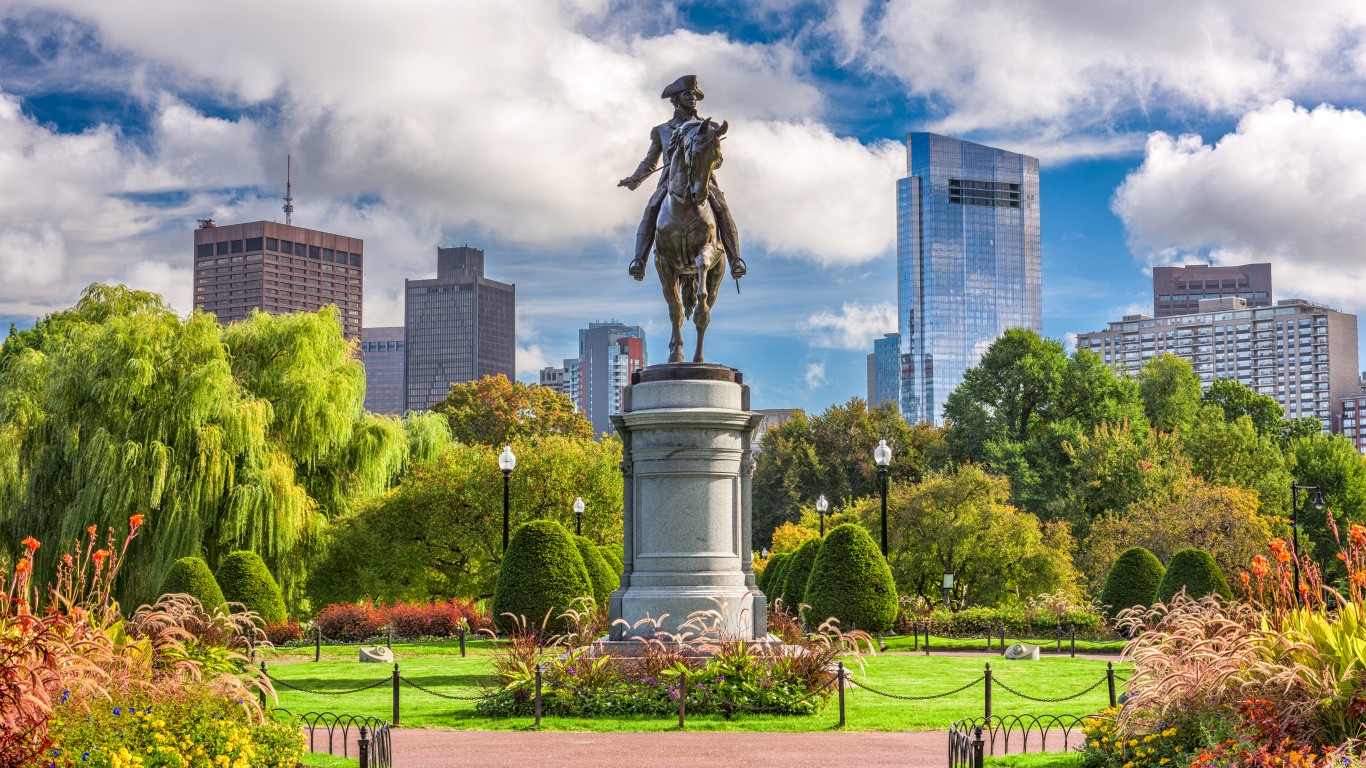
14. Massachusetts
> Pct. of workers in unions: 13.6%
> Change in union membership (2008-2018): -2.1 ppt. (17th largest decrease)
> Union workers: 462,739 (11th most)
> Avg. annual wage: $68,455 (2nd highest)
[in-text-ad-2]
Source: SeanPavonePhoto / Getty Images
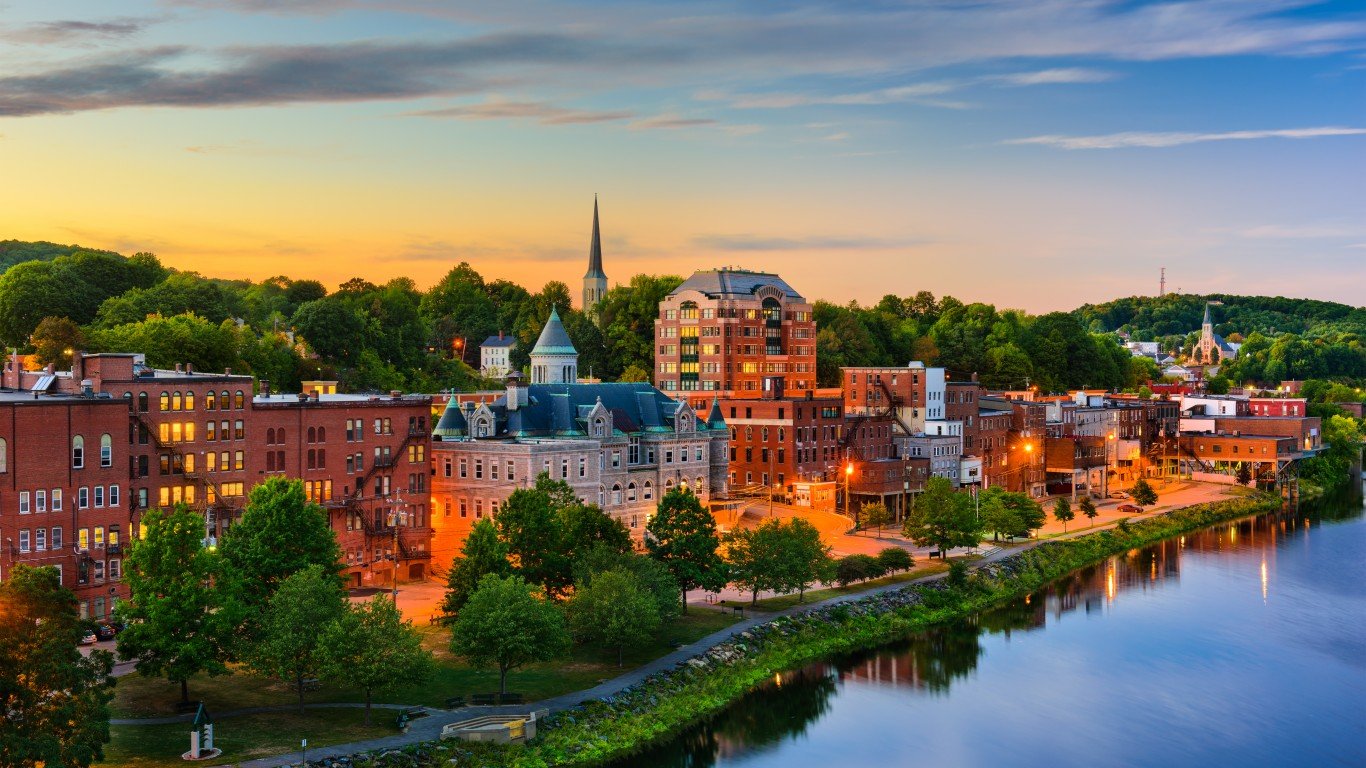
15. Maine
> Pct. of workers in unions: 12.9%
> Change in union membership (2008-2018): +0.6 ppt. (4th largest increase)
> Union workers: 73,905 (17th fewest)
> Avg. annual wage: $45,053 (9th lowest)
Source: aceshot / Getty Images
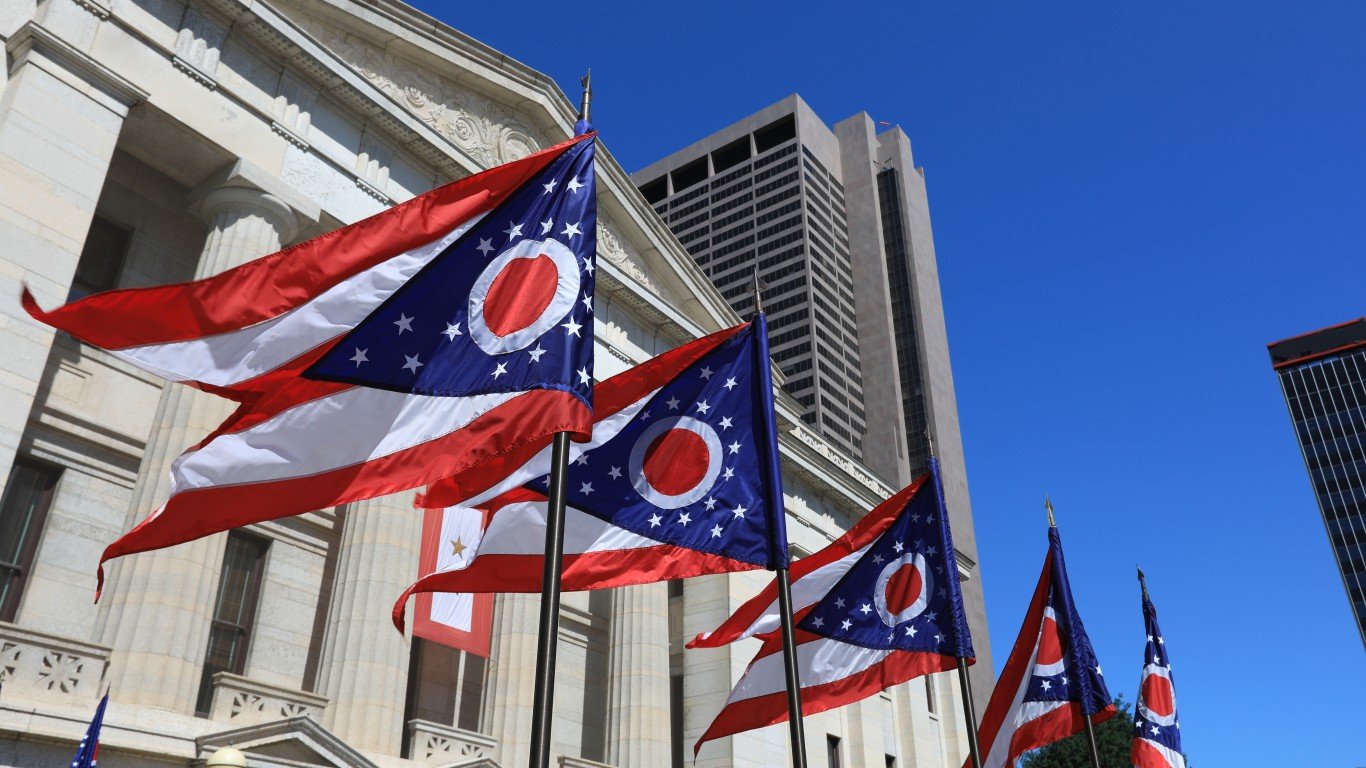
16. Ohio
> Pct. of workers in unions: 12.7%
> Change in union membership (2008-2018): -1.5 ppt. (22nd largest decrease)
> Union workers: 639,909 (6th most)
> Avg. annual wage: $49,988 (23rd highest)
[in-text-ad]

Source: f11photo / Getty Images
17. Pennsylvania
> Pct. of workers in unions: 12.5%
> Change in union membership (2008-2018): -2.9 ppt. (10th largest decrease)
> Union workers: 700,130 (4th most)
> Avg. annual wage: $52,865 (18th highest)

Source: HaizhanZheng / Getty Images
18. Montana
> Pct. of workers in unions: 11.8%
> Change in union membership (2008-2018): -0.4 ppt. (3rd smallest decrease)
> Union workers: 50,441 (7th fewest)
> Avg. annual wage: $42,133 (4th lowest)
Source: Gary Gray / Getty Images
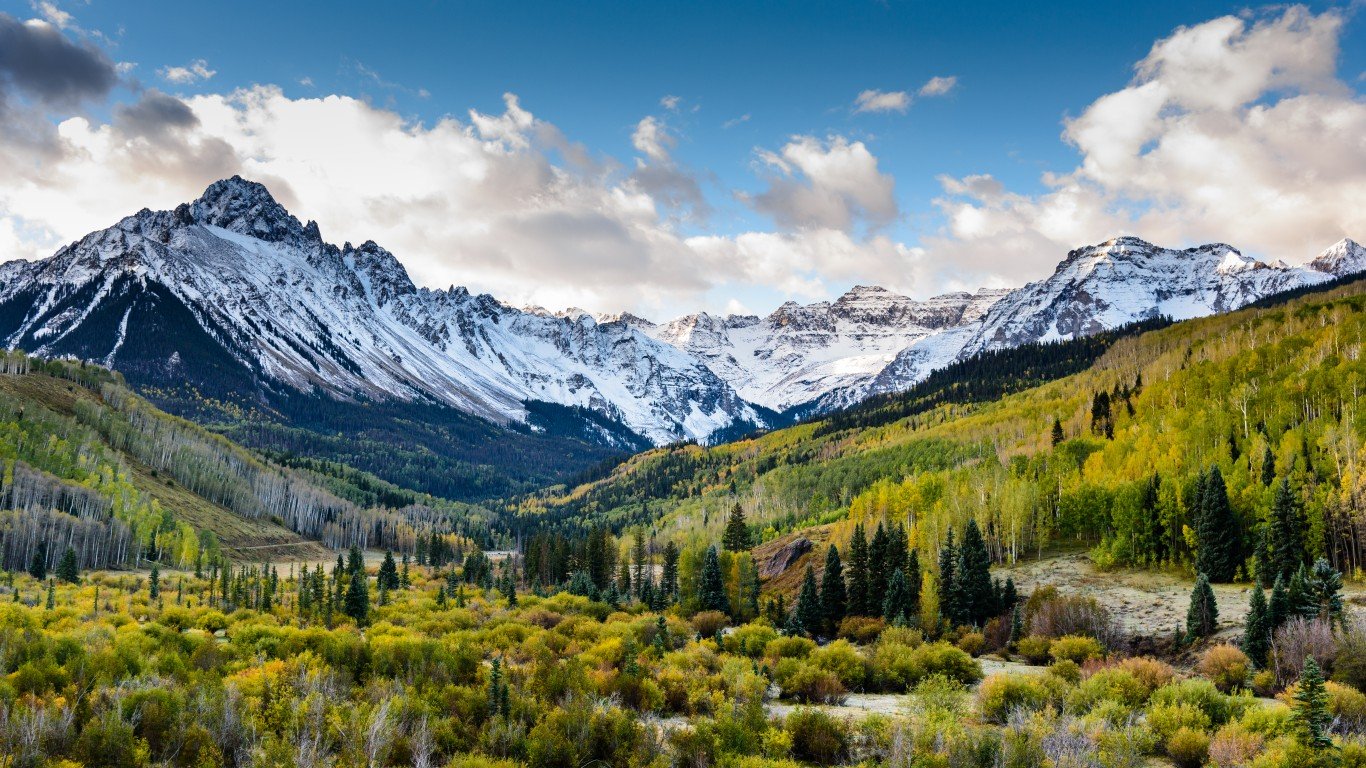
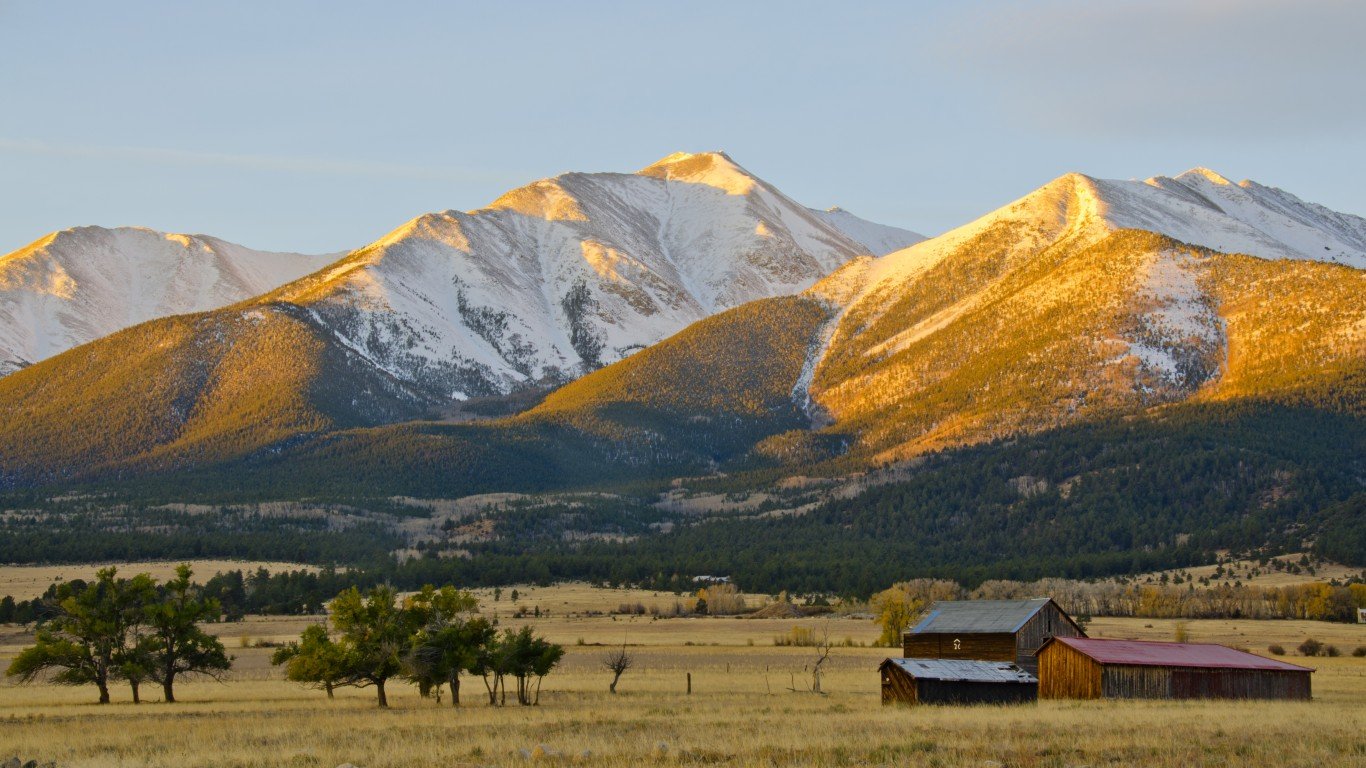
19. Colorado
> Pct. of workers in unions: 11.0%
> Change in union membership (2008-2018): +3.0 ppt. (the largest increase)
> Union workers: 281,098 (14th most)
> Avg. annual wage: $57,603 (10th highest)
[in-text-ad-2]
Source: SeanPavonePhoto / Getty Images
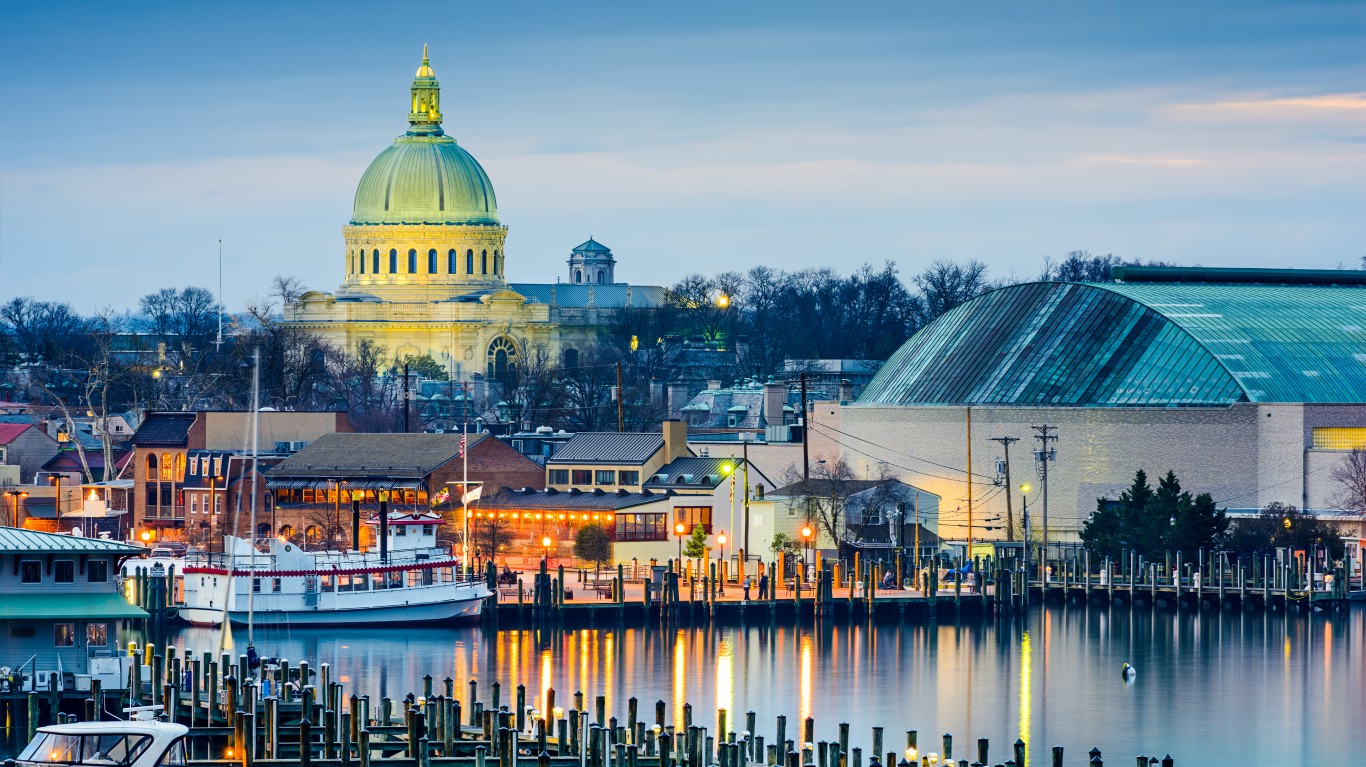
20. Maryland
> Pct. of workers in unions: 11.0%
> Change in union membership (2008-2018): -1.6 ppt. (21st largest decrease)
> Union workers: 306,318 (13th most)
> Avg. annual wage: $61,133 (7th highest)
Source: Sean Pavone / Getty Images
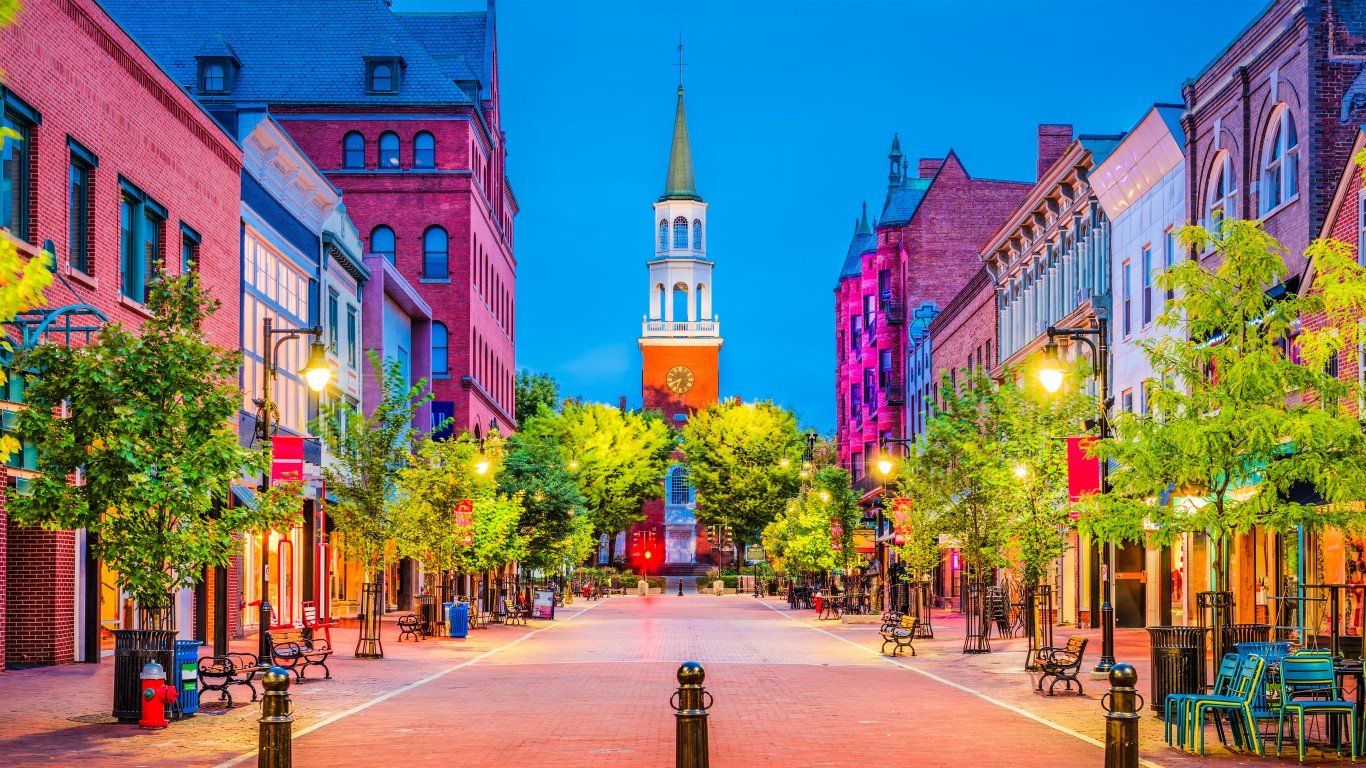
21. Vermont
> Pct. of workers in unions: 10.5%
> Change in union membership (2008-2018): +0.1 ppt. (9th largest increase)
> Union workers: 30,619 (4th fewest)
> Avg. annual wage: $45,314 (12th lowest)
[in-text-ad]

Source: ymn / Getty Images
22. Delaware
> Pct. of workers in unions: 10.3%
> Change in union membership (2008-2018): -3.1 ppt. (9th largest decrease)
> Union workers: 44,835 (6th fewest)
> Avg. annual wage: $55,134 (14th highest)
 24/7 Wall St.
Source: DenisTangneyJr / Getty Images
23. New Hampshire
> Pct. of workers in unions: 10.2%
> Change in union membership (2008-2018): -0.4 ppt. (4th smallest decrease)
> Union workers: 67,707 (15th fewest)
> Avg. annual wage: $54,319 (15th highest)
Source: Sean Pavone / Getty Images
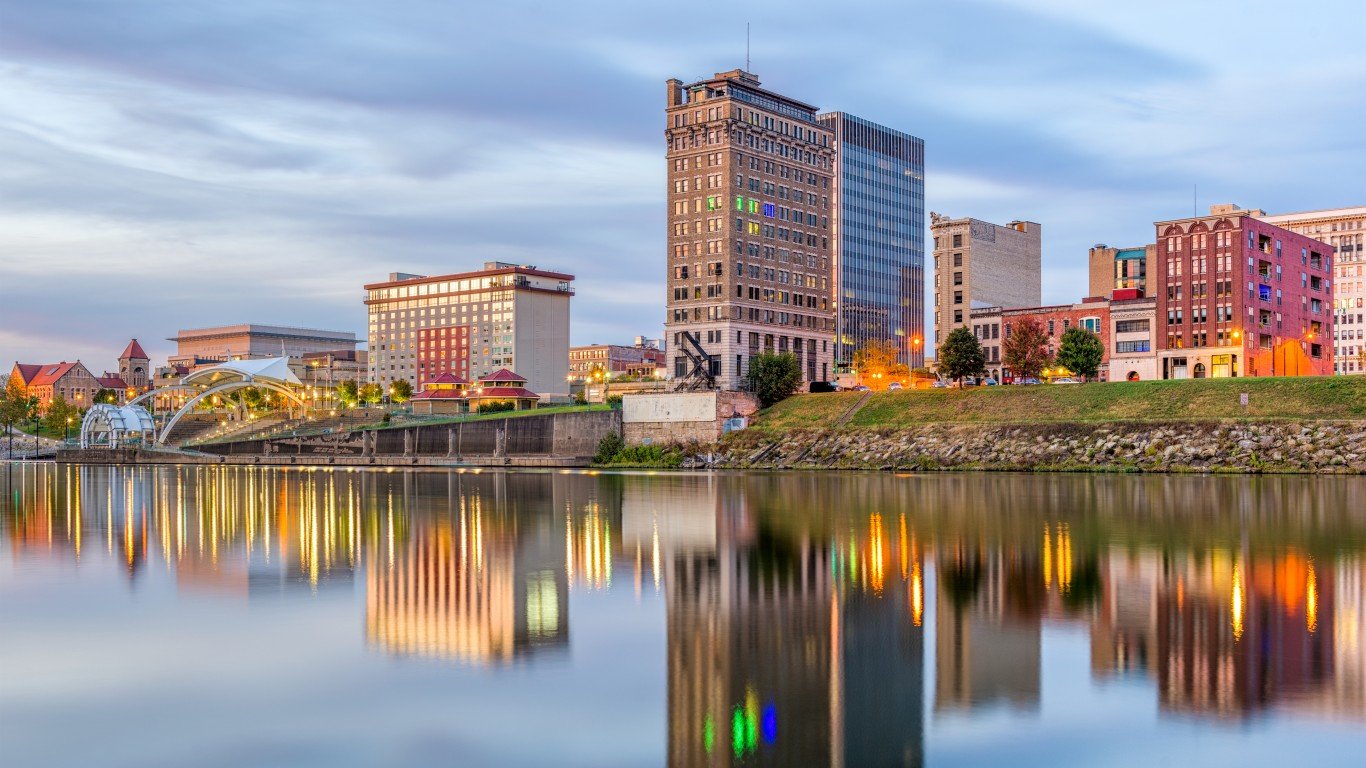
24. West Virginia
> Pct. of workers in unions: 10.0%
> Change in union membership (2008-2018): -3.8 ppt. (4th largest decrease)
> Union workers: 68,464 (16th fewest)
> Avg. annual wage: $42,871 (5th lowest)
[in-text-ad-2]
Source: f11photo / Getty Images
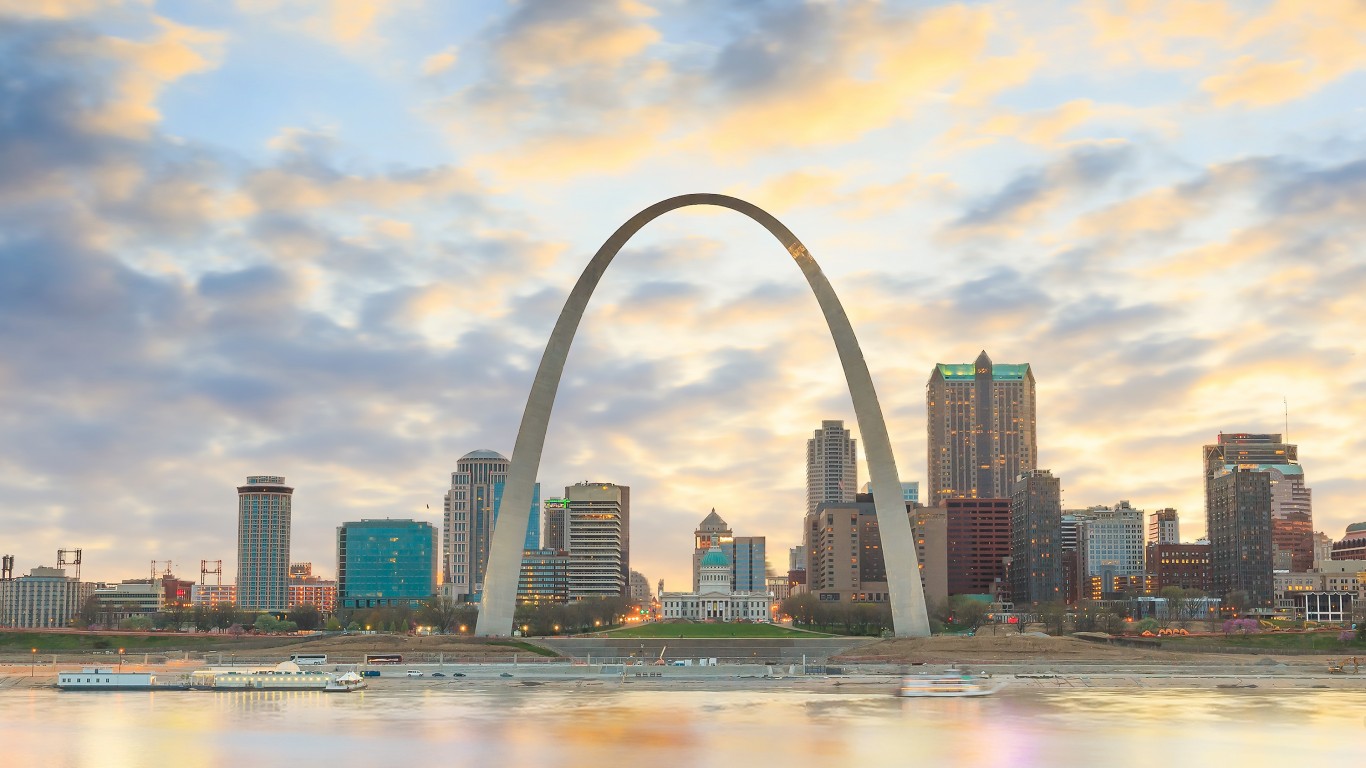
25. Missouri
> Pct. of workers in unions: 9.4%
> Change in union membership (2008-2018): -1.8 ppt. (18th largest decrease)
> Union workers: 251,770 (17th most)
> Avg. annual wage: $48,525 (23rd lowest)
Source: SeanPavonePhoto / Getty Images
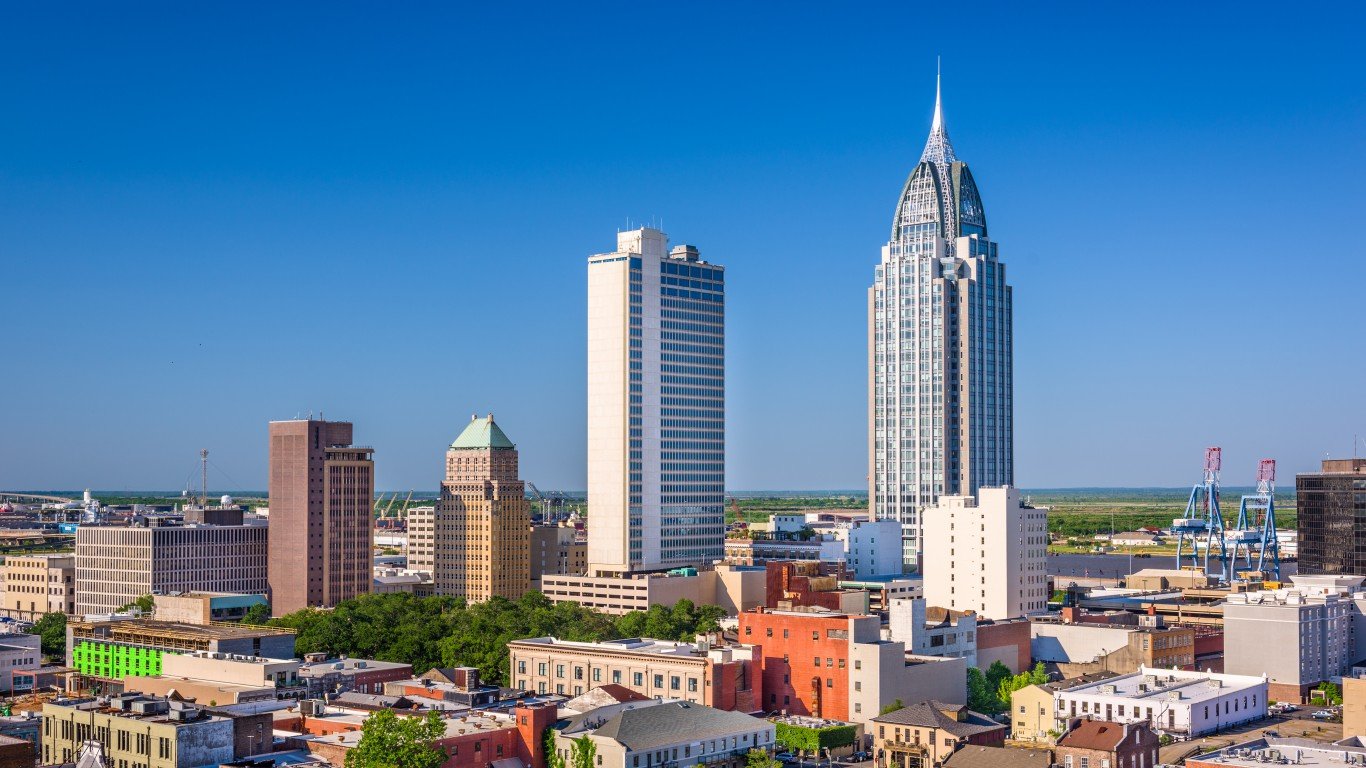
26. Alabama
> Pct. of workers in unions: 9.3%
> Change in union membership (2008-2018): -0.5 ppt. (6th smallest decrease)
> Union workers: 180,645 (22nd most)
> Avg. annual wage: $45,308 (11th lowest)
[in-text-ad]
Source: alexeys / Getty Images
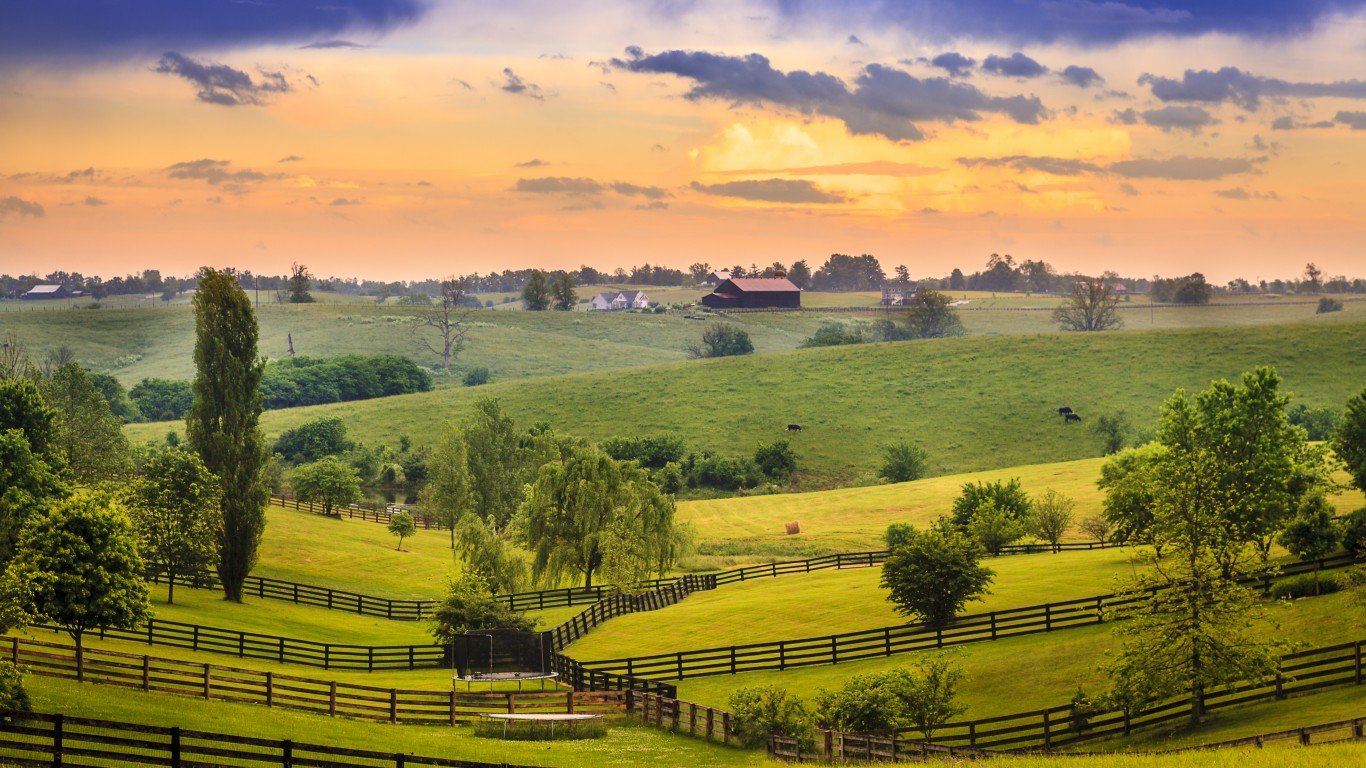
27. Kentucky
> Pct. of workers in unions: 8.8%
> Change in union membership (2008-2018): +0.2 ppt. (7th largest increase)
> Union workers: 160,209 (24th most)
> Avg. annual wage: $44,855 (8th lowest)
Source: Maksymowicz / Getty Images
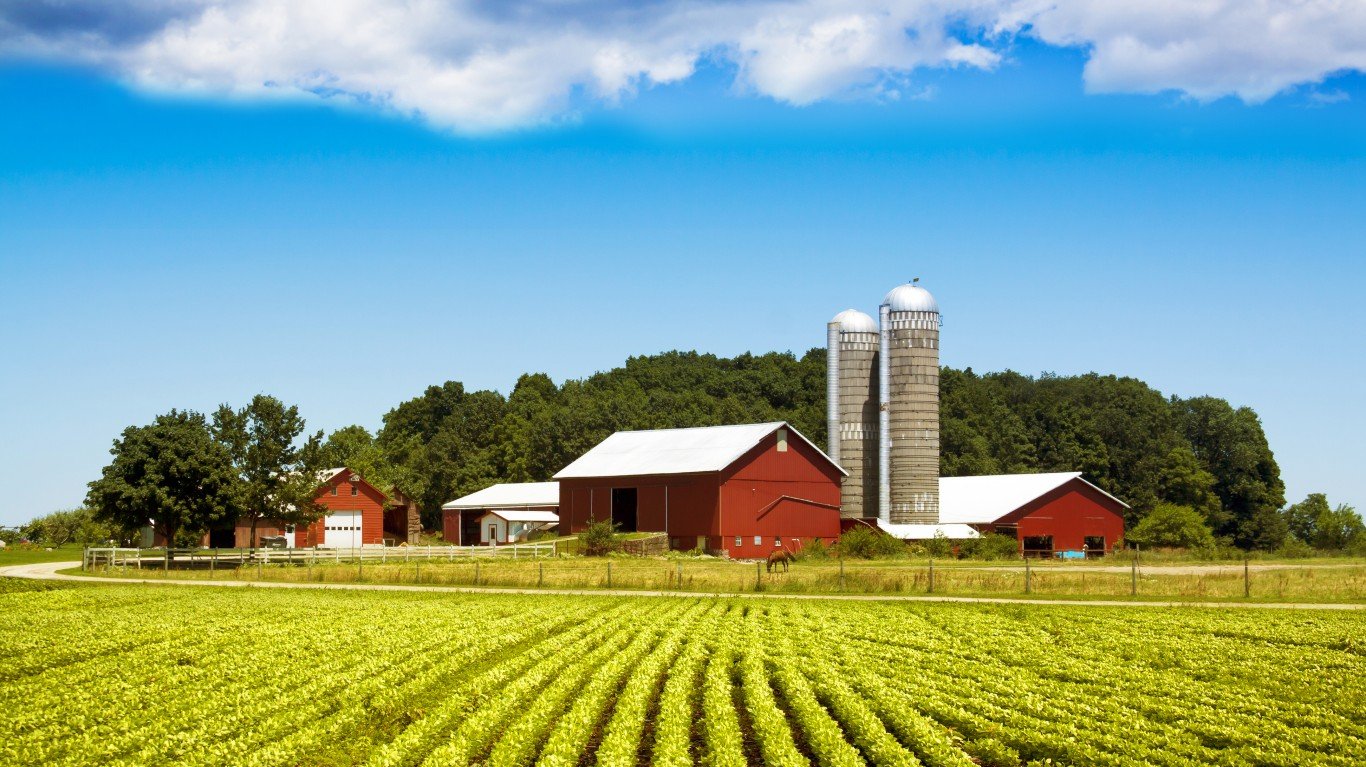
28. Indiana
> Pct. of workers in unions: 8.8%
> Change in union membership (2008-2018): -3.6 ppt. (6th largest decrease)
> Union workers: 269,025 (15th most)
> Avg. annual wage: $46,897 (17th lowest)
Source: Ron_Thomas / Getty Images
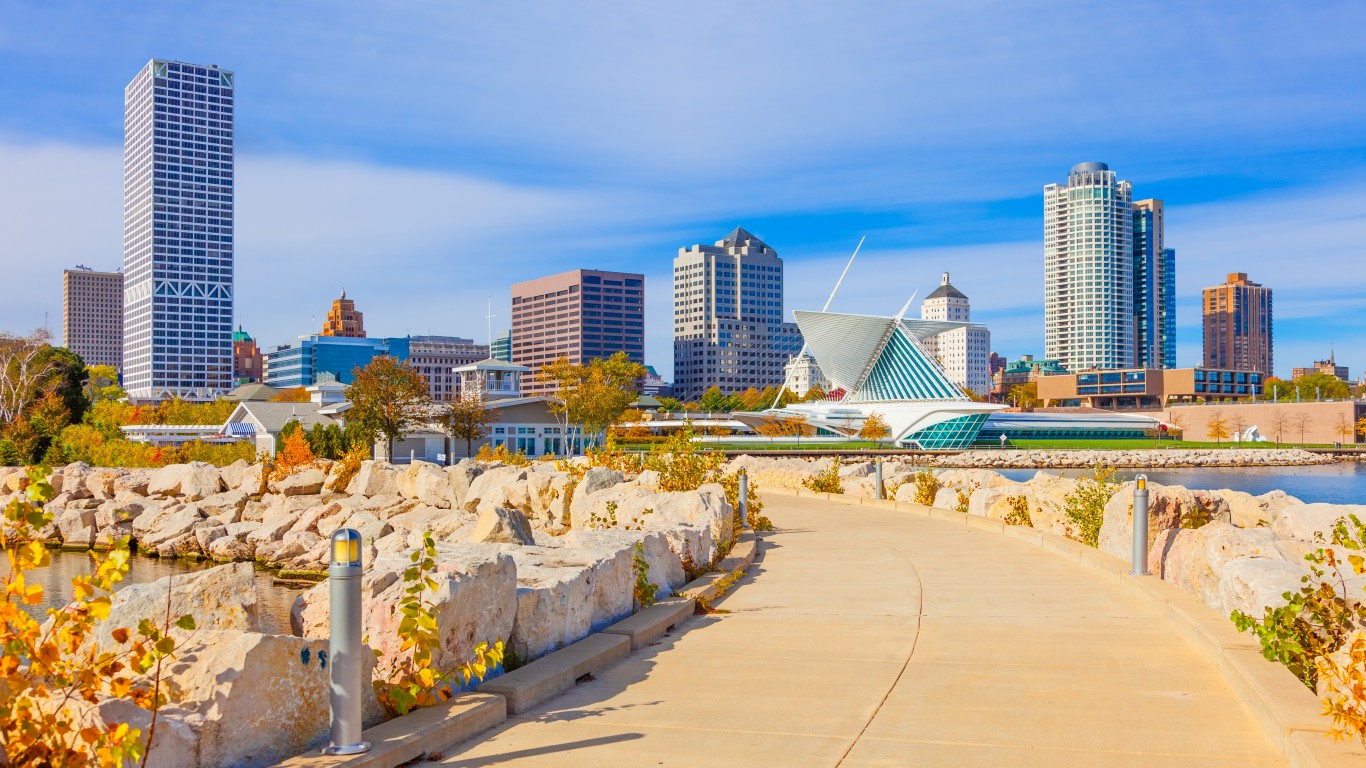
29. Wisconsin
> Pct. of workers in unions: 8.1%
> Change in union membership (2008-2018): -6.9 ppt. (the largest decrease)
> Union workers: 218,590 (19th most)
> Avg. annual wage: $47,804 (21st lowest)
[in-text-ad-2]

Source: KudicM / Getty Images
30. Iowa
> Pct. of workers in unions: 7.7%
> Change in union membership (2008-2018): -2.9 ppt. (10th largest decrease)
> Union workers: 112,771 (22nd fewest)
> Avg. annual wage: $45,186 (10th lowest)

Source: tomofbluesprings / Getty Images
31. Kansas
> Pct. of workers in unions: 7.0%
> Change in union membership (2008-2018): unchanged
> Union workers: 90,558 (21st fewest)
> Avg. annual wage: $46,413 (15th lowest)
[in-text-ad]

Source: kyletperry / Getty Images
32. New Mexico
> Pct. of workers in unions: 6.8%
> Change in union membership (2008-2018): -0.4 ppt. (4th smallest decrease)
> Union workers: 55,336 (9th fewest)
> Avg. annual wage: $44,725 (7th lowest)
Source: chapin31 / Getty Images
33. Nebraska
> Pct. of workers in unions: 6.6%
> Change in union membership (2008-2018): -1.7 ppt. (19th largest decrease)
> Union workers: 58,447 (14th fewest)
> Avg. annual wage: $46,540 (16th lowest)
Source: SeanXu / Getty Images
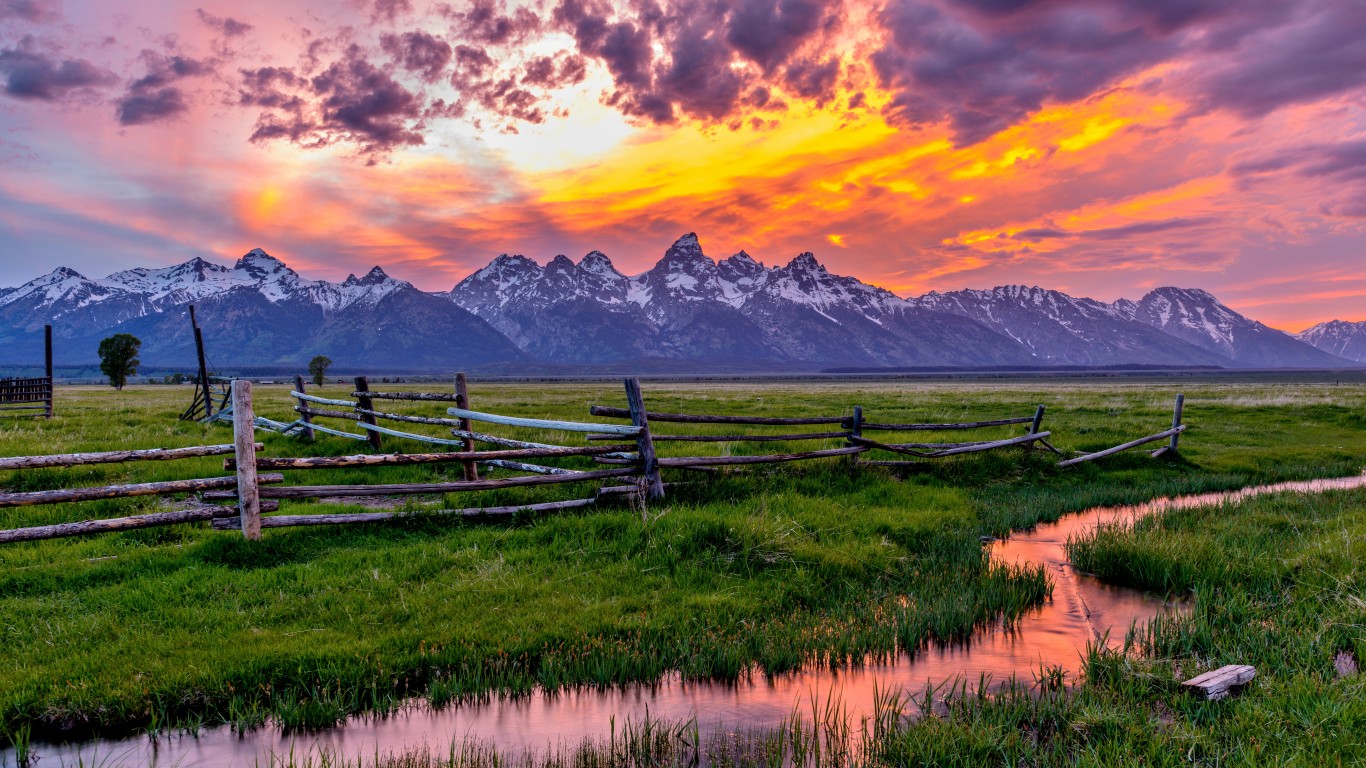
34. Wyoming
> Pct. of workers in unions: 6.5%
> Change in union membership (2008-2018): -1.2 ppt. (23rd largest decrease)
> Union workers: 15,376 (the fewest)
> Avg. annual wage: $47,285 (18th lowest)
[in-text-ad-2]
Source: Davel5957 / Getty Images
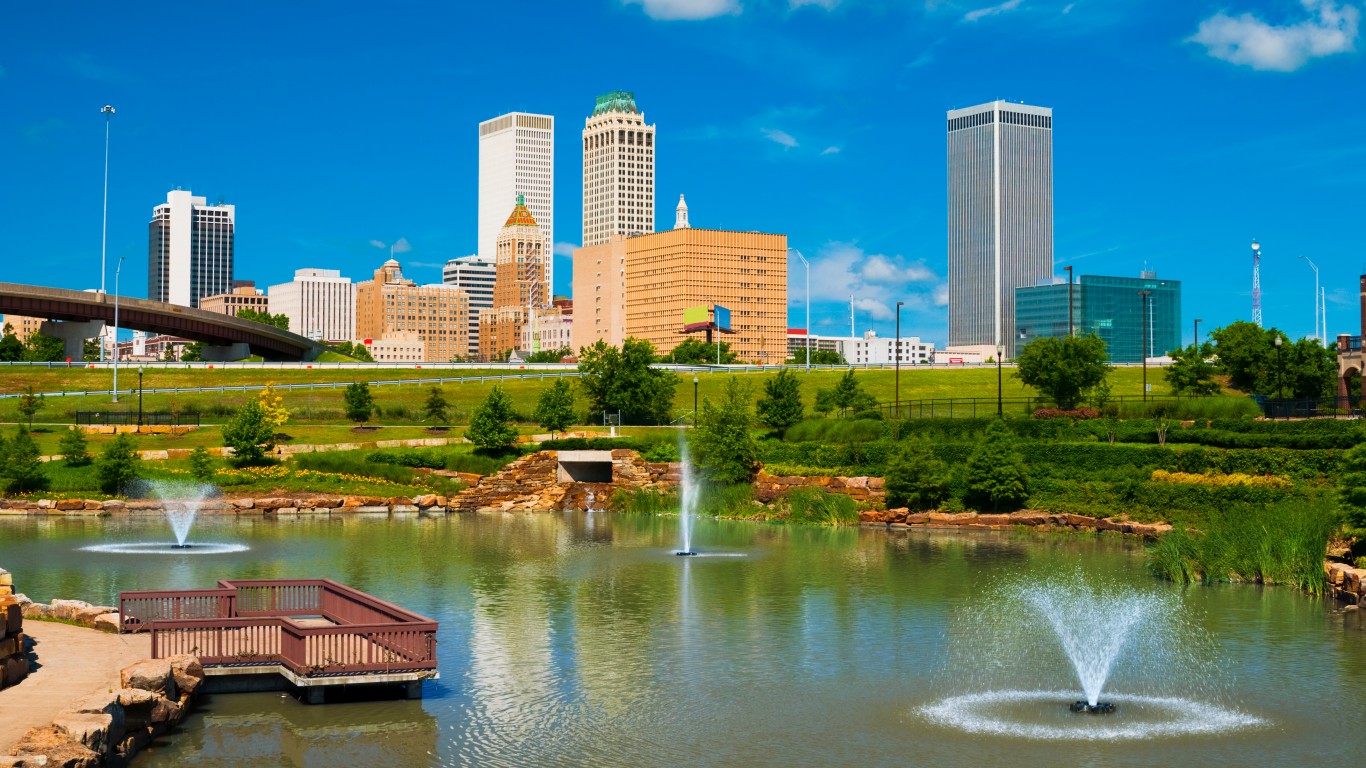
35. Oklahoma
> Pct. of workers in unions: 5.7%
> Change in union membership (2008-2018): -0.9 ppt. (10th smallest decrease)
> Union workers: 90,114 (20th fewest)
> Avg. annual wage: $45,997 (14th lowest)
Source: JMichl / Getty Images
36. South Dakota
> Pct. of workers in unions: 5.6%
> Change in union membership (2008-2018): +0.6 ppt. (4th largest increase)
> Union workers: 21,701 (3rd fewest)
> Avg. annual wage: $41,912 (2nd lowest)
[in-text-ad]

Source: Sean Pavone / Getty Images
37. Florida
> Pct. of workers in unions: 5.6%
> Change in union membership (2008-2018): -0.8 ppt. (8th smallest decrease)
> Union workers: 484,162 (10th most)
> Avg. annual wage: $49,906 (24th highest)
 24/7 Wall St.
Source: Sean Pavone / Getty Images
38. Tennessee
> Pct. of workers in unions: 5.5%
> Change in union membership (2008-2018): unchanged
> Union workers: 154,128 (25th fewest)
> Avg. annual wage: $48,322 (22nd lowest)

Source: Bill_Vorasate / Getty Images
39. Arizona
> Pct. of workers in unions: 5.3%
> Change in union membership (2008-2018): -3.5 ppt. (7th largest decrease)
> Union workers: 156,622 (25th most)
> Avg. annual wage: $51,157 (21st highest)
[in-text-ad-2]
Source: DenisTangneyJr / Getty Images
40. North Dakota
> Pct. of workers in unions: 5.2%
> Change in union membership (2008-2018): -0.9 ppt. (9th smallest decrease)
> Union workers: 17,907 (2nd fewest)
> Avg. annual wage: $49,441 (25th lowest)
Source: SeanPavonePhoto / Getty Images
41. Mississippi
> Pct. of workers in unions: 5.1%
> Change in union membership (2008-2018): -0.2 ppt. (the smallest decrease)
> Union workers: 57,656 (13th fewest)
> Avg. annual wage: $39,825 (the lowest)
[in-text-ad]

Source: Jaimie Tuchman / Getty Images
42. Louisiana
> Pct. of workers in unions: 5.0%
> Change in union membership (2008-2018): +0.4 ppt. (6th largest increase)
> Union workers: 89,016 (19th fewest)
> Avg. annual wage: $47,645 (20th lowest)
Source: Davel5957 / Getty Images
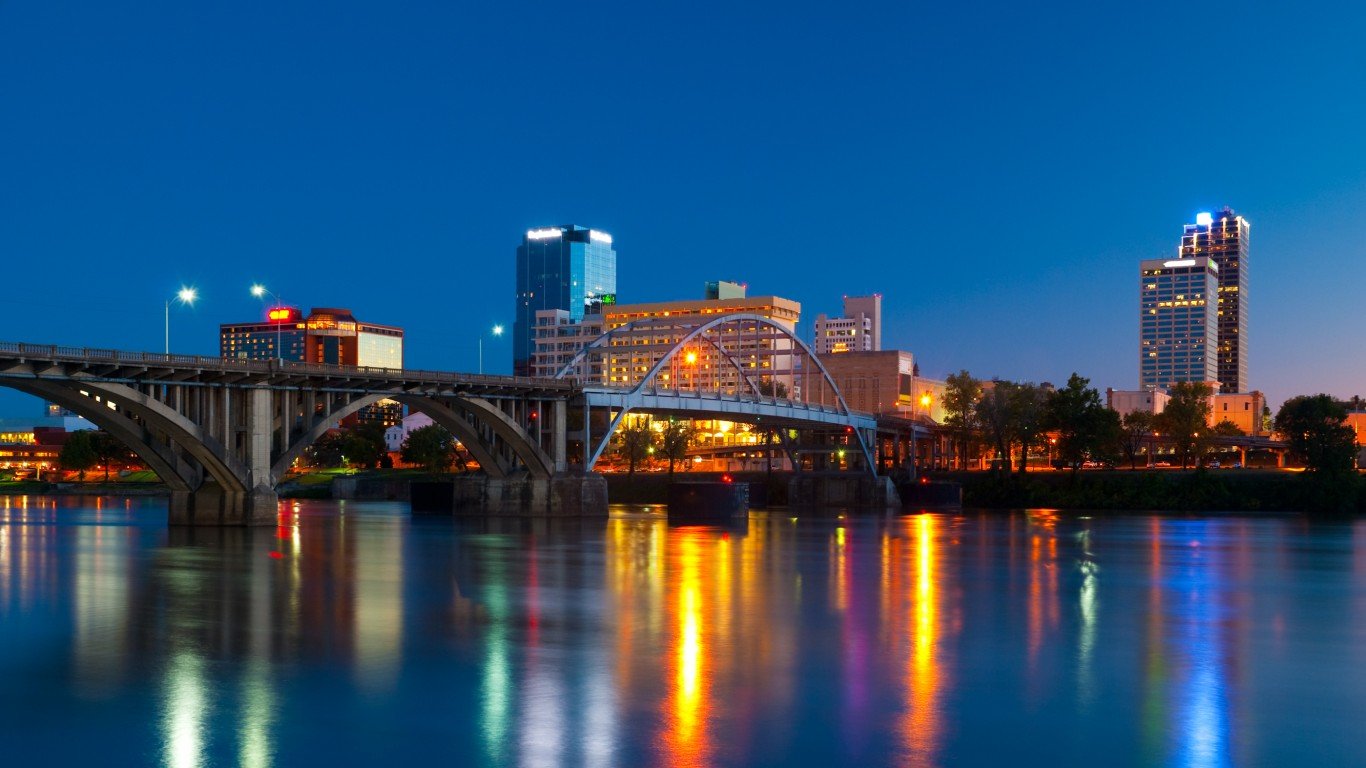
43. Arkansas
> Pct. of workers in unions: 4.8%
> Change in union membership (2008-2018): -1.1 ppt. (12th smallest decrease)
> Union workers: 56,247 (12th fewest)
> Avg. annual wage: $43,490 (6th lowest)
Source: vkbhat / Getty Images
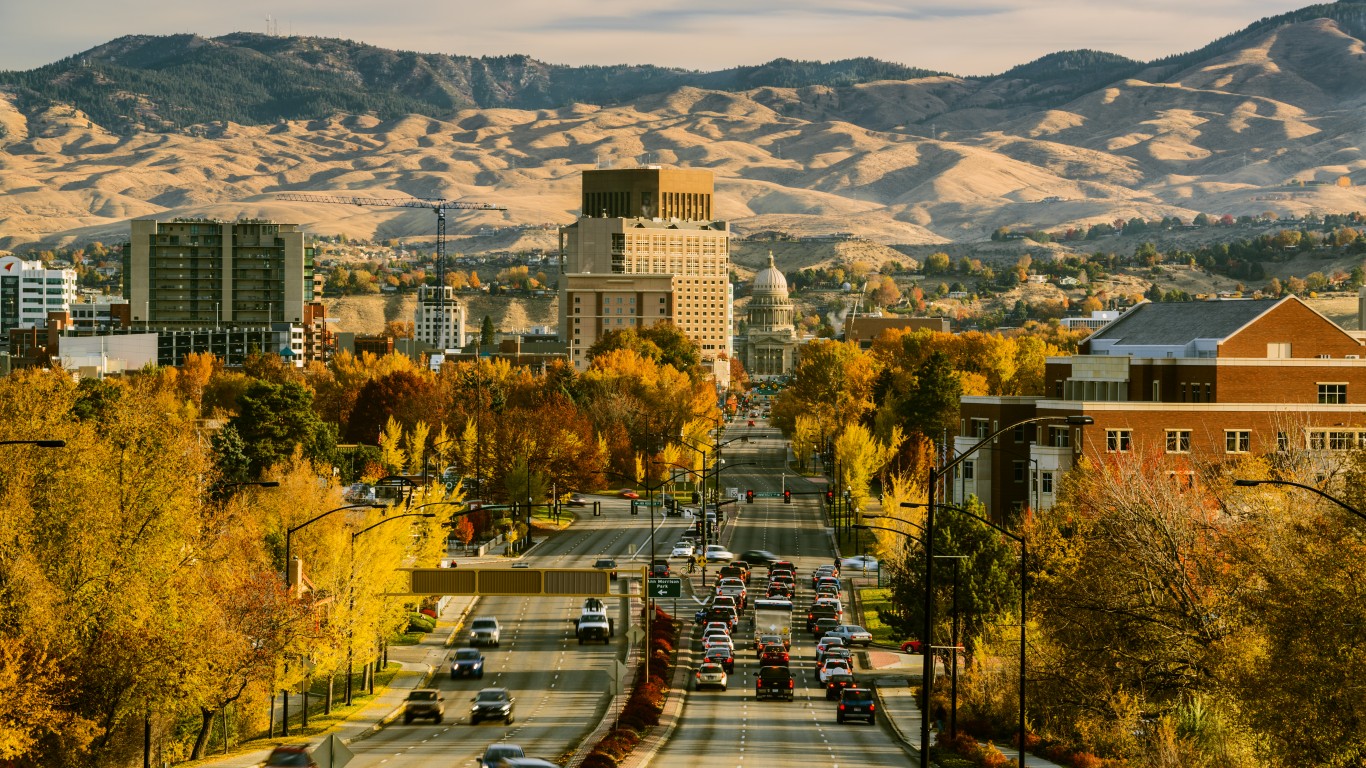
44. Idaho
> Pct. of workers in unions: 4.7%
> Change in union membership (2008-2018): -2.4 ppt. (16th largest decrease)
> Union workers: 34,244 (5th fewest)
> Avg. annual wage: $42,022 (3rd lowest)
[in-text-ad-2]

Source: Sean Pavone / Getty Images
45. Georgia
> Pct. of workers in unions: 4.5%
> Change in union membership (2008-2018): +0.8 ppt. (3rd largest increase)
> Union workers: 200,070 (20th most)
> Avg. annual wage: $53,035 (17th highest)
Source: Sean Pavone / Getty Images
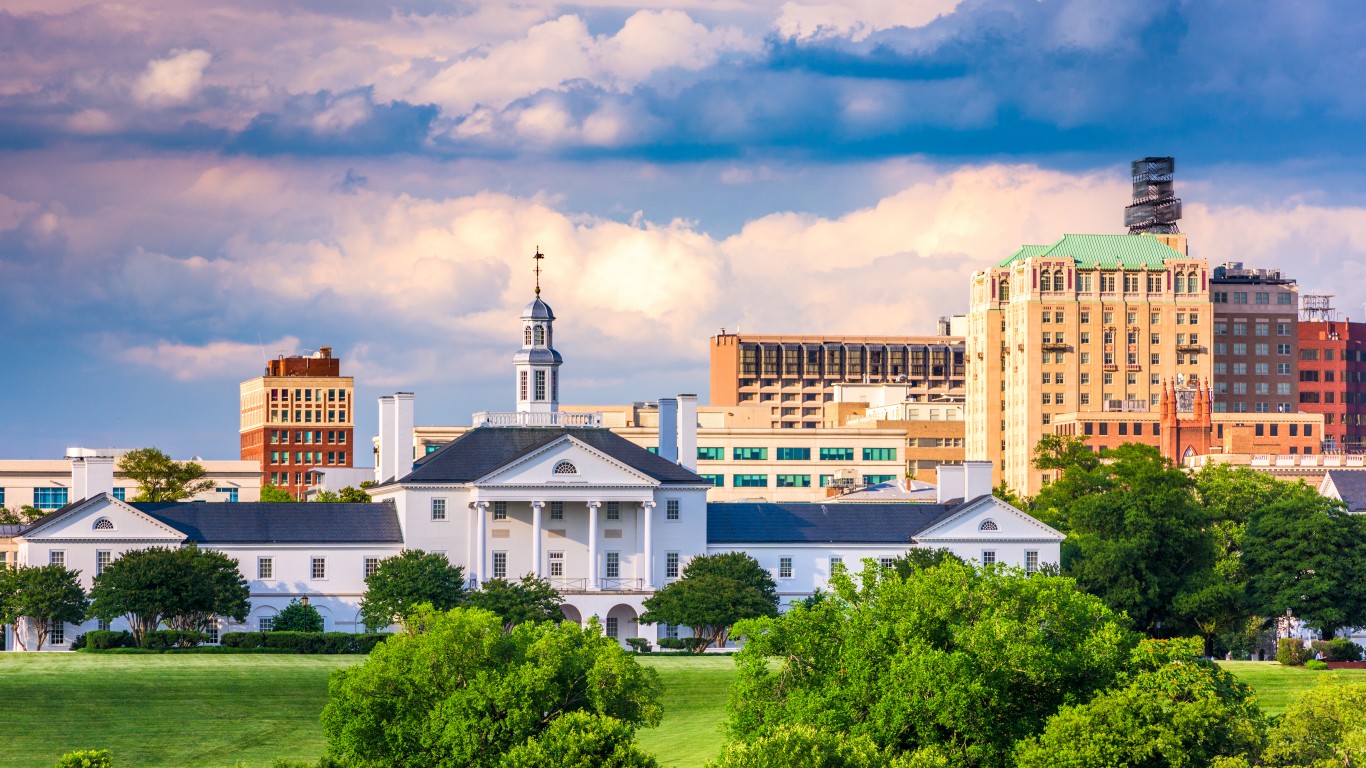
46. Virginia
> Pct. of workers in unions: 4.3%
> Change in union membership (2008-2018): +0.2 ppt. (8th largest increase)
> Union workers: 167,784 (23rd most)
> Avg. annual wage: $58,022 (9th highest)
[in-text-ad]
Source: SeanPavonePhoto / Getty Images
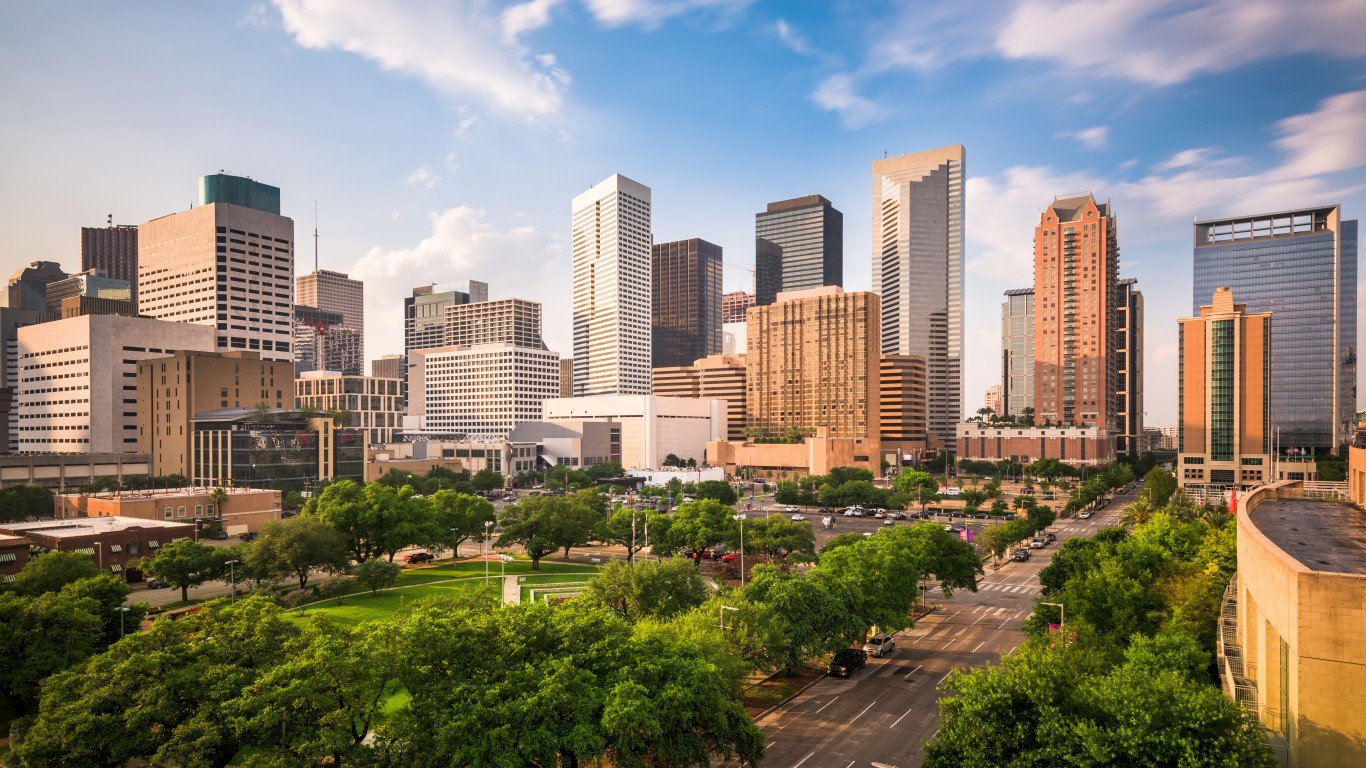
47. Texas
> Pct. of workers in unions: 4.3%
> Change in union membership (2008-2018): -0.2 ppt. (the smallest decrease)
> Union workers: 511,944 (9th most)
> Avg. annual wage: $55,374 (12th highest)
 24/7 Wall St.
Source: Adventure_Photo / Getty Images
48. Utah
> Pct. of workers in unions: 4.1%
> Change in union membership (2008-2018): -1.7 ppt. (19th largest decrease)
> Union workers: 55,634 (11th fewest)
> Avg. annual wage: $47,447 (19th lowest)

Source: Sean Pavone / Getty Images
49. North Carolina
> Pct. of workers in unions: 2.7%
> Change in union membership (2008-2018): -0.8 ppt. (7th smallest decrease)
> Union workers: 117,060 (23rd fewest)
> Avg. annual wage: $49,867 (25th highest)
[in-text-ad-2]

Source: Sean Pavone / Getty Images
50. South Carolina
> Pct. of workers in unions: 2.7%
> Change in union membership (2008-2018): -1.2 ppt. (23rd largest decrease)
> Union workers: 55,369 (10th fewest)
> Avg. annual wage: $45,499 (13th lowest)
Sponsored: Attention Savvy Investors: Speak to 3 Financial Experts – FREE
Ever wanted an extra set of eyes on an investment you’re considering? Now you can speak with up to 3 financial experts in your area for FREE. By simply
clicking here you can begin to match with financial professionals who can help guide you through the financial decisions you’re making. And the best part? The first conversation with them is free.
Click here to match with up to 3 financial pros who would be excited to help you make financial decisions.
Thank you for reading! Have some feedback for us?
Contact the 24/7 Wall St. editorial team.
Editors' Picks

