
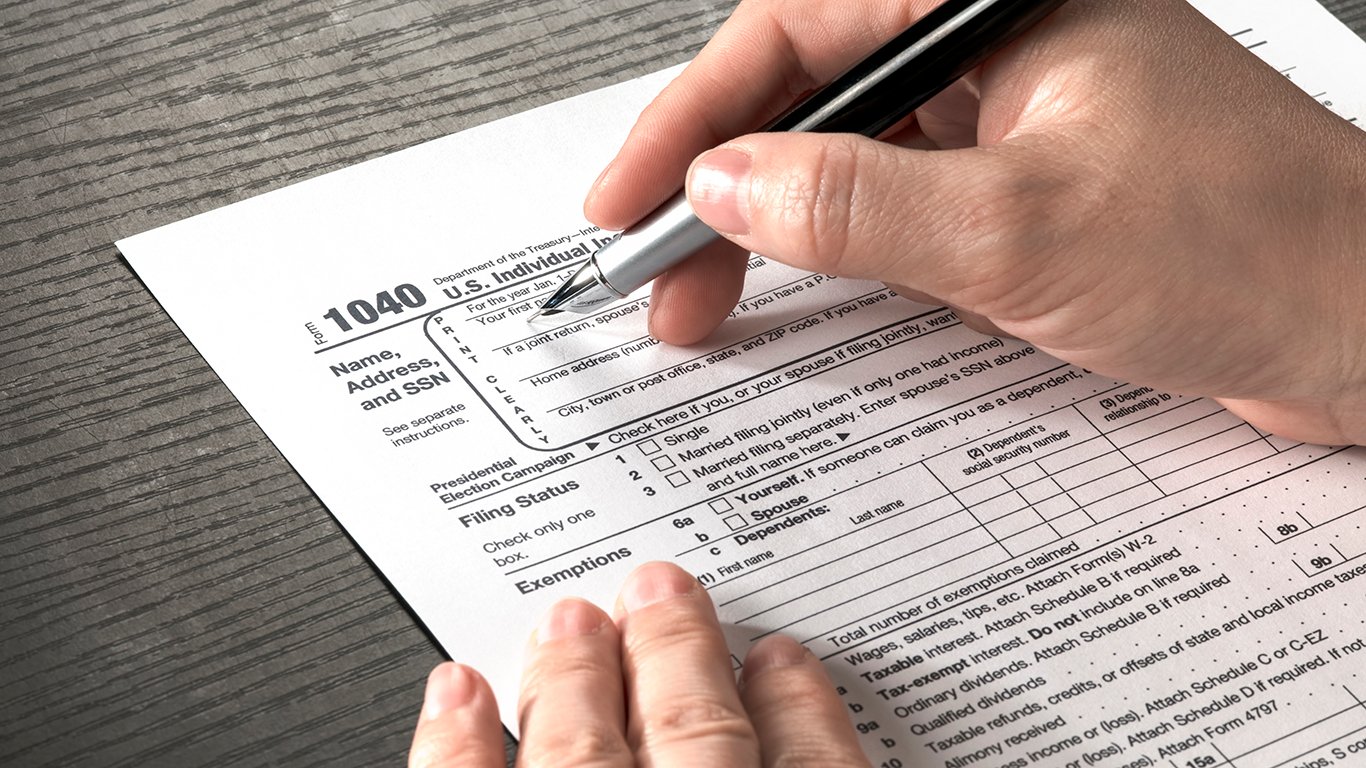
Of all potential bureaucratic ordeals, tax audits connote a level of dread few others can match. The Internal Revenue Service processed 586.1 million tax returns between 2012 and 2015 and audited 4.5 million of them.
With a full-time staff of just 76,800, the IRS has limited capacity to ensure every American pays exactly what he or she owes. But the IRS does not choose tax returns to be audited entirely at random. Tax returns that do not match established patterns are at increased risk of an audit. And though filing by the book is the best way to avoid an audit, it is by no means a guarantee.
Americans filing taxes this year should take comfort knowing that the likelihood of being selected for an audit is low. Each year, there are about 7.7 audits for every 1,000 returns. Still, in nearly every state, there is at least one county where the likelihood of being targeted by the IRS is higher than average. 24/7 Wall St. reviewed audit rates in over 3,000 counties, county equivalents, and independent cities to determine where audits are most common in every state.
While conventional wisdom may suggest wealthier Americans are more likely to avoid paying taxes, and are therefore more likely audit candidates, the opposite appears to be true. Poverty is more common in 43 of the 50 counties on this list than it is across the state as a whole — and many of these counties rank as the poorest county in the state.
This is no coincidence. Many low-income households claim the earned income tax credit — or EITC — a program designed to ease financial hardship for the working poor. According to a 2018 report released by ProPublica, a non-profit investigative publication, EITC recipients are disproportionately targeted for audit to better ensure no one is unfairly taking advantage of the system. Further reinforcing evidence of the trend, only three counties on this list have a higher median annual household income than the median nationwide of $57,652.
Click here to see the county most likely to be audited in each state
To identify the county where you are most likely to be audited in every state, 24/7 Wall St. reviewed the number of audits per 1,000 tax returns in 3,142 counties, county equivalents, and independent cities. Audit rates were calculated by tax analysis website, Tax Notes, using four years of data — from 2012 to 2015. State audit rates were calculated by averaging county-level data. Median household income, poverty rates, and educational attainment rates are five-year estimates from the U.S. Census Bureau’s 2017 American Community Survey.

Source: BOB WESTON / Getty Images
Alabama: Greene County
> Audits per 1,000 tax returns: 10.9 (state: 8.2)
> Median household income: $20,954 (state: $46,472)
> Poverty rate: 38.8% (state: 18.0%)
> Adults with a bachelor’s degree: 11.4% (state: 24.5%)
See all stories featuring: Alabama
[in-text-ad]

Source: Public Domain / Wikimedia Commons
Alaska: Kusilvak Census Area
> Audits per 1,000 tax returns: 9.4 (state: 7.0)
> Median household income: $36,468 (state: $76,114)
> Poverty rate: 39.1% (state: 10.2%)
> Adults with a bachelor’s degree: 4.9% (state: 29.0%)
See all stories featuring: Alaska
 24/7 Wall St.
Source: Ammodramus / Wikimedia Commons
Arizona: Santa Cruz County
> Audits per 1,000 tax returns: 10.0 (state: 7.9)
> Median household income: $39,630 (state: $53,510)
> Poverty rate: 21.8% (state: 17.0%)
> Adults with a bachelor’s degree: 22.1% (state: 28.4%)
See all stories featuring: Arizona

Source: BOB WESTON / Getty Images
Arkansas: Phillips County
> Audits per 1,000 tax returns: 10.2 (state: 8.1)
> Median household income: $26,652 (state: $43,813)
> Poverty rate: 33.0% (state: 18.1%)
> Adults with a bachelor’s degree: 11.3% (state: 22.0%)
See all stories featuring: Arkansas
[in-text-ad-2]

Source: 54144402@N03 / Flickr
California: Imperial County
> Audits per 1,000 tax returns: 9.7 (state: 8.0)
> Median household income: $44,779 (state: $67,169)
> Poverty rate: 23.8% (state: 15.1%)
> Adults with a bachelor’s degree: 14.3% (state: 32.6%)
See all stories featuring: California

Source: Jeffrey Beall / Wikimedia Commons
Colorado: Saguache County
> Audits per 1,000 tax returns: 9.5 (state: 7.4)
> Median household income: $34,765 (state: $65,458)
> Poverty rate: 21.0% (state: 11.5%)
> Adults with a bachelor’s degree: 26.0% (state: 39.4%)
See all stories featuring: Colorado
[in-text-ad]

Source: stockphoto52 / iStock
Connecticut: Fairfield County
> Audits per 1,000 tax returns: 8.2 (state: 7.4)
> Median household income: $89,773 (state: $73,781)
> Poverty rate: 8.8% (state: 10.1%)
> Adults with a bachelor’s degree: 46.5% (state: 38.4%)
See all stories featuring: Connecticut
 24/7 Wall St.
Source: aimintang / Getty Images
Delaware: Sussex County
> Audits per 1,000 tax returns: 7.4 (state: 7.3)
> Median household income: $57,901 (state: $63,036)
> Poverty rate: 12.0% (state: 12.1%)
> Adults with a bachelor’s degree: 25.1% (state: 31.0%)
See all stories featuring: Delaware

Source: Sean Pavone / Getty Images
Florida: Miami-Dade County
> Audits per 1,000 tax returns: 9.1 (state: 8.2)
> Median household income: $46,338 (state: $50,883)
> Poverty rate: 19.0% (state: 15.5%)
> Adults with a bachelor’s degree: 27.8% (state: 28.5%)
See all stories featuring: Florida
[in-text-ad-2]

Source: usdagov / Flickr
Georgia: Calhoun County
> Audits per 1,000 tax returns: 10.8 (state: 8.4)
> Median household income: $29,617 (state: $52,977)
> Poverty rate: 32.2% (state: 16.9%)
> Adults with a bachelor’s degree: 9.4% (state: 29.9%)
See all stories featuring: Georgia

Source: Ken Lund / Flickr
Hawaii: Hawaii County
> Audits per 1,000 tax returns: 8.1 (state: 7.4)
> Median household income: $56,395 (state: $74,923)
> Poverty rate: 17.4% (state: 10.3%)
> Adults with a bachelor’s degree: 28.6% (state: 32.0%)
See all stories featuring: Hawaii
[in-text-ad]

Source: Mav / Wikimedia Commons
Idaho: Butte County
> Audits per 1,000 tax returns: 9.3 (state: 7.7)
> Median household income: $43,207 (state: $50,985)
> Poverty rate: 16.2% (state: 14.5%)
> Adults with a bachelor’s degree: 15.5% (state: 26.8%)
See all stories featuring: Idaho

Source: BOB WESTON / Getty Images
Illinois: Alexander County
> Audits per 1,000 tax returns: 8.8 (state: 7.5)
> Median household income: $31,014 (state: $61,229)
> Poverty rate: 33.4% (state: 13.5%)
> Adults with a bachelor’s degree: 10.7% (state: 33.4%)
See all stories featuring: Illinois

Source: Jeremy Christensen / Getty Images
Indiana: Marion County
> Audits per 1,000 tax returns: 7.8 (state: 7.3)
> Median household income: $44,869 (state: $52,182)
> Poverty rate: 19.8% (state: 14.6%)
> Adults with a bachelor’s degree: 29.7% (state: 25.3%)
See all stories featuring: Indiana
[in-text-ad-2]

Source: kenlund / Flickr
Iowa: Ringgold County
> Audits per 1,000 tax returns: 8.5 (state: 7.0)
> Median household income: $50,642 (state: $56,570)
> Poverty rate: 10.9% (state: 12.0%)
> Adults with a bachelor’s degree: 20.1% (state: 27.7%)
See all stories featuring: Iowa

Source: 156513724@N05 / Flickr
Kansas: Sheridan County
> Audits per 1,000 tax returns: 9.3 (state: 7.3)
> Median household income: $56,607 (state: $55,477)
> Poverty rate: 4.8% (state: 12.8%)
> Adults with a bachelor’s degree: 24.6% (state: 32.3%)
See all stories featuring: Kansas
[in-text-ad]

Source: Jfacew / Wikimedia Commons
Kentucky: Clay County
> Audits per 1,000 tax returns: 9.9 (state: 7.7)
> Median household income: $24,596 (state: $46,535)
> Poverty rate: 39.5% (state: 18.3%)
> Adults with a bachelor’s degree: 9.5% (state: 23.2%)
See all stories featuring: Kentucky

Source: editor / Flickr
Louisiana: East Carroll Parish
> Audits per 1,000 tax returns: 11.4 (state: 8.4)
> Median household income: $20,795 (state: $46,710)
> Poverty rate: 48.2% (state: 19.6%)
> Adults with a bachelor’s degree: 9.8% (state: 23.4%)
See all stories featuring: Louisiana

Source: ArendTrent / Getty Images
Maine: Washington County
> Audits per 1,000 tax returns: 7.9 (state: 7.2)
> Median household income: $40,328 (state: $53,024)
> Poverty rate: 18.2% (state: 12.9%)
> Adults with a bachelor’s degree: 20.9% (state: 30.3%)
See all stories featuring: Maine
[in-text-ad-2]

Source: Alexphotographic / Getty Images
Maryland: Baltimore
> Audits per 1,000 tax returns: 8.3 (state: 7.3)
> Median household income: $46,641 (state: $78,916)
> Poverty rate: 22.4% (state: 9.7%)
> Adults with a bachelor’s degree: 30.4% (state: 39.0%)
See all stories featuring: Maryland

Source: milesgehm / Flickr
Massachusetts: Nantucket County
> Audits per 1,000 tax returns: 7.6 (state: 7.2)
> Median household income: $91,942 (state: $74,167)
> Poverty rate: 11.2% (state: 11.1%)
> Adults with a bachelor’s degree: 45.1% (state: 42.1%)
See all stories featuring: Massachusetts
[in-text-ad]

Source: Kimberly Skirha / Getty Images
Michigan: Wayne County
> Audits per 1,000 tax returns: 8.1 (state: 7.4)
> Median household income: $43,702 (state: $52,668)
> Poverty rate: 23.7% (state: 15.6%)
> Adults with a bachelor’s degree: 22.8% (state: 28.1%)
See all stories featuring: Michigan

Source: afiler / Flickr
Minnesota: Mahnomen County
> Audits per 1,000 tax returns: 8.4 (state: 7.0)
> Median household income: $42,439 (state: $65,699)
> Poverty rate: 22.7% (state: 10.5%)
> Adults with a bachelor’s degree: 12.1% (state: 34.8%)
See all stories featuring: Minnesota

Source: BOB WESTON / Getty Images
Mississippi: Humphreys County
> Audits per 1,000 tax returns: 11.8 (state: 8.9)
> Median household income: $26,188 (state: $42,009)
> Poverty rate: 40.5% (state: 21.5%)
> Adults with a bachelor’s degree: 13.6% (state: 21.3%)
See all stories featuring: Mississippi
[in-text-ad-2]

Source: kenspix / Flickr
Missouri: Pemiscot County
> Audits per 1,000 tax returns: 9.5 (state: 7.6)
> Median household income: $32,468 (state: $51,542)
> Poverty rate: 28.5% (state: 14.6%)
> Adults with a bachelor’s degree: 12.0% (state: 28.2%)
See all stories featuring: Missouri

Source: Andrew Filer / Flickr
Montana: Big Horn County
> Audits per 1,000 tax returns: 9.6 (state: 7.4)
> Median household income: $47,276 (state: $50,801)
> Poverty rate: 26.8% (state: 14.4%)
> Adults with a bachelor’s degree: 17.6% (state: 30.7%)
See all stories featuring: Montana
[in-text-ad]

Source: jaredwinkler / Flickr
Nebraska: Greeley County
> Audits per 1,000 tax returns: 9.5 (state: 7.2)
> Median household income: $47,218 (state: $56,675)
> Poverty rate: 9.8% (state: 12.0%)
> Adults with a bachelor’s degree: 17.3% (state: 30.6%)
See all stories featuring: Nebraska

Source: LPETTET / Getty Images
Nevada: Clark County
> Audits per 1,000 tax returns: 7.7 (state: 7.6)
> Median household income: $54,882 (state: $55,434)
> Poverty rate: 14.6% (state: 14.2%)
> Adults with a bachelor’s degree: 23.3% (state: 23.7%)
See all stories featuring: Nevada

Source: BOB WESTON / Getty Images
New Hampshire: Coos County
> Audits per 1,000 tax returns: 7.3 (state: 6.9)
> Median household income: $45,386 (state: $71,305)
> Poverty rate: 13.3% (state: 8.1%)
> Adults with a bachelor’s degree: 18.3% (state: 36.0%)
See all stories featuring: New Hampshire
[in-text-ad-2]

Source: JERRYE & ROY KLOTZ, M.D. / Wikimedia Commons
New Jersey: Essex County
> Audits per 1,000 tax returns: 8.4 (state: 7.5)
> Median household income: $57,365 (state: $76,475)
> Poverty rate: 16.7% (state: 10.7%)
> Adults with a bachelor’s degree: 34.0% (state: 38.1%)
See all stories featuring: New Jersey

Source: BriYYZ / Flickr
New Mexico: McKinley County
> Audits per 1,000 tax returns: 10.2 (state: 8.1)
> Median household income: $30,336 (state: $46,718)
> Poverty rate: 37.5% (state: 20.6%)
> Adults with a bachelor’s degree: 10.8% (state: 26.9%)
See all stories featuring: New Mexico
[in-text-ad]

Source: Deberarr / iStock
New York: Bronx County
> Audits per 1,000 tax returns: 9.1 (state: 7.8)
> Median household income: $36,593 (state: $62,765)
> Poverty rate: 29.7% (state: 15.1%)
> Adults with a bachelor’s degree: 19.4% (state: 35.3%)
See all stories featuring: New York

Source: https://www.flickr.com/photos/amerune
North Carolina: Edgecombe County
> Audits per 1,000 tax returns: 9.3 (state: 7.9)
> Median household income: $32,929 (state: $50,320)
> Poverty rate: 24.6% (state: 16.1%)
> Adults with a bachelor’s degree: 11.6% (state: 29.9%)
See all stories featuring: North Carolina
Source: https://www.flickr.com/photos/afiler/
North Dakota: Sioux County
> Audits per 1,000 tax returns: 9.5 (state: 7.0)
> Median household income: $40,795 (state: $61,285)
> Poverty rate: 37.1% (state: 11.0%)
> Adults with a bachelor’s degree: 17.3% (state: 28.9%)
See all stories featuring: North Dakota
[in-text-ad-2]

Source: Aesopposea / Wikimedia Commons
Ohio: Adams County
> Audits per 1,000 tax returns: 8.0 (state: 7.2)
> Median household income: $36,320 (state: $52,407)
> Poverty rate: 23.8% (state: 14.9%)
> Adults with a bachelor’s degree: 12.1% (state: 27.2%)
See all stories featuring: Ohio

Source: Courtesy of Omnedon via Wikimedia Commons
Oklahoma: Adair County
> Audits per 1,000 tax returns: 9.4 (state: 7.8)
> Median household income: $33,366 (state: $49,767)
> Poverty rate: 30.8% (state: 16.2%)
> Adults with a bachelor’s degree: 13.6% (state: 24.8%)
See all stories featuring: Oklahoma
[in-text-ad]

Source: Rex_Wholster / Getty Images
Oregon: Sherman County
> Audits per 1,000 tax returns: 8.5 (state: 7.3)
> Median household income: $42,074 (state: $56,119)
> Poverty rate: 13.7% (state: 14.9%)
> Adults with a bachelor’s degree: 17.6% (state: 32.3%)
See all stories featuring: Oregon
Source: JERRYE & ROY KLOTZ, M.D. / Wikimedia Commons
Pennsylvania: Philadelphia County
> Audits per 1,000 tax returns: 8.4 (state: 7.2)
> Median household income: $40,649 (state: $56,951)
> Poverty rate: 25.8% (state: 13.1%)
> Adults with a bachelor’s degree: 27.1% (state: 30.1%)
See all stories featuring: Pennsylvania

Source: cmh2315fl / Flickr
Rhode Island: Providence County
> Audits per 1,000 tax returns: 7.5 (state: 7.2)
> Median household income: $52,530 (state: $61,043)
> Poverty rate: 16.7% (state: 13.4%)
> Adults with a bachelor’s degree: 27.8% (state: 33.0%)
See all stories featuring: Rhode Island
[in-text-ad-2]

Source: Upstateherd / Wikimedia Commons
South Carolina: Allendale County
> Audits per 1,000 tax returns: 10.3 (state: 8.0)
> Median household income: $23,331 (state: $48,781)
> Poverty rate: 30.4% (state: 16.6%)
> Adults with a bachelor’s degree: 9.4% (state: 27.0%)
See all stories featuring: South Carolina

Source: Jimmy Emerson, DVM / Flickr
South Dakota: Oglala Lakota County
> Audits per 1,000 tax returns: 11.2 (state: 7.3)
> Median household income: $27,804 (state: $54,126)
> Poverty rate: 51.9% (state: 13.9%)
> Adults with a bachelor’s degree: 12.4% (state: 27.8%)
See all stories featuring: South Dakota
[in-text-ad]

Source: Thomas R Machnitzki (thomasmachnitzki.com) / Wikimedia Commons
Tennessee: Lake County
> Audits per 1,000 tax returns: 9.3 (state: 7.9)
> Median household income: $31,993 (state: $48,708)
> Poverty rate: 29.9% (state: 16.7%)
> Adults with a bachelor’s degree: 9.4% (state: 26.1%)
See all stories featuring: Tennessee
Source: formulanone / Flickr
Texas: Starr County
> Audits per 1,000 tax returns: 10.4 (state: 8.1)
> Median household income: $27,133 (state: $57,051)
> Poverty rate: 35.0% (state: 16.0%)
> Adults with a bachelor’s degree: 9.7% (state: 28.7%)
See all stories featuring: Texas

Source: kenlund / Flickr
Utah: Rich County
> Audits per 1,000 tax returns: 9.0 (state: 7.2)
> Median household income: $52,917 (state: $65,325)
> Poverty rate: 18.0% (state: 11.0%)
> Adults with a bachelor’s degree: 22.8% (state: 32.5%)
See all stories featuring: Utah
[in-text-ad-2]

Source: usfwsnortheast / Flickr
Vermont: Essex County
> Audits per 1,000 tax returns: 8.0 (state: 7.1)
> Median household income: $38,767 (state: $57,808)
> Poverty rate: 15.5% (state: 11.4%)
> Adults with a bachelor’s degree: 14.7% (state: 36.8%)
See all stories featuring: Vermont

Source: macbeck / Flickr
Virginia: Emporia city
> Audits per 1,000 tax returns: 9.6 (state: 7.5)
> Median household income: $27,426 (state: $68,766)
> Poverty rate: 30.9% (state: 11.2%)
> Adults with a bachelor’s degree: 15.3% (state: 37.6%)
See all stories featuring: Virginia
[in-text-ad]

Source: JeffGoulden / Getty Images
Washington: Garfield County
> Audits per 1,000 tax returns: 8.4 (state: 7.2)
> Median household income: $51,399 (state: $66,174)
> Poverty rate: 11.7% (state: 12.2%)
> Adults with a bachelor’s degree: 23.0% (state: 34.5%)
See all stories featuring: Washington

Source: Magnolia677 / Wikimedia Commons
West Virginia: McDowell County
> Audits per 1,000 tax returns: 8.6 (state: 7.4)
> Median household income: $25,595 (state: $44,061)
> Poverty rate: 34.9% (state: 17.8%)
> Adults with a bachelor’s degree: 4.9% (state: 19.9%)
See all stories featuring: West Virginia

Source: Courtesy of Wisconsin Department of Natural Resources via Flickr
Wisconsin: Menominee County
> Audits per 1,000 tax returns: 9.2 (state: 6.9)
> Median household income: $38,080 (state: $56,759)
> Poverty rate: 35.8% (state: 12.3%)
> Adults with a bachelor’s degree: 15.9% (state: 29.0%)
See all stories featuring: Wisconsin
[in-text-ad-2]
Source: diversey / Flickr
Wyoming: Niobrara County
> Audits per 1,000 tax returns: 8.8 (state: 7.1)
> Median household income: $36,793 (state: $60,938)
> Poverty rate: 14.9% (state: 11.1%)
> Adults with a bachelor’s degree: 18.3% (state: 26.7%)
See all stories featuring: Wyoming
Take This Retirement Quiz To Get Matched With A Financial Advisor (Sponsored)
Take the quiz below to get matched with a financial advisor today.
Each advisor has been vetted by SmartAsset and is held to a fiduciary standard to act in your best interests.
Here’s how it works:
1. Answer SmartAsset advisor match quiz
2. Review your pre-screened matches at your leisure. Check out the
advisors’ profiles.
3. Speak with advisors at no cost to you. Have an introductory call on the phone or introduction in person and choose whom to work with in the future
Take the retirement quiz right here.
Thank you for reading! Have some feedback for us?
Contact the 24/7 Wall St. editorial team.
Editors' Picks

