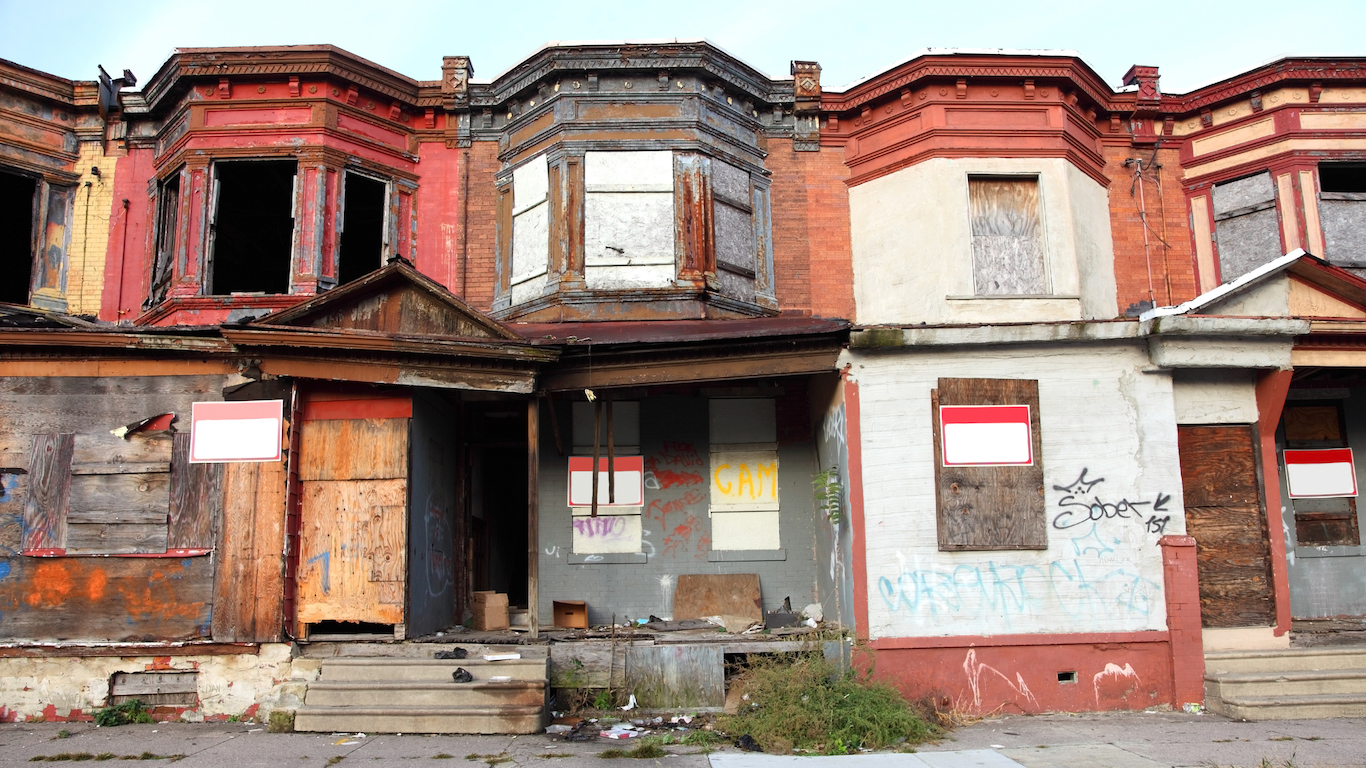
For the nearly 46.9 million Americans living below the poverty line, financial insecurity affects nearly every aspect of daily life — from personal relationships to physical and mental health. Just as poverty takes a toll on the individual, communities where large shares of the populations live in poverty can also suffer tremendously.
The U.S. poverty rate stands at 14.6%. Concentrated poverty is defined as neighborhoods with poverty rates of 40% or more. Individuals living on poverty level income in concentrated poverty neighborhoods face not only the personal effects of poverty, but also broader, communal effects. These often include higher crime rates, underperforming schools, and limited economic opportunity.
Nationwide, 11.3% of those living in poverty also live in concentrated poverty neighborhoods. This level of extreme poverty is much more common in some of America’s largest cities. Using data from the U.S. Census Bureau, 24/7 Wall St. reviewed the share of the population living below the poverty line in concentrated poverty neighborhoods in the nation’s 100 largest metro areas to identify the cities hit hardest by extreme poverty.
The cities on this list are not necessarily the poorest cities in the country. Several, including Cincinnati, New York, and Philadelphia, actually have a lower poverty rate than the U.S. as a whole. They are, however, the most economically segregated cities in the country.
Concentrated poverty neighborhoods foster a vicious cycle of poverty among those who live there, and economic and social mobility in these places tend to be limited. In most of these cities, residents of concentrated poverty neighborhoods are less than half as likely to be homeowners and have a college education and more than twice as likely to be unemployed as residents of neighborhoods with poverty rates below 40%.
Often, non-white minority residents of the cities on this list are disproportionately affected by extreme poverty. Several cities on this list also rank among the worst cities for black Americans.
Click here to see the cities hit hardest by extreme poverty
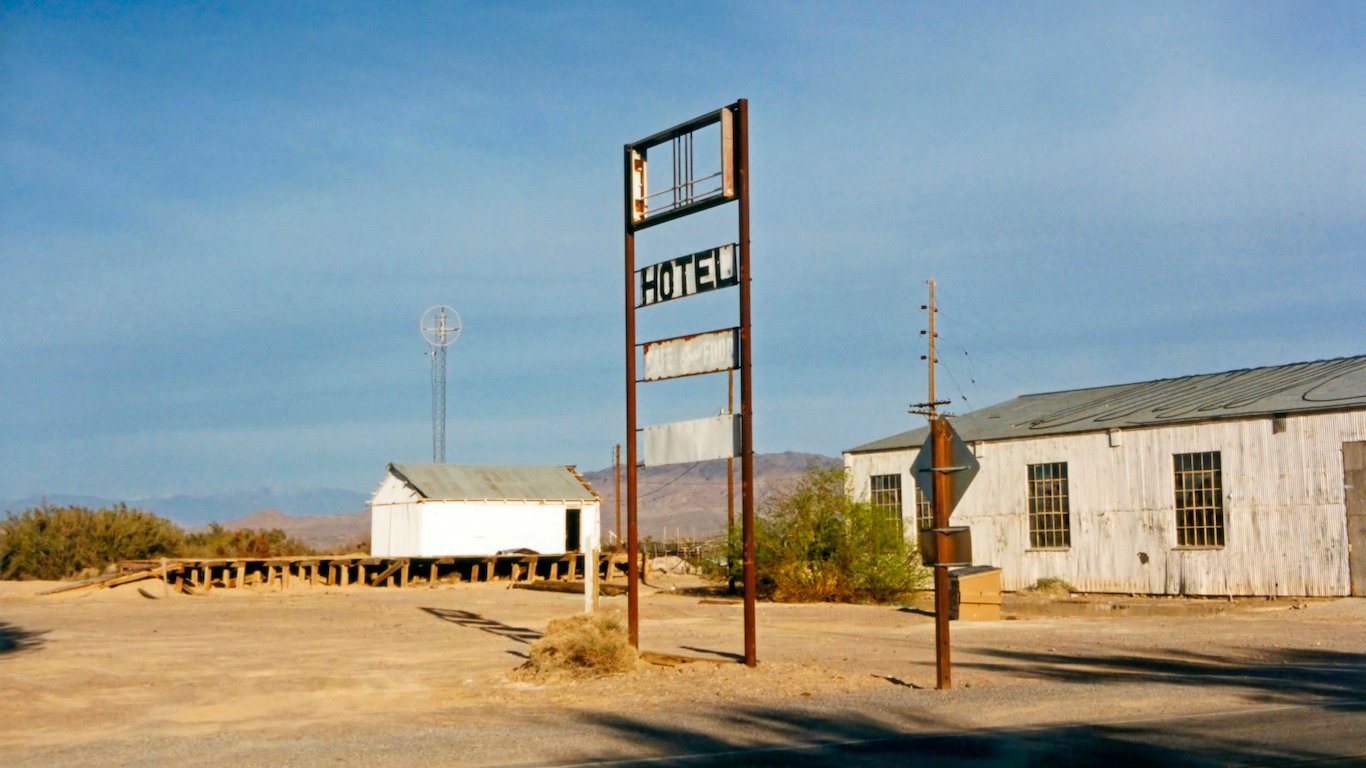
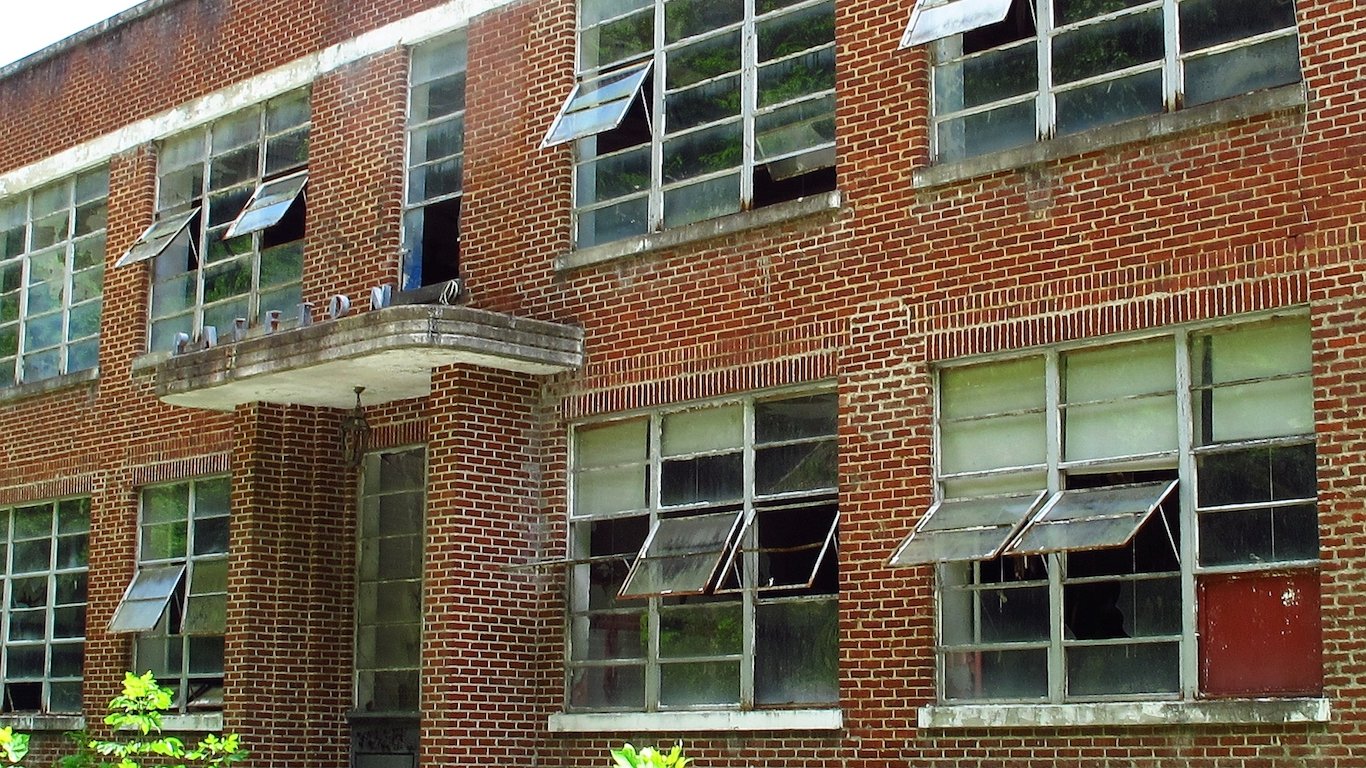
Source: Ron Reiring / Wikimedia Commons
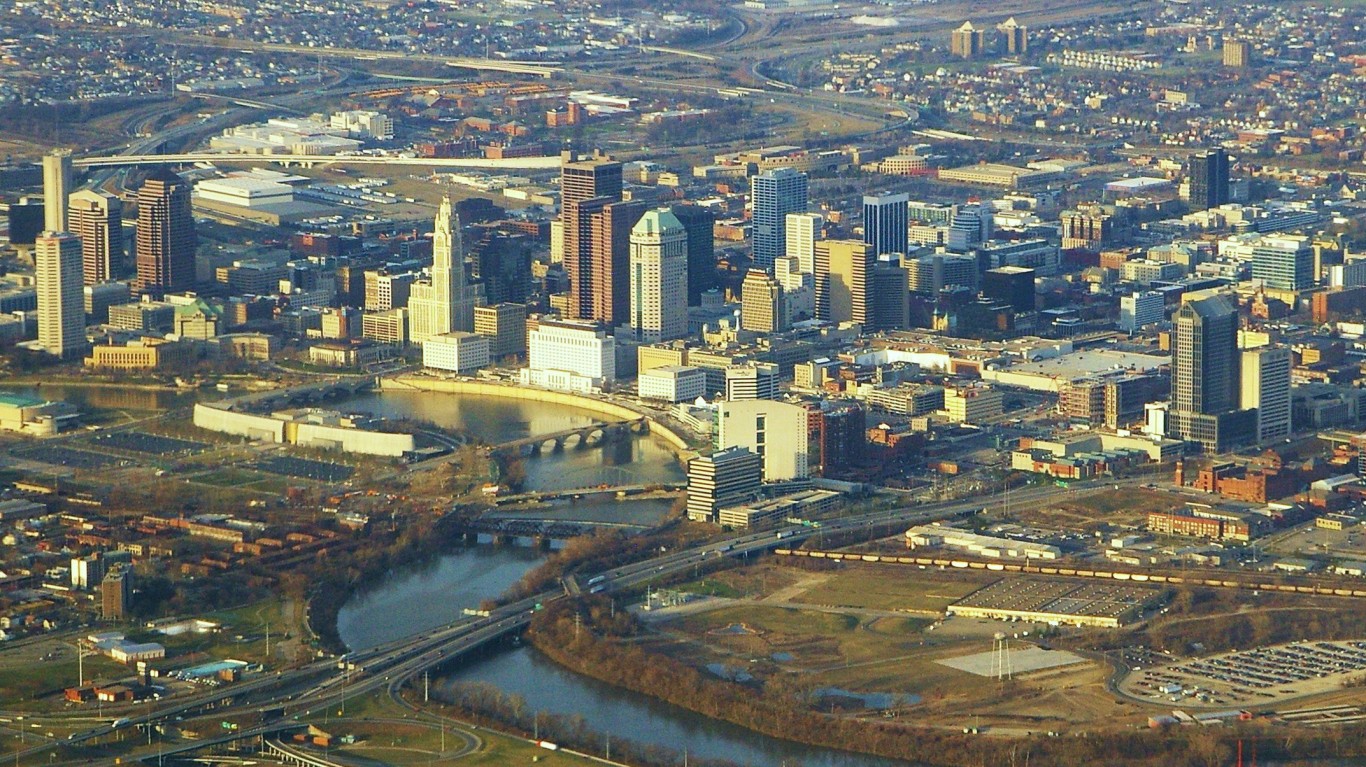
22. Columbus, OH
> Concentrated poverty rate: 15.2%
> Unemployment in poor neighborhoods: 12.2%
> Total number of poor neighborhoods: 28 (6.6% of all neighborhoods)
> Change in concentrated poverty (2011-2017): -0.5 ppt
Columbus, Ohio, is one of the most economically segregated metro areas in the United States. More than 15% of the metro area’s impoverished population lives in neighborhoods where at least 40% of residents live in poverty.
Due to several environmental factors, such as unemployment, upward social mobility is limited in concentrated poverty neighborhoods. Across Columbus’s poor neighborhoods, the 12.2% jobless rate is more than double the 4.9% unemployment rate in the remaining parts of the metro area. Additionally, the 26.4% homeownership rate in the metro area’s concentrated poverty neighborhoods is less than half the 63.5% homeownership rate in the rest of the metro area.
[in-text-ad]
Source: Sean Pavone / Getty Images
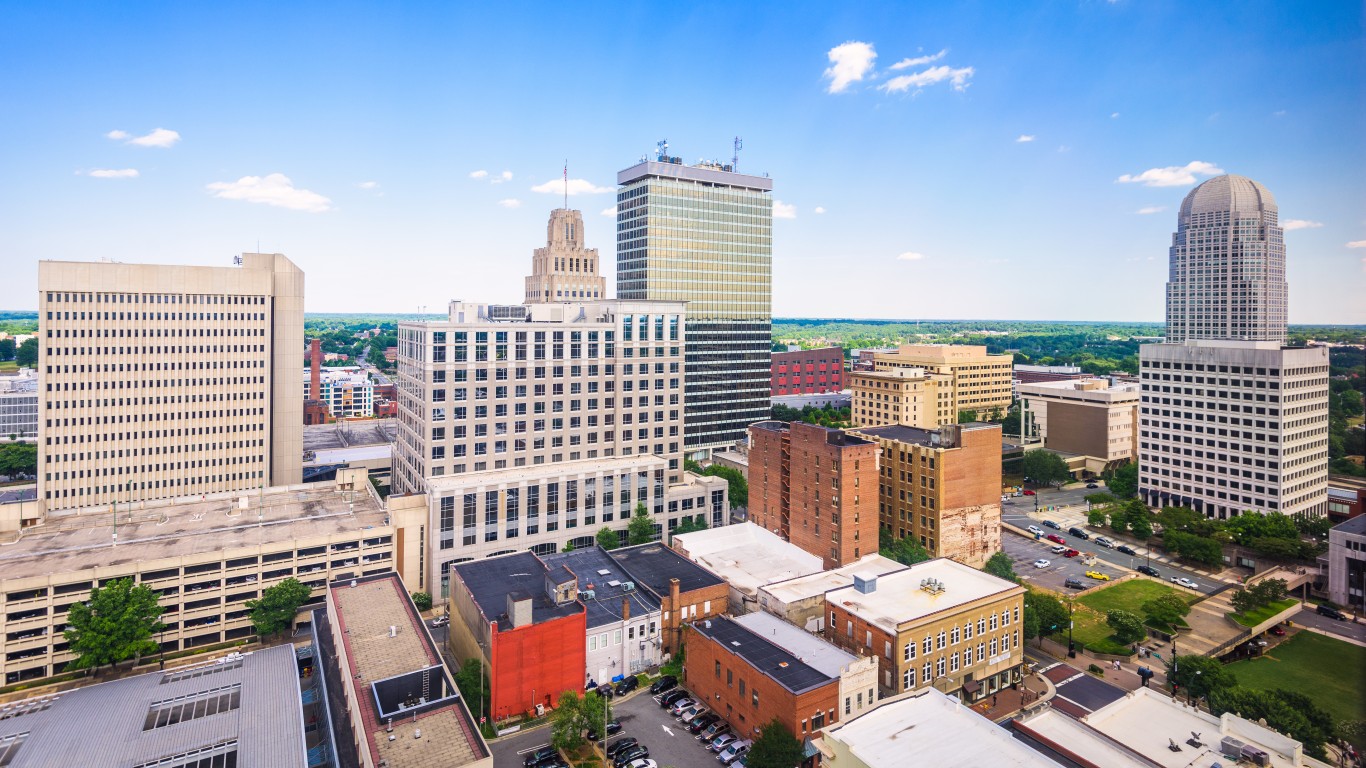
21. Winston-Salem, NC
> Concentrated poverty rate: 15.4%
> Unemployment in poor neighborhoods: 14.8%
> Total number of poor neighborhoods: 14 (9.5% of all neighborhoods)
> Change in concentrated poverty (2011-2017): -9.0 ppt
There are 14 Census tracts or neighborhoods in the Winston-Salem metro area where at least 40% of residents live below the poverty line. As of 2017, over 17,000 people, or 15.4% of the metro area residents who live on poverty level income, lived in one of those neighborhoods. For reference, 11.3% of Americans living below the poverty line are in similarly poor neighborhoods.
Despite the relatively high extreme poverty rate, Winston-Salem has improved considerably in recent years. The metro area’s most recent extreme poverty rate marks a 9 percentage point improvement from the 24.4% rate in 2011.
 24/7 Wall St.
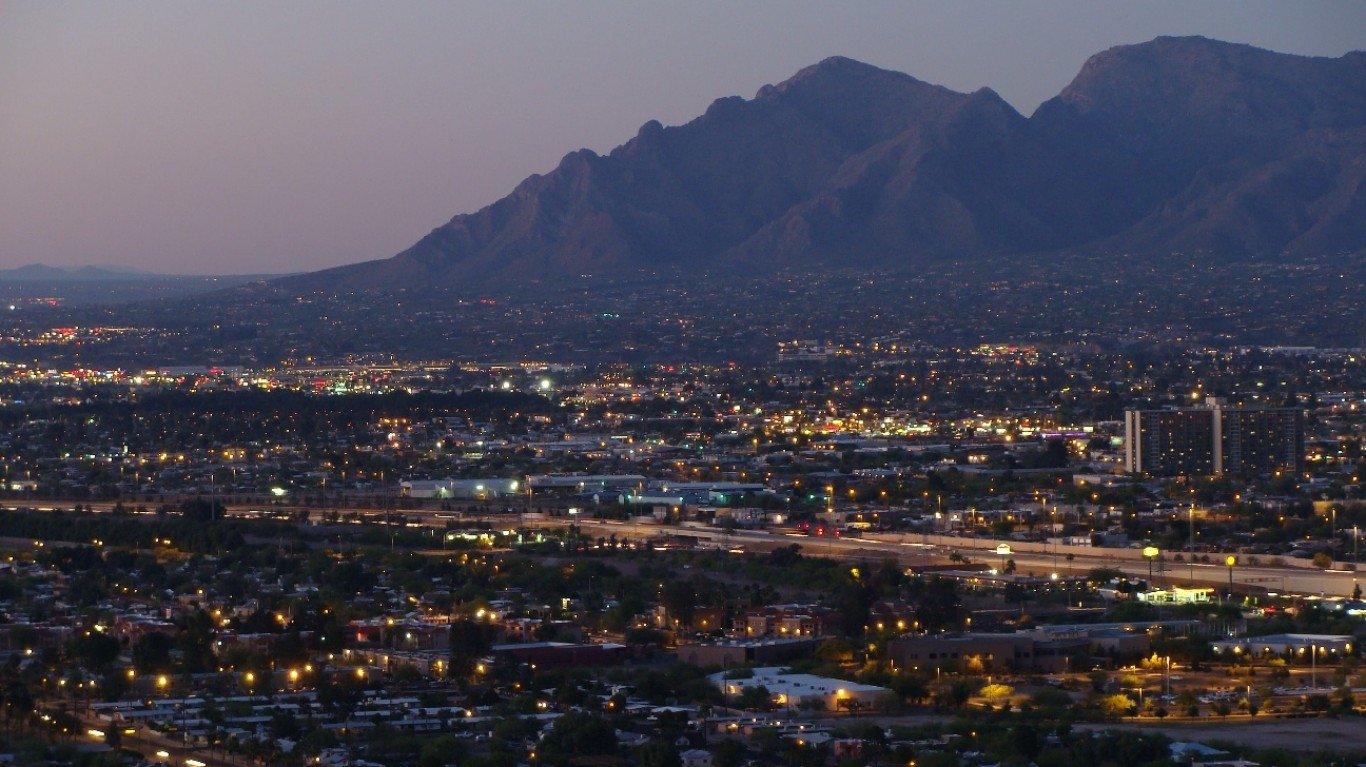
Source: Zereshk / Wikimedia Commons
20. Tucson, AZ
> Concentrated poverty rate: 15.5%
> Unemployment in poor neighborhoods: 18.0%
> Total number of poor neighborhoods: 19 (8.0% of all neighborhoods)
> Change in concentrated poverty (2011-2017): -5.6 ppt
In the Tucson metro area, nearly 28,000 people live on poverty level incomes in poor neighborhoods. The metro area’s poor communities are characterized by widespread joblessness with 18% of the labor force unemployed, compared to a 7.7% unemployment rate in the metro area’s other neighborhoods, where fewer than 40% of the population lives in poverty.
Incomes tend to rise with educational attainment, and just 68.3% of adults in Tucson’s poor neighborhoods have completed high school, well below the 89.2% of adults who completed high school in the city’s other neighborhoods.
Source: DenisTangneyJr / Getty Images
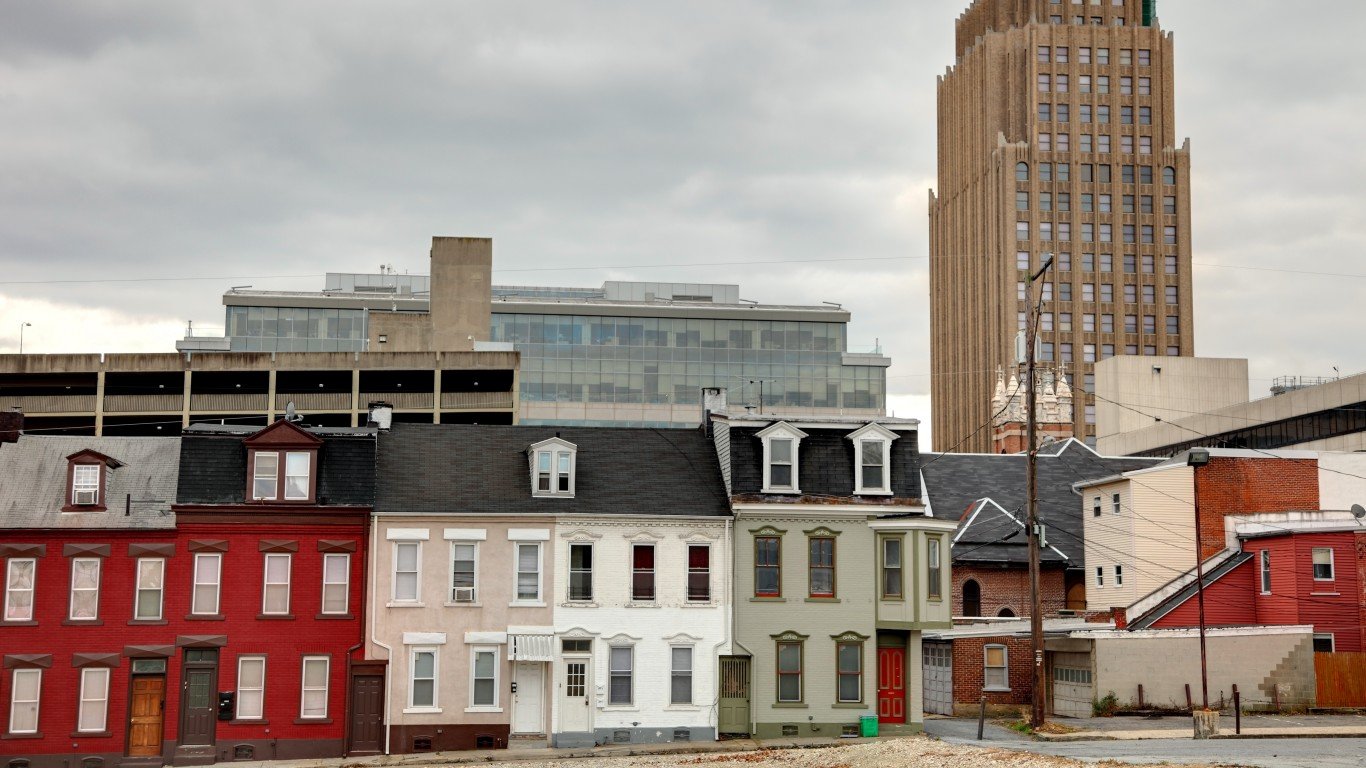
19. Allentown-Bethlehem-Easton, PA-NJ
> Concentrated poverty rate: 15.6%
> Unemployment in poor neighborhoods: 17.3%
> Total number of poor neighborhoods: 8 (4.5% of all neighborhoods)
> Change in concentrated poverty (2011-2017): -2.8 ppt
Allentown-Bethlehem-Easton is not an especially poor metro area. Just 11.1% of the population lives below the poverty line, a considerably smaller share than the 14.6% national poverty rate. Still, the metro area is one of the most economically segregated in the United States. Of those living in poverty, 15.6% live in neighborhoods where at least 40% of residents also live below the poverty line.
Incomes tend to go up with educational attainment, and a relatively small share of the residents in Allentown-Bethlehem-Easton metro area’s poorest neighborhoods have a college education. In metro area neighborhoods where 40% of the population lives in poverty, fewer than one in 10 adults have a bachelor’s degree, compared to nearly 30% of adults in the rest of the region.
[in-text-ad-2]
Source: jjbers / Flickr
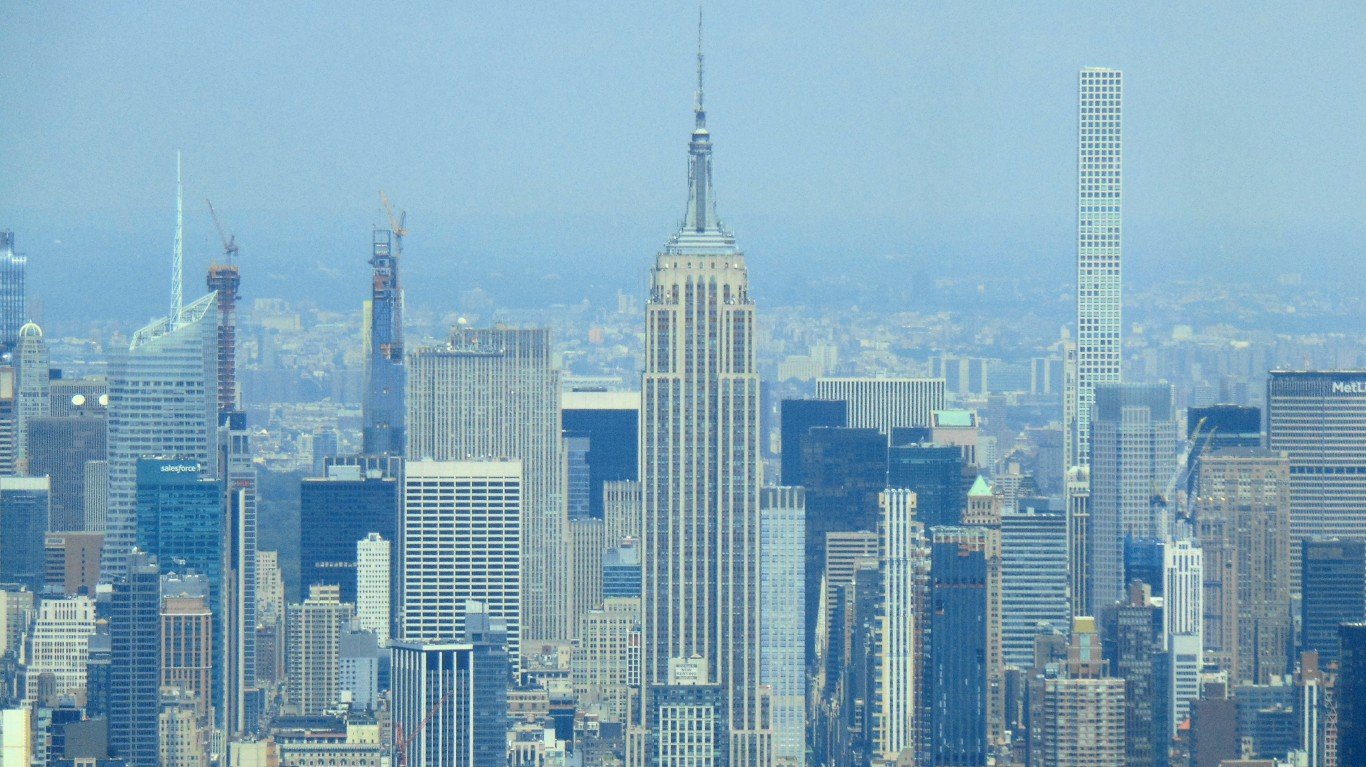
18. New York-Newark-Jersey City, NY-NJ-PA
> Concentrated poverty rate: 15.7%
> Unemployment in poor neighborhoods: 13.7%
> Total number of poor neighborhoods: 217 (4.7% of all neighborhoods)
> Change in concentrated poverty (2011-2017): +0.2 ppt
In the New York City metro area, the largest in the country, over 430,000 people live on poverty level wages in poor neighborhoods. Nationwide, minorities are more likely to live in extreme poverty conditions than white Americans. The New York metro area is a notable exception. Nearly one out of every five white metro area residents earning poverty level wages live in extreme poverty neighborhoods, compared to 18.7% of poor Hispanic New Yorkers and 12.6% of poor black New Yorkers.
Homeownership is one of the most common ways for Americans to build intergenerational wealth. In New York’s poorest neighborhoods, the homeownership rate is just 8.8% compared to over 50% in the rest of the metro area.
Source: mobili / Flickr
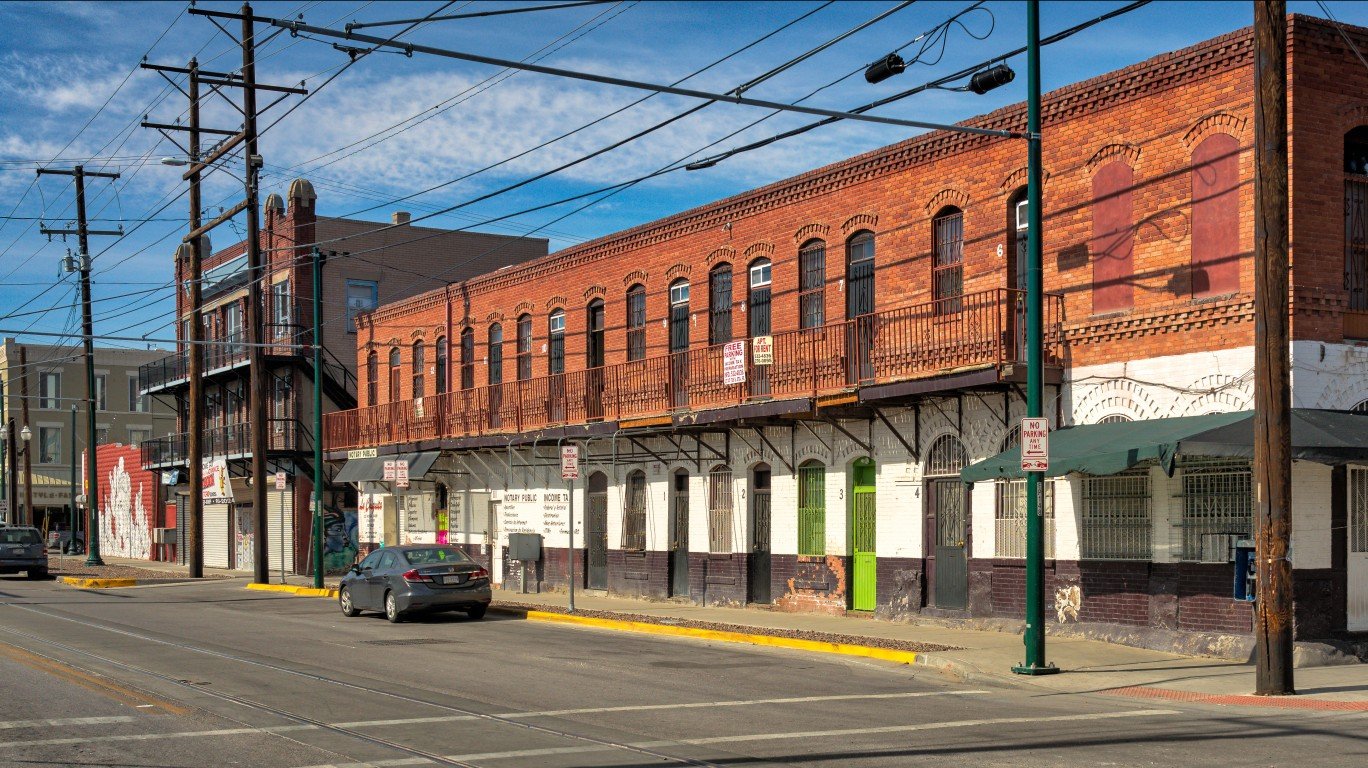
17. El Paso, TX
> Concentrated poverty rate: 16.6%
> Unemployment in poor neighborhoods: 10.6%
> Total number of poor neighborhoods: 19 (11.8% of all neighborhoods)
> Change in concentrated poverty (2011-2017): -12.2 ppt
El Paso, Texas, has a higher than average 21.8% poverty rate. Of the more than 179,000 metro area poor residents, 16.6% live in neighborhoods where at least 40% of the population is also considered poor. Despite having one of the highest extreme poverty rates in the country, El Paso has improved considerably in the last five years. As recently as 2011, the metro area’s extreme poverty rate was 28.8% — 12.2 percentage points higher than it is today.
Incomes tend to rise with educational attainment, and in El Paso’s poorest neighborhoods, nearly half of the adult population has not completed high school.
[in-text-ad]
Source: Rick Dikeman / Wikimedia Commons
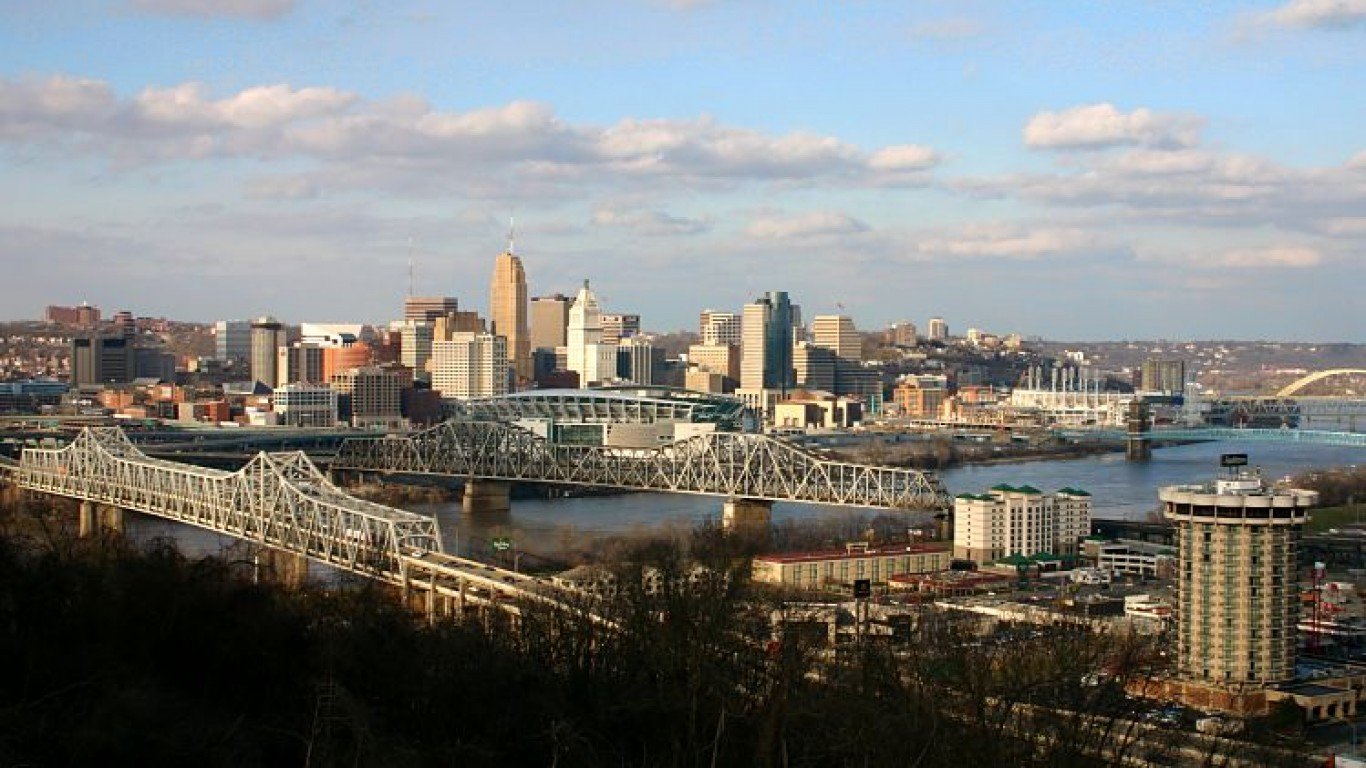
16. Cincinnati, OH-KY-IN
> Concentrated poverty rate: 17.4%
> Unemployment in poor neighborhoods: 18.8%
> Total number of poor neighborhoods: 43 (8.7% of all neighborhoods)
> Change in concentrated poverty (2011-2017): +2.5 ppt
Cincinnati is one of four Ohio cities to rank on this list. Some 279,000 people in the broader metro area live below the poverty line, and 17.4% of them face additional challenges of living in neighborhoods where at least 40% of their neighbors also live on poverty level incomes. Unemployment is a severe problem in these parts of the city, as 18.8% of workers living there are out of a job — more than triple the 5.3% unemployment rate in the rest of the metro area.
Nationwide, extreme poverty has become less common in recent years, falling 1.6 percentage points from 12.9% in 2011 to 11.3% in 2017. In Cincinnati, however, extreme poverty climbed by 2.5 percentage points over the same period, from 14.9% to 17.4%.
 24/7 Wall St.
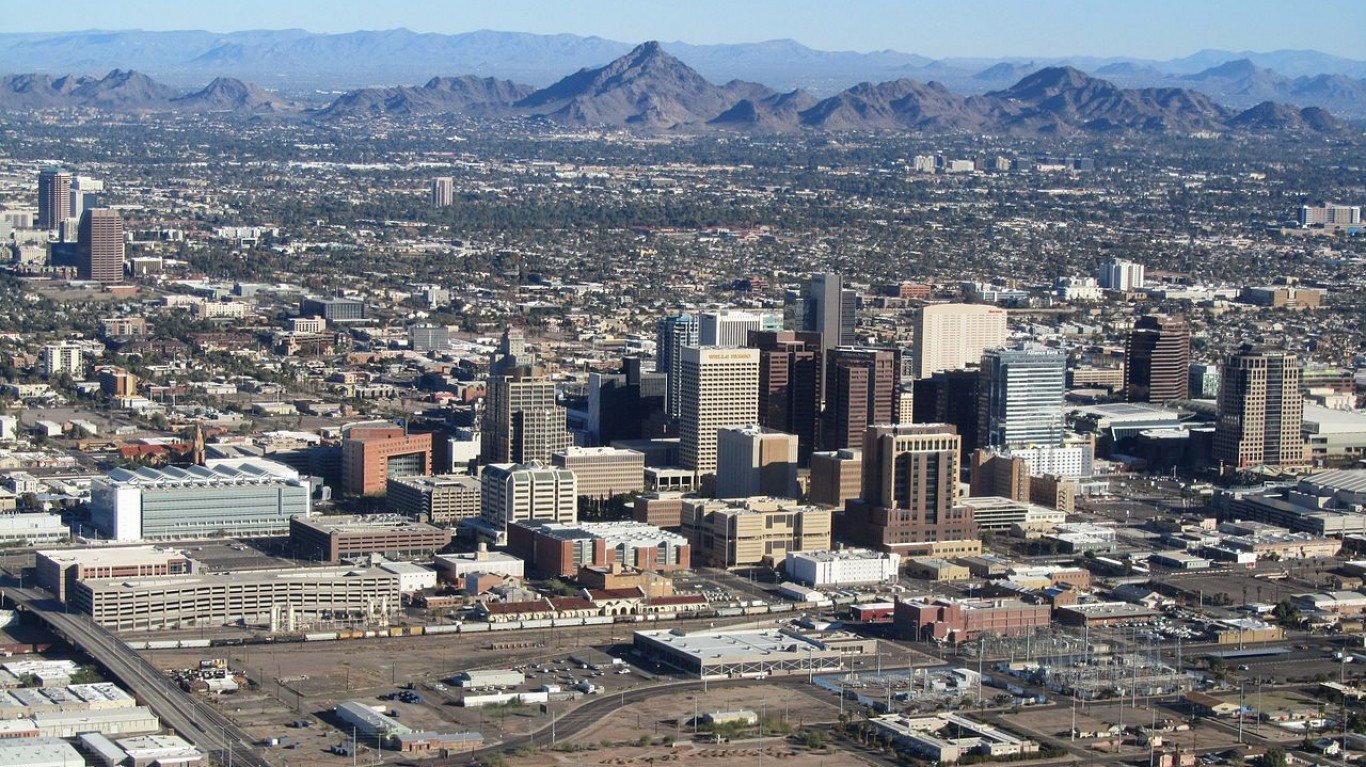
Source: Melikamp / Wikimedia Commons
15. Phoenix-Mesa-Scottsdale, AZ
> Concentrated poverty rate: 17.5%
> Unemployment in poor neighborhoods: 10.1%
> Total number of poor neighborhoods: 64 (6.6% of all neighborhoods)
> Change in concentrated poverty (2011-2017): +0.6 ppt
Nearly 123,000 people in Phoenix live on poverty level incomes in one of the metro area’s 64 extremely poor neighborhoods, where 40% of the population is poor. Americans living in extreme poverty face greater hurdles to economic and social mobility. At Phoenix’s poor neighborhoods, just 8.1% of adults have a bachelor’s degree compared to 31.4% of adults in the rest of the metro area.
Crime tends to be more common in poor neighborhoods, and the high concentration of poverty in Phoenix may be driving the metro area’s overall violent crime rate. There were 471 violent crimes for every 100,000 Phoenix residents in 2017, well above the national violent crime rate of 383 per 100,000.

Source: Sean Pavone / Getty Images
14. Philadelphia-Camden-Wilmington, PA-NJ-DE-MD
> Concentrated poverty rate: 20.1%
> Unemployment in poor neighborhoods: 19.0%
> Total number of poor neighborhoods: 89 (6.2% of all neighborhoods)
> Change in concentrated poverty (2011-2017): -1.0 ppt
The Philadelphia metro area is not especially poor — the area’s 13.1% poverty rate is below the 14.6% national poverty rate. It is, however, a heavily economically segregated metro area. Of the 773,000 people living in poverty in Philadelphia-Camden-Wilmington, over 20% are concentrated in poor neighborhoods.
Such a concentration of poverty adds to the hardship associated with financial insecurity. Poor Americans living in poor neighborhoods tend to be less upwardly mobile. For example, incomes tend to rise with education, and across the neighborhoods in Philadelphia where 40% or more of the population lives in poverty, only 8.6% of adults have a bachelor’s degree. In the rest of the metro area, 37.5% of adults have a four-year college education.
[in-text-ad-2]
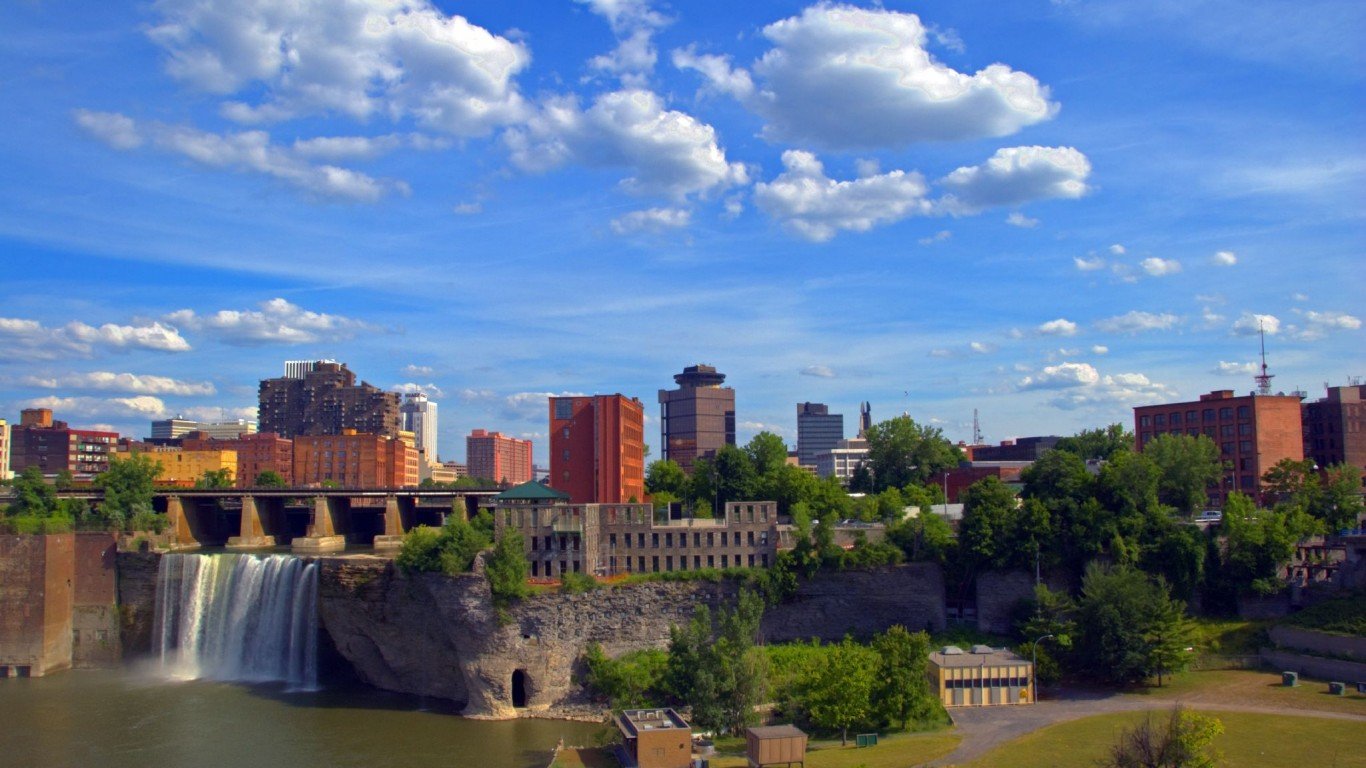
Source: Lew from Campbell, CA, USA / Wikimedia Commons
13. Rochester, NY
> Concentrated poverty rate: 21.4%
> Unemployment in poor neighborhoods: 20.4%
> Total number of poor neighborhoods: 30 (11.4% of all neighborhoods)
> Change in concentrated poverty (2011-2017): +0.4 ppt
Rochester is one of four New York metro areas to rank on this list. Of the more than 146,000 metro area residents living in poverty, 21.4% are concentrated in neighborhoods where at least 40% of the population also lives in poverty. Employment opportunities in poor neighborhoods tend to be scarce, and across Rochester’s 30 poor neighborhoods, the unemployment rate stands at 20.4%. Across the rest of the metro area, just 5.5% of the labor force is unemployed.
Hispanics are disproportionately affected by extreme poverty in Rochester. Of the metro area’s Hispanic population living below the poverty line, 37.4% live in concentrated poverty neighborhoods compared to 23.6% of the poor white Rochester residents and 9.2% of poor black residents.
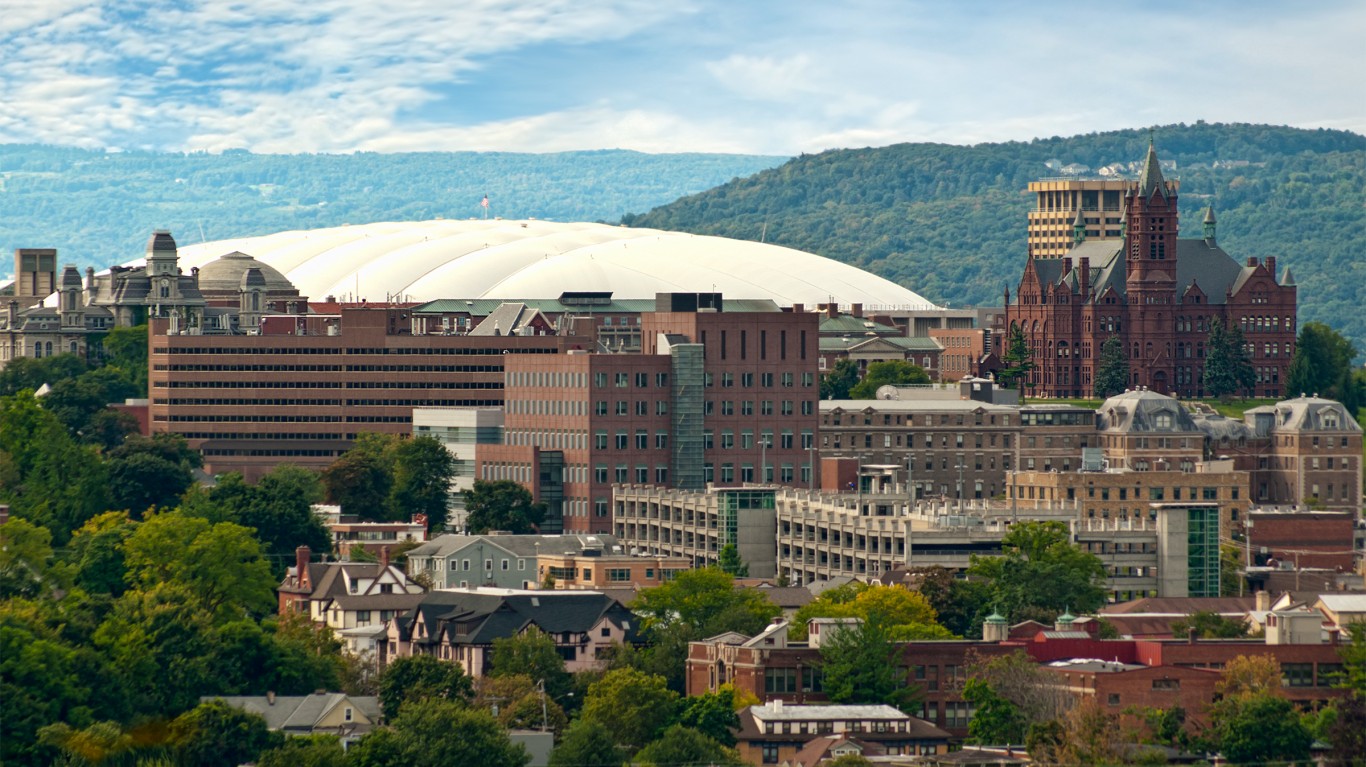
Source: DebraMillet / Getty Images
12. Syracuse, NY
> Concentrated poverty rate: 23.2%
> Unemployment in poor neighborhoods: 16.9%
> Total number of poor neighborhoods: 19 (10.6% of all neighborhoods)
> Change in concentrated poverty (2011-2017): -4.0 ppt
In Syracuse, New York, 23.2% of the more than 95,000 people living in poverty are also living in largely poor neighborhoods. The metro area’s poor black and Hispanic populations are far more likely to live in poor neighborhoods than Syracuse’s poor white population. The extreme poverty rate among the metro area’s Hispanic population is 40.9%, among the black population it is 34.4%, and among the white population 14.6%.
Upward mobility is limited in poor neighborhoods. Across Syracuse’s poorest neighborhoods, the unemployment rate stands at 16.9%, nearly triple the 5.9% unemployment rate across the rest of the metro area.
[in-text-ad]
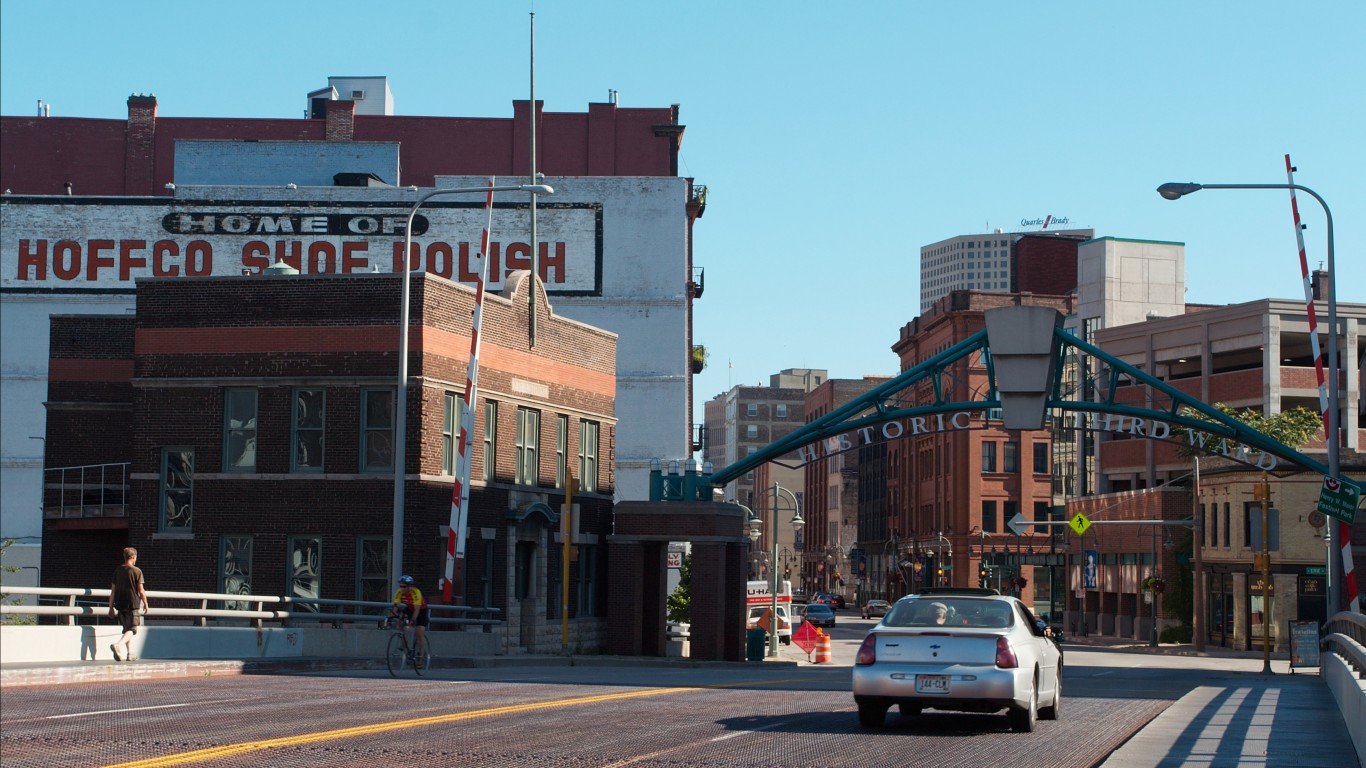
Source: Dori / Wikimedia Commons
11. Milwaukee-Waukesha-West Allis, WI
> Concentrated poverty rate: 23.5%
> Unemployment in poor neighborhoods: 14.8%
> Total number of poor neighborhoods: 49 (11.6% of all neighborhoods)
> Change in concentrated poverty (2011-2017): -3.3 ppt
Milwaukee’s 14.5% poverty rate is closely aligned with the 14.6% national poverty rate. However, a larger than typical share of Milwaukee’s poorest residents face the additional challenges of living in a highly poor neighborhood. Of the 224,000 people living in poverty in Milwaukee, 23.5% live in high-poverty neighborhoods — more than double the nationwide concentrated poverty rate of 11.3%.
Crime tends to be concentrated in poorer neighborhoods, and the high concentrated poverty rate in Milwaukee may be driving up the violent crime rate across the broader metro area. There were 681 violent crimes in Milwaukee for ever 100,000 residents in 2017, compared to the national violent crime rate of 383 per 100,000.
 24/7 Wall St.
Source: Sean Pavone / Getty Images
10. Springfield, MA
> Concentrated poverty rate: 26.1%
> Unemployment in poor neighborhoods: 17.9%
> Total number of poor neighborhoods: 15 (11.3% of all neighborhoods)
> Change in concentrated poverty (2011-2017): +4.3 ppt
Springfield is the only metro area in Massachusetts and the broader New England region to rank on this list, and it is one of only 10 metro areas nationwide where more than one-in-four people living below the poverty line also live in an extremely poor neighborhood. Homeownership is one of the most practical ways to build intergenerational wealth, and across Springfield’s poorest neighborhoods, the homeownership rate is just 16.1% — a fraction of the homeownership rate across the rest of the metro area of 66.4%.
As is often the case in U.S. cities, concentrated poverty is more common among Springfield’s minority population. Across the metro area, 43.6% of poor Hispanics live in poor neighborhoods and 21.1% of poor black residents do, compared to just 9.0% of poor white residents.

Source: SeanPavonePhoto / Getty Images
9. Jackson, MS
> Concentrated poverty rate: 26.2%
> Unemployment in poor neighborhoods: 18.2%
> Total number of poor neighborhoods: 21 (16.5% of all neighborhoods)
> Change in concentrated poverty (2011-2017): +2.4 ppt
In the last five years, the concentrated poverty rate in Jackson, Mississippi, increased by 2.4 percentage points — from 23.8% to 26.2%. The increase is partially attributable to a growing number of city residents living below the poverty line. More than 103,000 Jackson metro area residents live in poverty, up from 93,000 in 2011. Over the same period, the number of metro area neighborhoods where at least 40% of the population lives in poverty increased from 18 to 21.
Economic opportunity tends to be limited in poor urban neighborhoods. In Jackson’s poorest neighborhoods, the unemployment rate stands at 18.2%, nearly triple the 6.8% unemployment rate in the rest of the metro area.
[in-text-ad-2]
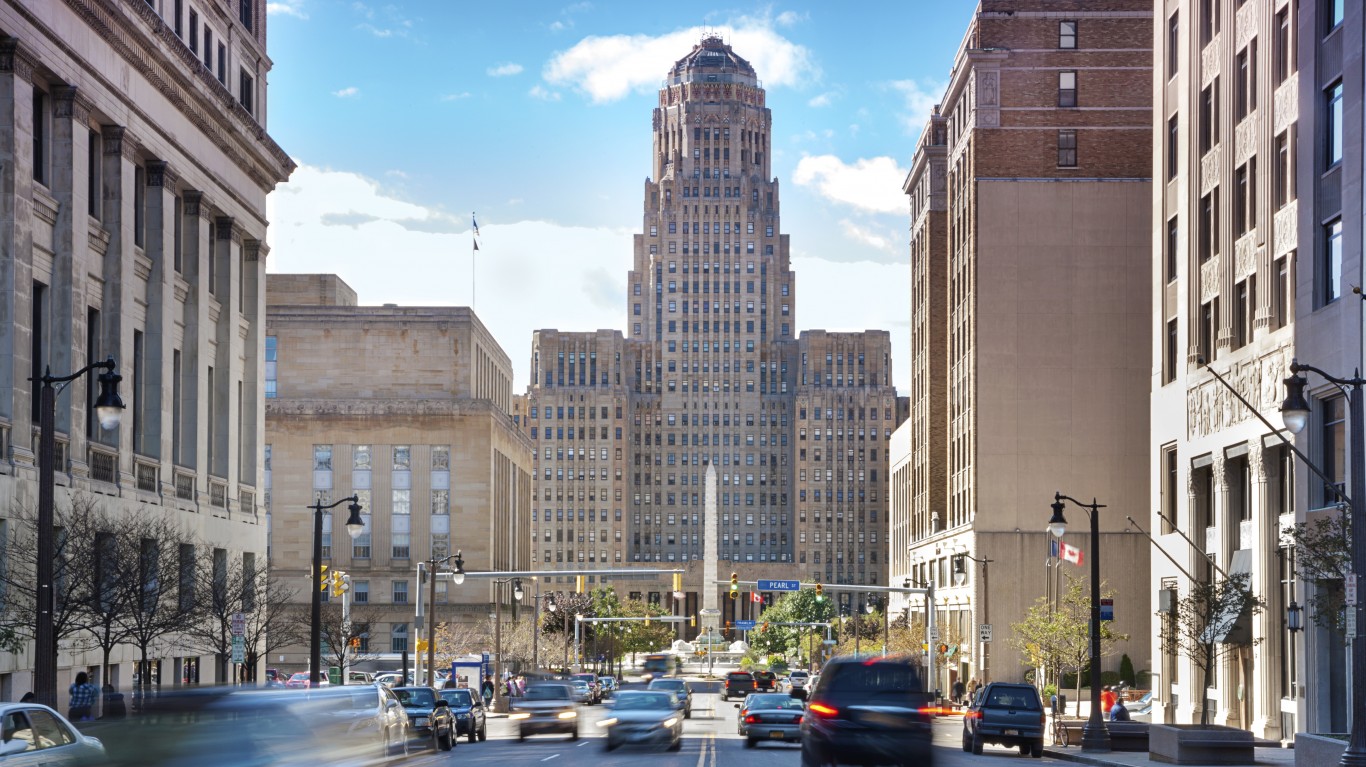
Source: Jacek_Sopotnicki / Getty Images
8. Buffalo-Cheektowaga-Niagara Falls, NY
> Concentrated poverty rate: 26.2%
> Unemployment in poor neighborhoods: 12.1%
> Total number of poor neighborhoods: 31 (10.7% of all neighborhoods)
> Change in concentrated poverty (2011-2017): +5.9 ppt
Concentrated poverty is a growing problem in the Buffalo metro area. The share of poor metro area residents living in poor neighborhoods climbed from 20.2% in 2011 to 26.2% in 2017. The 5.9 percentage point increase in concentrated poverty was the largest of any U.S. metro area over that period. For reference, the national concentrated poverty rate fell by 1.6 percentage points between 2011 and 2017. The increase in Buffalo was precipitated in part by a growing number of residents living below the poverty line. In 2011, 153,800 metro area residents lived in poverty. As of 2017, 161,700 did.
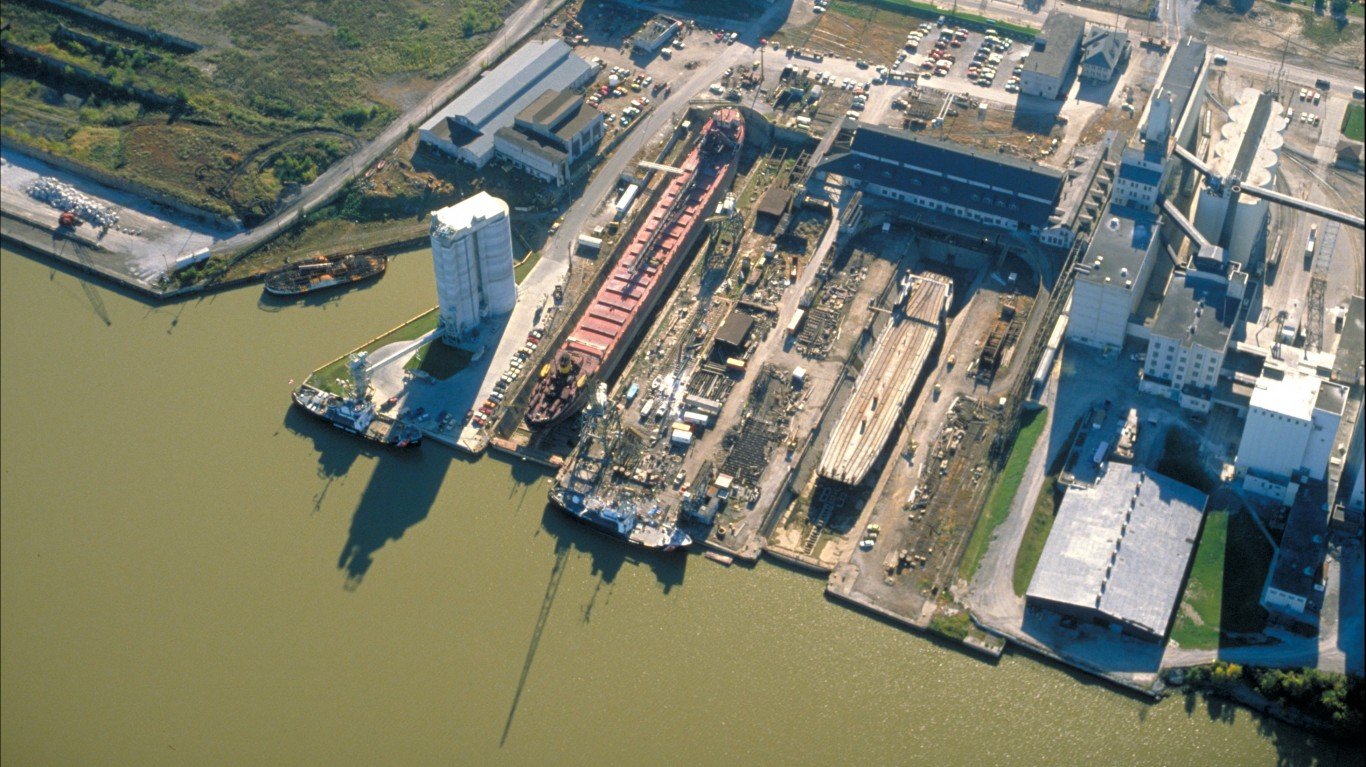
Source: Public Domain / Wikimedia Commons
7. Toledo, OH
> Concentrated poverty rate: 27.0%
> Unemployment in poor neighborhoods: 18.3%
> Total number of poor neighborhoods: 28 (17.4% of all neighborhoods)
> Change in concentrated poverty (2011-2017): -1.6 ppt
Of the 104,600 people living below the poverty line in Toledo, Ohio, 27% reside in neighborhoods where at least 40% of the population are also poor. Economic opportunities are relatively scarce in Toledo’s poor neighborhoods as the unemployment rate across these areas stands at 18.3% — nearly triple the 6.5% unemployment rate in the rest of the city.
Educational outcomes tend to lag in poor neighborhoods. Fewer than three out of four adults living in Toledo’s concentrated poverty neighborhoods have a high school diploma. In the rest of the metro area, more than nine out of 10 adults have a high school education.
[in-text-ad]
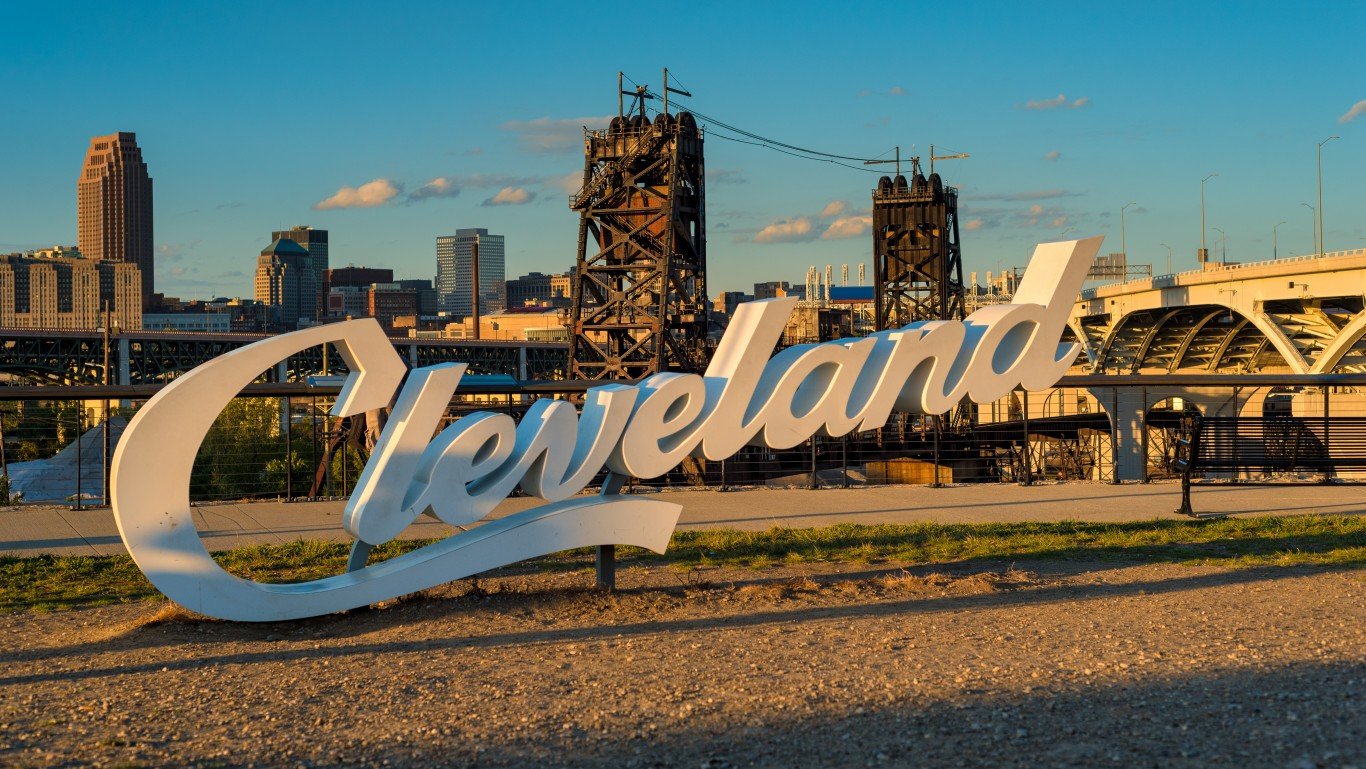
Source: PapaBear / Getty Images
6. Cleveland-Elyria, OH
> Concentrated poverty rate: 27.0%
> Unemployment in poor neighborhoods: 23.6%
> Total number of poor neighborhoods: 86 (13.7% of all neighborhoods)
> Change in concentrated poverty (2011-2017): +1.2 ppt
Cleveland’s 27.0% concentrated poverty rate is the highest in Ohio — narrowly edging out Toledo — and sixth highest of any metro area in the country. The number of people living below the poverty line in Cleveland climbed from 294,000 in 2011 to 301,000 in 2017. The growing ranks of poor metro area residents pushed the concentrated poverty rate up by 1.2 percentage points during a period when concentrated poverty declined by 1.6 percentage points nationwide. The number of Cleveland neighborhoods where at least 40% of the population lives below the poverty line climbed from 76 to 86 between 2011 and 2017.
Undergoing steep economic and population decline in the latter half of the 20th century with the fall of American manufacturing, Cleveland is a classic Rust Belt city. A shadow of its former self, Cleveland proper is now home to fewer than 400,000 people, down from a peak of nearly 1 million in 1950.
 24/7 Wall St.
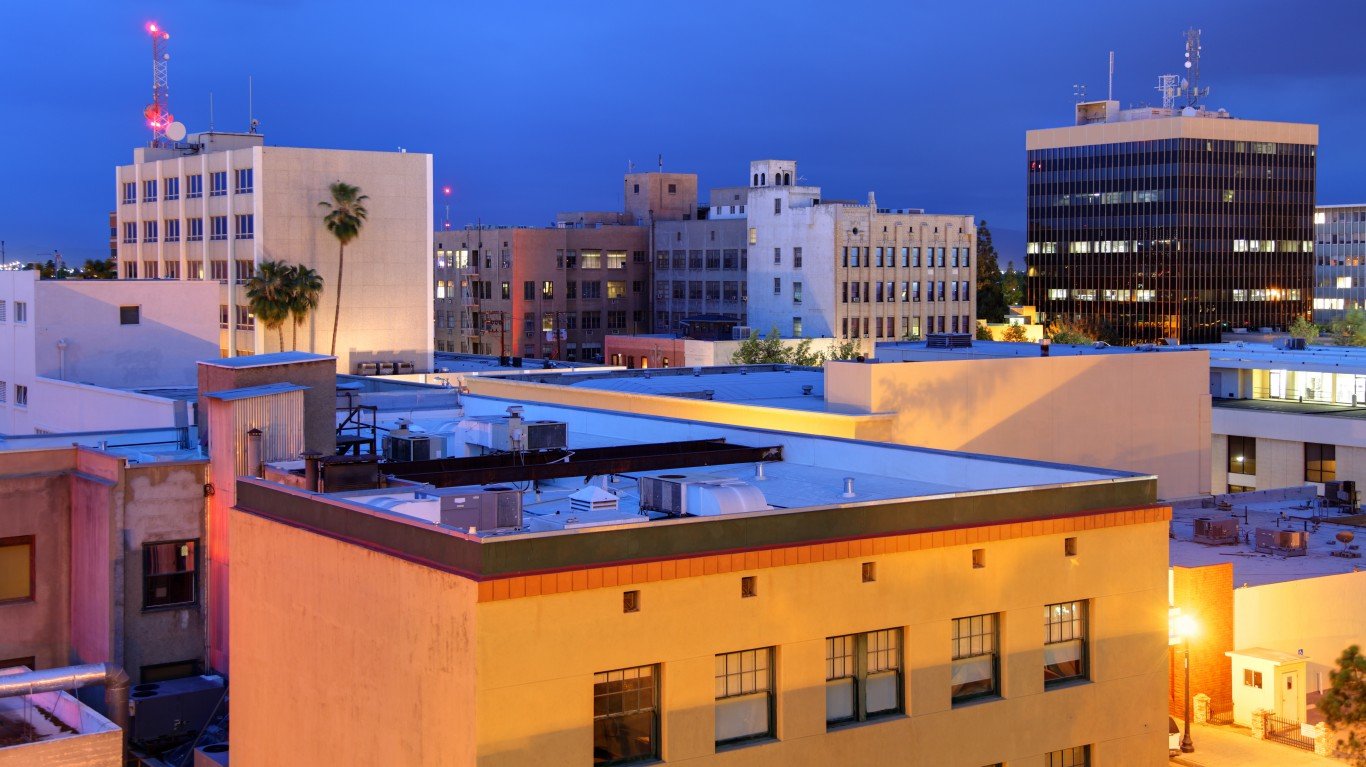
Source: DenisTangneyJr / Getty Images
5. Bakersfield, CA
> Concentrated poverty rate: 27.1%
> Unemployment in poor neighborhoods: 18.2%
> Total number of poor neighborhoods: 24 (15.9% of all neighborhoods)
> Change in concentrated poverty (2011-2017): +0.7 ppt
Bakersfield is one of two California metro areas to rank among the five worst cities for concentrated poverty in the United States. The number of people living below the poverty line in Bakersfield climbed from 169,600 in 2011 to 191,100 in 2017. Over the same period, the metro area’s concentrated poverty rate climbed from 26.4% to 27.1%. In poor neighborhoods, often public education institutions have strained resources, and as a result education outcomes there are often lagging. Across the poorest neighborhoods in Bakersfield, just 57.0% of adults have a high school diploma compared to 76.5% of adults in the rest of the metro area.
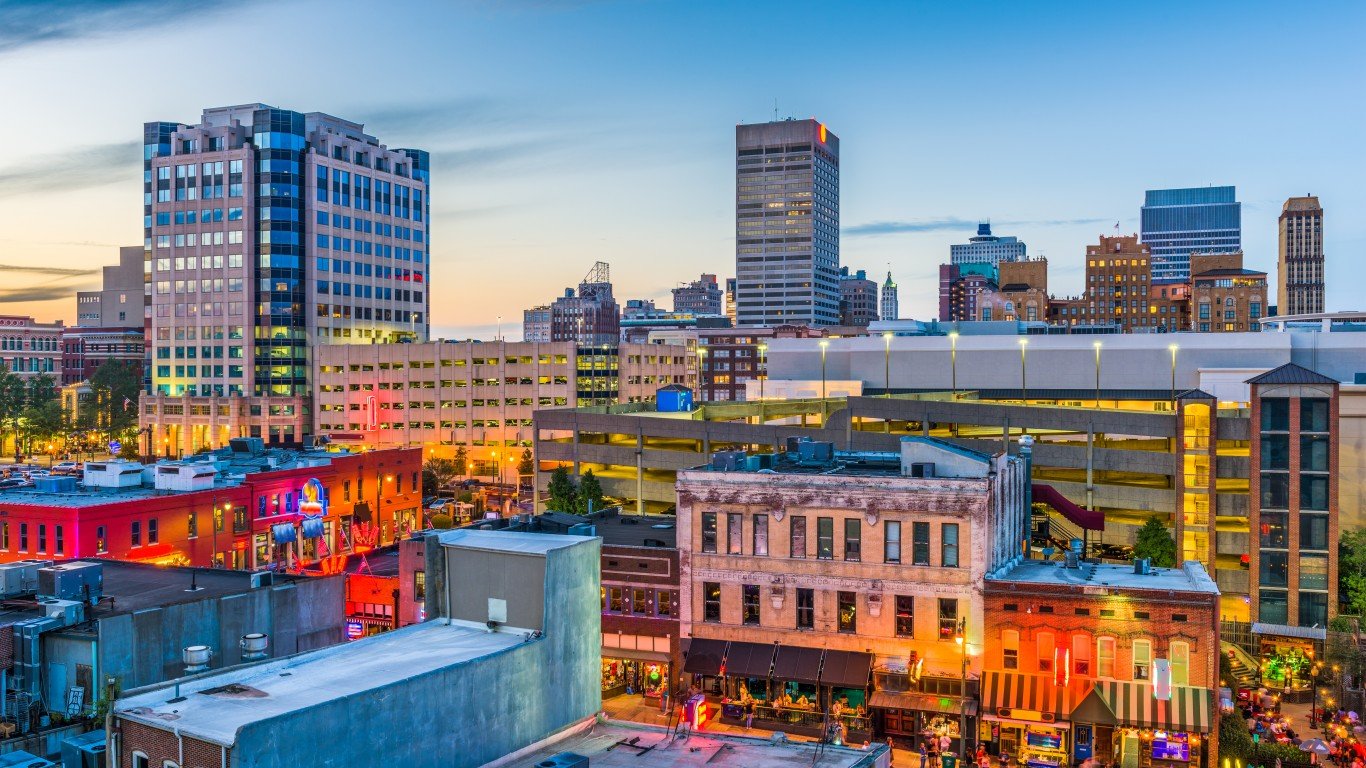
Source: Sean Pavone / Getty Images
4. Memphis, TN-MS-AR
> Concentrated poverty rate: 28.4%
> Unemployment in poor neighborhoods: 16.5%
> Total number of poor neighborhoods: 52 (16.8% of all neighborhoods)
> Change in concentrated poverty (2011-2017): +0.2 ppt
There are nearly 71,000 people in the Memphis metro area living below the poverty line in neighborhoods where at least 40% of the population also lives in poverty — or 28.4% of the metro area’s poor population. Extreme poverty disproportionately affects Memphis’s minority population. Over a third of the metro area’s poor Hispanic and black populations who live in poverty are concentrated in poor neighborhoods compared to less than 10% of poor whites.
Crime tends to be more common in poor neighborhoods, and the high concentrated poverty rate in the metro area may partially explain Memphis’s high crime rate. There were 1,168 violent crimes for every 100,000 people in the metro area in 2017, well above the national violent crime rate of 383 per 100,000.
[in-text-ad-2]

Source: Steven_Kriemadis / Getty Images
3. Detroit-Warren-Dearborn, MI
> Concentrated poverty rate: 29.6%
> Unemployment in poor neighborhoods: 21.7%
> Total number of poor neighborhoods: 170 (13.3% of all neighborhoods)
> Change in concentrated poverty (2011-2017): +1.7 ppt
Over 666,000 Detroit metro area residents live below the poverty line — and nearly 30% of them face the additional challenges posed by living in a concentrated poverty neighborhood. Often due in part to underfunded school systems, educational attainment rates tend to be low in poor neighborhoods, and low educational attainment in turn restricts social and economic mobility. In Detroit’s poorest neighborhoods, fewer than three out of four adults have completed high school compared to over 90% of adults across the rest of the metro area.
As is often the case in American cities, minority populations are disproportionately affected by extreme poverty. The share of poor black and Hispanic residents living below the poverty line in poor neighborhoods is well more than double the extreme poverty rate of 15.2% among poor white residents.

Source: DenisTangneyJr / Getty Images
2. Fresno, CA
> Concentrated poverty rate: 30.5%
> Unemployment in poor neighborhoods: 16.2%
> Total number of poor neighborhoods: 35 (17.7% of all neighborhoods)
> Change in concentrated poverty (2011-2017): +0.1 ppt
Of all large California metro areas, Fresno has the highest concentrated poverty rate. Of the more than 243,000 metro area residents living in poverty, 30.5% also live in concentrated poverty neighborhoods, the second largest share of any U.S. metro area. Americans living in extreme poverty are face a number of barriers to social and economic mobility. For example, homeownership is a practical way to build intergenerational wealth, and the homeownership rate in Fresno’s poorest neighborhoods is less than half the homeownership rate of 57.1% in the rest of the city.
Crime is often more common in poor neighborhoods — and the high concentrated poverty rate may be driving up crime rates across the Fresno metro area. There were 582 violent crimes for every 100,000 Fresno residents in 2017, well above the national violent crime rate of 383 per 100,000.
[in-text-ad]
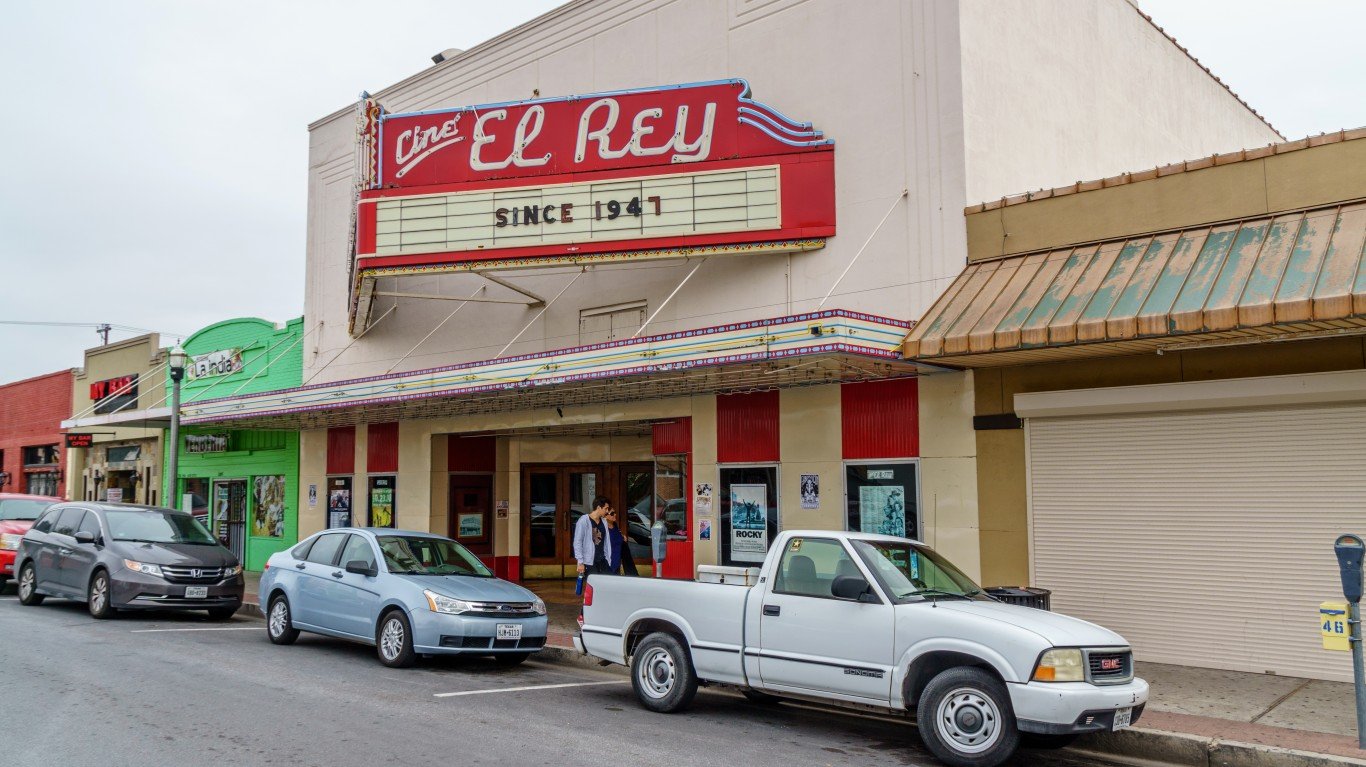
Source: tirc83 / Getty Images
1. McAllen-Edinburg-Mission, TX
> Concentrated poverty rate: 35.1%
> Unemployment in poor neighborhoods: 9.7%
> Total number of poor neighborhoods: 25 (22.3% of all neighborhoods)
> Change in concentrated poverty (2011-2017): -16.3 ppt
The concentrated poverty rate has improved tremendously in the McAllen, Texas, metro area in recent years. As recently as 2011, over half of the metro areas residents living in poverty also lived in concentrated poverty neighborhoods. Today, 35.1% do. Despite the 16.3 percentage point improvement, McAllen has the highest concentrated poverty rate of any large U.S. metro area.
McAllen is located in southern Texas just above the U.S.-Mexico border. Over 97% of the 264,000 area residents living below the poverty line are Hispanic. Poor Hispanics are also more likely to be clustered in the metro area’s poorest neighborhoods. Over 35% of McAllen’s Hispanic population living below the poverty line are in concentrated poverty neighborhoods, compared to 24.1% of poor black residents and 25.9% of poor white residents.
Methodology
To identify the cities hit hardest by extreme poverty, 24/7 Wall St. reviewed the share of residents living below the poverty line in neighborhoods with poverty rates of at least 40% in the 100 largest U.S. metro areas by population. Census tracts were treated as neighborhoods, and only tracts home to 500 or more people where fewer than 50% of residents were enrolled in college were considered. Violent crime rates are as of 2017 and are from the FBI’s Uniform Crime Report. All other data came from the U.S. Census Bureau’s 2017 and 2011 American Community Survey and are five-year estimates.
Take This Retirement Quiz To Get Matched With A Financial Advisor (Sponsored)
Take the quiz below to get matched with a financial advisor today.
Each advisor has been vetted by SmartAsset and is held to a fiduciary standard to act in your best interests.
Here’s how it works:
1. Answer SmartAsset advisor match quiz
2. Review your pre-screened matches at your leisure. Check out the
advisors’ profiles.
3. Speak with advisors at no cost to you. Have an introductory call on the phone or introduction in person and choose whom to work with in the future
Take the retirement quiz right here.
Thank you for reading! Have some feedback for us?
Contact the 24/7 Wall St. editorial team.
Editors' Picks

