
The U.S. economy added 263,000 jobs in April 2019, the 103rd month of consecutive job growth — by far the longest stretch in U.S. history. The job growth has been driven almost exclusively by the private sector. Public sector employment, meanwhile, has declined slightly, as the number of Americans working for federal, state, or local governments fell from 22.5 million to 22.4 million over the last decade.
Despite a brief federal hiring freeze imposed by President Donald Trump in 2017 and a federal employee salary freeze the following year, federal government employment grew by 1.2% between 2008 and 2018. The net decline in government employment took place at the state and local level. In the face of falling tax revenue and budget constraints, state and local government payrolls have been slashed in recent years. Tight state budgets also partially explain why teaching, one of the largest public sector occupations, ranks among the lowest paying jobs for college graduates.
While opinions on the proper size and role of government vary across the political spectrum, government workers at all levels, from the Pentagon to the classroom, provide essential public services.
24/7 Wall St. reviewed 2018 data from the Bureau of Labor Statistics to identify the states where government workers make up the largest share of the labor force. Nationwide, 15.1% of workers are employed in the public sector. Government employment tends to be concentrated in sparsely populated states. In these areas, private industry is not as dominant, yet residents still rely on government services like public works and education.
Active duty servicemen and servicewomen are not included in public sector employment tallys, and as a result, states with the most people in the military do not necessarily rank highly on this list.
Click here to see the states where the most people work for the government
Click here to read our methodology
Source: ddub3429 / Getty Images
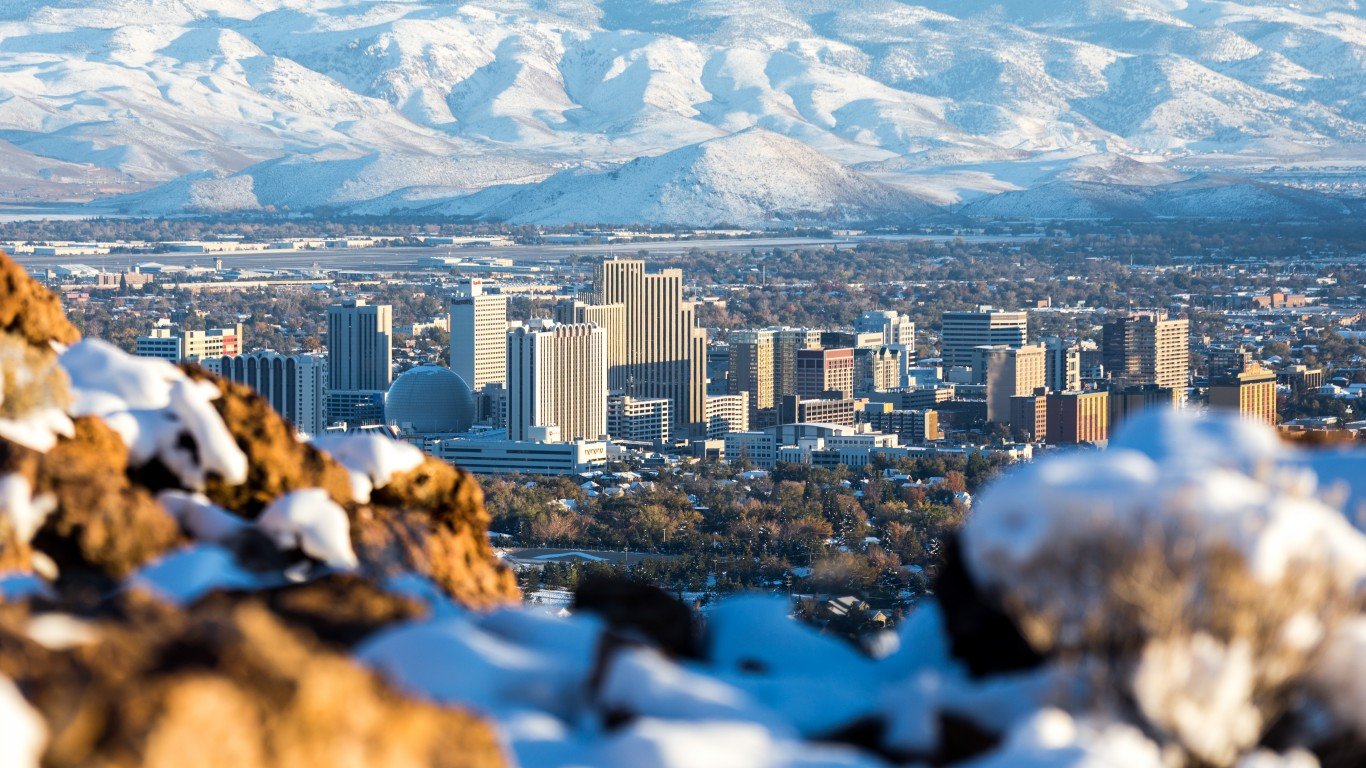
50. Nevada
> Gov’t. employees, 2018: 11.6% of workforce
> Gov’t employment change, 2008-2018: -0.1% (161,200 to 161,000)
> State gov’t. spending per capita: $8,186 (4th lowest)
> Population density: 25 per sq. mi. (9th lowest)
[in-text-ad]

Source: SeanPavonePhoto / Getty Images
49. Pennsylvania
> Gov’t. employees, 2018: 11.7% of workforce
> Gov’t employment change, 2008-2018: -7.5% (759,700 to 702,900)
> State gov’t. spending per capita: $11,210 (18th highest)
> Population density: 284 per sq. mi. (9th highest)
Source: DenisTangneyJr / Getty Images
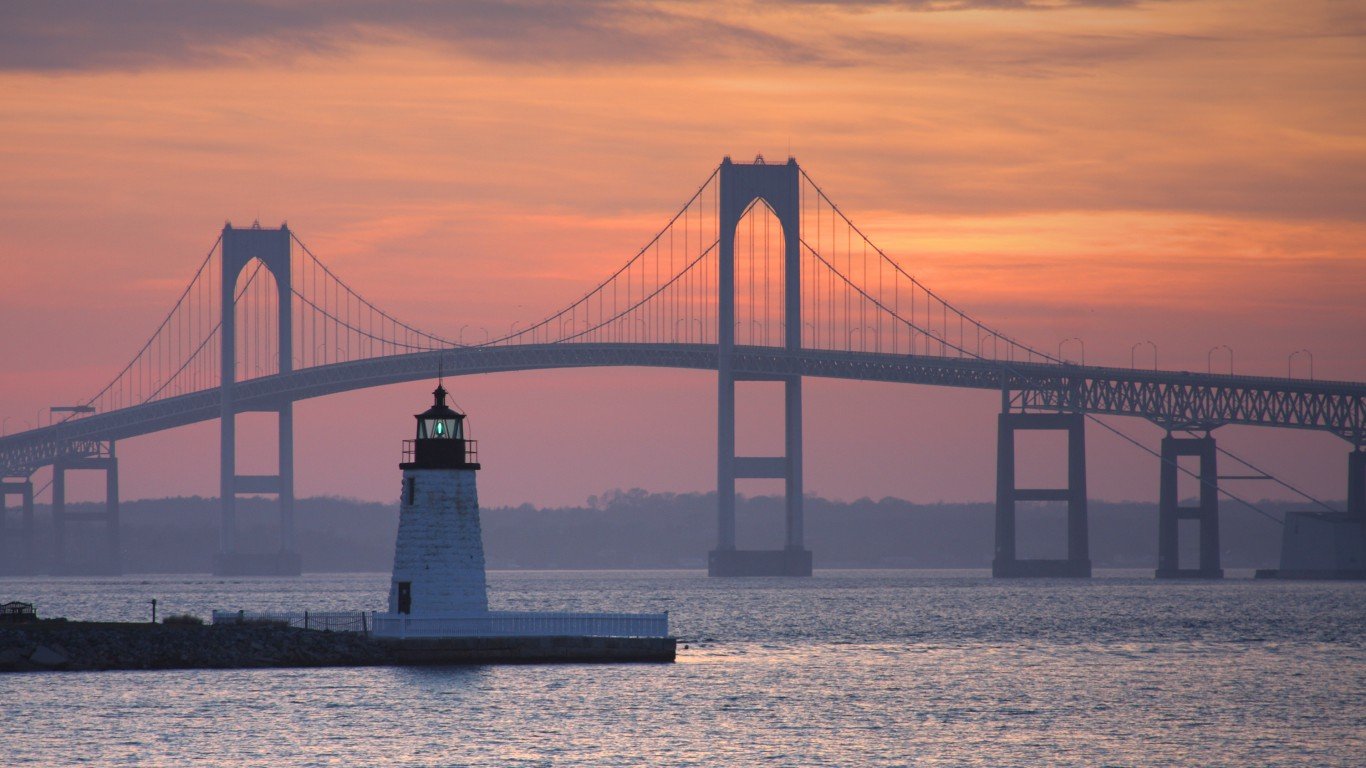
48. Rhode Island
> Gov’t. employees, 2018: 12.3% of workforce
> Gov’t employment change, 2008-2018: -3.9% (63,500 to 61,000)
> State gov’t. spending per capita: $11,499 (15th highest)
> Population density: 1,018 per sq. mi. (2nd highest)
Source: Sean Pavone / Getty Images
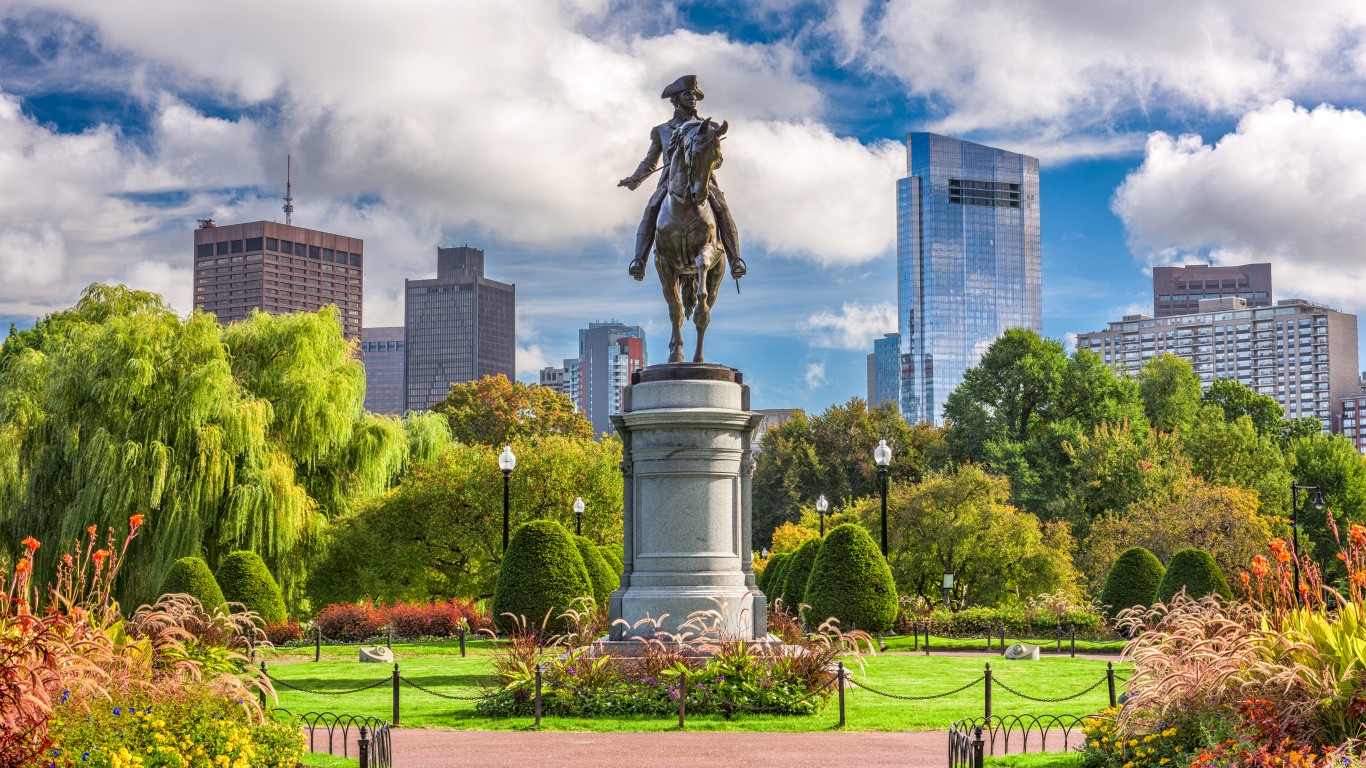
47. Massachusetts
> Gov’t. employees, 2018: 12.5% of workforce
> Gov’t employment change, 2008-2018: +4.0% (437,000 to 454,500)
> State gov’t. spending per capita: $13,056 (6th highest)
> Population density: 839 per sq. mi. (3rd highest)
[in-text-ad-2]
Source: Sumter BOCC / Wikimedia Commons
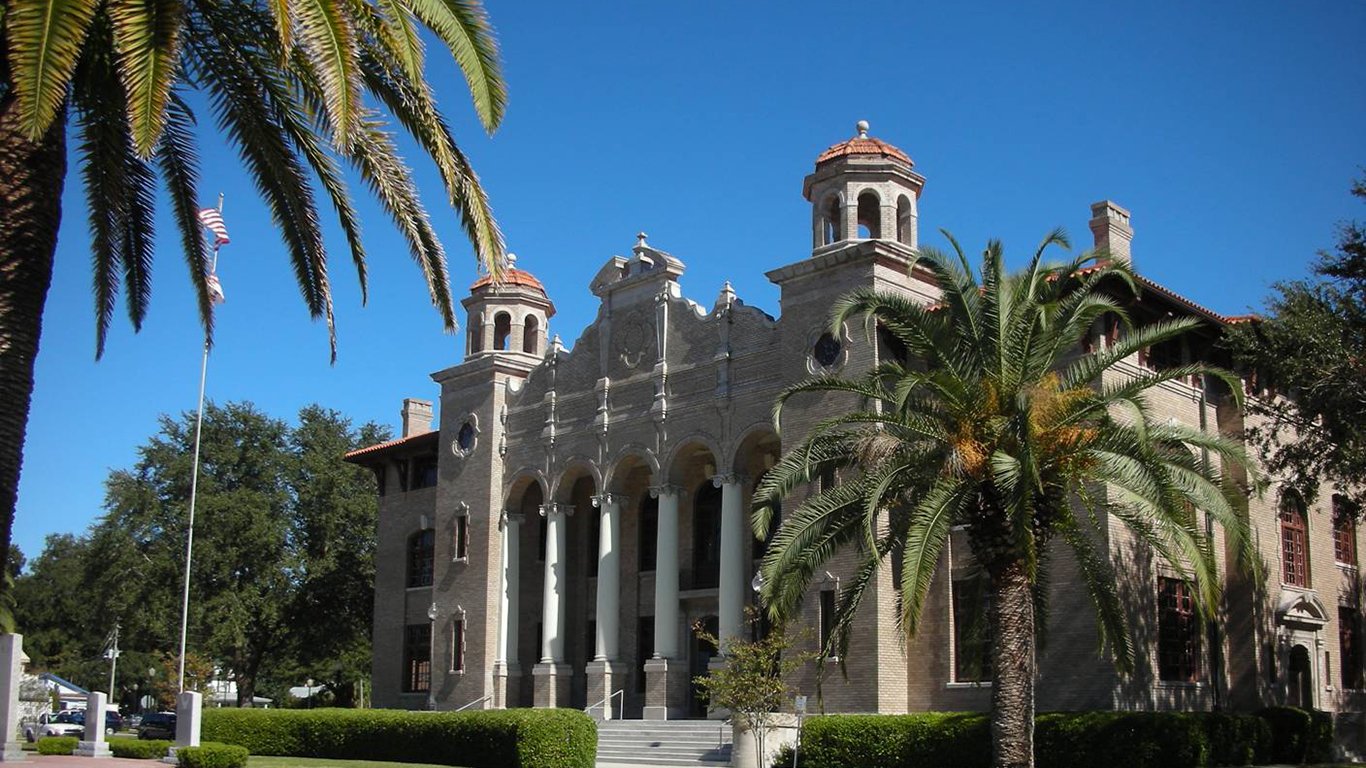
46. Florida
> Gov’t. employees, 2018: 12.7% of workforce
> Gov’t employment change, 2008-2018: -1.5% (1.13 million to 1.11 million)
> State gov’t. spending per capita: $7,969 (3rd lowest)
> Population density: 351 per sq. mi. (8th highest)

Source: DenisTangneyJr / Getty Images
45. New Hampshire
> Gov’t. employees, 2018: 13.2% of workforce
> Gov’t employment change, 2008-2018: -5.7% (95,400 to 90,000)
> State gov’t. spending per capita: $9,373 (16th lowest)
> Population density: 147 per sq. mi. (21st highest)
[in-text-ad]
Source: wellesenterprises / Getty Images
44. Illinois
> Gov’t. employees, 2018: 13.5% of workforce
> Gov’t employment change, 2008-2018: -3.2% (854,000 to 826,300)
> State gov’t. spending per capita: $10,923 (21st highest)
> Population density: 231 per sq. mi. (12th highest)
 24/7 Wall St.
Source: Sean Pavone / Getty Images
43. Indiana
> Gov’t. employees, 2018: 13.7% of workforce
> Gov’t employment change, 2008-2018: -2.5% (440,500 to 429,700)
> State gov’t. spending per capita: $8,688 (8th lowest)
> Population density: 181 per sq. mi. (16th highest)
Source: Sean Pavone / Getty Images
42. Wisconsin
> Gov’t. employees, 2018: 13.7% of workforce
> Gov’t employment change, 2008-2018: -3.3% (421,900 to 407,800)
> State gov’t. spending per capita: $10,273 (23rd highest)
> Population density: 105 per sq. mi. (23rd highest)
[in-text-ad-2]
Source: benkrut / Getty Images
41. Michigan
> Gov’t. employees, 2018: 13.7% of workforce
> Gov’t employment change, 2008-2018: -6.7% (650,000 to 606,500)
> State gov’t. spending per capita: $9,699 (20th lowest)
> Population density: 175 per sq. mi. (17th highest)
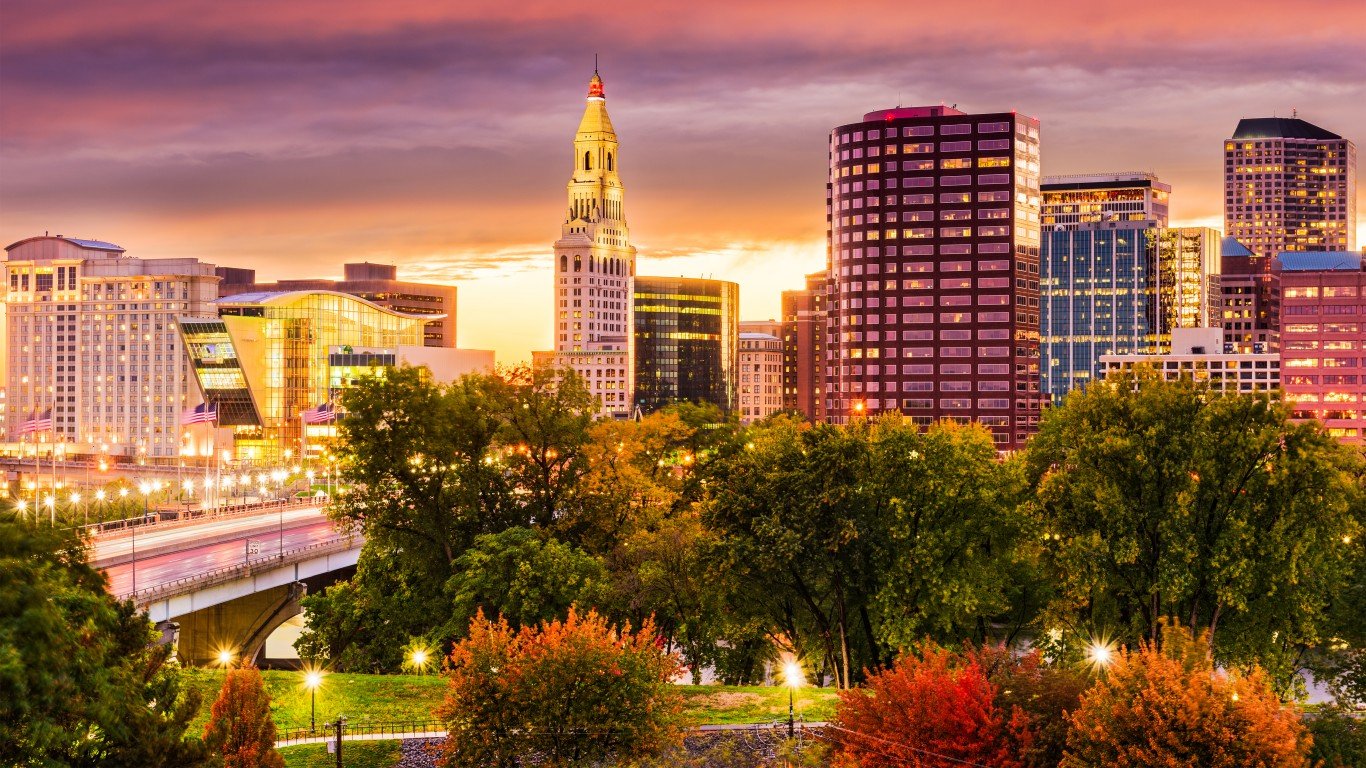
Source: SeanPavonePhoto / Getty Images
40. Connecticut
> Gov’t. employees, 2018: 14.0% of workforce
> Gov’t employment change, 2008-2018: -8.8% (259,500 to 236,700)
> State gov’t. spending per capita: $12,722 (7th highest)
> Population density: 738 per sq. mi. (4th highest)
[in-text-ad]
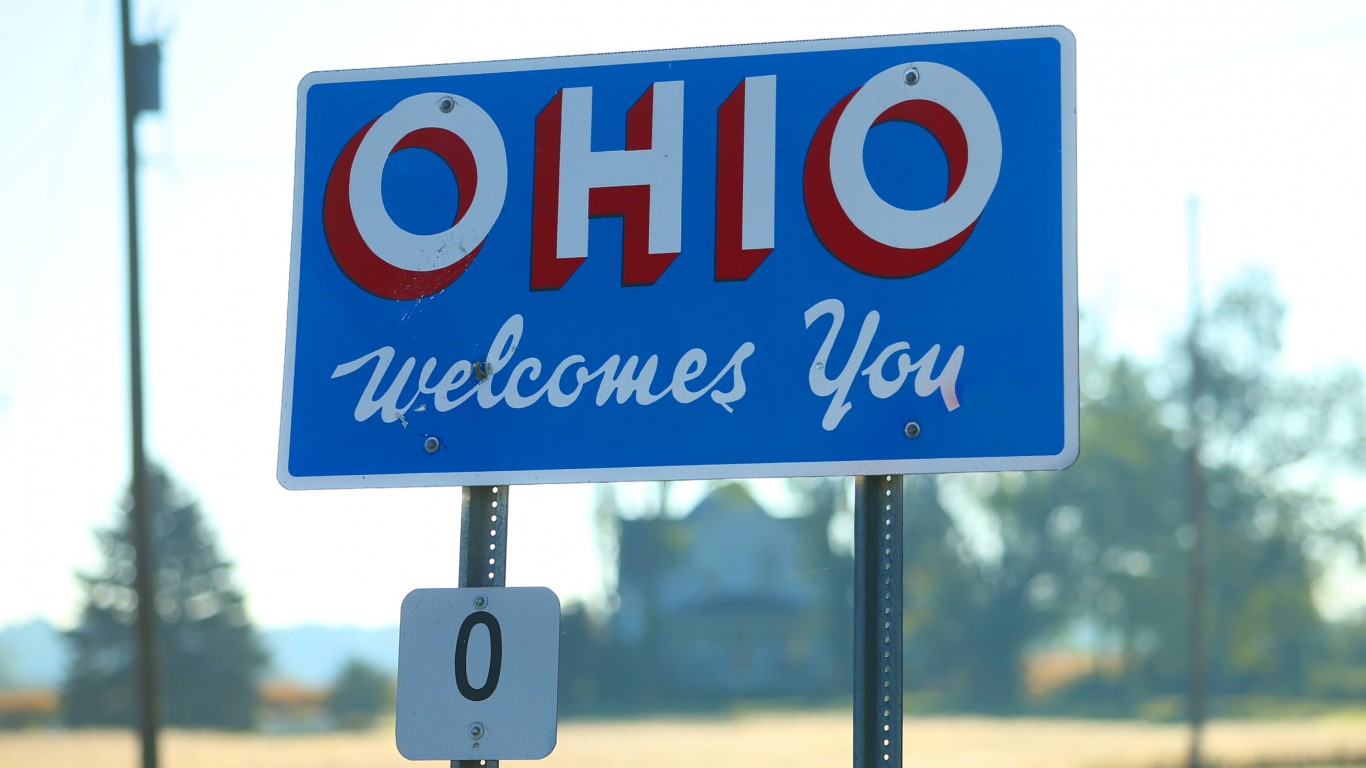
Source: fotoguy22 / Getty Images
39. Ohio
> Gov’t. employees, 2018: 14.0% of workforce
> Gov’t employment change, 2008-2018: -2.4% (798,500 to 779,200)
> State gov’t. spending per capita: $10,771 (22nd highest)
> Population density: 282 per sq. mi. (10th highest)
 24/7 Wall St.
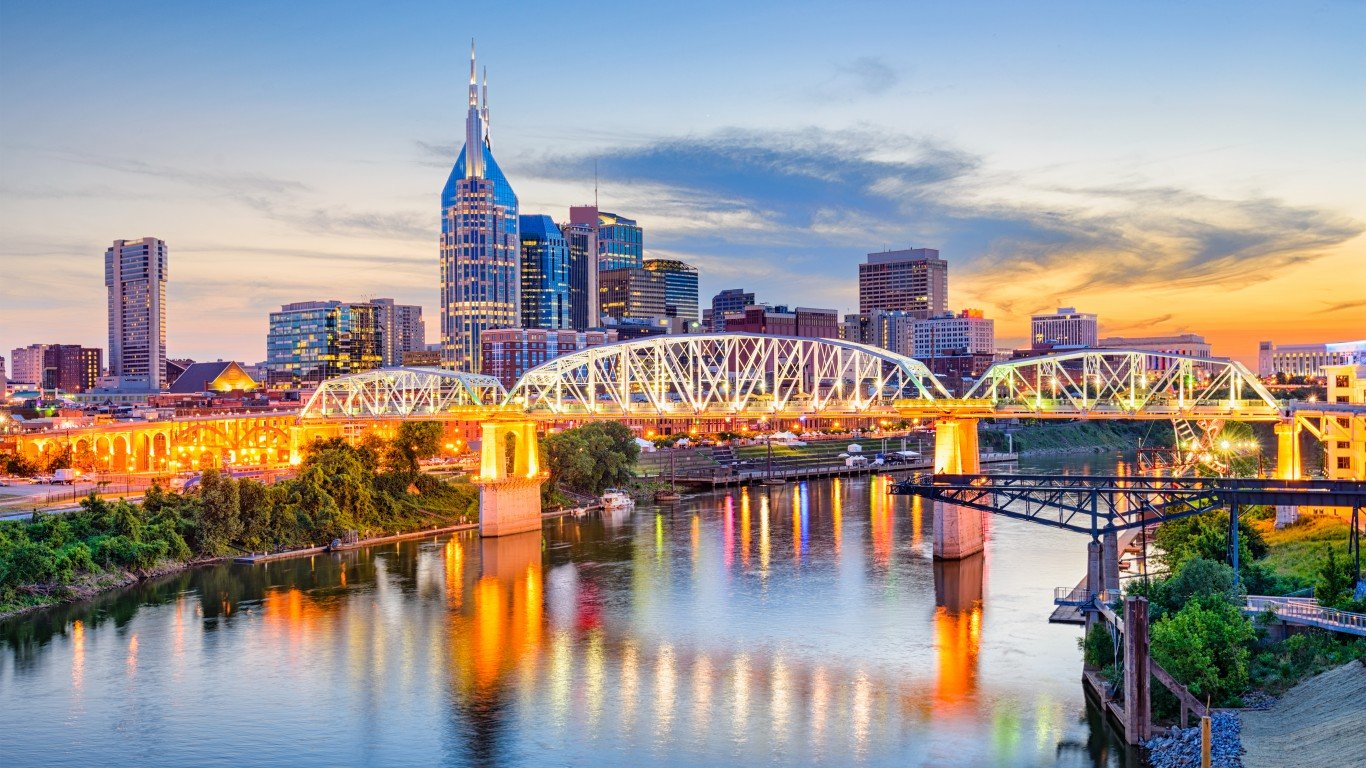
Source: Sean Pavone / Getty Images
38. Tennessee
> Gov’t. employees, 2018: 14.2% of workforce
> Gov’t employment change, 2008-2018: +2.5% (424,900 to 435,500)
> State gov’t. spending per capita: $8,600 (6th lowest)
> Population density: 154 per sq. mi. (19th highest)

Source: mdgmorris / Getty Images
37. Delaware
> Gov’t. employees, 2018: 14.4% of workforce
> Gov’t employment change, 2008-2018: +5.7% (62,800 to 66,400)
> State gov’t. spending per capita: $11,866 (12th highest)
> Population density: 461 per sq. mi. (6th highest)
[in-text-ad-2]
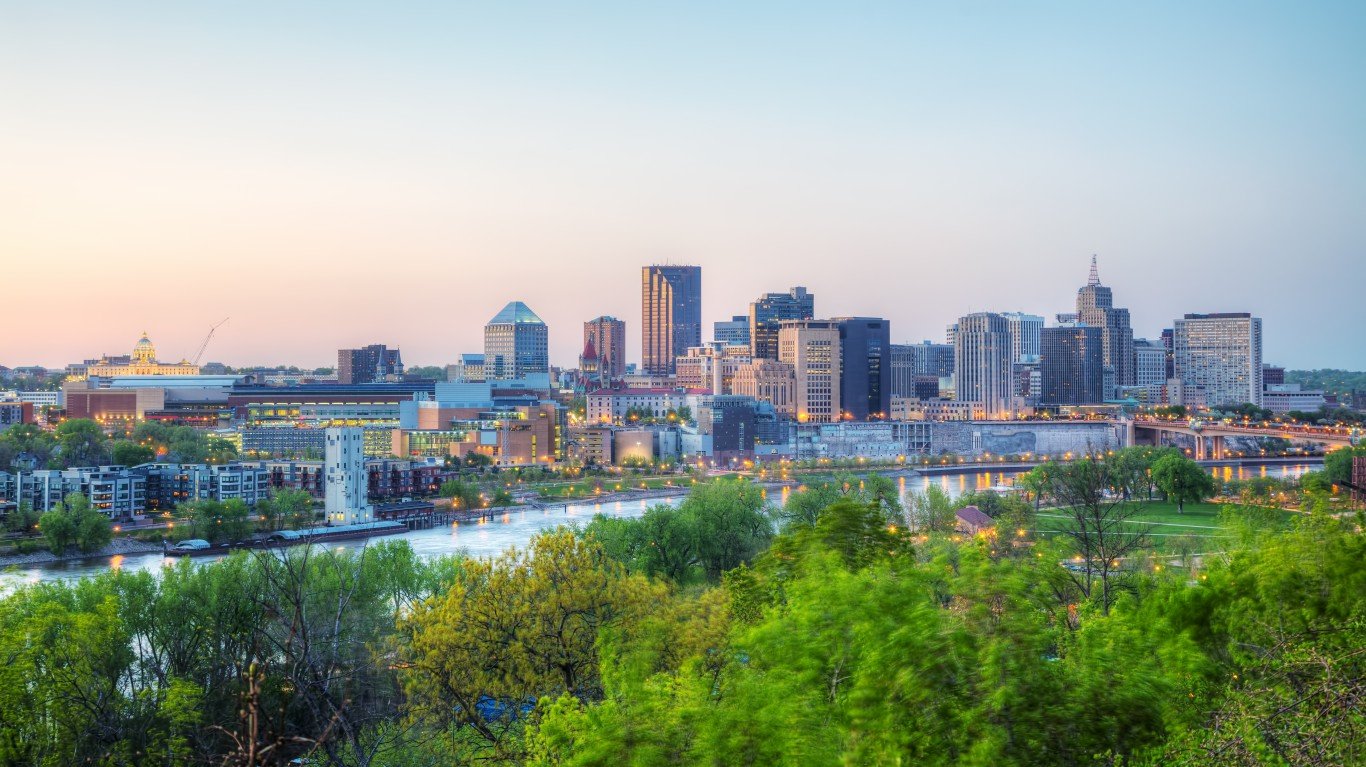
Source: AndreyKrav / Getty Images
36. Minnesota
> Gov’t. employees, 2018: 14.4% of workforce
> Gov’t employment change, 2008-2018: +1.6% (418,900 to 425,500)
> State gov’t. spending per capita: $11,765 (13th highest)
> Population density: 67 per sq. mi. (20th lowest)
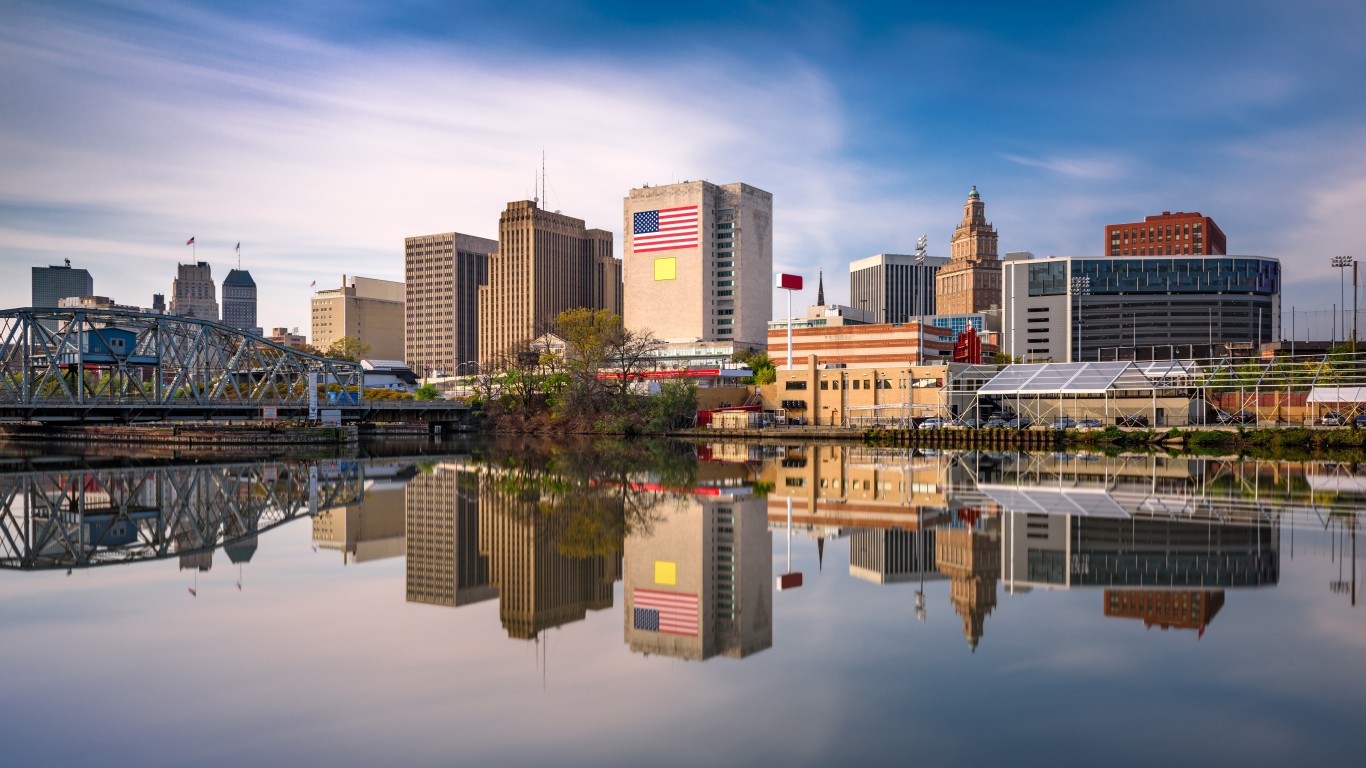
Source: SeanPavonePhoto / Getty Images
35. New Jersey
> Gov’t. employees, 2018: 14.5% of workforce
> Gov’t employment change, 2008-2018: -6.5% (642,500 to 600,500)
> State gov’t. spending per capita: $12,189 (9th highest)
> Population density: 1,196 per sq. mi. (the highest)
[in-text-ad]

Source: Dreamframer / Getty Images
34. Arizona
> Gov’t. employees, 2018: 14.5% of workforce
> Gov’t employment change, 2008-2018: -4.0% (432,300 to 415,200)
> State gov’t. spending per capita: $8,405 (5th lowest)
> Population density: 56 per sq. mi. (18th lowest)
 24/7 Wall St.
Source: f11photo / Getty Images
33. Missouri
> Gov’t. employees, 2018: 15.0% of workforce
> Gov’t employment change, 2008-2018: -2.8% (446,300 to 433,700)
> State gov’t. spending per capita: $8,774 (9th lowest)
> Population density: 87 per sq. mi. (23rd lowest)
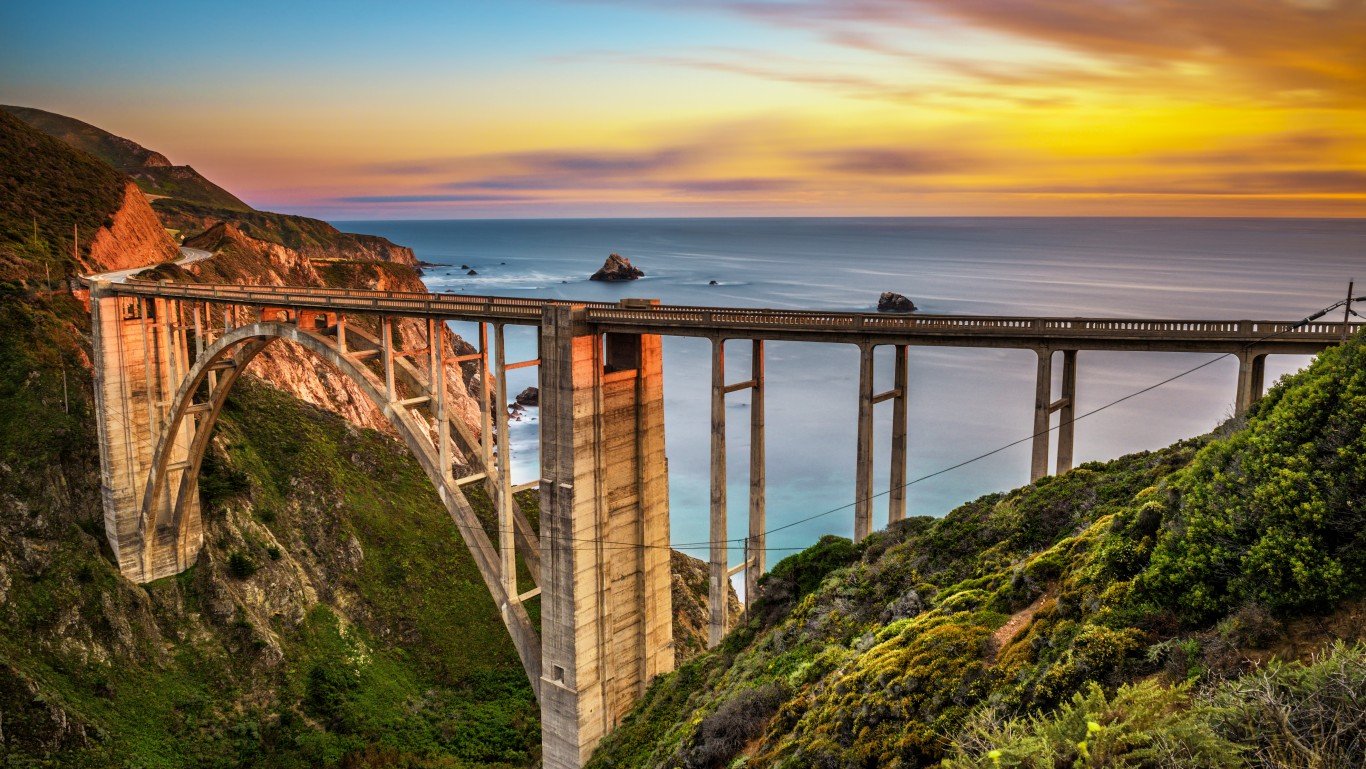
Source: miroslav_1 / Getty Images
32. California
> Gov’t. employees, 2018: 15.1% of workforce
> Gov’t employment change, 2008-2018: +2.7% (2.5 million to 2.6 million)
> State gov’t. spending per capita: $13,551 (5th highest)
> Population density: 239 per sq. mi. (11th highest)
[in-text-ad-2]
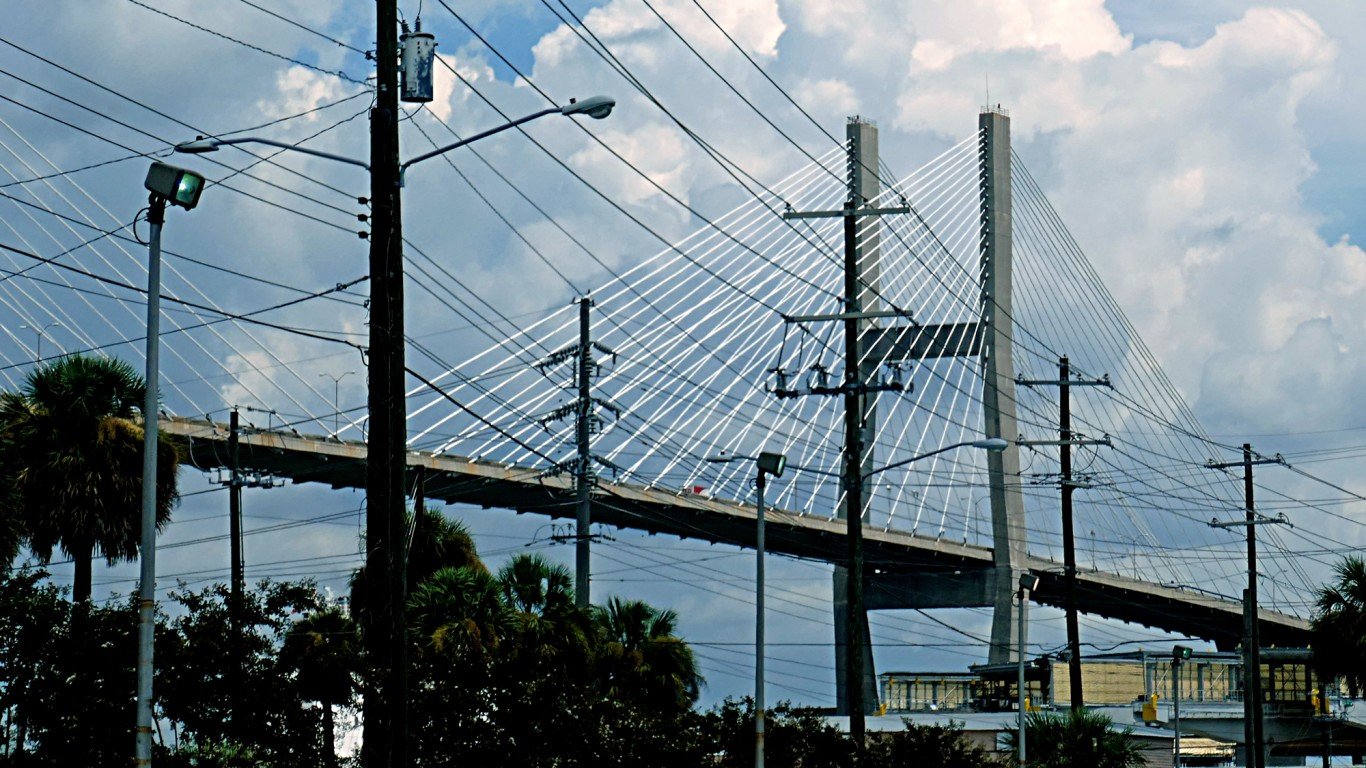
Source: pom-angers / Flickr
31. Georgia
> Gov’t. employees, 2018: 15.3% of workforce
> Gov’t employment change, 2008-2018: -2.4% (711,000 to 693,800)
> State gov’t. spending per capita: $7,880 (2nd lowest)
> Population density: 168 per sq. mi. (18th highest)
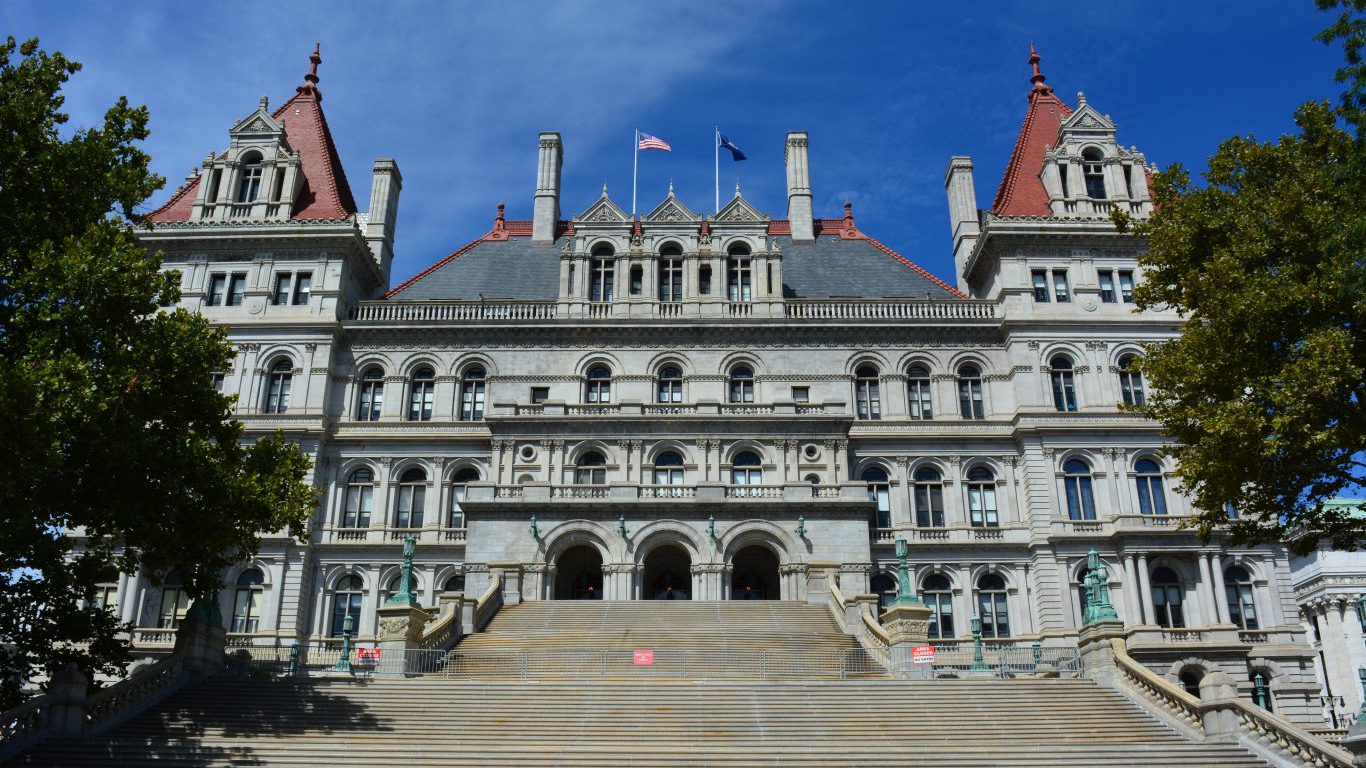
Source: Shaunfrombrooklyn / Wikimedia Commons
30. New York
> Gov’t. employees, 2018: 15.4% of workforce
> Gov’t employment change, 2008-2018: -1.8% (1.52 million to 1.49 million)
> State gov’t. spending per capita: $16,690 (3rd highest)
> Population density: 411 per sq. mi. (7th highest)
[in-text-ad]
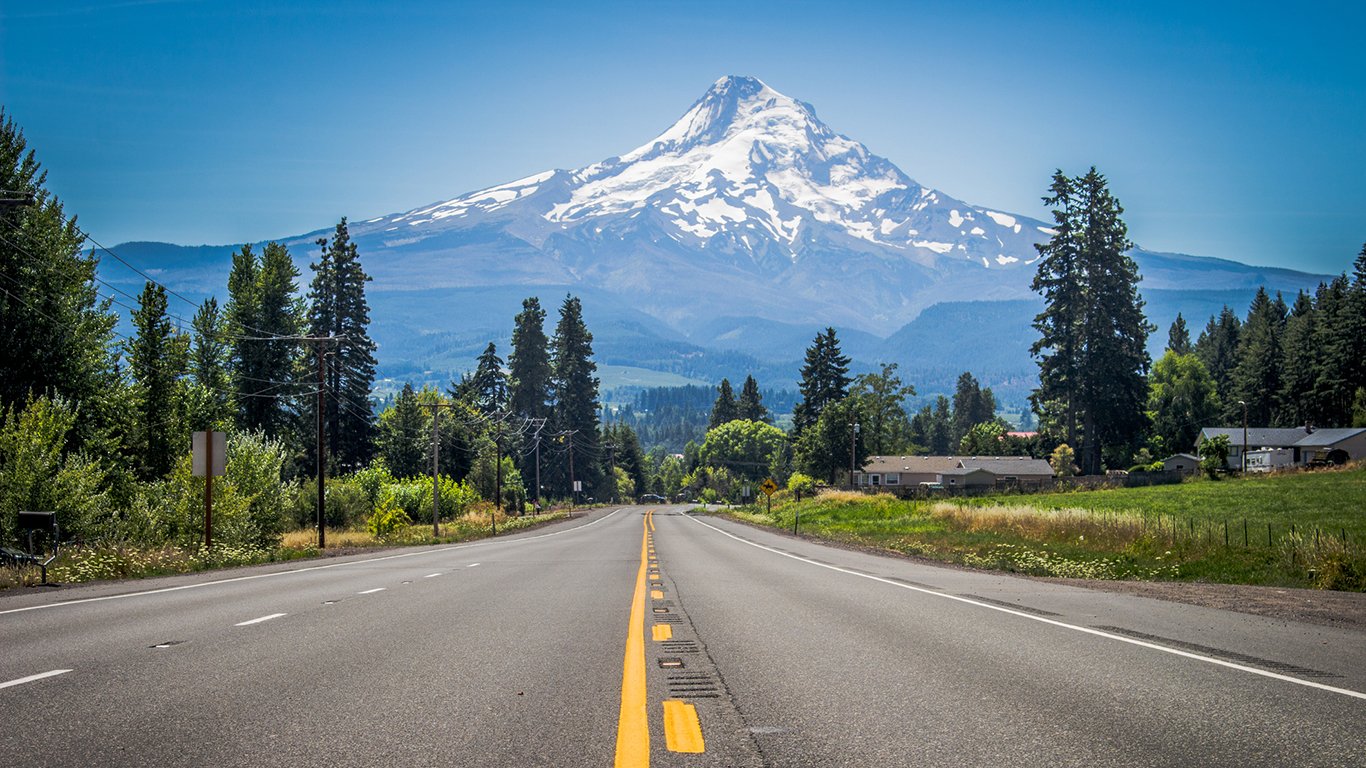
Source: BoucherPhotoStudio / iStock
29. Oregon
> Gov’t. employees, 2018: 15.4% of workforce
> Gov’t employment change, 2008-2018: -1.0% (298,000 to 295,000)
> State gov’t. spending per capita: $11,986 (11th highest)
> Population density: 40 per sq. mi. (12th lowest)
 24/7 Wall St.
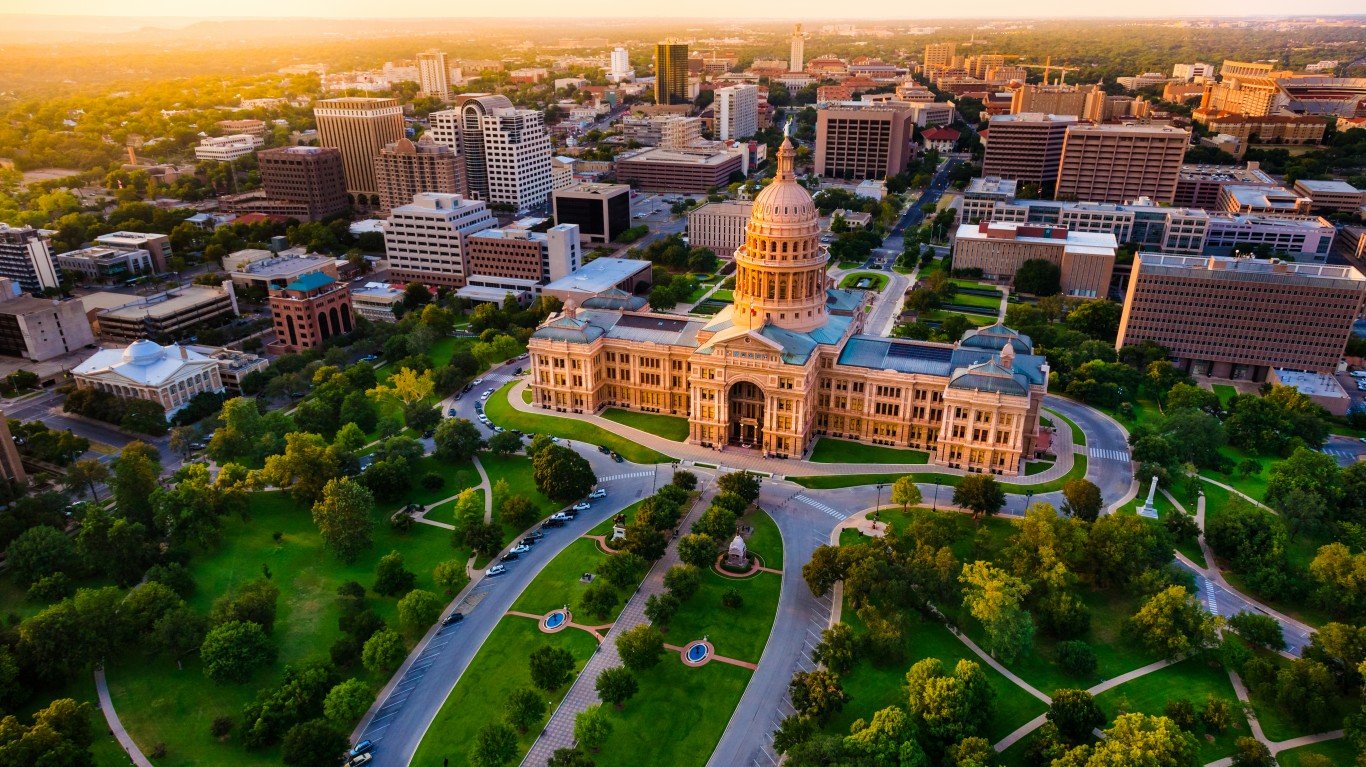
Source: dszc / Getty Images
28. Texas
> Gov’t. employees, 2018: 15.6% of workforce
> Gov’t employment change, 2008-2018: +7.9% (1.8 million to 2.0 million)
> State gov’t. spending per capita: $8,917 (12th lowest)
> Population density: 96 per sq. mi. (25th lowest)
Source: SeanPavonePhoto / Getty Images
27. Maine
> Gov’t. employees, 2018: 15.9% of workforce
> Gov’t employment change, 2008-2018: -4.0% (104,400 to 100,200)
> State gov’t. spending per capita: $9,711 (21st lowest)
> Population density: 43 per sq. mi. (13th lowest)
[in-text-ad-2]

Source: Sean Pavone / Getty Images
26. Kentucky
> Gov’t. employees, 2018: 16.2% of workforce
> Gov’t employment change, 2008-2018: +1.3% (309,700 to 313,700)
> State gov’t. spending per capita: $10,205 (25th highest)
> Population density: 110 per sq. mi. (22nd highest)
Source: nick1803 / Getty Images
25. Colorado
> Gov’t. employees, 2018: 16.3% of workforce
> Gov’t employment change, 2008-2018: +16.0% (383,700 to 445,000)
> State gov’t. spending per capita: $10,219 (24th highest)
> Population density: 49 per sq. mi. (14th lowest)
[in-text-ad]
Source: RickSause / Getty Images
24. North Carolina
> Gov’t. employees, 2018: 16.3% of workforce
> Gov’t employment change, 2008-2018: +1.7% (720,700 to 733,000)
> State gov’t. spending per capita: $8,658 (7th lowest)
> Population density: 196 per sq. mi. (15th highest)

Source: Bill_Dally / iStock
23. Utah
> Gov’t. employees, 2018: 16.3% of workforce
> Gov’t employment change, 2008-2018: +17.1% (211,700 to 247,900)
> State gov’t. spending per capita: $8,809 (11th lowest)
> Population density: 34 per sq. mi. (10th lowest)
Source: Maksymowicz / Getty Images
22. Iowa
> Gov’t. employees, 2018: 16.5% of workforce
> Gov’t employment change, 2008-2018: +3.1% (252,900 to 260,700)
> State gov’t. spending per capita: $11,100 (20th highest)
> Population density: 55 per sq. mi. (15th lowest)
[in-text-ad-2]
Source: Bluepoint951. / Wikimedia Commons
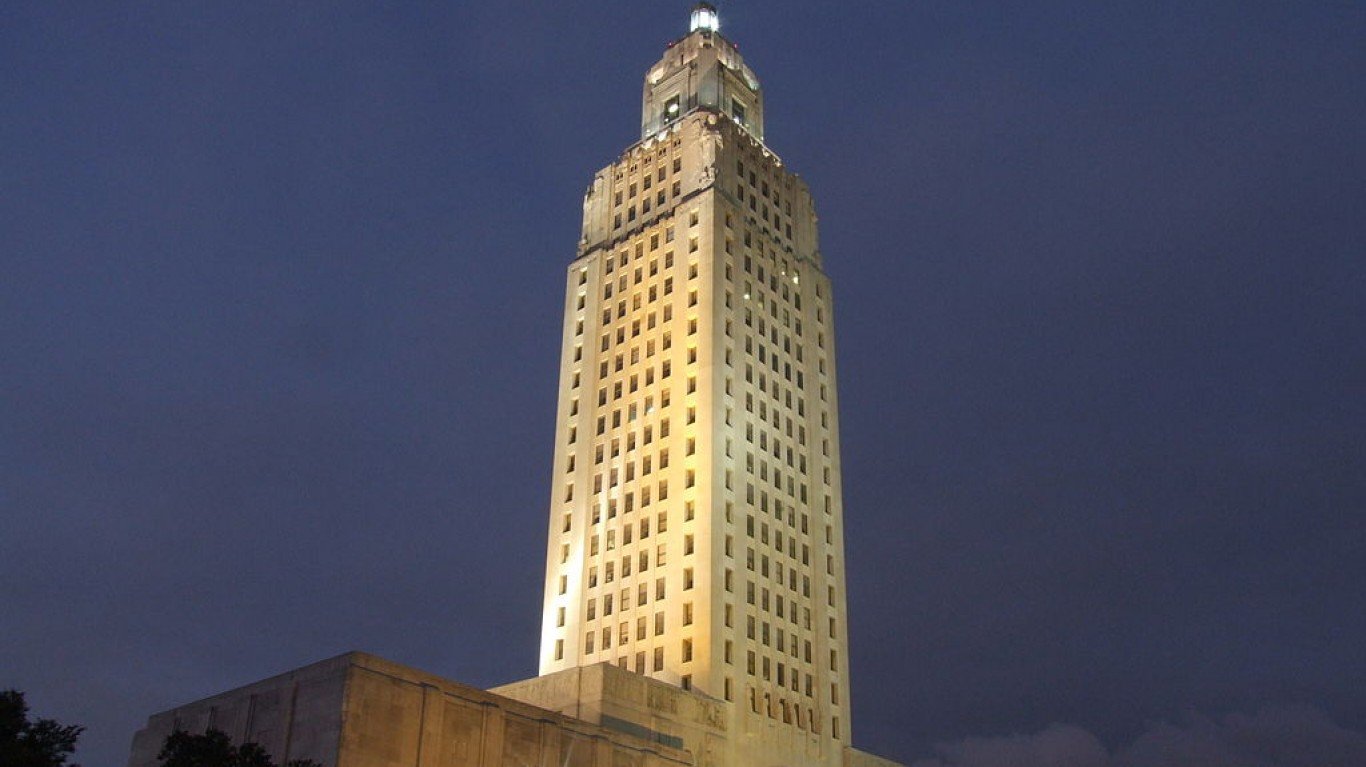
21. Louisiana
> Gov’t. employees, 2018: 16.5% of workforce
> Gov’t employment change, 2008-2018: -10.7% (366,900 to 327,600)
> State gov’t. spending per capita: $10,139 (25th lowest)
> Population density: 105 per sq. mi. (24th highest)

Source: Sean Pavone / Getty Images
20. Arkansas
> Gov’t. employees, 2018: 16.8% of workforce
> Gov’t employment change, 2008-2018: -0.7% (213,800 to 212,200)
> State gov’t. spending per capita: $9,087 (13th lowest)
> Population density: 56 per sq. mi. (17th lowest)
[in-text-ad]
Source: knowlesgallery / Getty Images
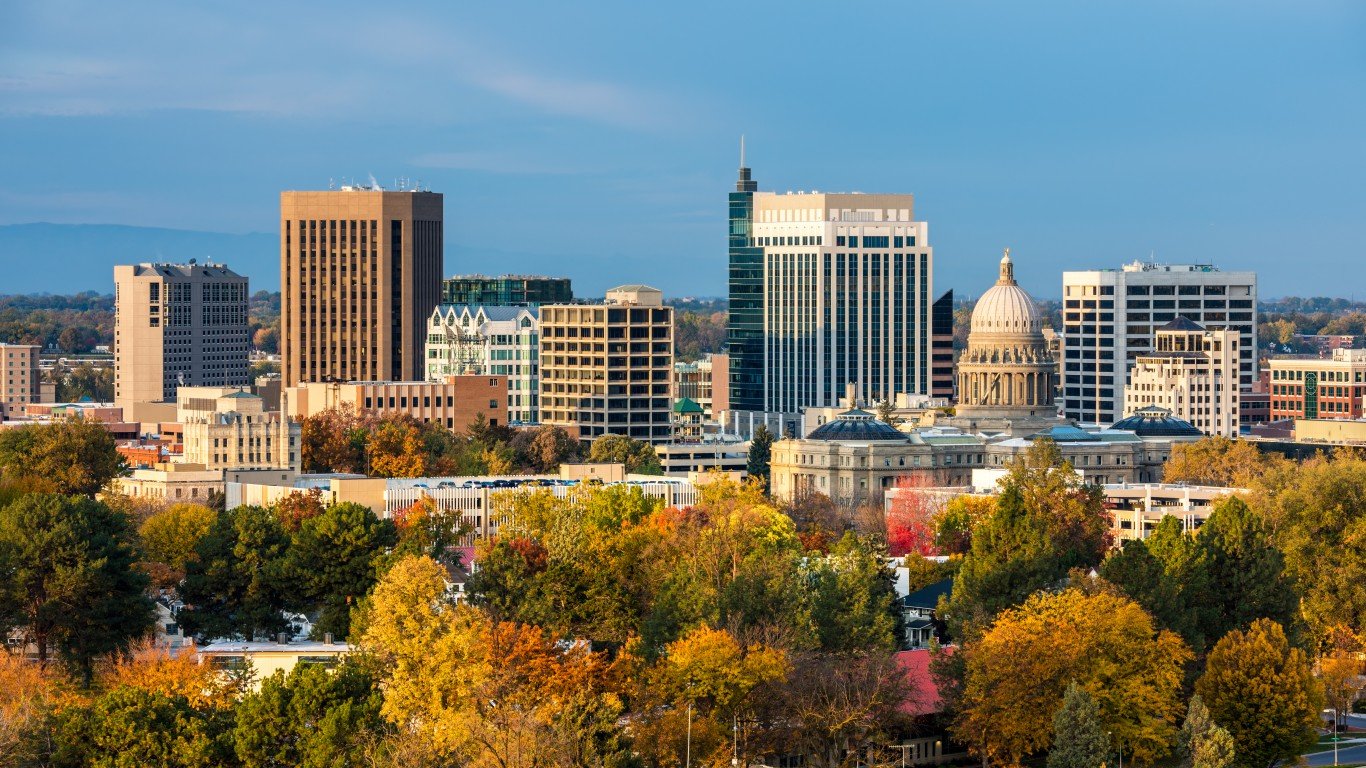
19. Idaho
> Gov’t. employees, 2018: 16.9% of workforce
> Gov’t employment change, 2008-2018: +4.8% (119,200 to 124,900)
> State gov’t. spending per capita: $7,284 (the lowest)
> Population density: 19 per sq. mi. (7th lowest)
Source: wellesenterprises / Getty Images
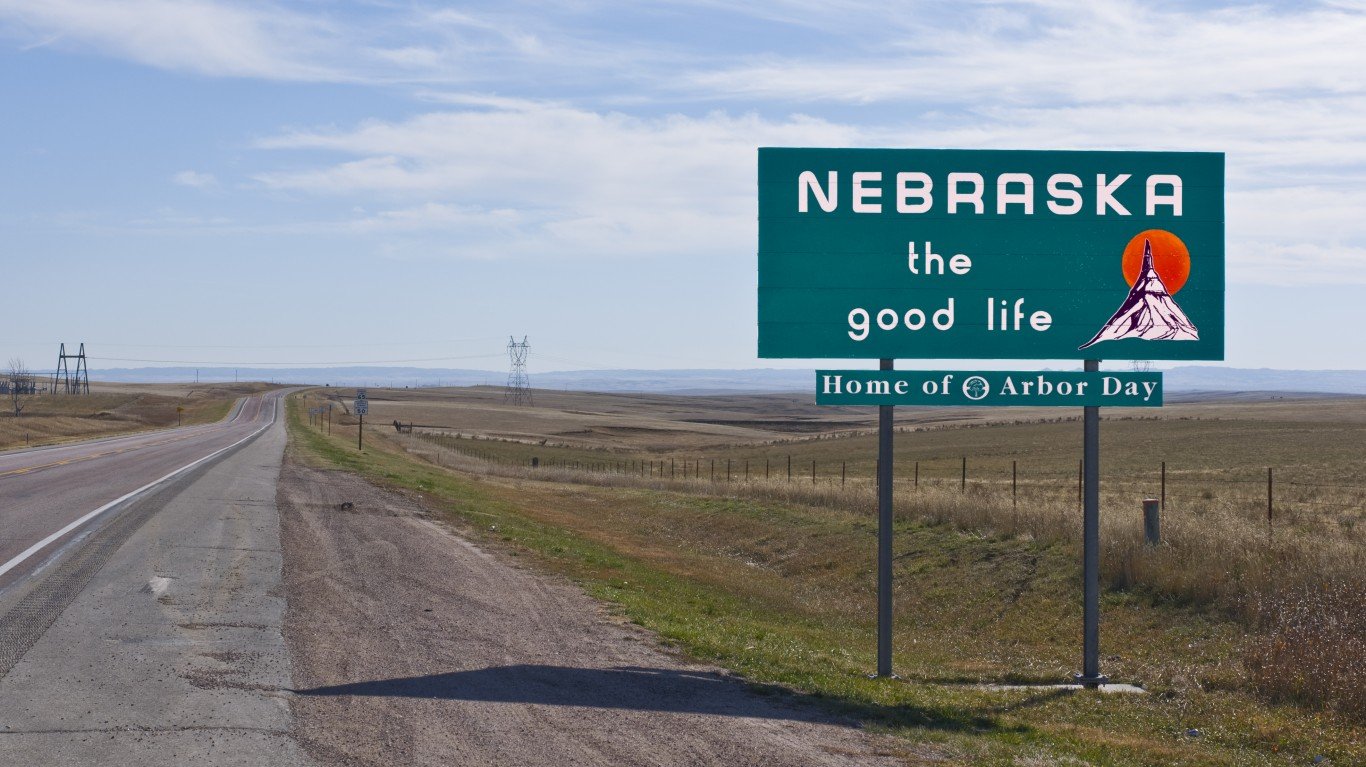
18. Nebraska
> Gov’t. employees, 2018: 17.0% of workforce
> Gov’t employment change, 2008-2018: +5.9% (163,900 to 173,500)
> State gov’t. spending per capita: $12,016 (10th highest)
> Population density: 24 per sq. mi. (8th lowest)
Source: SeanPavonePhoto / Getty Images
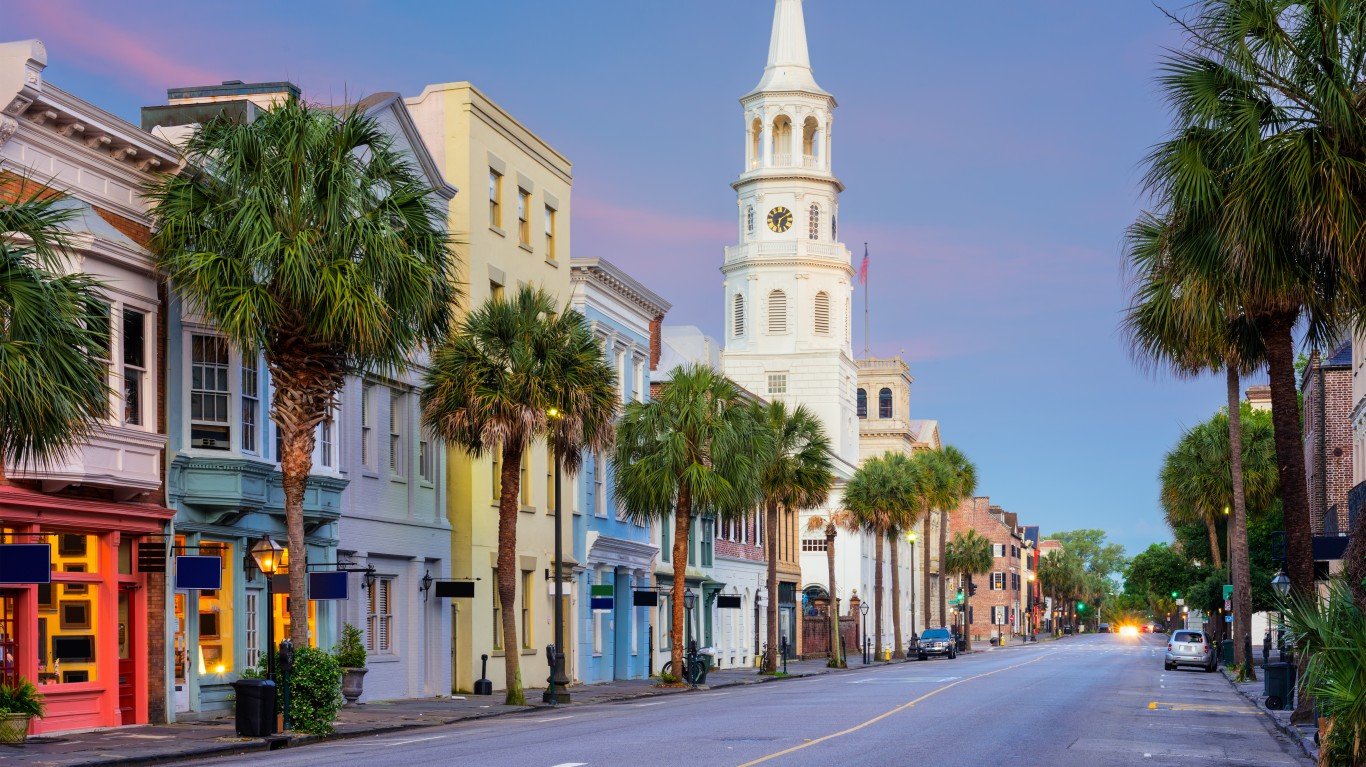
17. South Carolina
> Gov’t. employees, 2018: 17.2% of workforce
> Gov’t employment change, 2008-2018: +3.8% (355,500 to 369,000)
> State gov’t. spending per capita: $9,461 (17th lowest)
> Population density: 154 per sq. mi. (19th highest)
[in-text-ad-2]
[Need Manual Image]
16. Washington
> Gov’t. employees, 2018: 17.2% of workforce
> Gov’t employment change, 2008-2018: +7.4% (546,300 to 586,700)
> State gov’t. spending per capita: $11,732 (14th highest)
> Population density: 101 per sq. mi. (25th highest)

Source: SeanPavonePhoto / Getty Images
15. Vermont
> Gov’t. employees, 2018: 17.9% of workforce
> Gov’t employment change, 2008-2018: +4.1% (54,200 to 56,400)
> State gov’t. spending per capita: $12,467 (8th highest)
> Population density: 68 per sq. mi. (21st lowest)
[in-text-ad]
Source: Sean Pavone / Getty Images
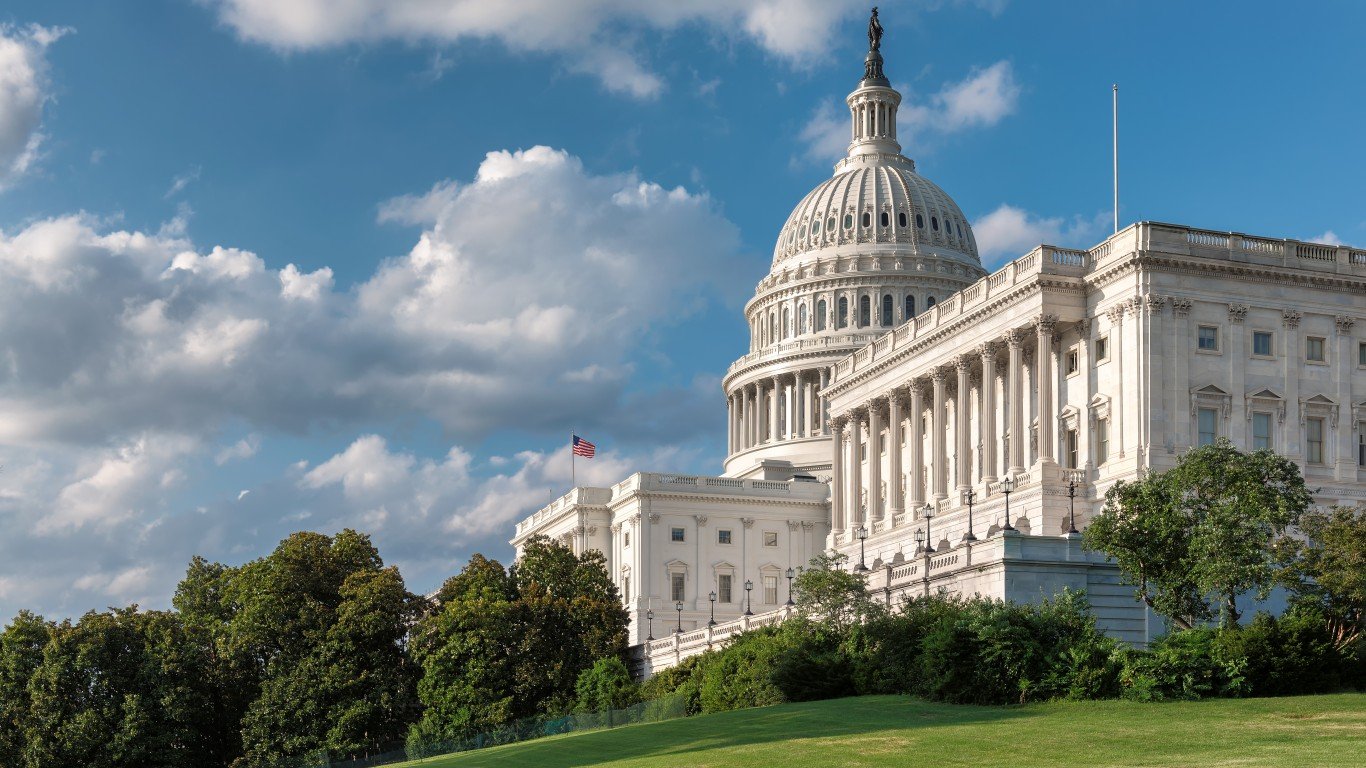
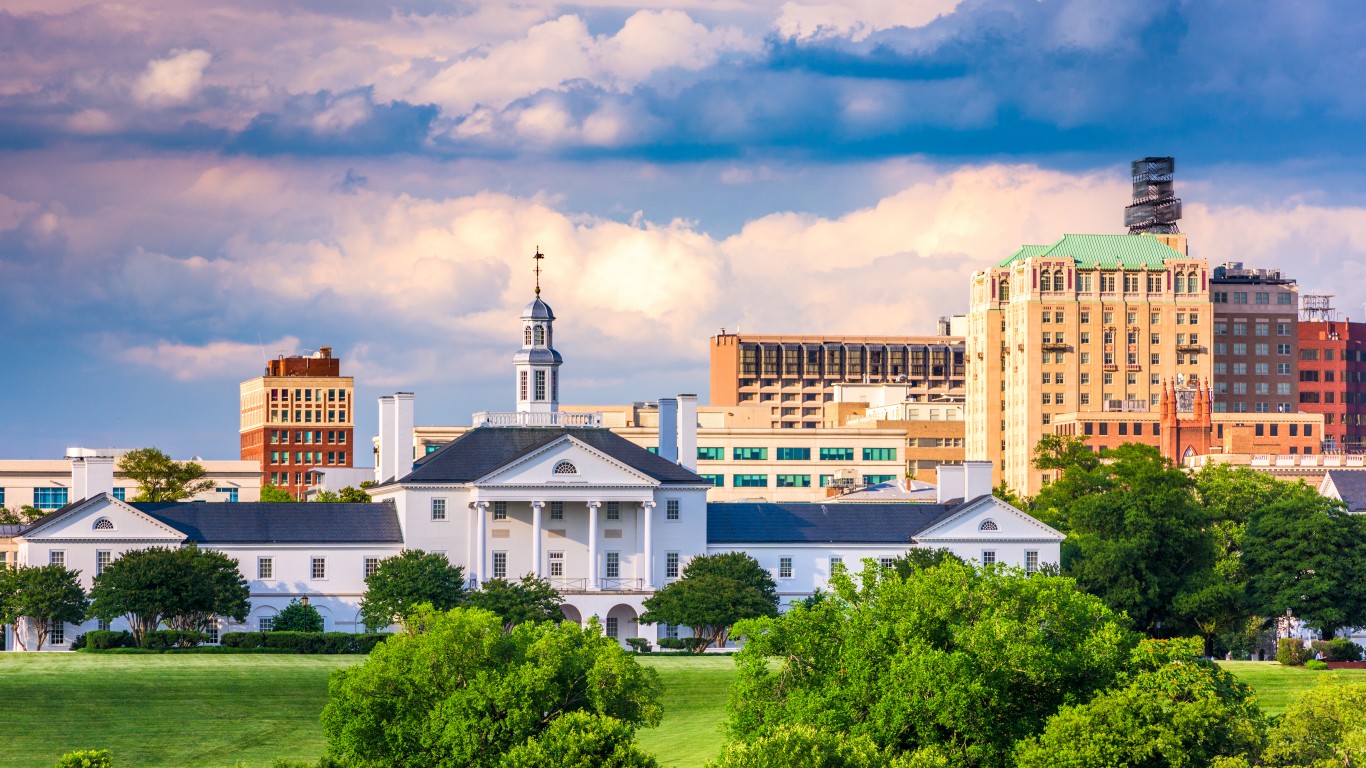
14. Virginia
> Gov’t. employees, 2018: 18.1% of workforce
> Gov’t employment change, 2008-2018: +4.0% (695,000 to 722,500)
> State gov’t. spending per capita: $9,464 (18th lowest)
> Population density: 203 per sq. mi. (14th highest)
Source: JMichl / Getty Images
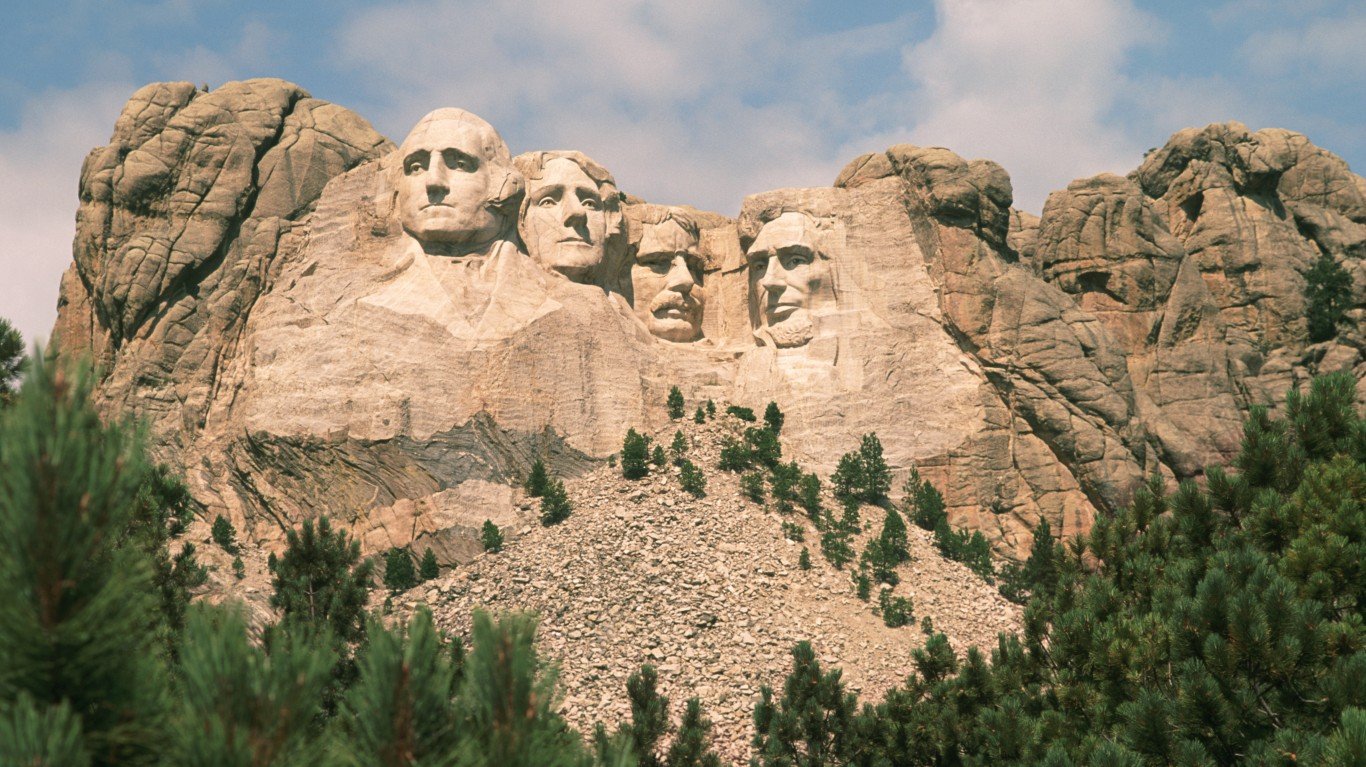
13. South Dakota
> Gov’t. employees, 2018: 18.1% of workforce
> Gov’t employment change, 2008-2018: +4.5% (76,200 to 79,600)
> State gov’t. spending per capita: $9,162 (14th lowest)
> Population density: 11 per sq. mi. (5th lowest)
Source: ricardoreitmeyer / Getty Images
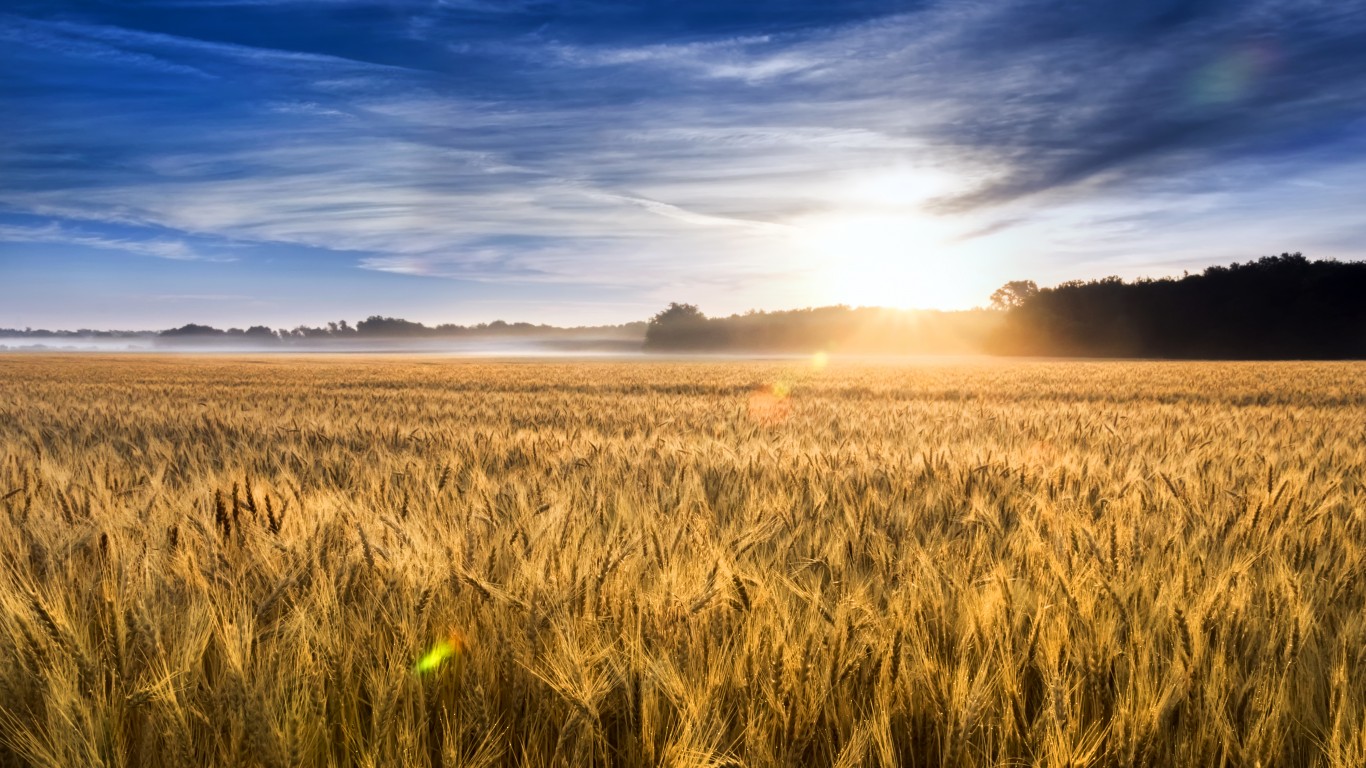
12. Kansas
> Gov’t. employees, 2018: 18.2% of workforce
> Gov’t employment change, 2008-2018: -0.7% (260,000 to 258,300)
> State gov’t. spending per capita: $9,883 (22nd lowest)
> Population density: 35 per sq. mi. (11th lowest)
[in-text-ad-2]
Source: SeanPavonePhoto / Getty Images
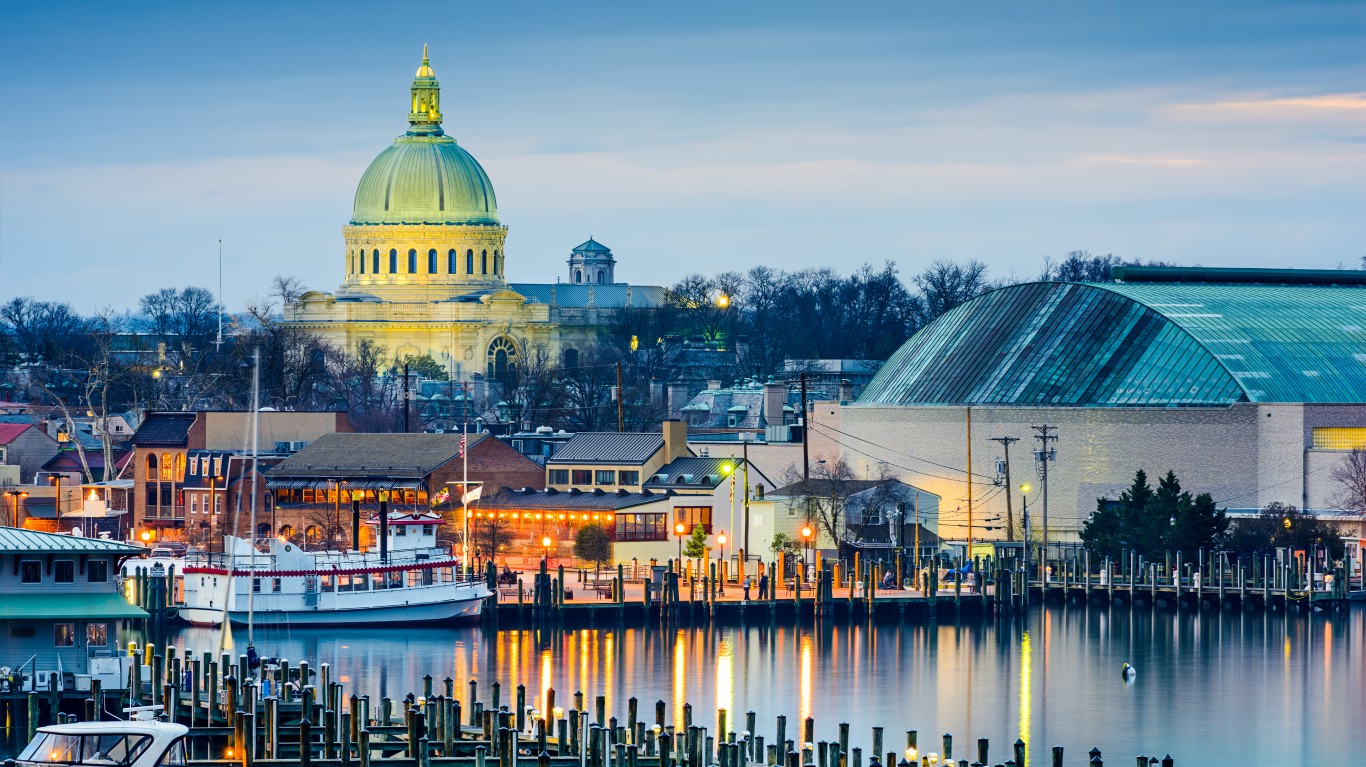
11. Maryland
> Gov’t. employees, 2018: 18.4% of workforce
> Gov’t employment change, 2008-2018: +3.2% (488,800 to 504,600)
> State gov’t. spending per capita: $11,144 (19th highest)
> Population density: 595 per sq. mi. (5th highest)

Source: Sean Pavone / Getty Images
10. Alabama
> Gov’t. employees, 2018: 18.9% of workforce
> Gov’t employment change, 2008-2018: -0.4% (387,300 to 385,900)
> State gov’t. spending per capita: $9,288 (15th lowest)
> Population density: 94 per sq. mi. (24th lowest)
[in-text-ad]
Source: lorenkerns / Flickr
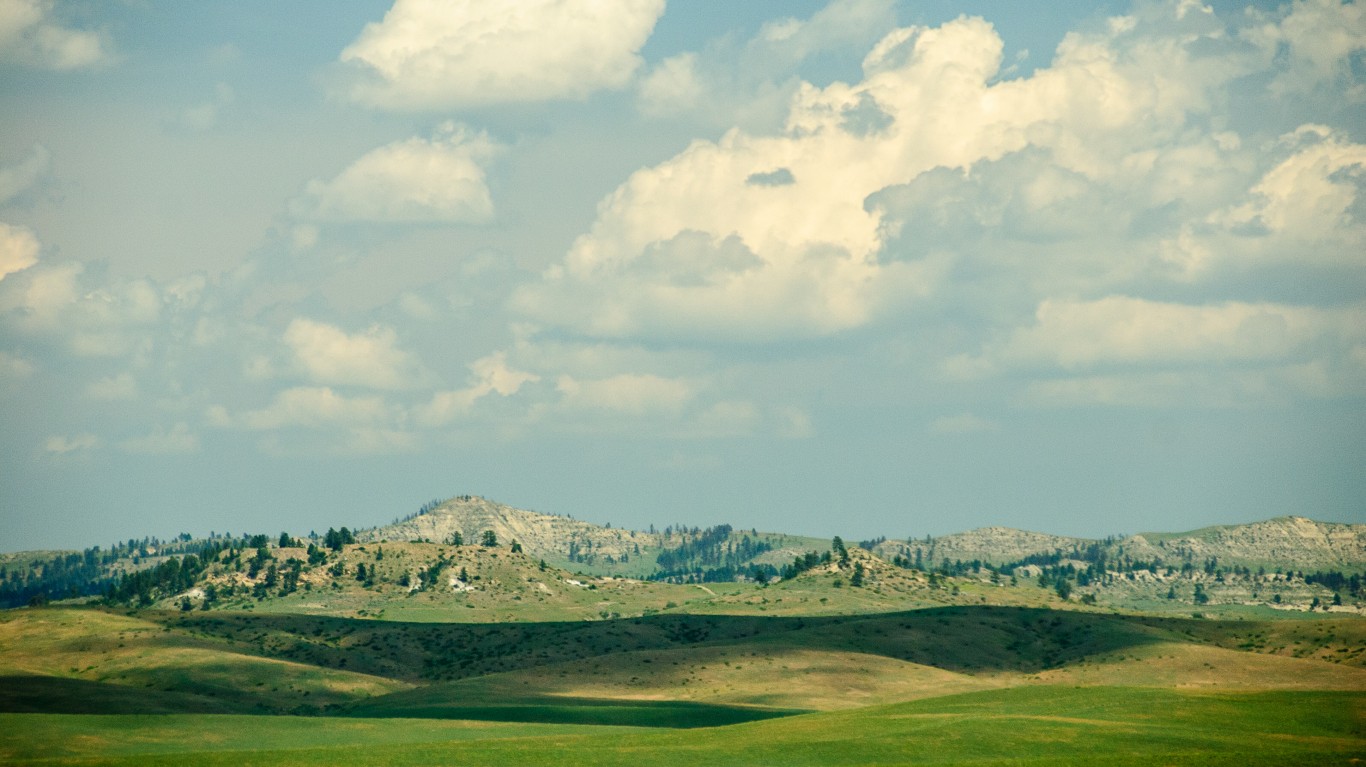
9. Montana
> Gov’t. employees, 2018: 18.9% of workforce
> Gov’t employment change, 2008-2018: +2.6% (88,100 to 90,400)
> State gov’t. spending per capita: $9,527 (19th lowest)
> Population density: 7 per sq. mi. (3rd lowest)
Source: ChrisBoswell / Getty Images
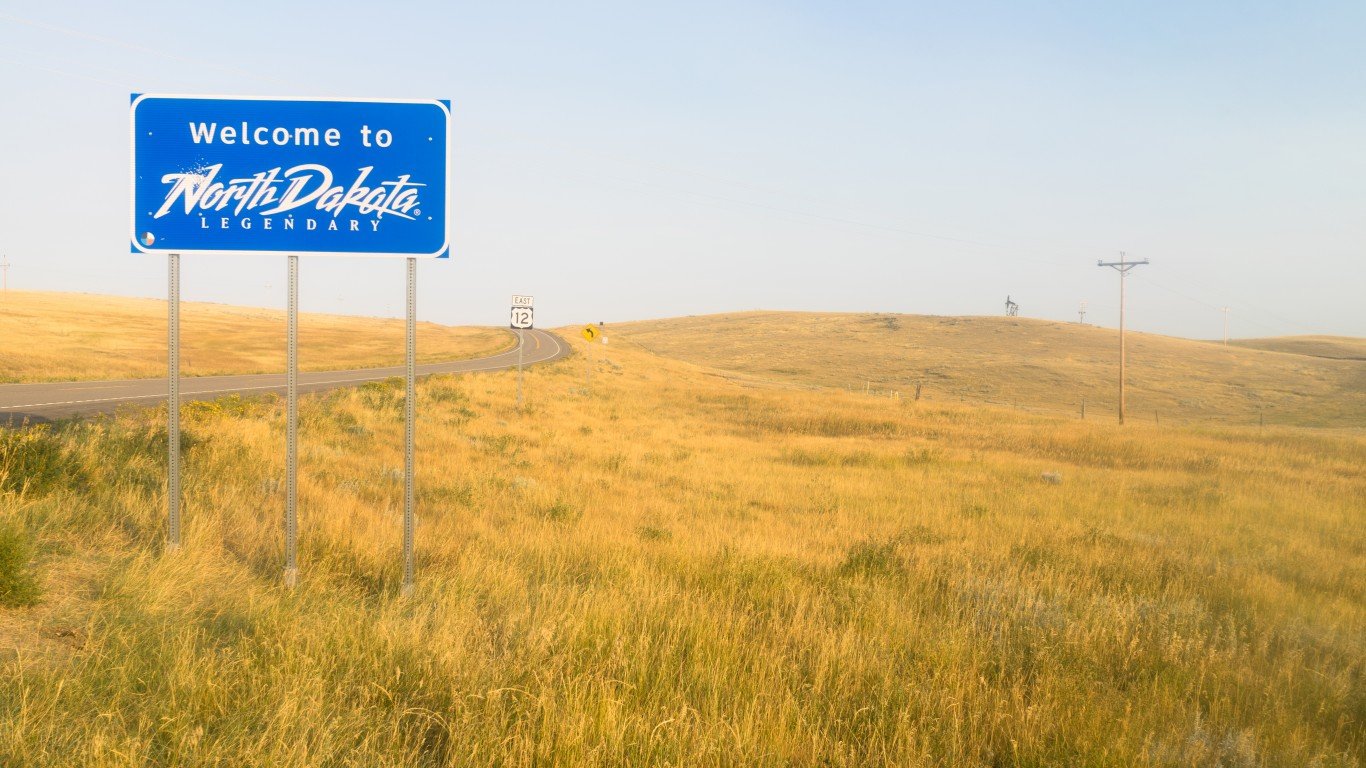
8. North Dakota
> Gov’t. employees, 2018: 19.0% of workforce
> Gov’t employment change, 2008-2018: +8.1% (76,300 to 82,500)
> State gov’t. spending per capita: $14,288 (4th highest)
> Population density: 10 per sq. mi. (4th lowest)
Source: wingmar / Getty Images
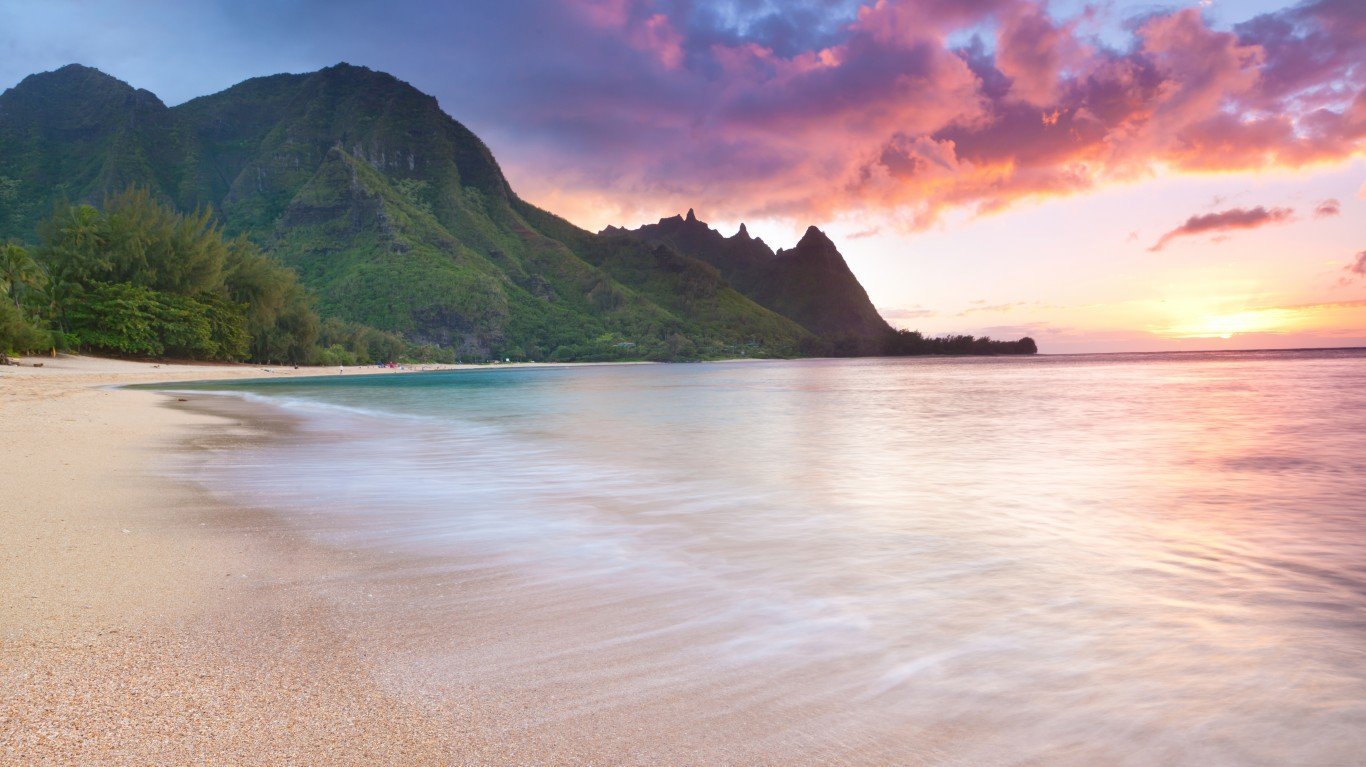
7. Hawaii
> Gov’t. employees, 2018: 19.1% of workforce
> Gov’t employment change, 2008-2018: +0.5% (125,000 to 125,600)
> State gov’t. spending per capita: $11,361 (16th highest)
> Population density: 212 per sq. mi. (13th highest)
[in-text-ad-2]
Source: Majestic_Aerials / Getty Images
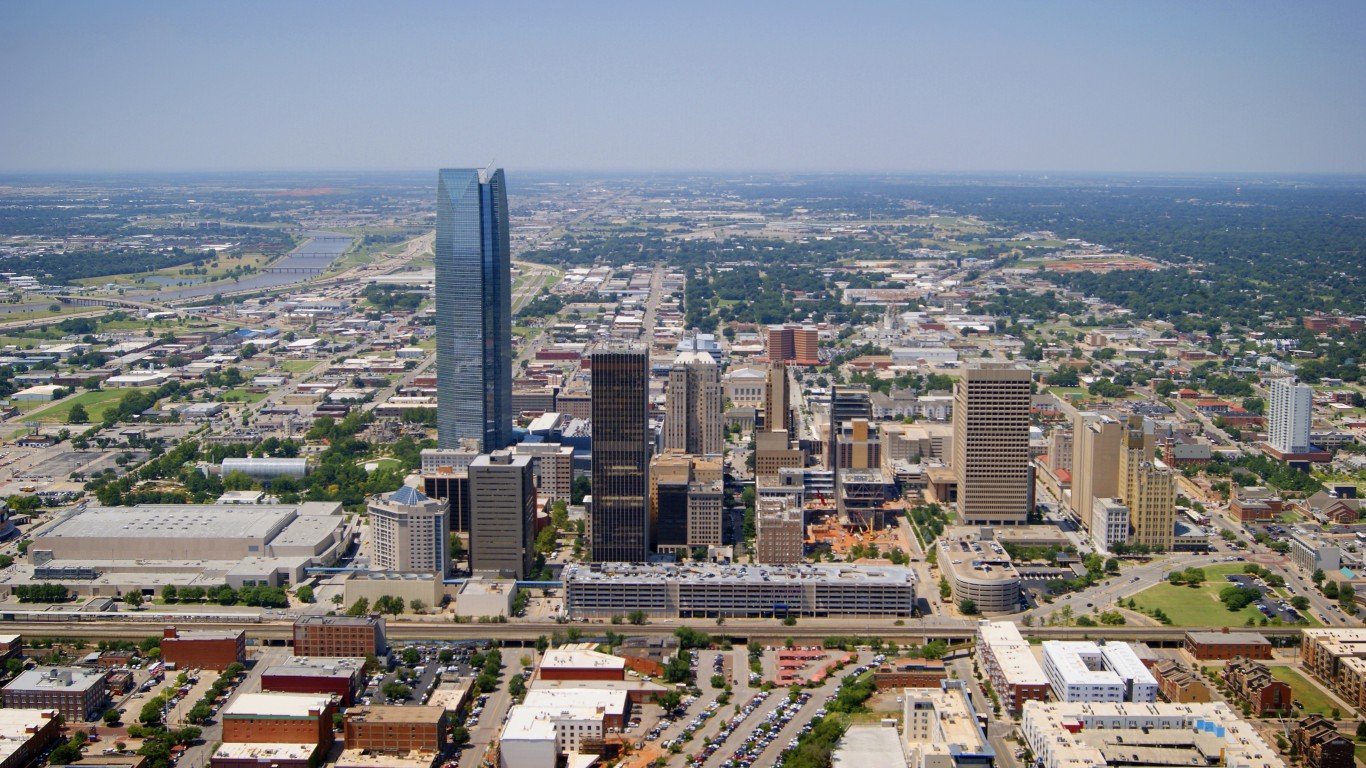
6. Oklahoma
> Gov’t. employees, 2018: 20.6% of workforce
> Gov’t employment change, 2008-2018: +3.1% (337,300 to 347,800)
> State gov’t. spending per capita: $8,784 (10th lowest)
> Population density: 55 per sq. mi. (16th lowest)
Source: SeanPavonePhoto / Getty Images
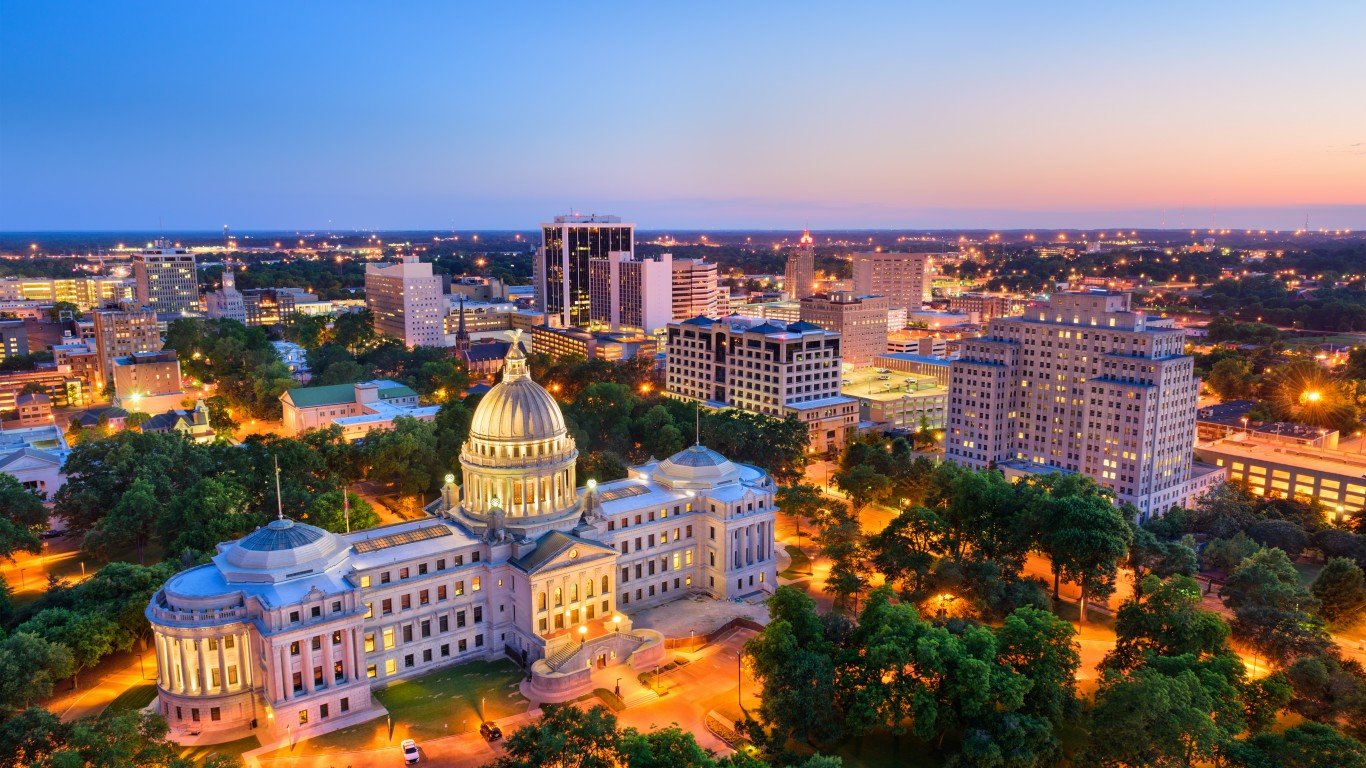
5. Mississippi
> Gov’t. employees, 2018: 20.9% of workforce
> Gov’t employment change, 2008-2018: -2.6% (247,800 to 241,300)
> State gov’t. spending per capita: $10,030 (24th lowest)
> Population density: 63 per sq. mi. (19th lowest)
[in-text-ad]
Source: Snoopywv / Wikimedia Commons
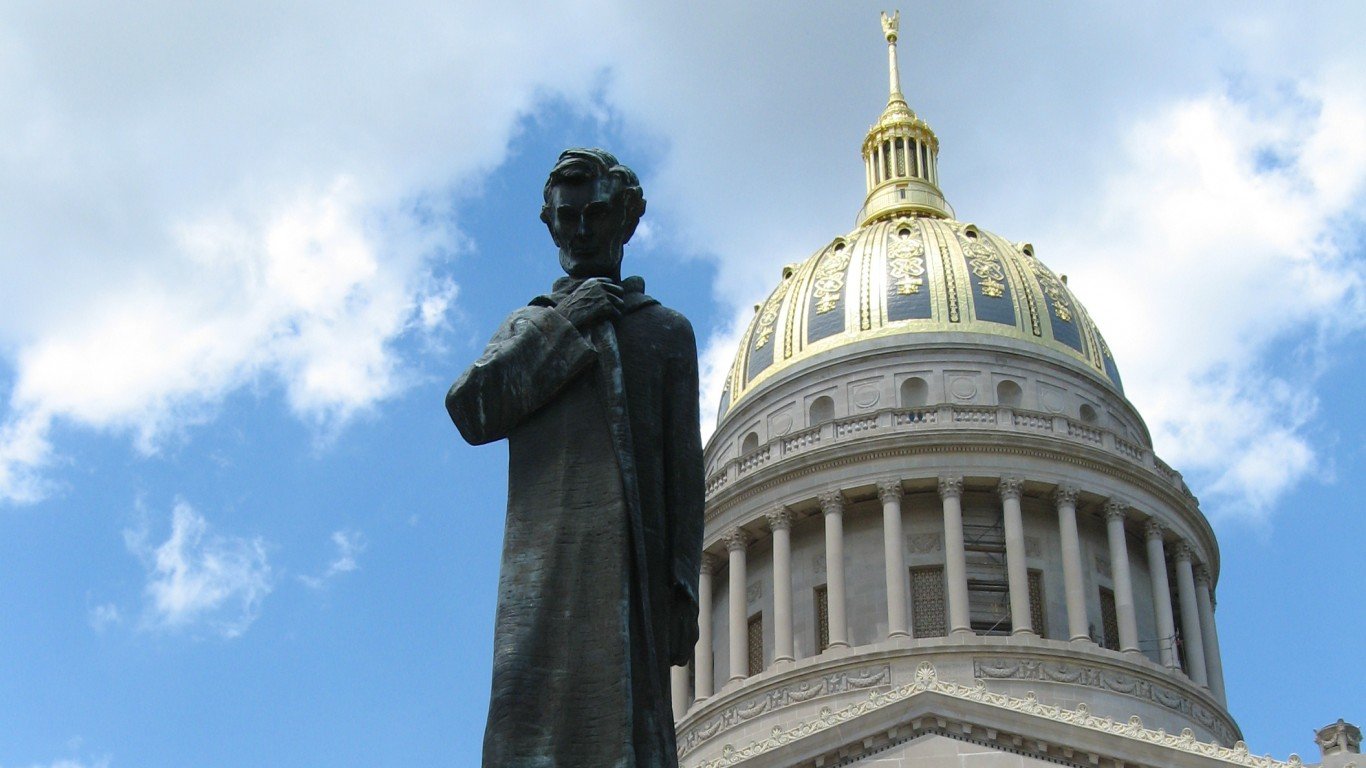
4. West Virginia
> Gov’t. employees, 2018: 21.0% of workforce
> Gov’t employment change, 2008-2018: +3.5% (147,500 to 152,600)
> State gov’t. spending per capita: $9,943 (23rd lowest)
> Population density: 77 per sq. mi. (22nd lowest)
Source: ivanastar / Getty Images
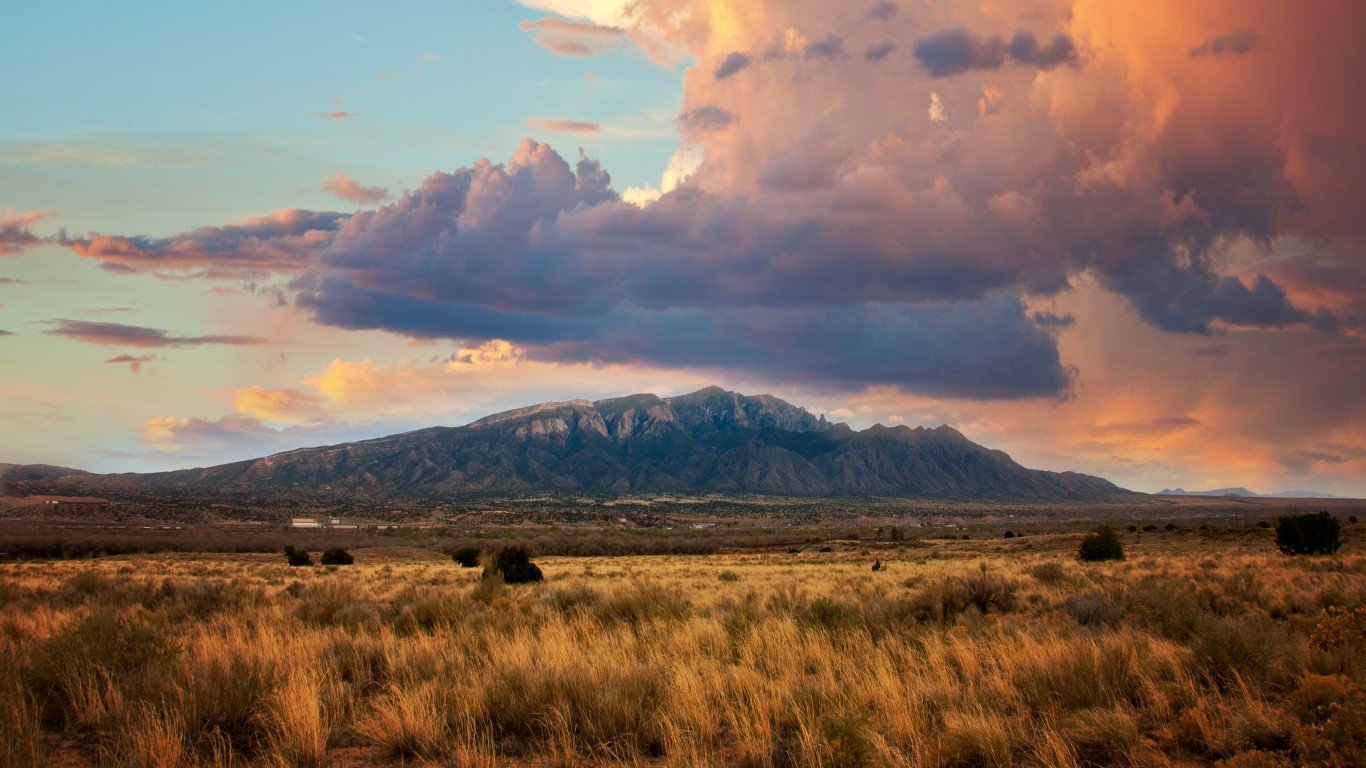
3. New Mexico
> Gov’t. employees, 2018: 22.2% of workforce
> Gov’t employment change, 2008-2018: -5.5% (197,600 to 186,800)
> State gov’t. spending per capita: $11,298 (17th highest)
> Population density: 17 per sq. mi. (6th lowest)
Source: Fyletto / Getty Images
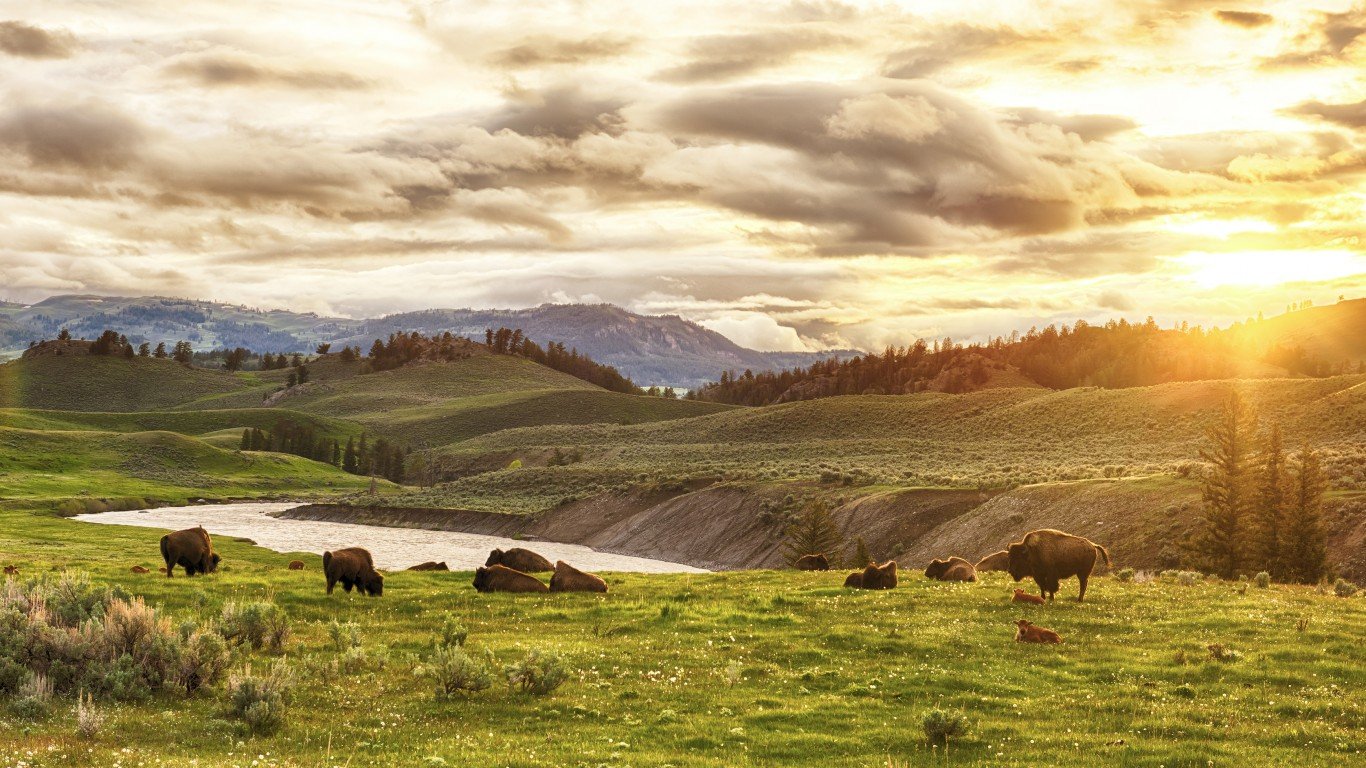
2. Wyoming
> Gov’t. employees, 2018: 24.1% of workforce
> Gov’t employment change, 2008-2018: +0.3% (68,700 to 68,900)
> State gov’t. spending per capita: $17,379 (2nd highest)
> Population density: 6 per sq. mi. (2nd lowest)
[in-text-ad-2]
Source: Chilkoot / Getty Images
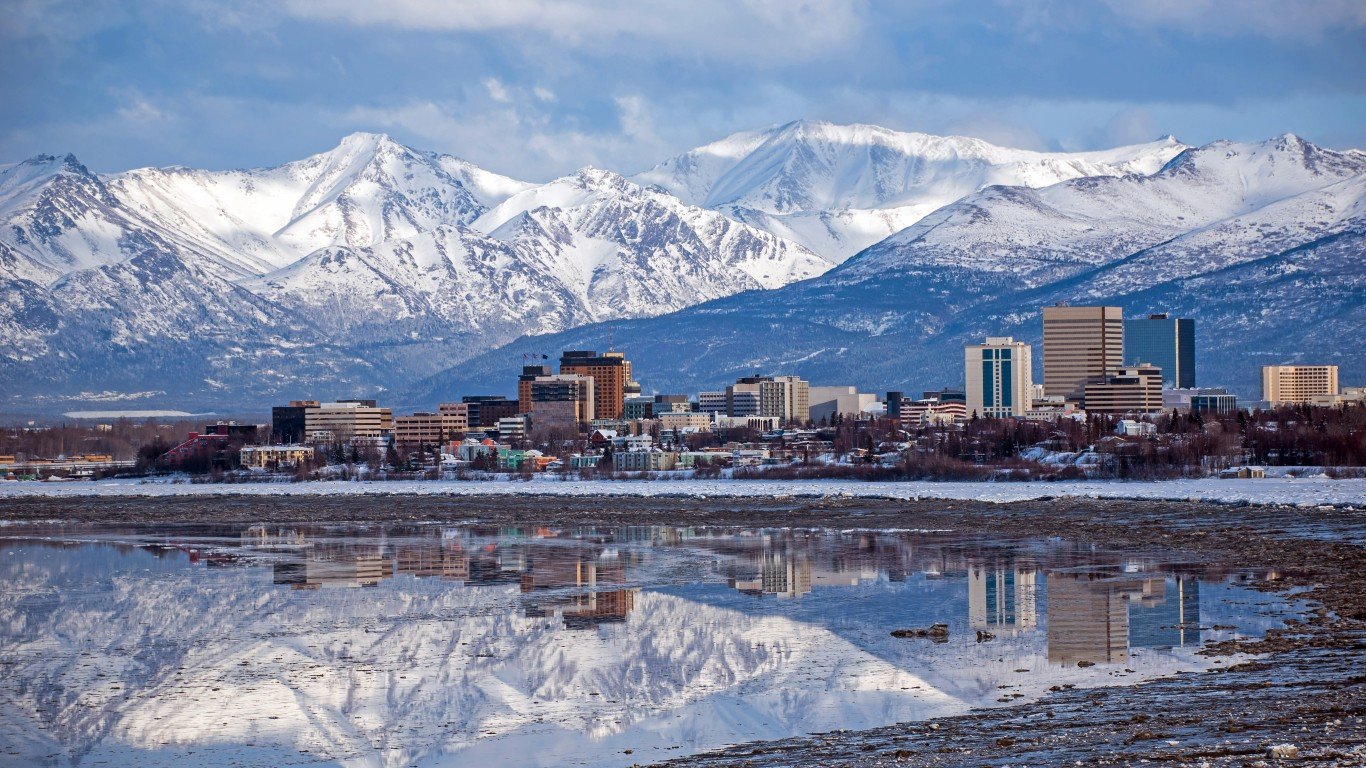
1. Alaska
> Gov’t. employees, 2018: 24.6% of workforce
> Gov’t employment change, 2008-2018: -2.1% (82,100 to 80,400)
> State gov’t. spending per capita: $21,369 (the highest)
> Population density: 1 per sq. mi. (the lowest)
Methodology
To determine government employment at the state, local, and federal level as a share of total employment in each state, 24/7 Wall St. used employment data from the Bureau of Labor Statistics for 2018. Government employment includes government-owned schools and hospitals and the U.S. Postal Service.
State employment-to-population ratios are also from the BLS. Population density is from the 2010 Decennial Census. Total state government spending figures come from the Census Bureau’s State and Local Government Finances Snapshot for 2016. Our per capita adjustment is based on population figures from the U.S. Census Bureau’s Population Estimates Program and is for 2017.
Sponsored: Want to Retire Early? Here’s a Great First Step
Want retirement to come a few years earlier than you’d planned? Or are you ready to retire now, but want an extra set of eyes on your finances?
Now you can speak with up to 3 financial experts in your area for FREE. By simply clicking here you can begin to match with financial professionals who can help you build your plan to retire early. And the best part? The first conversation with them is free.
Click here to match with up to 3 financial pros who would be excited to help you make financial decisions.
Thank you for reading! Have some feedback for us?
Contact the 24/7 Wall St. editorial team.
Editors' Picks

