Quality of life is subject to countless quantitative and qualitative factors — not the least of which is environment.
While living in an ideal city by no means assures personal contentment, conditions like crime, unemployment, and inordinately high living costs can detract from the quality of life in any city.
24/7 Wall St. created an index consisting of over two dozen measures to identify the worst cities to live in in every state. Our list includes cities, towns, villages, boroughs, and Census designated places. We did not include places with fewer than 8,000 residents in our analysis. Because no two states are exactly alike, the kinds of issues affecting the cities on this list vary considerably.
For many of these cities, the problems are serious and deeply entrenched. In 23 of the 50 cities on this list, the violent crime rate is higher than in at least 90% of all other American cities tracked by the FBI — and in another eight, violence is more common than in at least 75% of U.S. cities. The effects of violent crimes like robbery and aggravated assault can extend beyond their immediate victims, often pushing down property values and driving out business. Indeed, in many of these same cities, real estate values are depressed and unemployment is soaring.
In a handful of cities on this list, the situation is less dire. In some less populous states like South Dakota and Wyoming, their worst cities are on this list largely due to their distance from the nearest hospital or a lack of local entertainment options like movie theaters, restaurants, nature parks, and museums.
Though they vary in severity, these conditions can make any city less appealing. It is likely no coincidence that some cities on this list are located in some of America’s fastest shrinking metro areas.
Click here to see the worst city to live in every state
Click here to read our methodology
Source: toddmedia / Getty Images
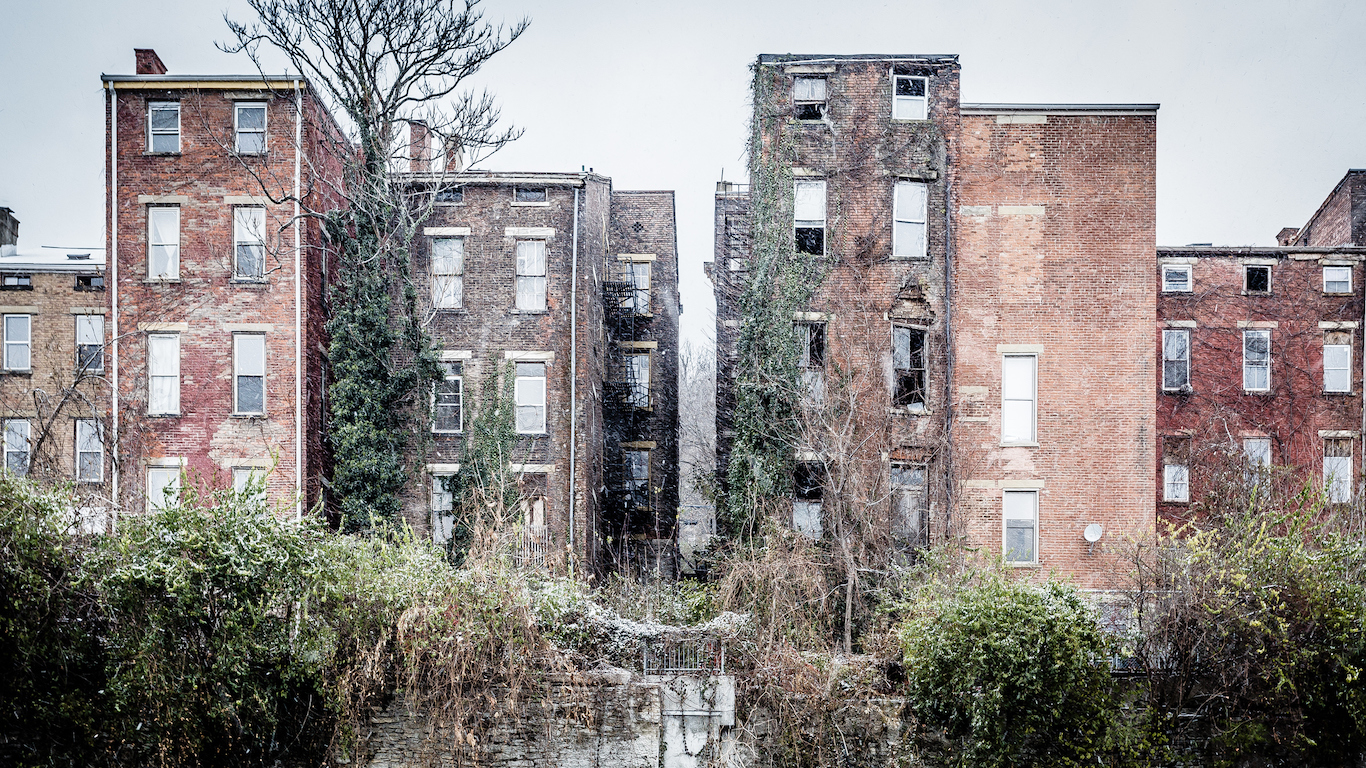
Alabama: Bessemer
> Population: 26,697
> Median home value: $84,000 (state: $132,100)
> Poverty rate: 29.7% (state: 18.0%)
> Violent crimes per 100,000 people: 2,986 (state: 524)
Based on a range of measures related to affordability, economy, quality of life, and community, Bessemer ranks as the worst city to live in in Alabama. The violent crime rate in the small northern Alabama city of about 27,000 is a staggering 2,986 incidents per 100,000 people, nearly six times the state violent crime rate of 524 incidents per 100,000 people.
Crime is often concentrated in poorer areas, and Bessemer residents are far more likely to struggle financially than residents of the state. The typical household in Bessemer earns just $31,308 a year, well below the median annual household income of $46,472 across Alabama.
See all stories featuring: Alabama
[in-text-ad]
Source: yenwen / Getty Images
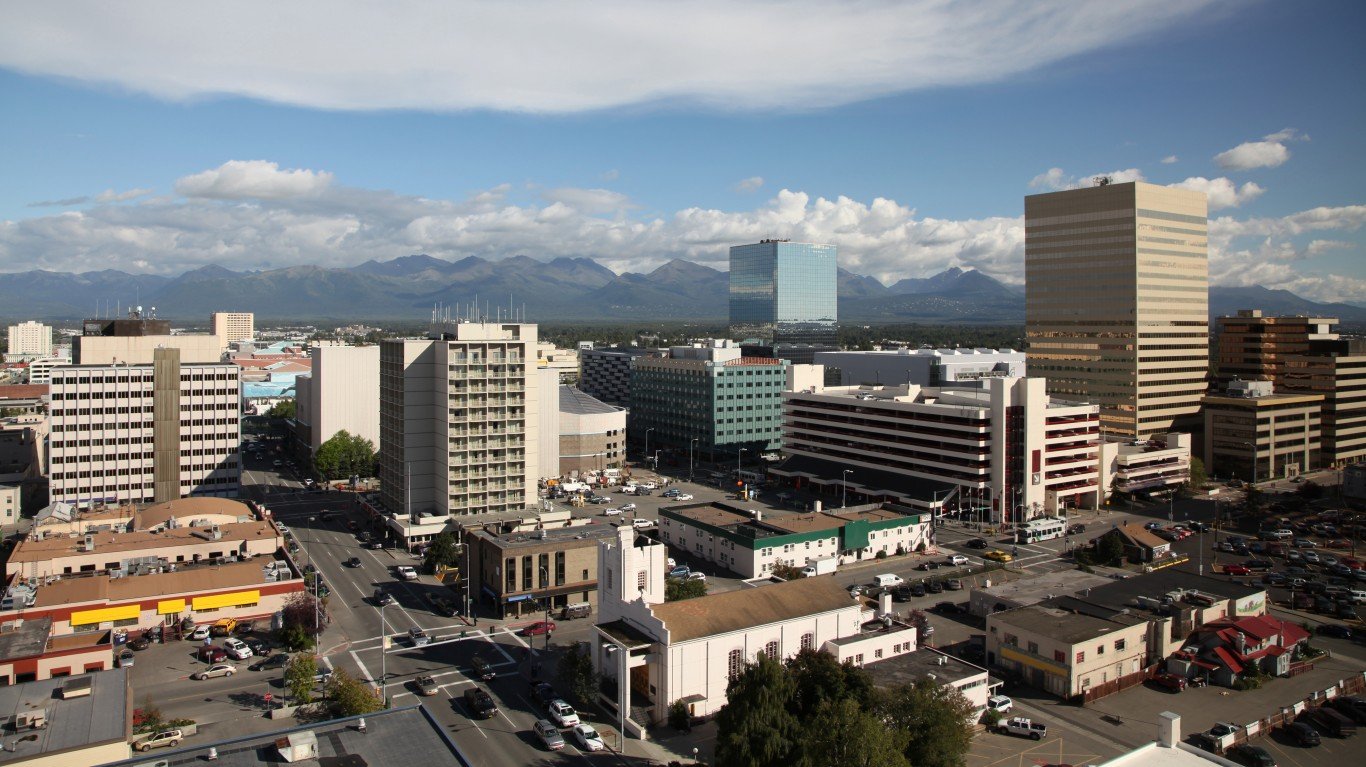
Alaska: Anchorage
> Population: 298,225
> Median home value: $304,500 (state: $261,900)
> Poverty rate: 8.1% (state: 10.2%)
> Violent crimes per 100,000 people: 1,203 (state: 829)
Of the 12 cities in Alaska considered, Anchorage ranks as the worst to live in. The port city, home to nearly 300,000, has a violent crime rate of 1,203 incidents per 100,000 people, the highest rate of any city in the state and well above the violent crime rate of 829 per 100,000 statewide.
Anchorage also has a high cost of living. In addition to having the highest property taxes in the state, in terms of median amount paid, goods and services are also about 27.7% more expensive in Anchorage than they are nationwide on average.
See all stories featuring: Alaska
 24/7 Wall St.
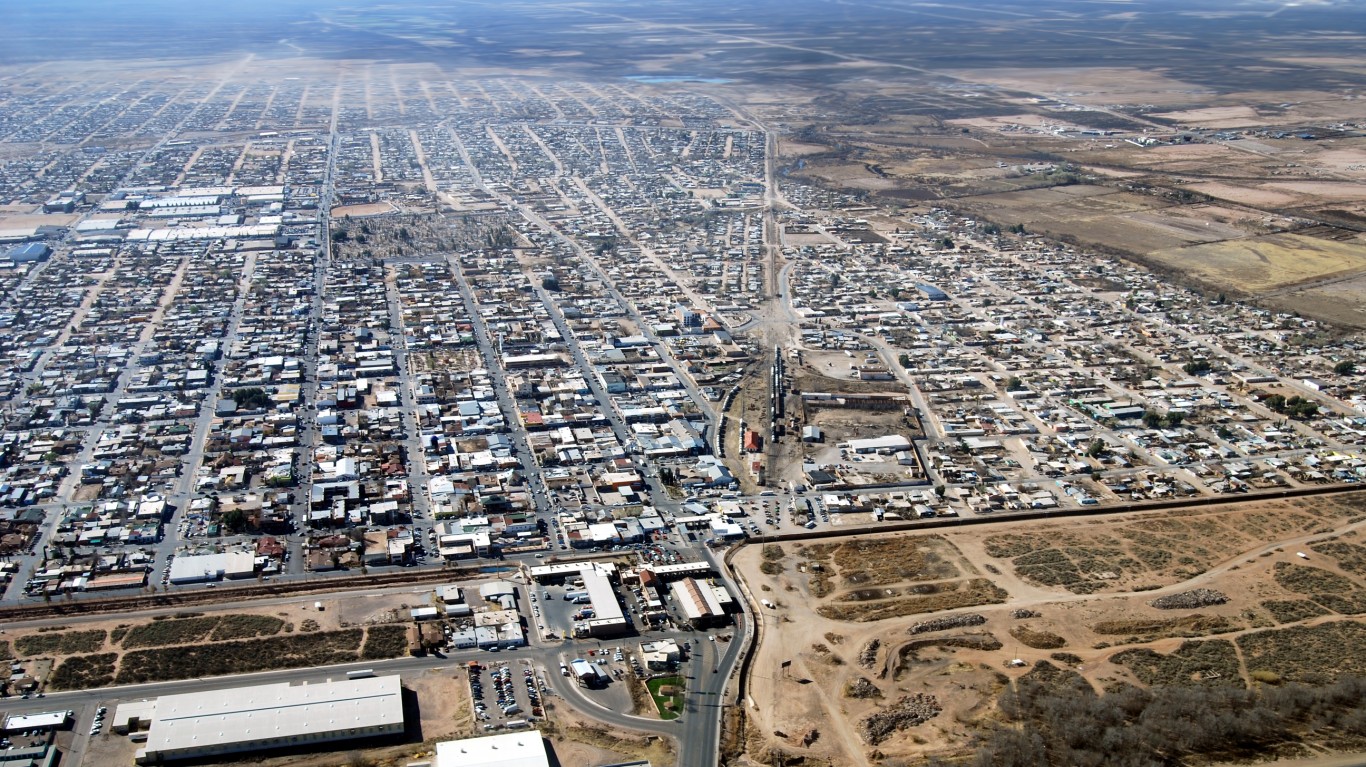
Source: Phototreat / Getty Images
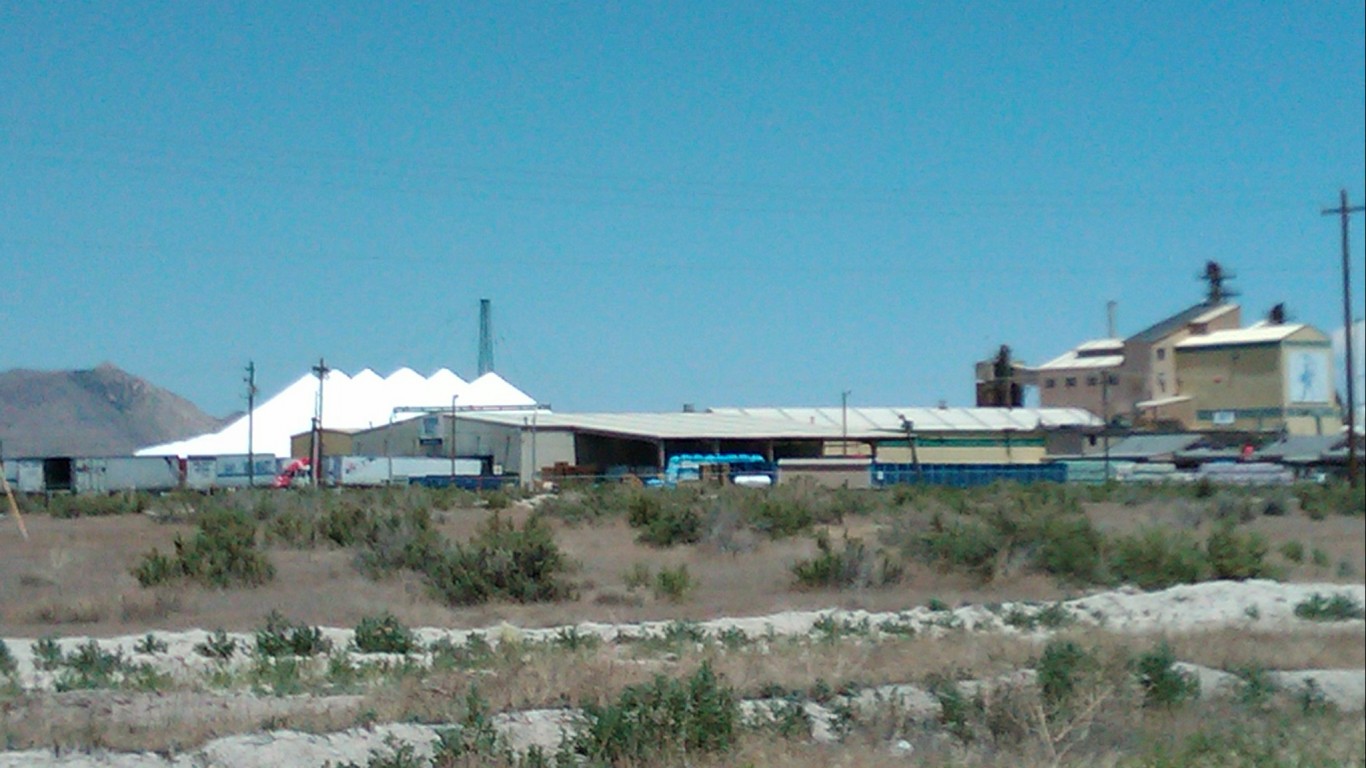
Arizona: Douglas
> Population: 16,576
> Median home value: $88,200 (state: $193,200)
> Poverty rate: 31.9% (state: 17.0%)
> Violent crimes per 100,000 people: 249 (state: 508)
Douglas is a small city of less than 17,000 in southern Arizona along the U.S.-Mexico border. The city has a far lower concentration of restaurants, bars, and cultural attractions than typical. A relatively large share of area residents are struggling financially as the poverty rate in Douglas of 31.9% is well above the 17.0% poverty rate across the state as a whole.
Like many other cities on this list, Douglas’s population is shrinking. Over the last five years, the city lost 4.4% of its population. The resulting falling demand for housing has contributed to depressed property values. The typical home in Douglas is worth just $88,2000, over $100,000 less than the typical Arizona home.
See all stories featuring: Arizona
Source: Thomas R Machnitzki ([email protected]) / Wikimedia Commons
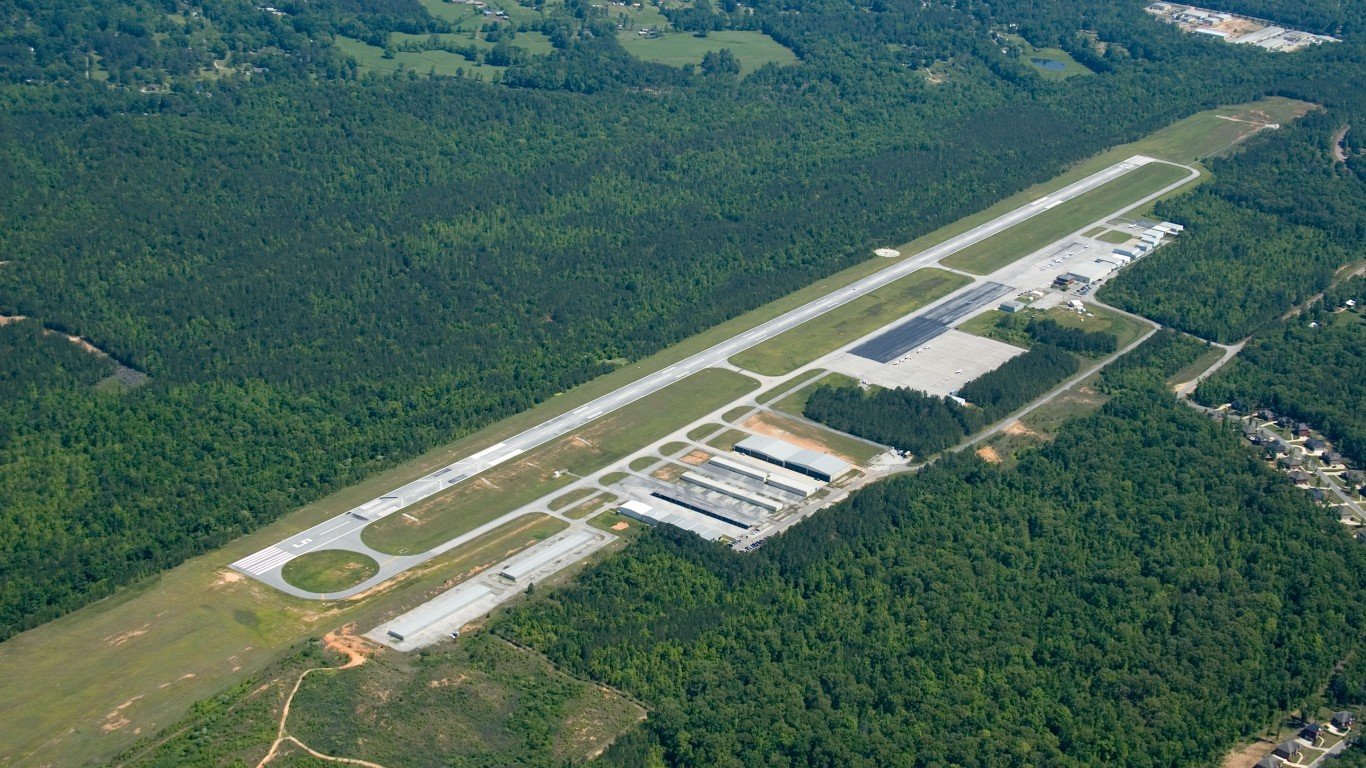
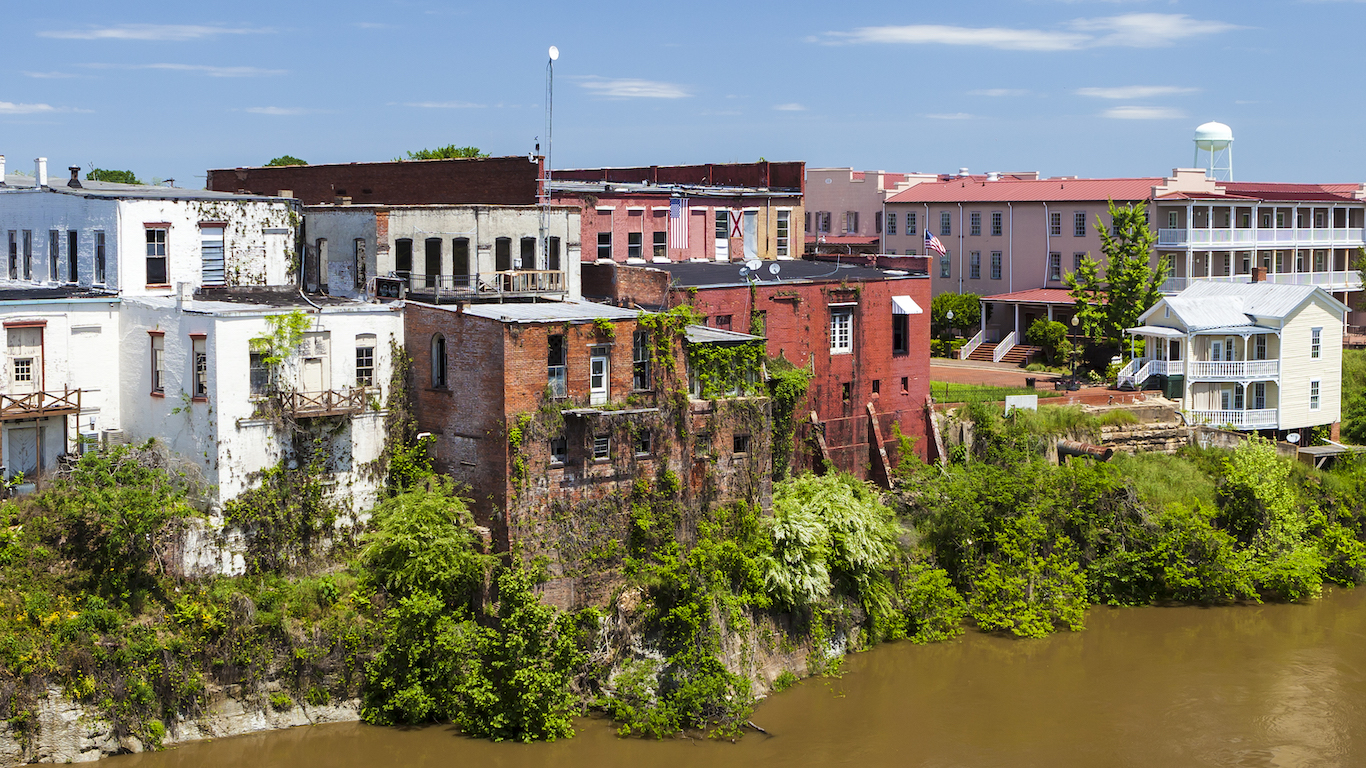
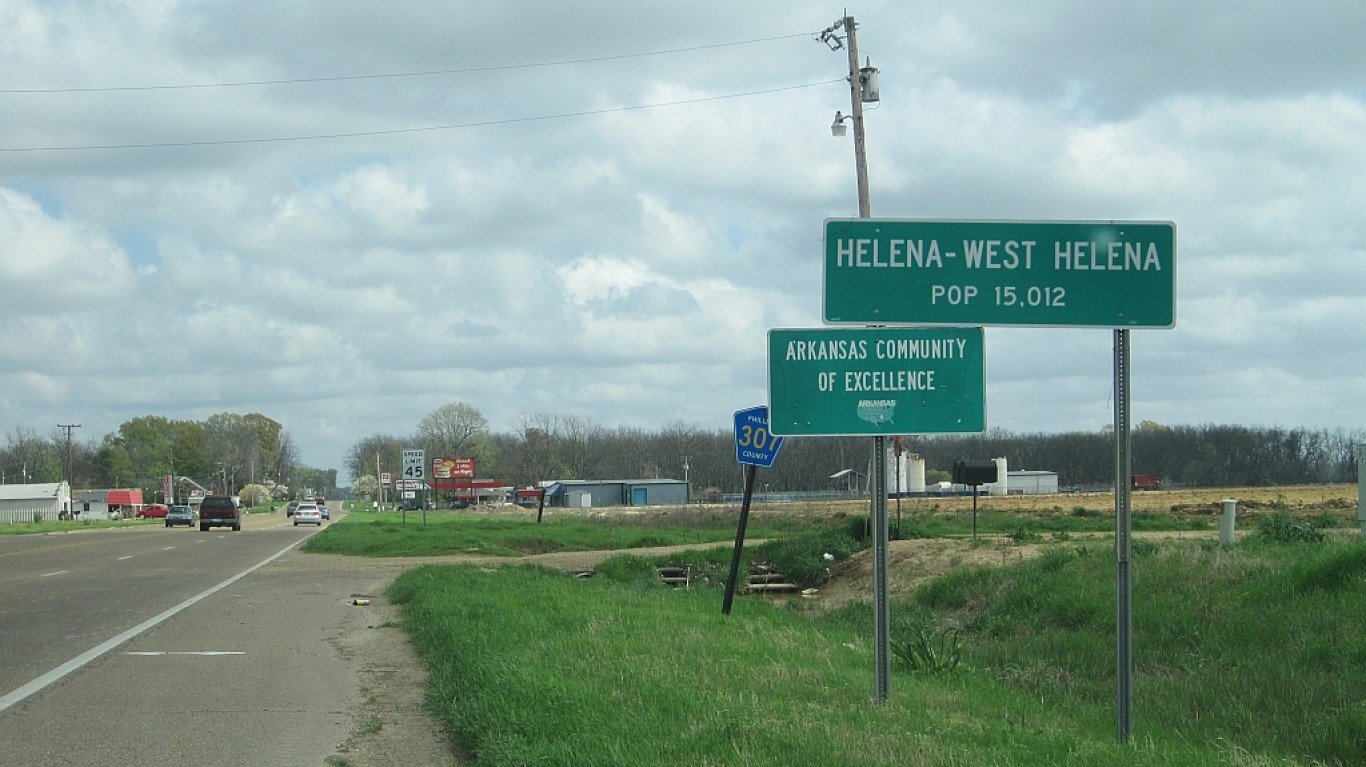
Arkansas: Helena-West Helena
> Population: 11,210
> Median home value: $75,400 (state: $118,500)
> Poverty rate: 42.5% (state: 18.1%)
> Violent crimes per 100,000 people: 1,112 (state: 555)
Crime can detract from the overall quality of life in any city — and Helena-West Helena is relatively dangerous. There were 1,112 violent crimes reported for every 100,000 people in the city in 2017, roughly double the violent crime rate of 555 per 100,000 across Arkansas. The unsafe streets may be pushing people out of the city as Helena lost 8.3% of its population in the last five years.
Joblessness is also a major problem in the city. According to Census estimates, an average of 10.2% of area workers were unemployed over the last five years, more than double the 3.6% state unemployment rate over the same time.
See all stories featuring: Arkansas
[in-text-ad-2]
Source: RichardHarrison / Wikimedia Commons
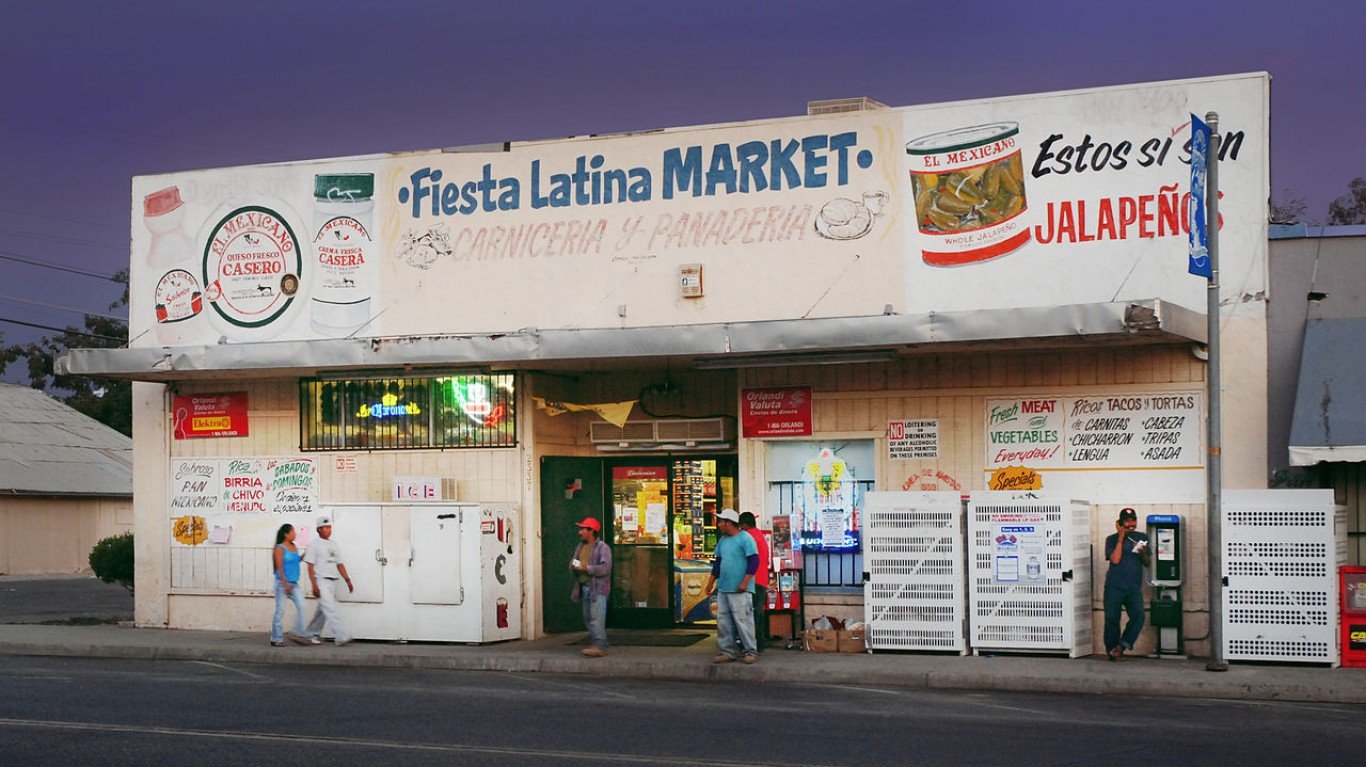
California: Mendota
> Population: 11,396
> Median home value: $139,000 (state: $443,400)
> Poverty rate: 49.5% (state: 15.1%)
> Violent crimes per 100,000 people: 646 (state: 449)
Of the over 500 cities in California considered, Mendota, a small city in the Central Valley, ranks as the worst place to live. Nearly half of all area residents live below the poverty line, more than triple California’s 15.1% poverty rate. Even though homes are relatively inexpensive in Mendota, incomes are so low that the typical home costs over five times what the typical area household earns. For reference, nationwide, the typical home is worth 3.4 times as much as the median annual household income.
For those with disposable income in the area, there is little in the way of entertainment options. The concentration of places like restaurants, bars, museums, and movie theatres in Mendota is far lower than it is nationwide.
See all stories featuring: California
Source: Jeffrey Beall / Wikimedia Commons
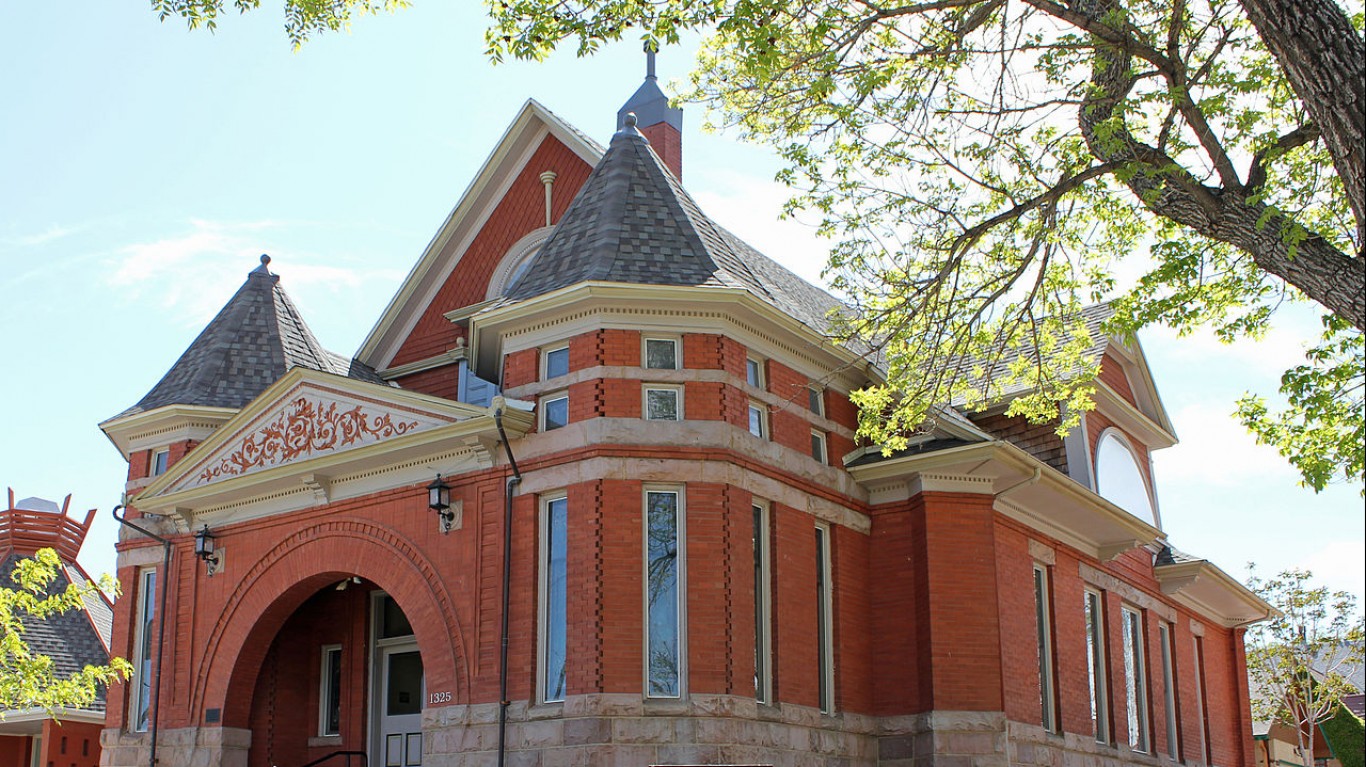
Colorado: Pueblo
> Population: 109,122
> Median home value: $121,200 (state: $286,100)
> Poverty rate: 24.4% (state: 11.5%)
> Violent crimes per 100,000 people: 1,053 (state: 368)
Pueblo, a city located along the I-25 corridor about 100 miles south of Denver, ranks as the worst city to live in in Colorado. Nearly one in every four Pueblo residents live below the poverty line, more than double the state poverty rate of 11.5%. Crime is often concentrated in lower-income areas, and Pueblo is a relatively dangerous city. There were 1,053 violent crimes for every 100,000 people in Pueblo in 2017, nearly triple the state violent crime rate of 368 per 100,000.
Close proximity to grocery stores and healthy food can be critical to quality of life in any city, and in Pueblo, 43.6% of the population struggles to put food on the table because of the low access to grocery stores, well above the national food insecurity rate of 22.4%.
See all stories featuring: Colorado
[in-text-ad]
Source: DenisTangneyJr / Getty Images
Connecticut: Bridgeport
> Population: 147,586
> Median home value: $170,300 (state: $270,100)
> Poverty rate: 20.8% (state: 10.1%)
> Violent crimes per 100,000 people: 900 (state: 228)
More than 20% of the population of Bridgeport, Connecticut, lives below the poverty line, more than double the 10.1% state poverty rate. The widespread financial hardship is partially attributable to a weak job market. The Census estimates that an average of 9.3% of the labor force in Bridgeport was unemployed over the last five years, well above Connecticut’s 4.8% average unemployment rate over that time.
Bridgeport residents — even those living below the poverty line — face additional financial strain due to the city’s high cost of living. Goods and services are 30.8% more expensive in Bridgeport than they are nationwide.
See all stories featuring: Connecticut
 24/7 Wall St.
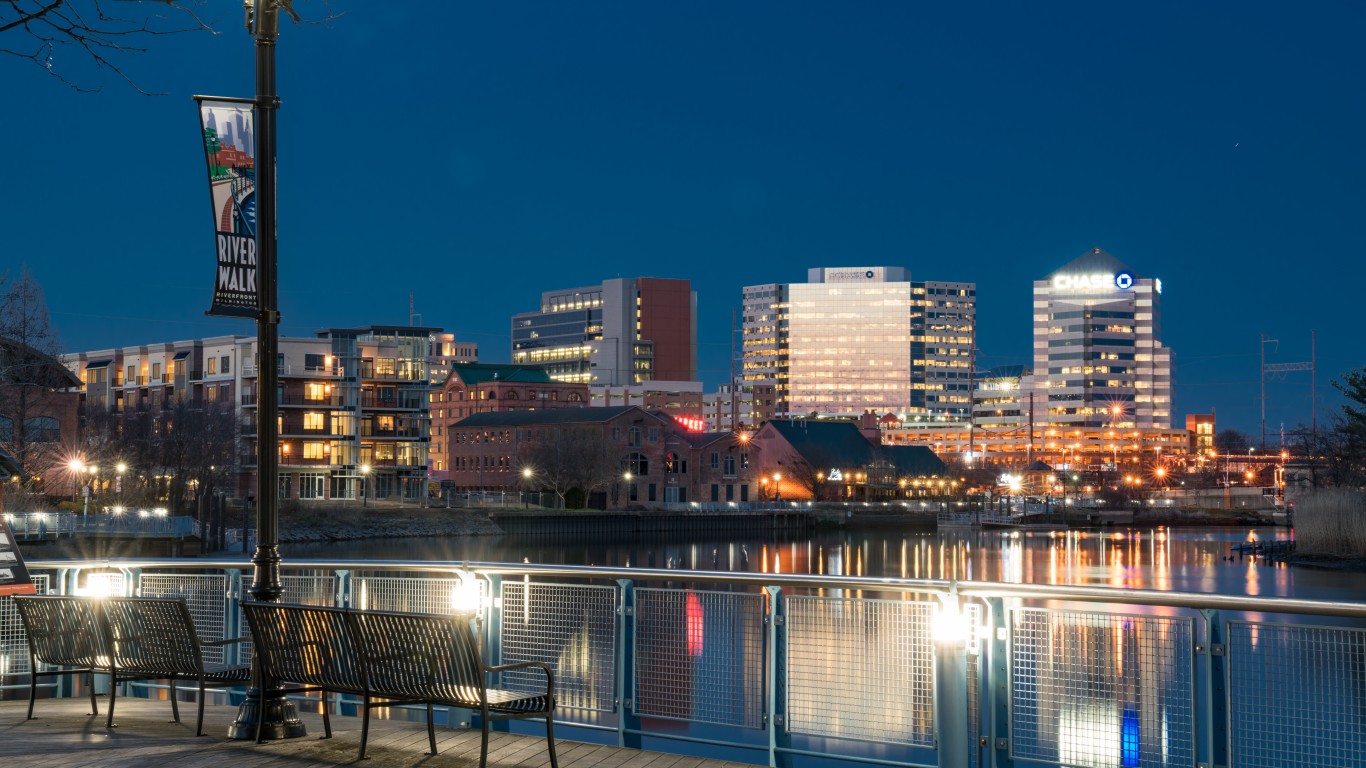
Source: pabradyphoto / Getty Images
Delaware: Wilmington
> Population: 71,276
> Median home value: $165,300 (state: $238,600)
> Poverty rate: 27.0% (state: 12.1%)
> Violent crimes per 100,000 people: 1,596 (state: 453)
Wilmington, Delaware’s largest city, also ranks as the state’s worst city to live in. Crime can be detrimental to the quality of life in any city, and Wilmington is far and away the most dangerous city in Delaware. There were 1,596 violent crimes for every 100,000 people in Wilmington in 2017, more than triple the statewide violent crime rate of 453 incidents per 100,000 people.
The city’s median household income of $40,221 a year is well below the state and national medians of $63,036 and $57,652, respectively. And after adjusting for the city’s high cost of living, the buying power of the typical Wilmington household is actually just $34,348.
See all stories featuring: Delaware
Source: Ebyabe / Wikimedia Commons
Florida: Florida City
> Population: 12,149
> Median home value: $110,800 (state: $178,700)
> Poverty rate: 41.2% (state: 15.5%)
> Violent crimes per 100,000 people: 2,276 (state: 408)
Florida City is a small city of less than 13,000 about 35 miles south of Miami. The worst city to live in in the state, Florida City’s unemployment rate of 13.8% is more than triple the 4.2% state unemployment rate. Crime can stifle economic growth in any city, and Florida City has a violent crime rate of 2,276 incidents per 100,000 people, putting it securely in the top 10% most dangerous American cities.
Likely due in part to the city’s high unemployment rate, many residents are struggling financially. Florida City’s 41.2% poverty rate is higher than in over 90% of all American cities.
See all stories featuring: Florida
[in-text-ad-2]
Source: Thomson200 / Wikimedia Commons
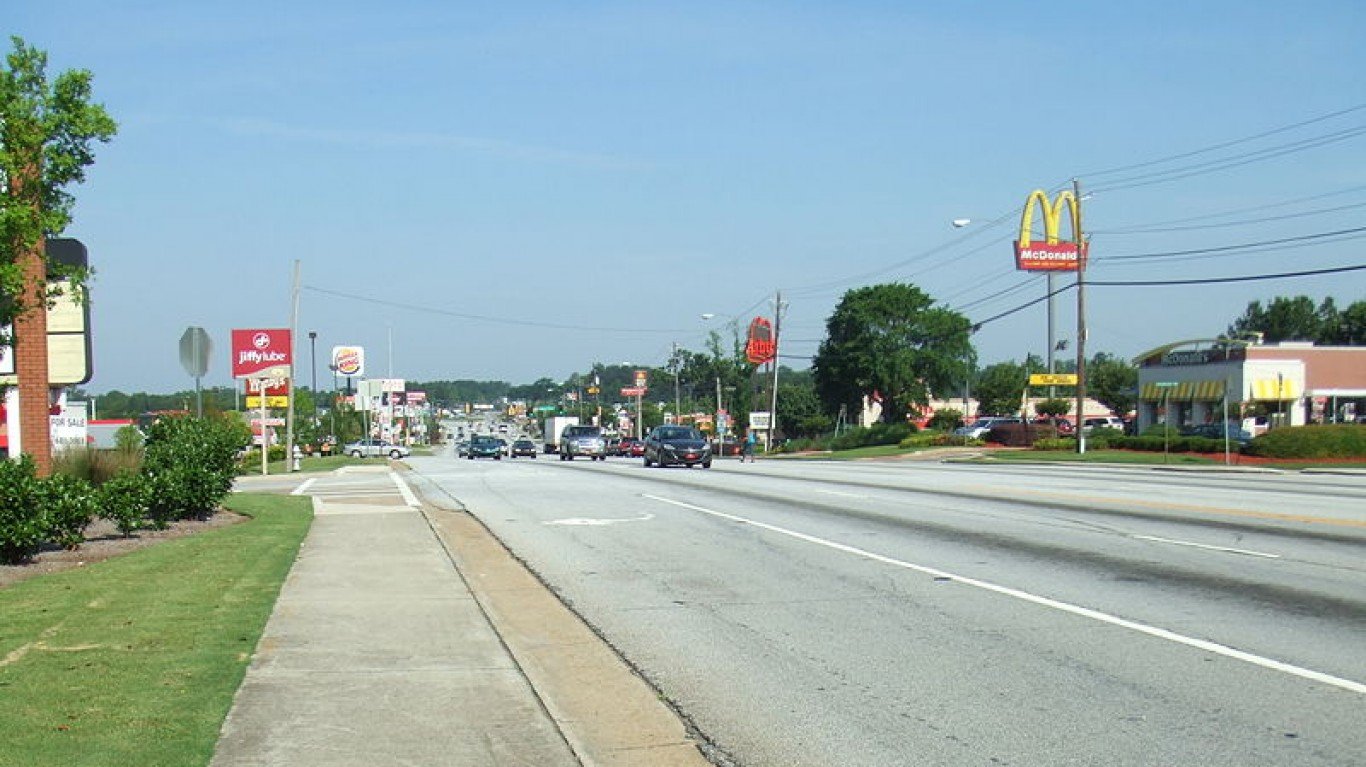
Georgia: Union City
> Population: 20,793
> Median home value: $81,900 (state: $158,400)
> Poverty rate: 20.7% (state: 16.9%)
> Violent crimes per 100,000 people: 1,224 (state: 357)
According to Census estimates, 7.4% of workers in Union City, Georgia, are unemployed, compared to a 4.7% unemployment rate statewide. While much of the country has been adding jobs in recent years, Union City has been shedding them. Total employment fell by 1.2% in Union City in the last five years.
Crime can stifle economic development and investment, and Union City is one of the most dangerous cities in the United States. There were 1,224 violent crimes for every 100,000 people in the city in 2017 compared to 357 per 100,000 across the state as a whole. Property crimes like larceny and motor vehicle theft are also common in the city. There were 10,940 property crimes for every 100,000 Union City residents in 2017, compared to 2,860 per 100,000 across the state as a whole.
See all stories featuring: Georgia

Source: josiahrock / Getty Images
Hawaii: Makaha
> Population: 8,832
> Median home value: $407,200 (state: $563,900)
> Poverty rate: 30.1% (state: 10.3%)
> Violent crimes per 100,000 people: N/A (state: 251)
Hawaii has the highest cost of living of any state in the country — and Makaha ranks as the worst city to live in in Hawaii largely because of its unaffordability. Makaha is the poorest city in Hawaii with over 30% of residents living below the poverty line, more than double the 14.6% national poverty rate. At the same time, the typical home in Makaha is worth $407,200, more than double the $193,500 national median home value. The typical home in the city is worth 7.9 times as much as the median annual household income. Nationwide, the typical home is worth 3.4 times as much as the median annual income.
See all stories featuring: Hawaii
[in-text-ad]

Source: Bret-Barton / Getty Images
Idaho: Rexburg
> Population: 27,369
> Median home value: $184,200 (state: $176,800)
> Poverty rate: 41.6% (state: 14.5%)
> Violent crimes per 100,000 people: 38 (state: 226)
Housing affordability is a major obstacle to quality of life for many in Rexburg, Idaho. The typical area home is worth about seven times as much as the median annual household income of just $26,341. Nationwide, the median home value is just 3.4 times higher than the median annual household income. Low incomes in Rexburg are highlighted by the city’s 41.6% poverty rate, which is higher than in more than 90% of all American cities.
The area’s low incomes are partially the product of a weak job market. The Census estimates that 6.8% of workers in Rexburg are unemployed, more than double the 3.3% unemployment rate across Idaho.
See all stories featuring: Idaho
Source: Mark Schierbecker / Wikimedia Commons
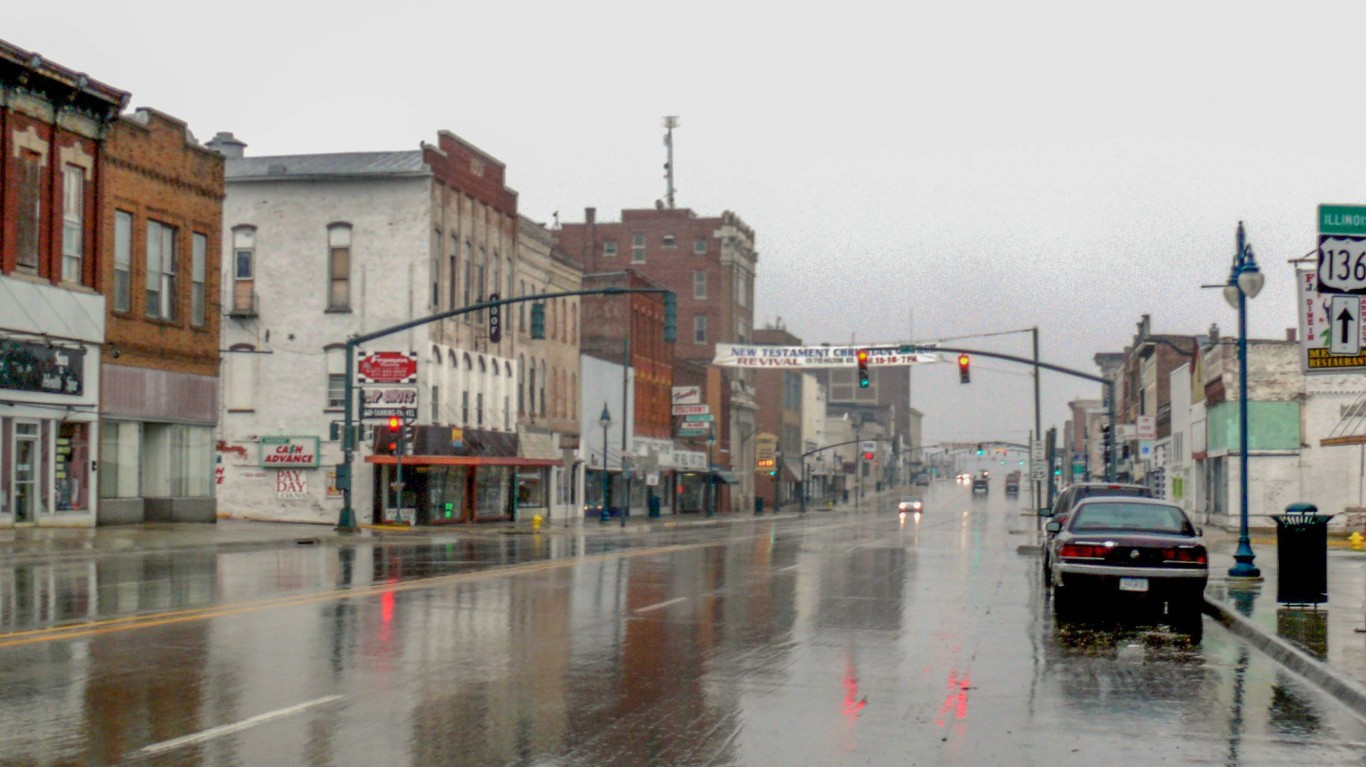
Illinois: East St. Louis
> Population: 26,678
> Median home value: $55,000 (state: $179,700)
> Poverty rate: 43.1% (state: 13.5%)
> Violent crimes per 100,000 people: 2,752 (state: 439)
East St. Louis is one of the most dangerous cities in the United States. There were 2,752 violent crimes for every 100,000 people in the city in 2017, more than five times the statewide violent crime rate of 439 per 100,000. Crime is often concentrated in poorer areas, and in East St. Louis, 43.1% of the population lives below the poverty line. Crime can also have a stifling effect on commerce and in East St. Louis, the unemployment rate stands at 8.3%, well above the 4.8% state rate.
See all stories featuring: Illinois
Source: Lotzman Katzman / Wikimedia Commons
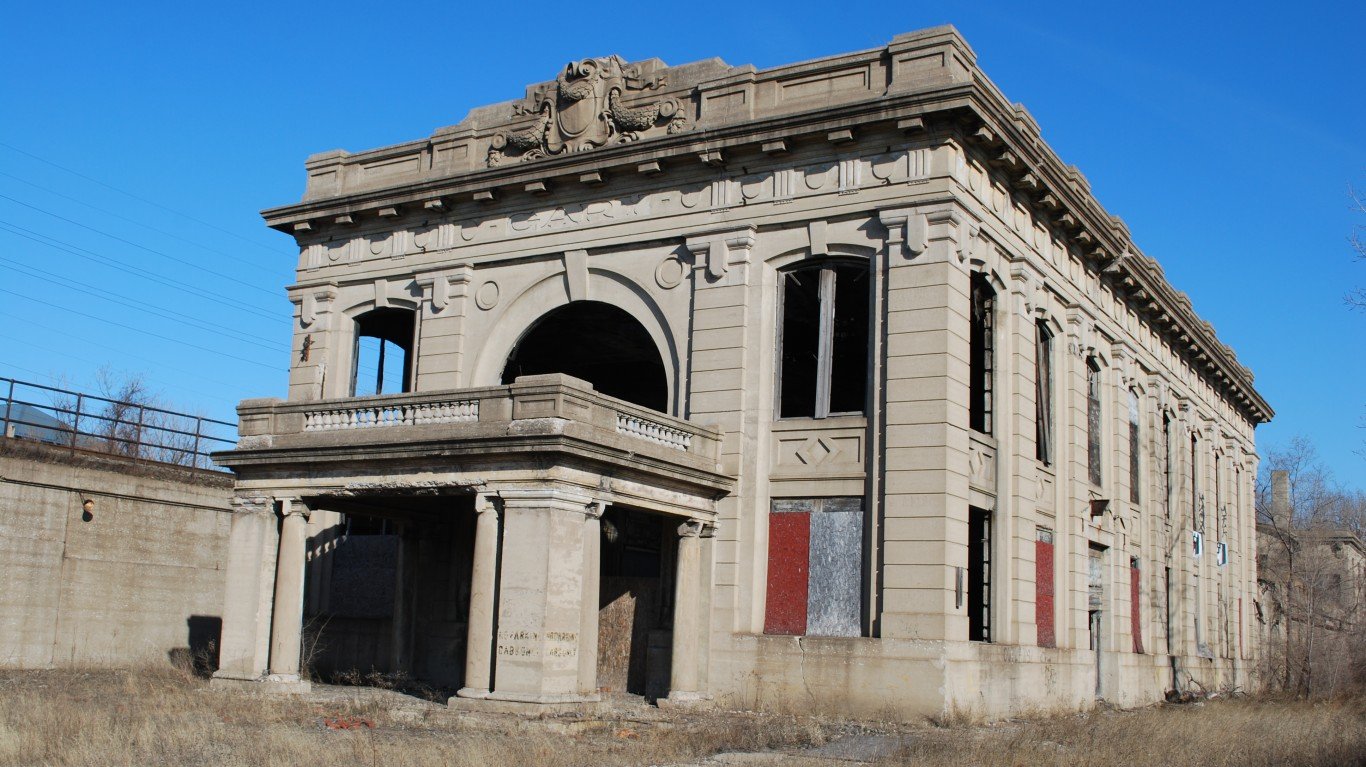
Indiana: Gary
> Population: 77,416
> Median home value: $66,300 (state: $130,200)
> Poverty rate: 35.8% (state: 14.6%)
> Violent crimes per 100,000 people: 621 (state: 399)
More than one in every three residents of Gary, Indiana, live below the poverty line, more than double the 14.6% state poverty rate. Crime tends to be more concentrated in poorer areas, and Gary’s violent crime rate of 621 incidents per 100,000 people is higher than at least 25% of all American cities. The area’s low incomes are due in part to a high jobless rate. The Census estimates that 8.0% of Gary’s labor force are out of work, more than double the 3.9% state unemployment rate.
See all stories featuring: Indiana
[in-text-ad-2]
Source: davidwilson1949 / Flickr
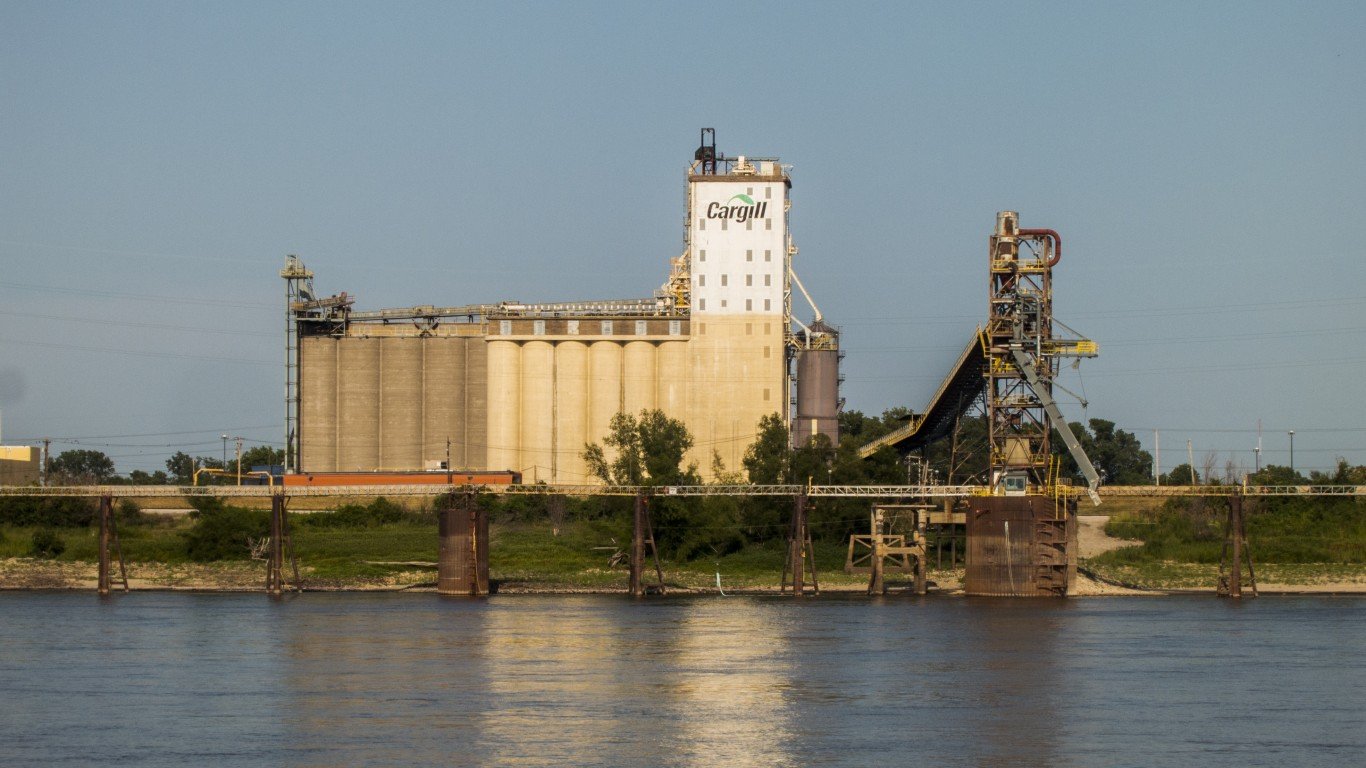
Iowa: Keokuk
> Population: 10,484
> Median home value: $67,400 (state: $137,200)
> Poverty rate: 25.4% (state: 12.0%)
> Violent crimes per 100,000 people: 867 (state: 293)
As is the case in many of the cities on this list, Keokuk’s population is shrinking. In the last five years, the number of people living in Keokuk fell by 2.5%. Reduced demand for housing has likely dragged down real estate values. The typical home in Keokuk is worth just $67,400, less than half the median home value of $137,200 statewide
Home values are often a reflection of what area residents can afford, and many in Keokuk are struggling financially. More than one in every four area residents live below the poverty line, compared to a 12% poverty rate across the state as a whole.
See all stories featuring: Iowa
Source: Jeffrey Beall / Wikimedia Commons
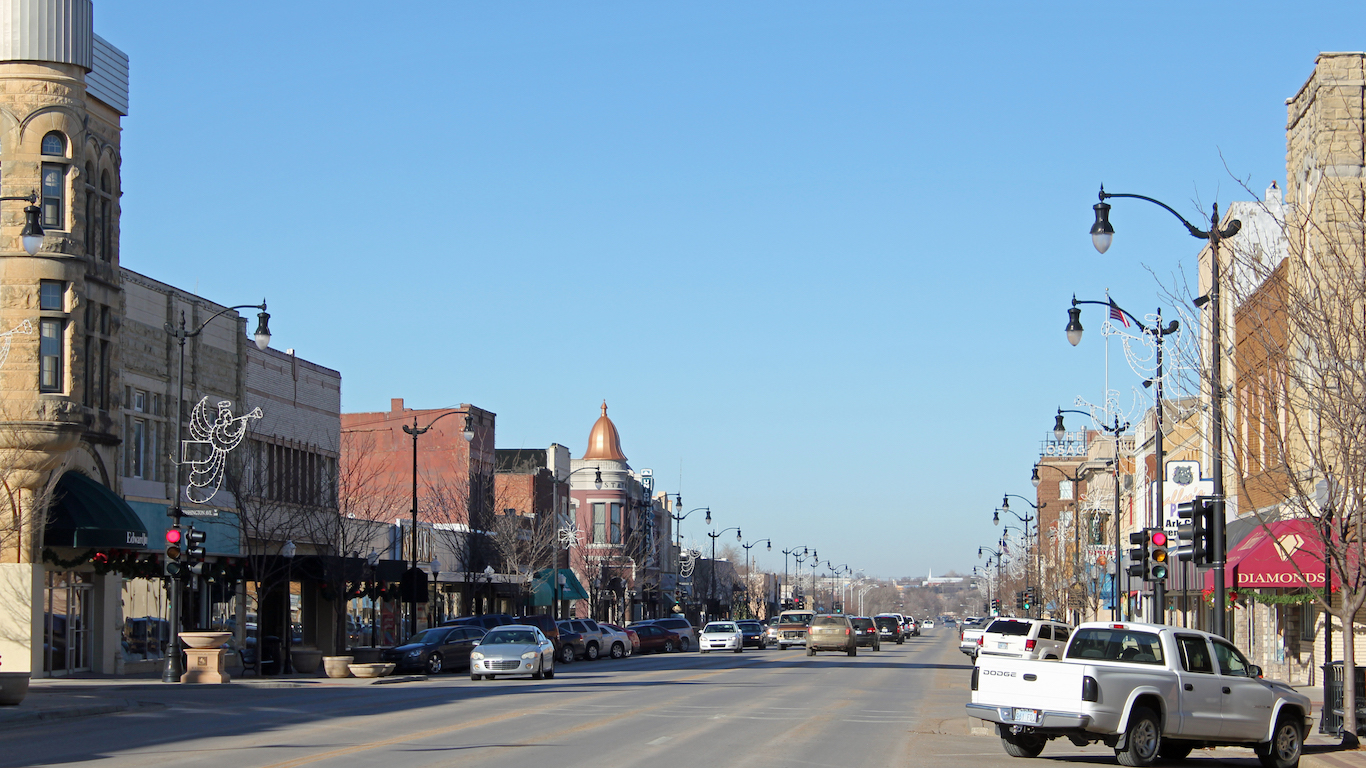
Kansas: Arkansas City
> Population: 12,055
> Median home value: $69,400 (state: $139,200)
> Poverty rate: 20.5% (state: 12.8%)
> Violent crimes per 100,000 people: 525 (state: 413)
Arkansas City is a small city in southern Kansas just north of the Oklahoma state border. Many of the most desirable American cities to live in are reporting booming populations and high real estate values. Meanwhile, as the worst city to live in in Kansas, Arkansas City has lost 2.4% of its population over the last five years, and the typical home in the area is worth just $69,400, less than the median home value in over 90% of U.S. cities.
A relatively large share of people living in Arkansas City are struggling financially. More than one in every five area residents live below the poverty line, compared to 12.8% Kansas residents.
See all stories featuring: Kansas
[in-text-ad]
Source: BOB WESTON / Getty Images
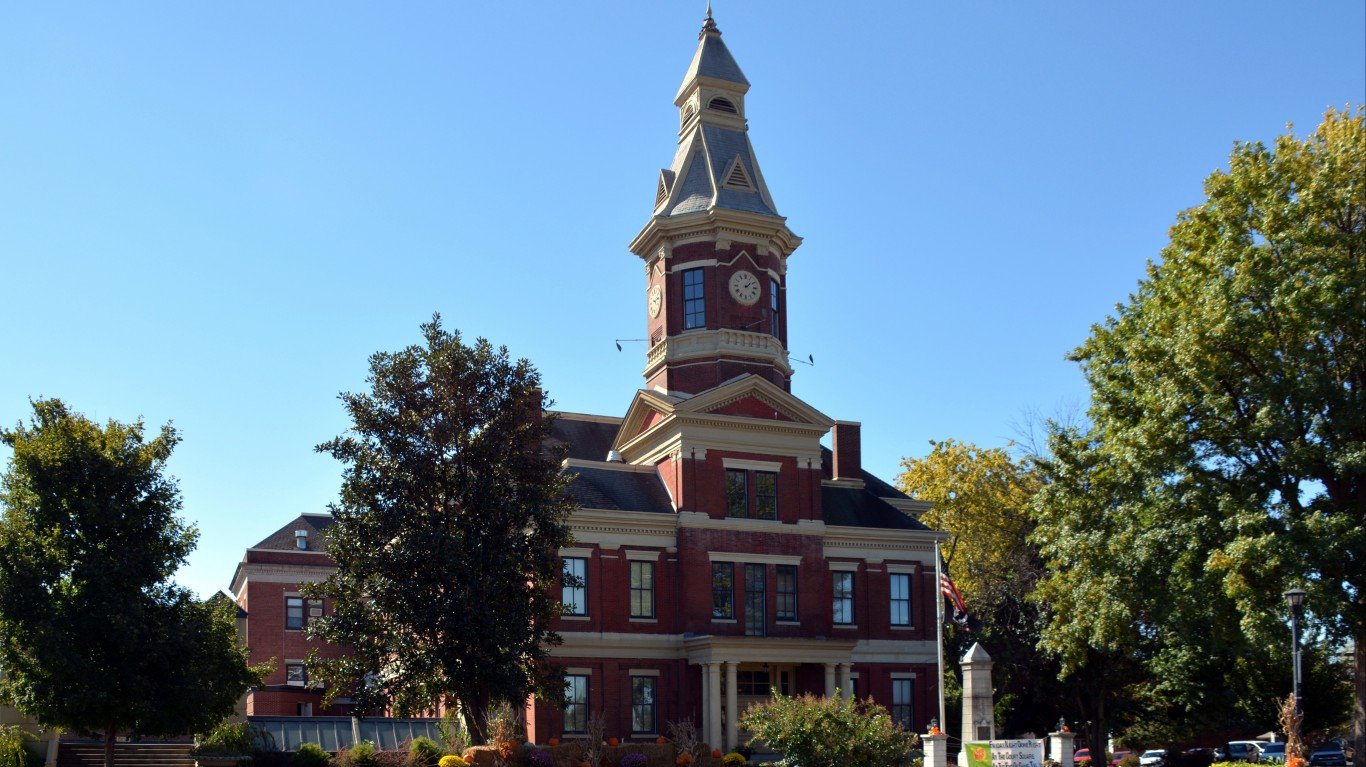
Kentucky: Mayfield
> Population: 9,936
> Median home value: $89,300 (state: $130,000)
> Poverty rate: 30.2% (state: 18.3%)
> Violent crimes per 100,000 people: 390 (state: 226)
A high incidence rate of property crime like burglary and motor vehicle theft can detract considerably from quality of life in any city. In Mayfield, Kentucky, there were 5,385 property crimes for every 100,000 people in 2017, more than double the state and national property crime rates.
Widespread joblessness is also a problem in Mayfield. The Census estimates that 8.9% of the city’s workforce is unemployed, compared to the 4.0% state unemployment rate. The lack of jobs may partially explain low incomes. The typical household in Mayfield earns just $25,910 a year, well below the median annual household income across the state of $46,535.
See all stories featuring: Kentucky
Source: Billy Hathorn / Wikimedia Commons
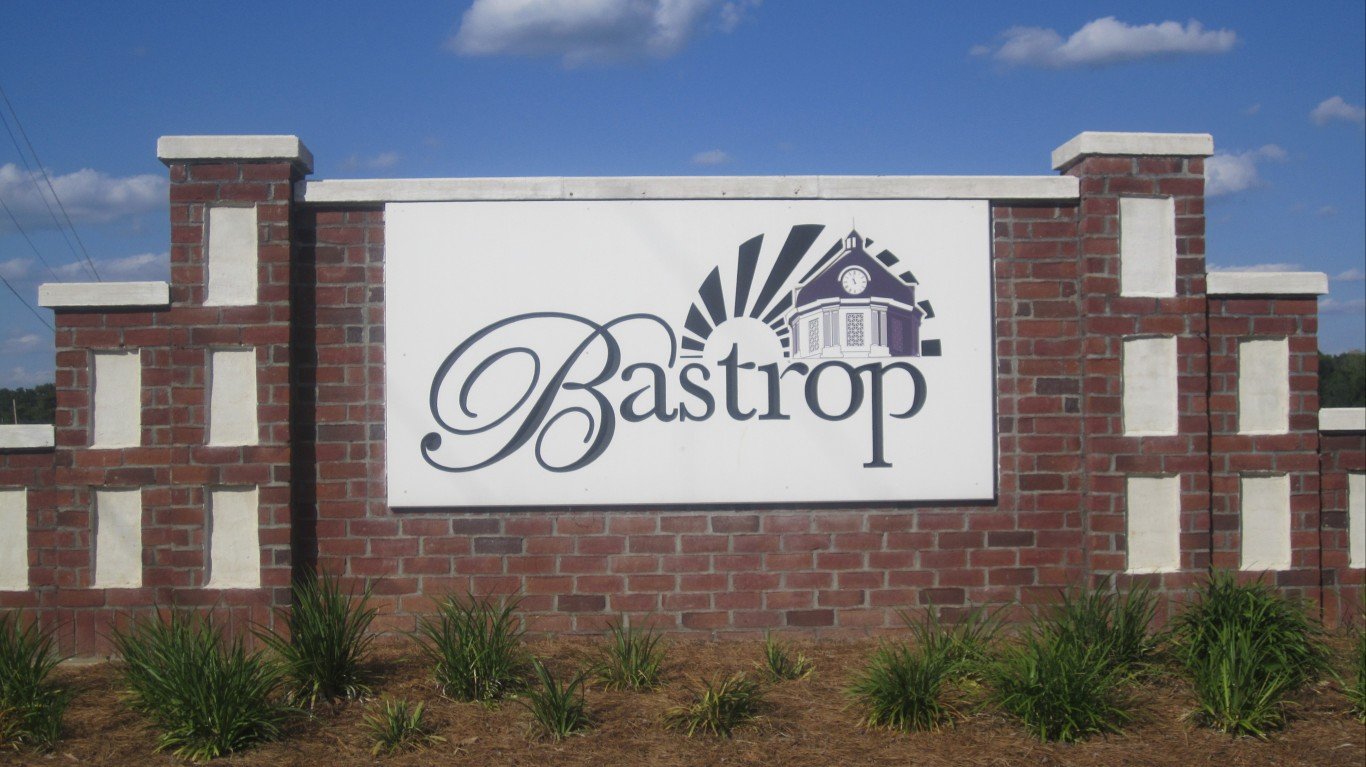
Louisiana: Bastrop
> Population: 10,643
> Median home value: $73,000 (state: $152,900)
> Poverty rate: 43.5% (state: 19.6%)
> Violent crimes per 100,000 people: 1,511 (state: 557)
With a violent crime rate of 557 incidence per 100,000 people, Louisiana is one of the most dangerous states in the country. In Bastrop, a small city in the northern part of the state, crime is even more concentrated. There were 1,511 violent crimes for every 100,000 people in the city in 2017. Crime is often concentrated in lower-income areas, and in Bastrop, 43.5% of the population lives below the poverty line, compared to the state’s 19.6% poverty rate.
In any city, job growth is a positive economic indicator that can have far reaching social and economic benefits. Bastrop, however, has been shedding jobs in recent years. Over the last five years, the number of people working in the city fell by 6.9%.
See all stories featuring: Louisiana
Source: sshepard / Getty Images
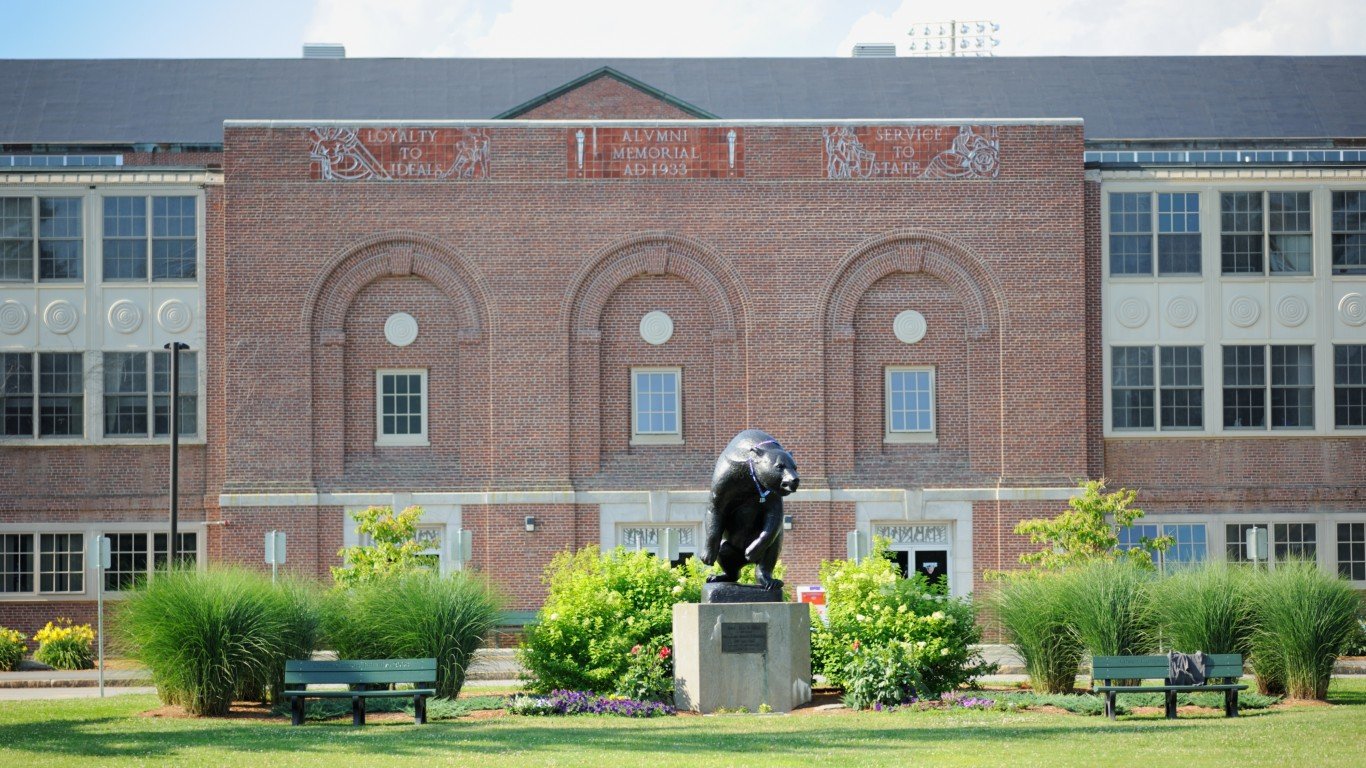
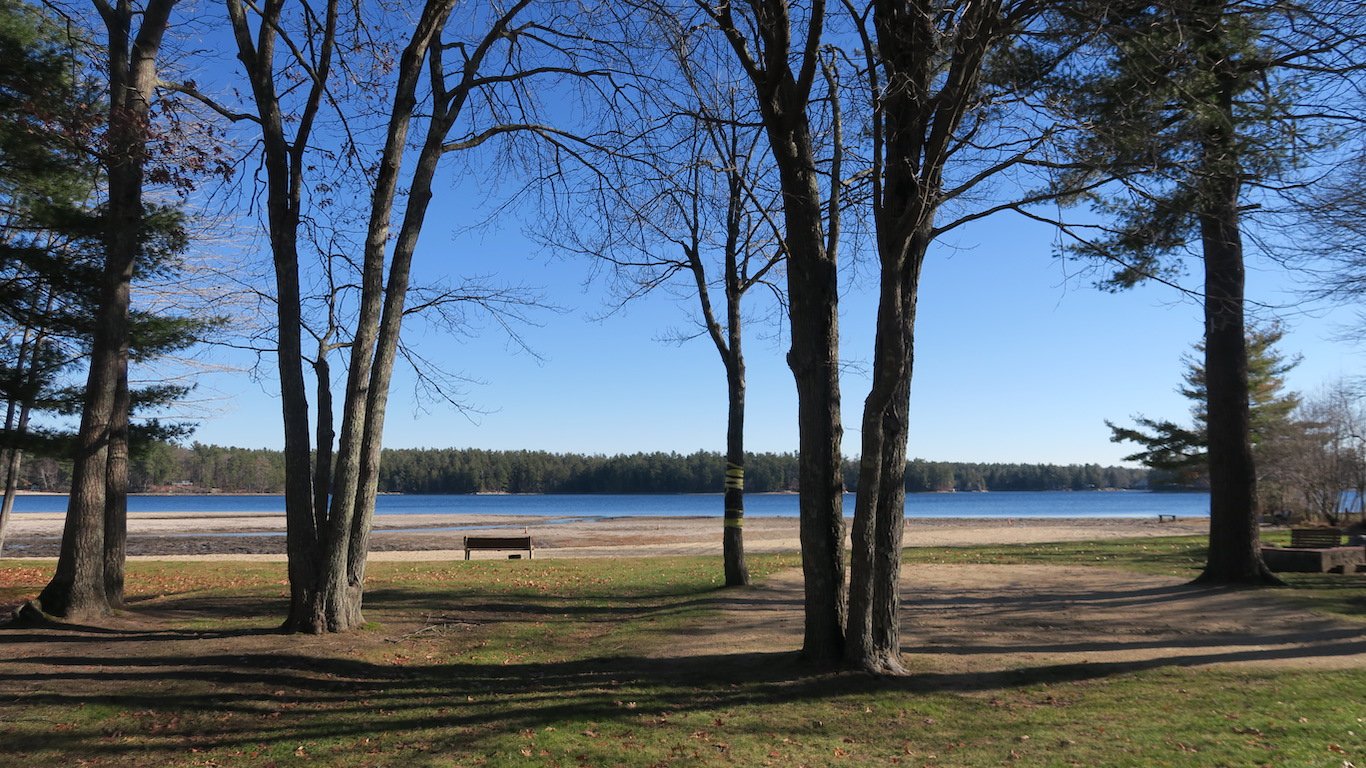
Maine: Orono
> Population: 9,667
> Median home value: $183,600 (state: $179,900)
> Poverty rate: 37.5% (state: 12.9%)
> Violent crimes per 100,000 people: 79 (state: 121)
With a poverty rate of 37.5%, Orono is by far the poorest city in Maine. The widespread financial hardship is likely due in part to the weak job market. Over the last five years, employment in Orono has fallen by 4.2%. The Census estimates that 6.0% of the labor force in Orono is out of a job, well above the 3.3% state unemployment rate.
Orono residents also do not have much in the way of culture and entertainment options. There is a far lower concentration of places like bars, restaurants, and museums in the city than there are nationwide.
See all stories featuring: Maine
[in-text-ad-2]
Source: BrianEKushner / Getty Images
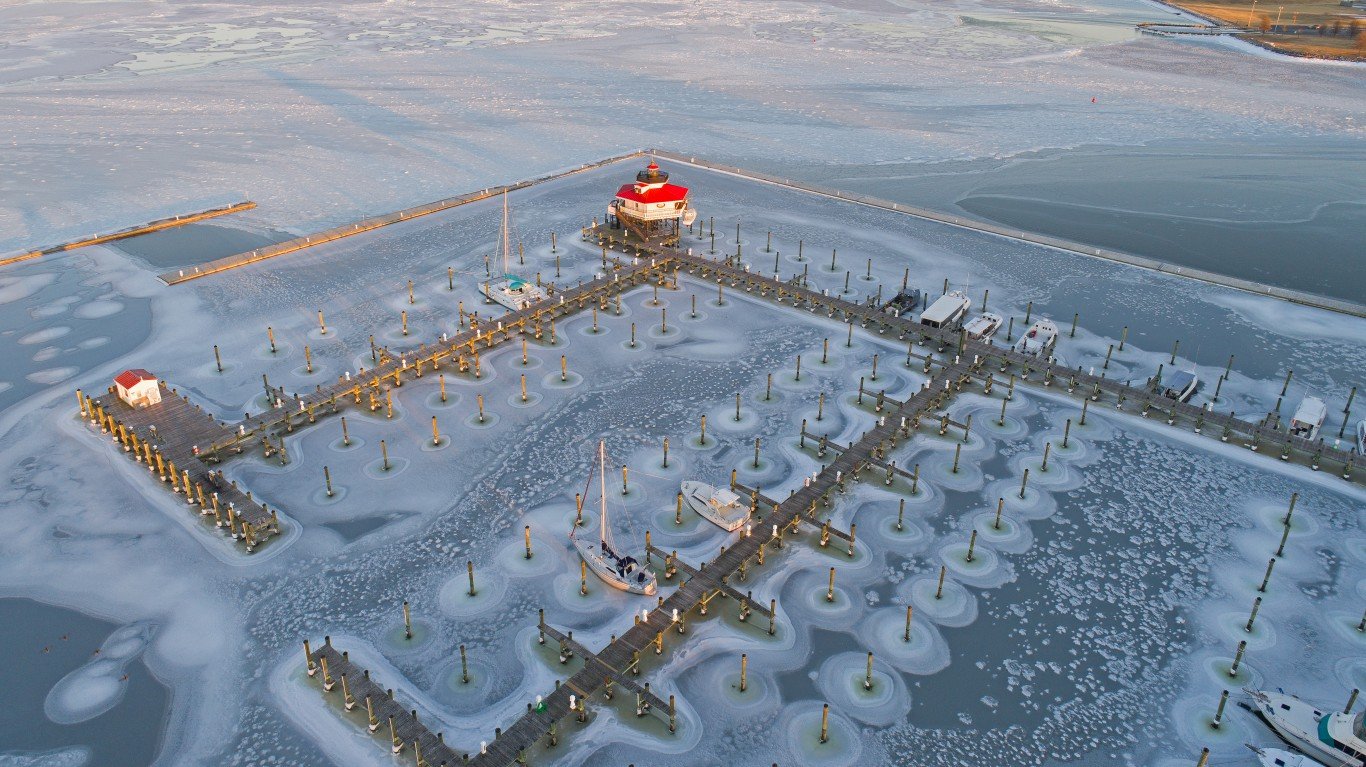
Maryland: Cambridge
> Population: 12,484
> Median home value: $153,900 (state: $296,500)
> Poverty rate: 24.8% (state: 9.7%)
> Violent crimes per 100,000 people: 1,299 (state: 500)
Maryland is the wealthiest state in the country by median income, but not all parts of the state are equally prosperous. In Cambridge, a small city in the Delmarva Peninsula, about one in every four residents live below the poverty line, more than double the 9.7% poverty rate across Maryland. The city’s relatively high cost of living adds to the financial burden of Cambridge’s poorest residents as goods and services there are about 5% more expensive than they are nationwide on average.
Crime can detract from the quality of life in any city, and in Cambridge, violent crimes like robbery an aggravated assault are relatively common. There were 1,299 violent crimes for every 100,000 people in Cambridge in 2017, well above the comparable state rate of 500 per 100,000.
See all stories featuring: Maryland
Source: DenisTangneyJr / Getty Images
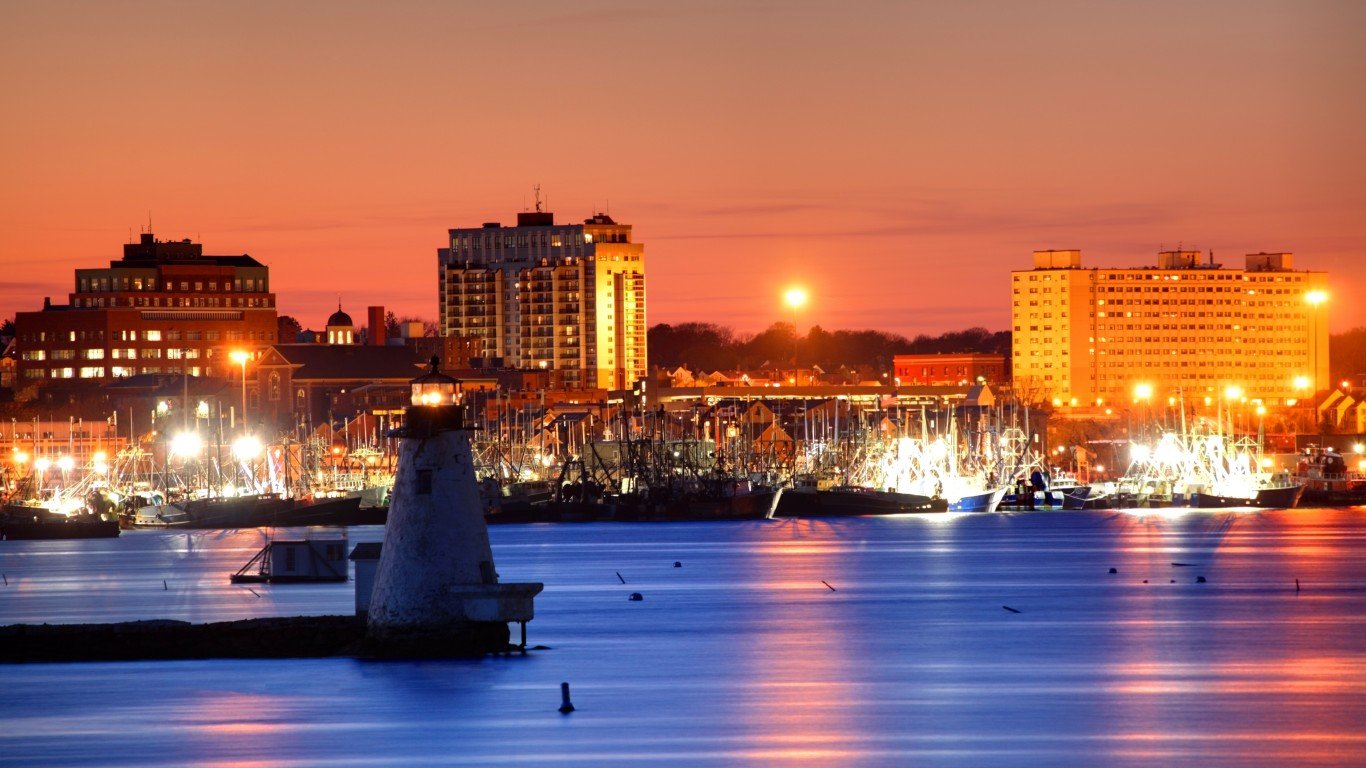
Massachusetts: New Bedford
> Population: 95,125
> Median home value: $211,500 (state: $352,600)
> Poverty rate: 23.1% (state: 11.1%)
> Violent crimes per 100,000 people: 666 (state: 358)
The typical household in New Bedford earns just $40,626 annually, well below the national median household median of $57,652. At the same time, the typical New Bedford home is worth $211,500, more than the national median home value of $193,500. Not only is housing less affordable in New Bedford, but so is the overall cost of living. Average prices of goods and services are nearly 19% higher in the city than they are nationwide. The high cost of living puts added financial pressure on residents, particularly the 23.1% of the population who lives below the poverty line. Across Massachusetts, just 11.1% of the population lives below the poverty line.
See all stories featuring: Massachusetts
[in-text-ad]
Source: jferrer / Getty Images
Michigan: Highland Park
> Population: 10,955
> Median home value: $33,500 (state: $136,400)
> Poverty rate: 49.0% (state: 15.6%)
> Violent crimes per 100,000 people: 1,701 (state: 450)
Highland Park is a small city less than 10 miles from downtown Detroit. Like its larger neighbor, Highland Park has suffered for decades from the decline of the region’s auto manufacturing industry. Nearly half of the city’s residents live below the poverty line. The area’s low incomes are reflected in the depressed real estate values. The typical home in Highland Park is worth just $33,500, over $100,000 less than the typical Michigan home.
Crime is also a problem in Highland Park. There were 1,701 violent crimes for every 100,000 people in the city in 2017, more than in over 90% of all American cities.
See all stories featuring: Michigan
Source: Gian Lorenzo Ferretti Photography / Getty Images
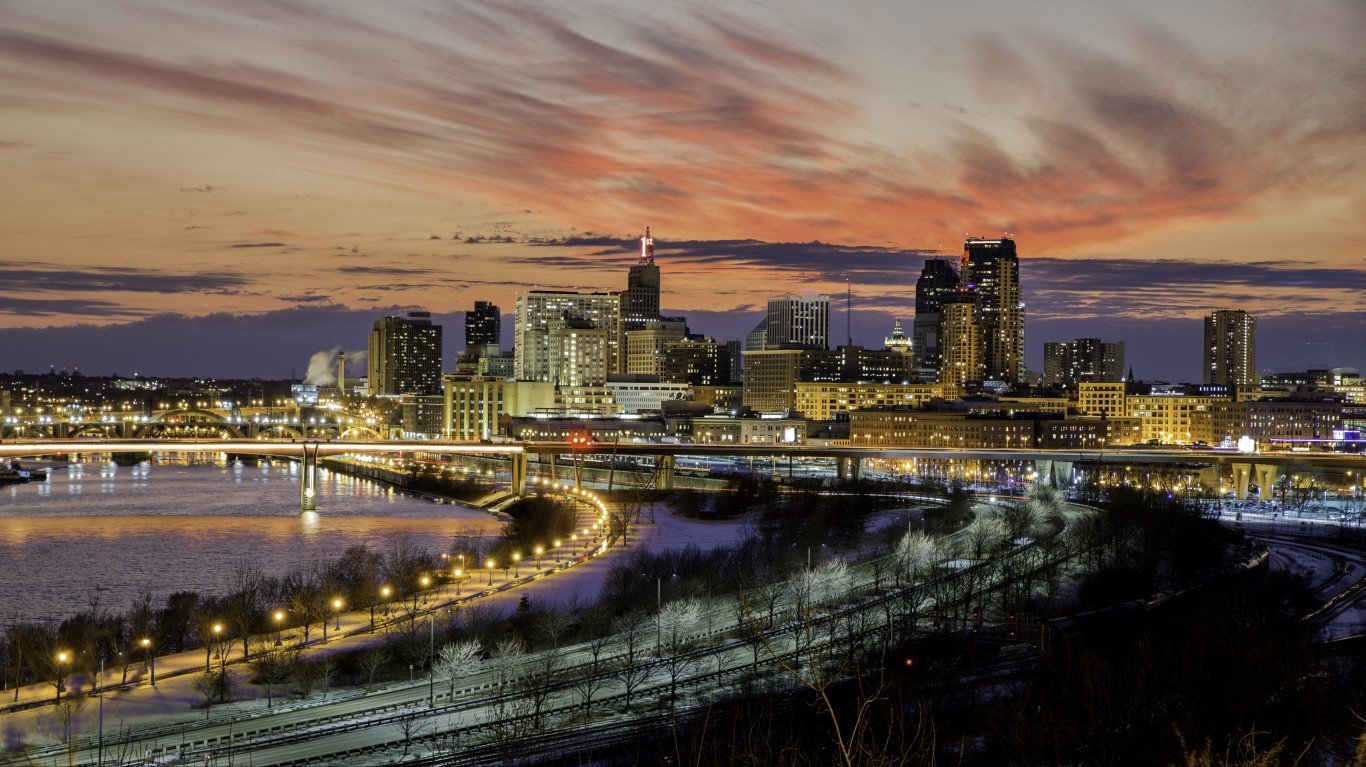
Minnesota: St. Paul
> Population: 300,820
> Median home value: $187,400 (state: $199,700)
> Poverty rate: 20.4% (state: 10.5%)
> Violent crimes per 100,000 people: 651 (state: 238)
Crime, especially violent crime like robbery and homicide, can greatly detract from quality of life in any city. In St. Paul, there were 651 violent crimes for every 100,000 people, more than double the violent crime rate of 238 incidents per 100,000 people across Minnesota as a whole.
Crime is often concentrated in poor areas, and in St. Paul 20.4% of the population lives below the poverty line, nearly double the 10.5% state poverty rate.
See all stories featuring: Minnesota
Source: Public Domain / Wikimedia Commons
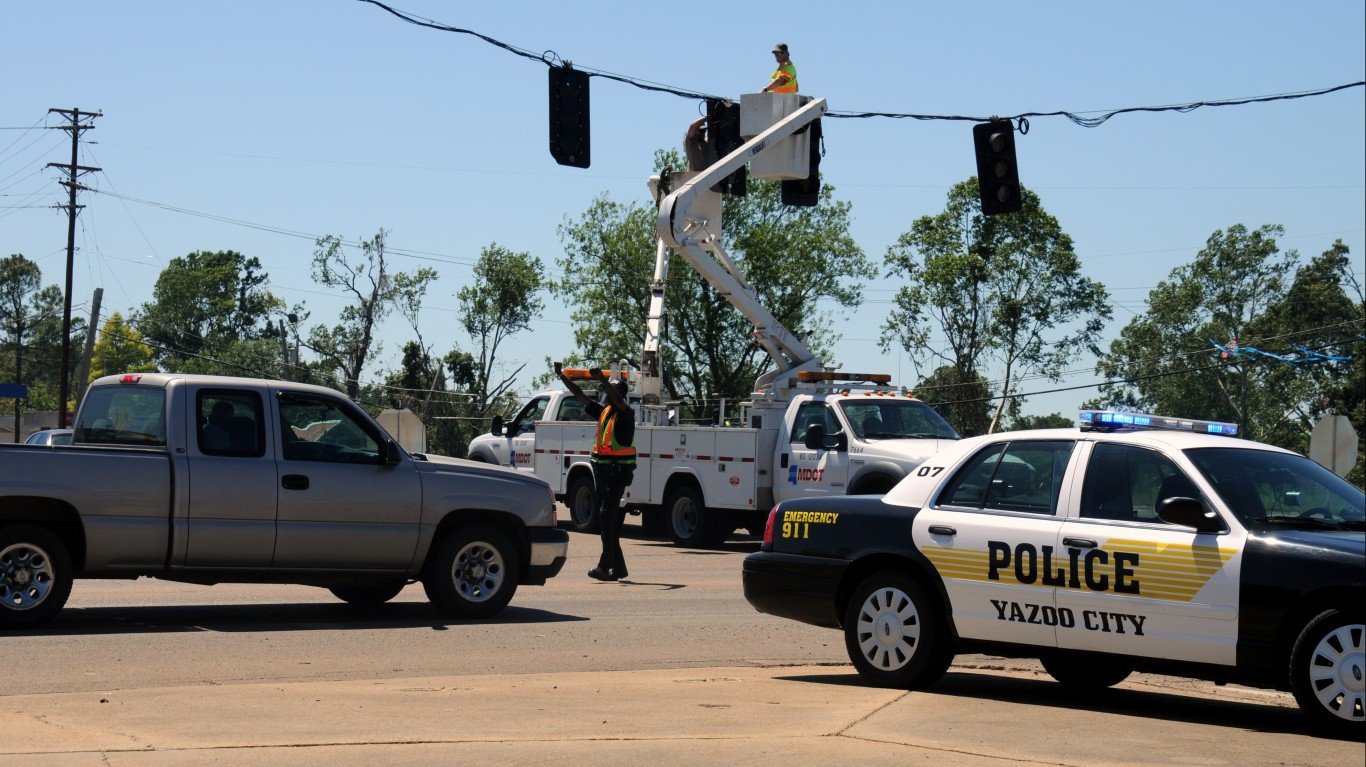
Mississippi: Yazoo City
> Population: 11,189
> Median home value: $72,700 (state: $109,300)
> Poverty rate: 49.0% (state: 21.5%)
> Violent crimes per 100,000 people: N/A (state: 286)
With a poverty rate of 21.5%, Mississippi is the poorest state in the country. Still, the statewide poverty rate is preferable to the poverty rate of 49.0% in Yazoo City, the worst city to live in in the state. The widespread financial hardship is likely partially attributable to the area’s high joblessness. The unemployment rate in Yazoo City stands at 11.8%, more than double the 5.0% state unemployment rate.
Like many cities with similarly bleak economic conditions, Yazoo City is shrinking. The city’s population declined by 2.9% over the last five years.
See all stories featuring: Mississippi
[in-text-ad-2]
Source: DenisTangneyJr / Getty Images
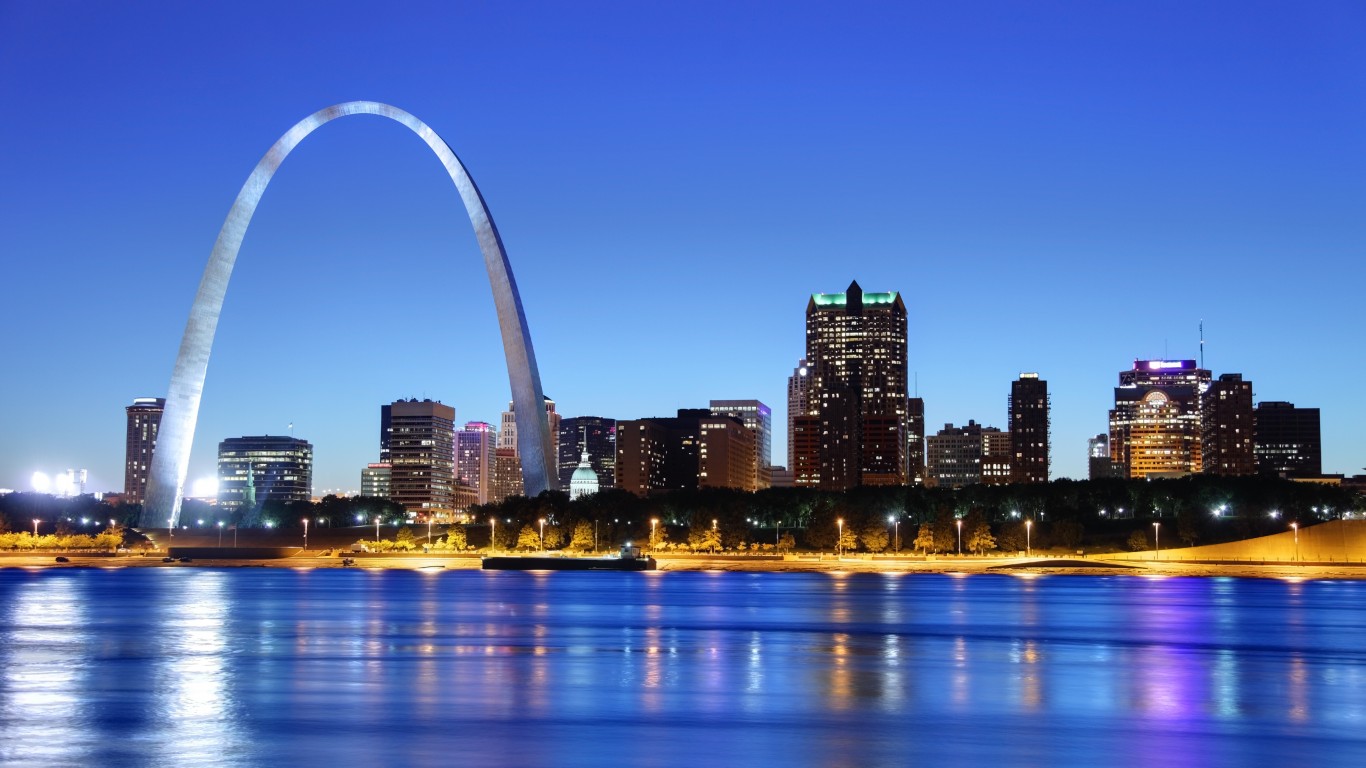
Missouri: St. Louis
> Population: 314,867
> Median home value: $123,800 (state: $145,400)
> Poverty rate: 25.0% (state: 14.6%)
> Violent crimes per 100,000 people: 2,082 (state: 530)
St. Louis is the most dangerous city in Missouri and one of the most dangerous in the United States. There were 2,082 violent crimes for every 100,000 people in St. Louis in 2017, compared to 530 per 100,000 across Missouri and 383 per 100,000 nationwide. Low incomes also detract from quality of life in St. Louis. The typical household in the city earns just $38,664 a year, well below the median household income of $51,542 across the state as a whole.
Most large American cities have grown in recent years. But St. Louis, the worst city to live in in Missouri, is not one of them. Of all the 64 U.S. cities home to 300,000 people or more, only five — including St. Louis — are smaller now than they were five years ago. Since 2012, St. Louis’s population declined by 1.1%, even as the U.S. population grew by 3.8% over the same period.
See all stories featuring: Missouri
Source: diversey / Flickr
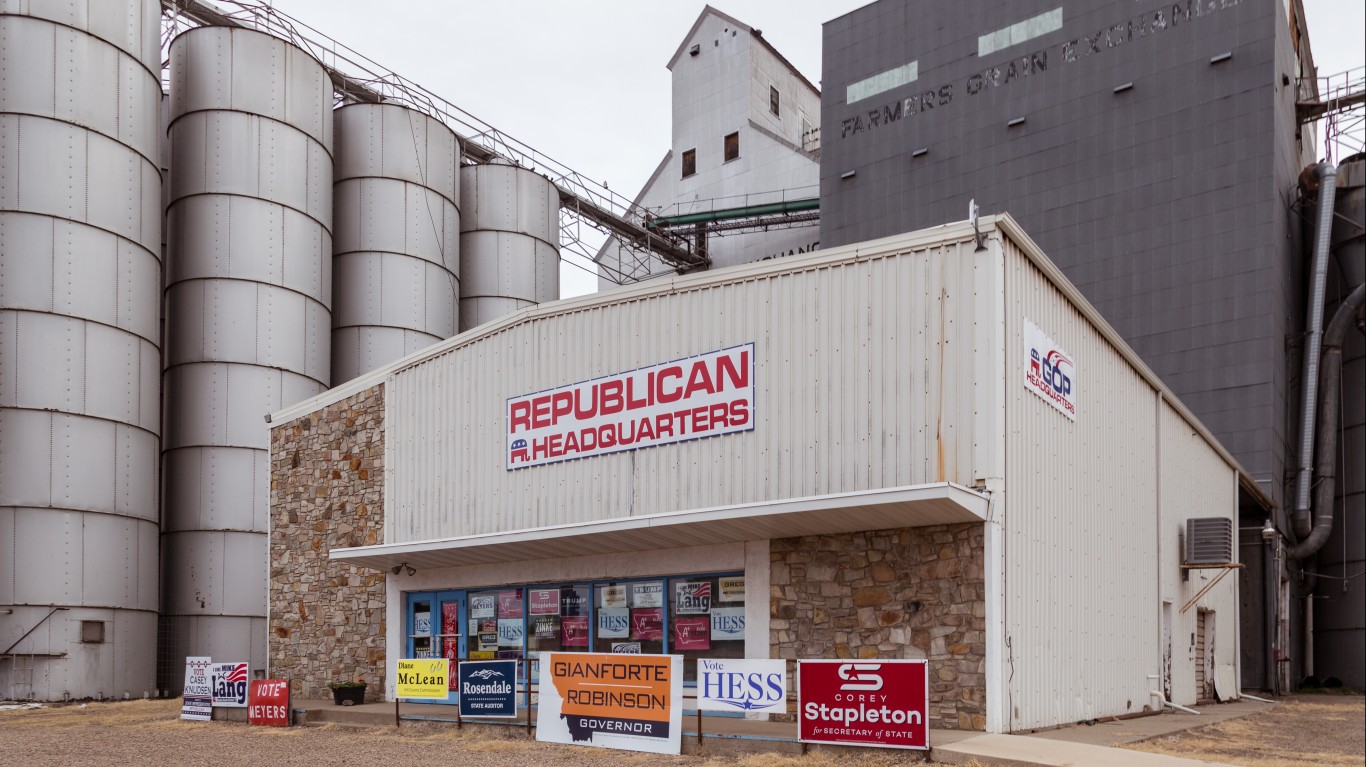
Montana: Havre
> Population: 9,763
> Median home value: $134,700 (state: $209,100)
> Poverty rate: 19.1% (state: 14.4%)
> Violent crimes per 100,000 people: 960 (state: 377)
Havre is a small city of less than 10,000 in northern Montana. Crime is much more common in Havre than it is across the state, with violent crime rate of 960 incidents per 100,000 people in the city compared to 377 per 100,000 in the state.
Many of the cities on this list reported shrinking populations over the last five years, but Havre is not one of them as the city’s population grew by 3.6% since 2012. Unemployment, however, will likely be a growing problem in Havre in the coming years as job growth has not kept pace with the population growth. Over the last five years, the number of people working in the city fell by 3.3%. Currently, 3.9% of the labor force in Havre is unemployed, compared to the 3.0% state unemployment rate.
See all stories featuring: Montana
[in-text-ad]
Source: Ammodramus / Wikimedia Commons
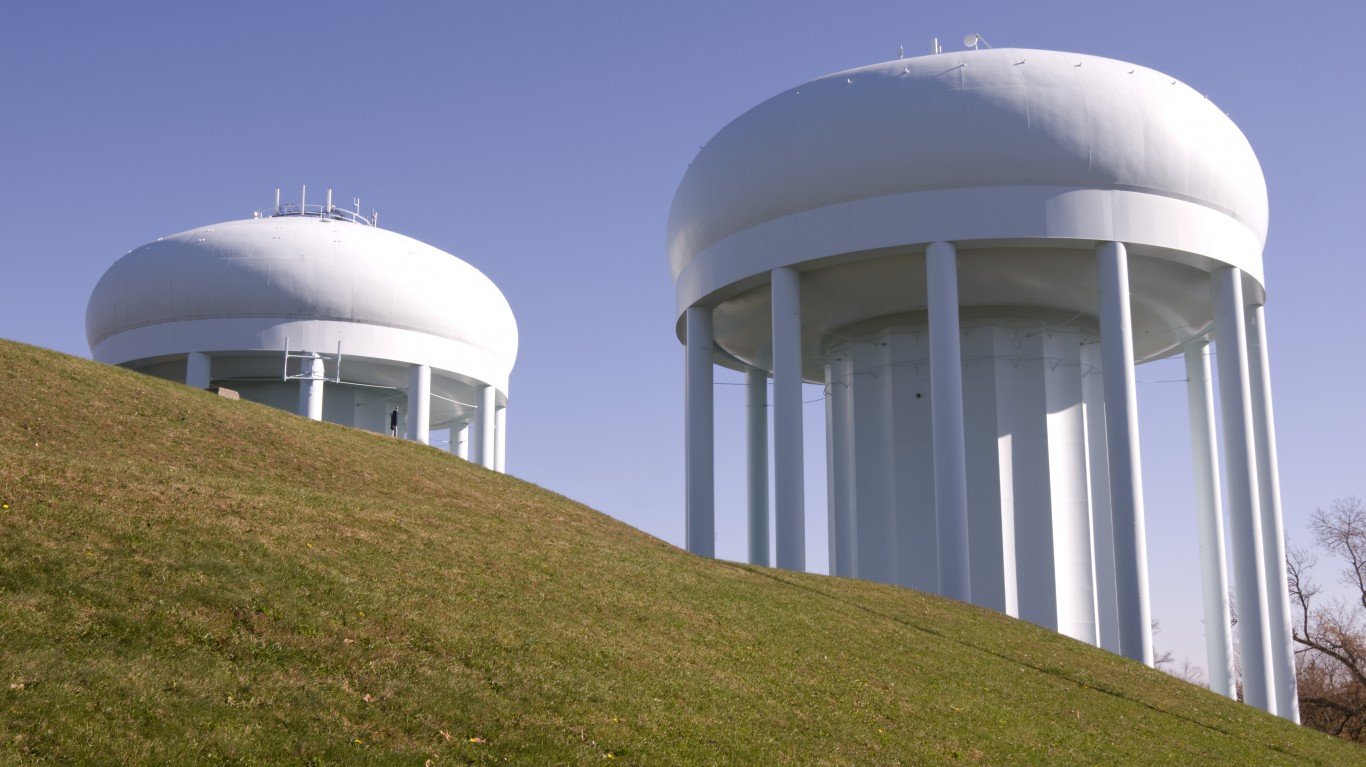
Nebraska: Bellevue
> Population: 53,040
> Median home value: $140,800 (state: $142,400)
> Poverty rate: 9.5% (state: 12.0%)
> Violent crimes per 100,000 people: 145 (state: 306)
Though Bellevue does not struggle with some of the more serious problems common in other cities on this list, like high poverty and violent crime rates, there are aspects of life in Bellevue that make it less preferable than other Nebraska cities.
Easy access to grocery stores and fresh produce is an important component of quality of life in any community, but in Bellevue, about one in every three residents live in so-called “food deserts” with low-access to a grocery store, nearly the largest share of any city in the state. Additionally, Bellevue’s 4.1% unemployment rate, which is on par with the national rate, is higher than in the vast majority of cities in Nebraska.
See all stories featuring: Nebraska

Source: Famartin / Wikimedia Commons
Nevada: Cold Springs
> Population: 9,184
> Median home value: $203,900 (state: $216,400)
> Poverty rate: 6.8% (state: 14.2%)
> Violent crimes per 100,000 people: N/A (state: 556)
Cold Springs is a small Census designated place just north of Reno along the California state border. Unlike most cities on this list, Cold Springs has a low poverty rate, strong employment, and relatively rapid population growth. Its ranking as the worst city to live in in Nevada is largely attributable to its lack of cultural and entertainment attractions. The concentration of attractions like museums, theatres, nature parks, restaurants, and bars is far lower in Cold Spring than it is nationwide.
Commute times are also longer than average in Cold Springs. It takes the typical Cold Springs commuter about 31 minutes to get to work, compared to the average commute time of 26 minutes nationwide. Over the course of a week, the typical commuter in Cold Springs spends nearly an hour more than the average American commuter getting to and from work.
See all stories featuring: Nevada
Source: John Phelan / Wikimedia Commons
New Hampshire: Derry
> Population: 22,378
> Median home value: $209,500 (state: $244,900)
> Poverty rate: 6.4% (state: 8.1%)
> Violent crimes per 100,000 people: 114 (state: 199)
Unlike most cities on this list, Derry is a relatively safe place, and relatively few residents face serious financial hardship. One of the reasons Derry ranks as the worst city to live in New Hampshire is the city’s high cost of living. Goods and services are 18.1% more expensive than they are nationwide on average — so while the typical area household earns $62,260 a year, more than the $57,652 the typical American household earns, adjusting for cost of living, the actual buying power of the median city income is less than $53,000.
Property taxes are also high in Derry. Homeowners pay the equivalent of 2.7% of their home value in taxes per year, compared to the 1.2% the typical American homeowner.
See all stories featuring: New Hampshire
[in-text-ad-2]
Source: Smallbones / Wikimedia Commons
New Jersey: Bridgeton
> Population: 24,948
> Median home value: $103,400 (state: $321,100)
> Poverty rate: 32.3% (state: 10.7%)
> Violent crimes per 100,000 people: 1,091 (state: 229)
Bridgeton is a small city of less than 25,000 residents in southern New Jersey. With a violent crime rate of 1,091 incidents per 100,000 people, it is one of the most dangerous cities in the state, and more dangerous than over 90% of American cities. High crime rates detract from quality of life and can make any city a less attractive place to live — and in Bridgeton it may have contributed to the 1.2% population decline over the last five years.
Crime is often concentrated in poorer areas, and nearly one in every three Bridgeton residents live below the poverty line, more than triple the 10.7% state poverty rate.
See all stories featuring: New Jersey
Source: afiler from Seattle (ex-Minneapolis) / Wikimedia Commons
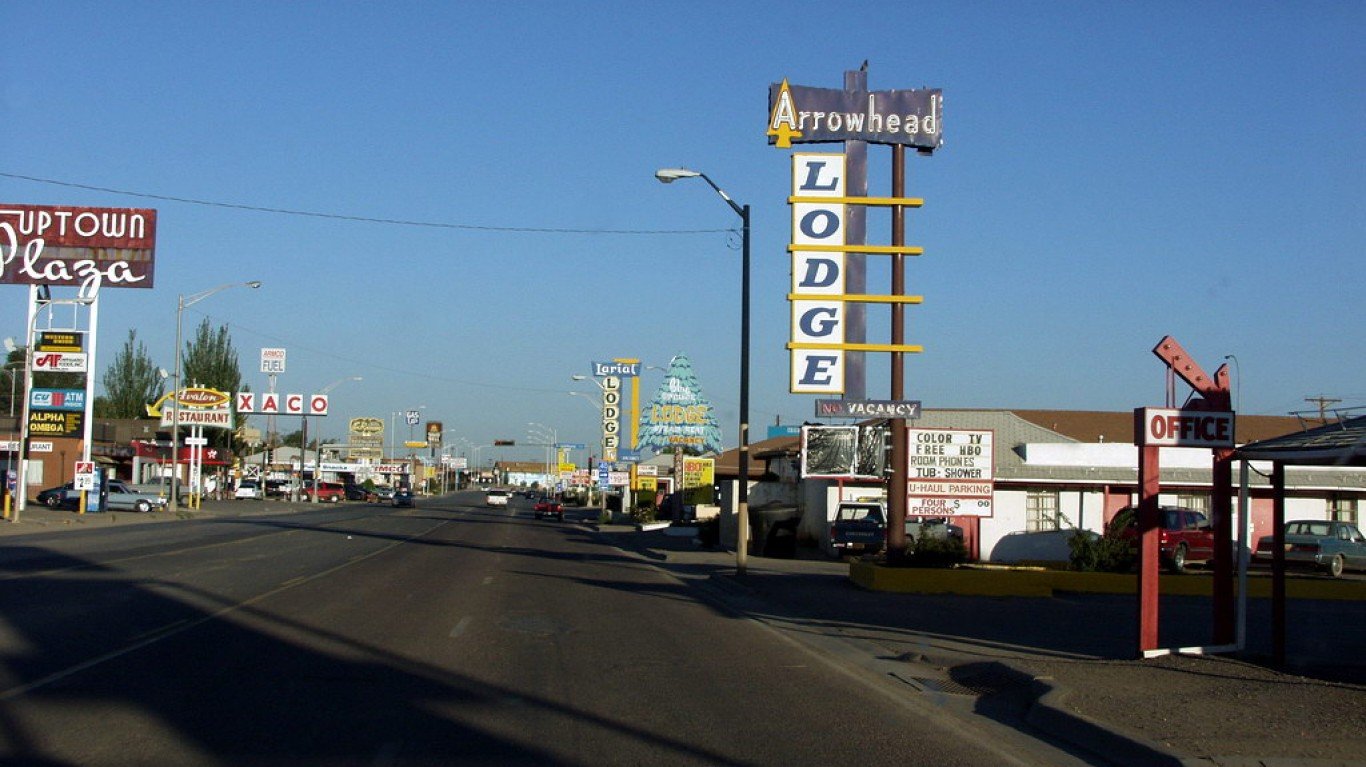
New Mexico: Gallup
> Population: 22,063
> Median home value: $123,700 (state: $163,900)
> Poverty rate: 29.9% (state: 20.6%)
> Violent crimes per 100,000 people: 1,543 (state: 783)
Gallup, a small city of about 22,000 in western New Mexico, is one of the poorest places in the United States. About 30% of the Gallup population lives below the poverty line, well above both the poverty rates of 14.6% nationwide and 20.6% statewide. Crime is often concentrated in lower income areas, and in Gallup, the violent crime rate of 1,543 incidents per 100,000 people is higher than in over 90% of American cities.
Many Gallup residents live in food deserts. Nearly 60% of the population has low access to grocery stores and fresh, healthy food.
See all stories featuring: New Mexico
[in-text-ad]
Source: Daniel Case. / Wikimedia Commons
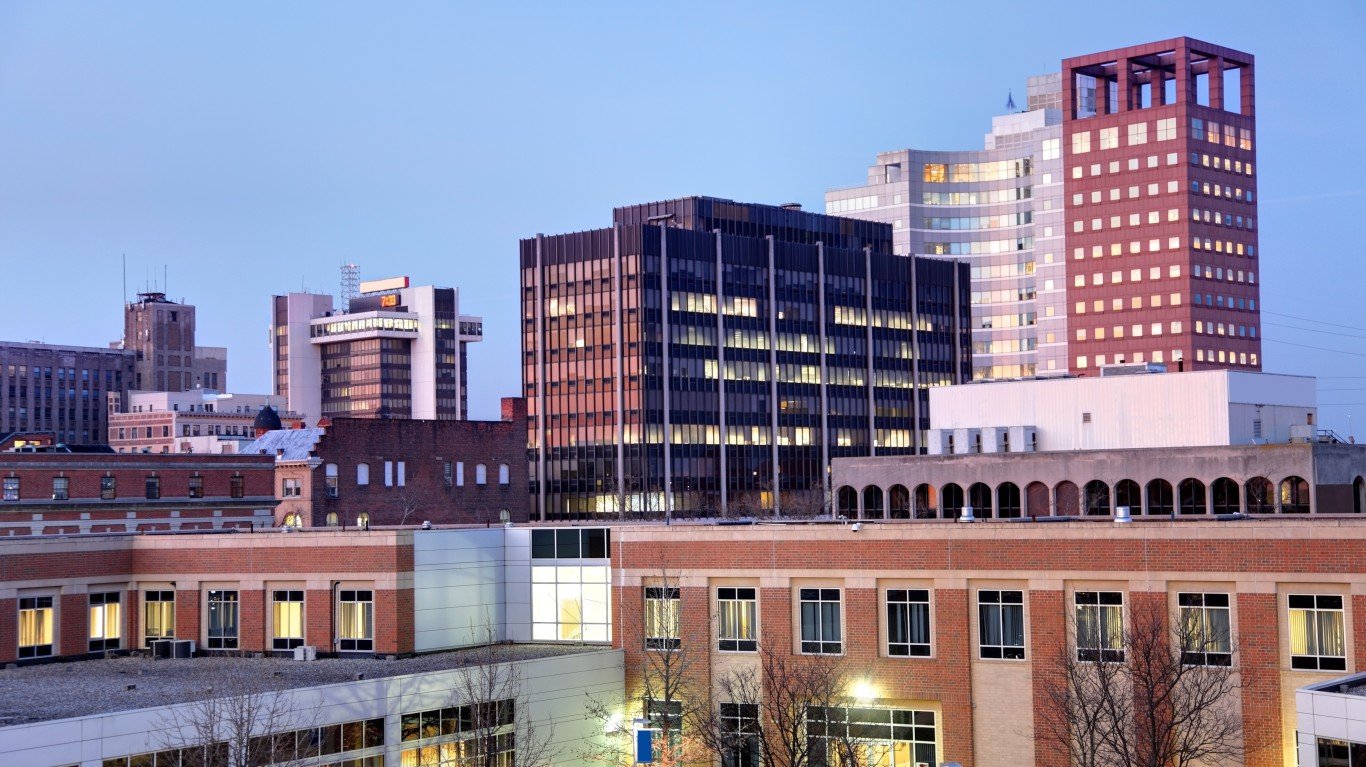
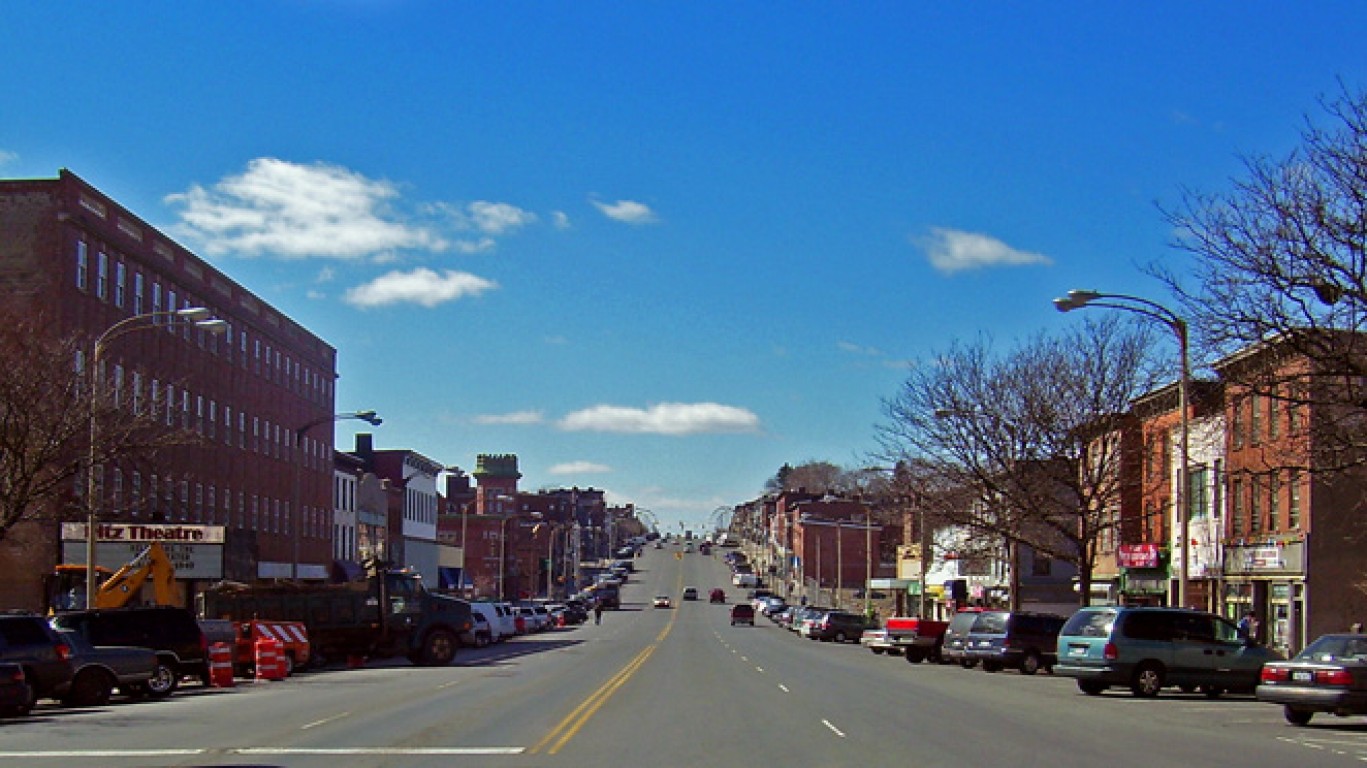
New York: Newburgh
> Population: 28,444
> Median home value: $170,900 (state: $293,000)
> Poverty rate: 31.2% (state: 15.1%)
> Violent crimes per 100,000 people: 1,236 (state: 357)
Newburgh ranks as the worst city to live in in New York state, largely because of its high violent crime rate and widespread financial hardship. There were 1,236 violent crimes for every 100,000 people in Newburgh in 2017, more than triple the state violent crime rate of 357 incidents per 100,000 people. Additionally, 31.2% of Newburgh residents live below the poverty line, more than double the 15.1% statewide poverty rate.
Like many cities on this list, Newburgh is shrinking. Over the last five years, Newburgh’s population contracted by 1.5%.
See all stories featuring: New York
Source: roadgeek / Flickr
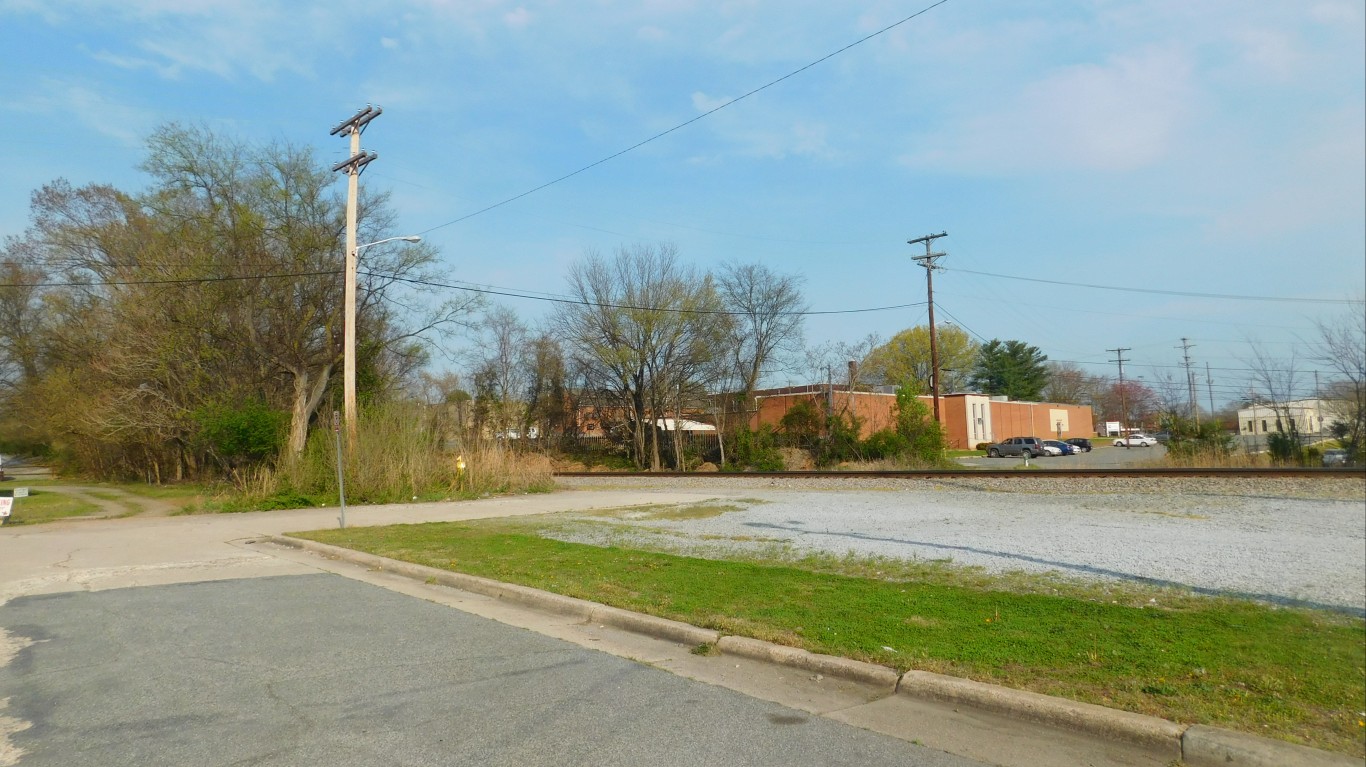
North Carolina: Lexington
> Population: 18,916
> Median home value: $102,800 (state: $161,000)
> Poverty rate: 31.0% (state: 16.1%)
> Violent crimes per 100,000 people: N/A (state: 364)
The typical household in Lexington, North Carolina, earns less than $30,000 a year, over $20,000 less than the median household income across the state as a whole. Additionally, 31.0% of residents live below the poverty line, a higher poverty rate than in over 90% of American cities. The area’s low incomes are partially attributable to the weak job market. Over the last five years, employment in the city declined by 8.1%. According to Census estimates, 7.8% of workers in Lexington are unemployed, compared to 4.4% of workers statewide.
See all stories featuring: North Carolina
Source: DenisTangneyJr / Getty Images
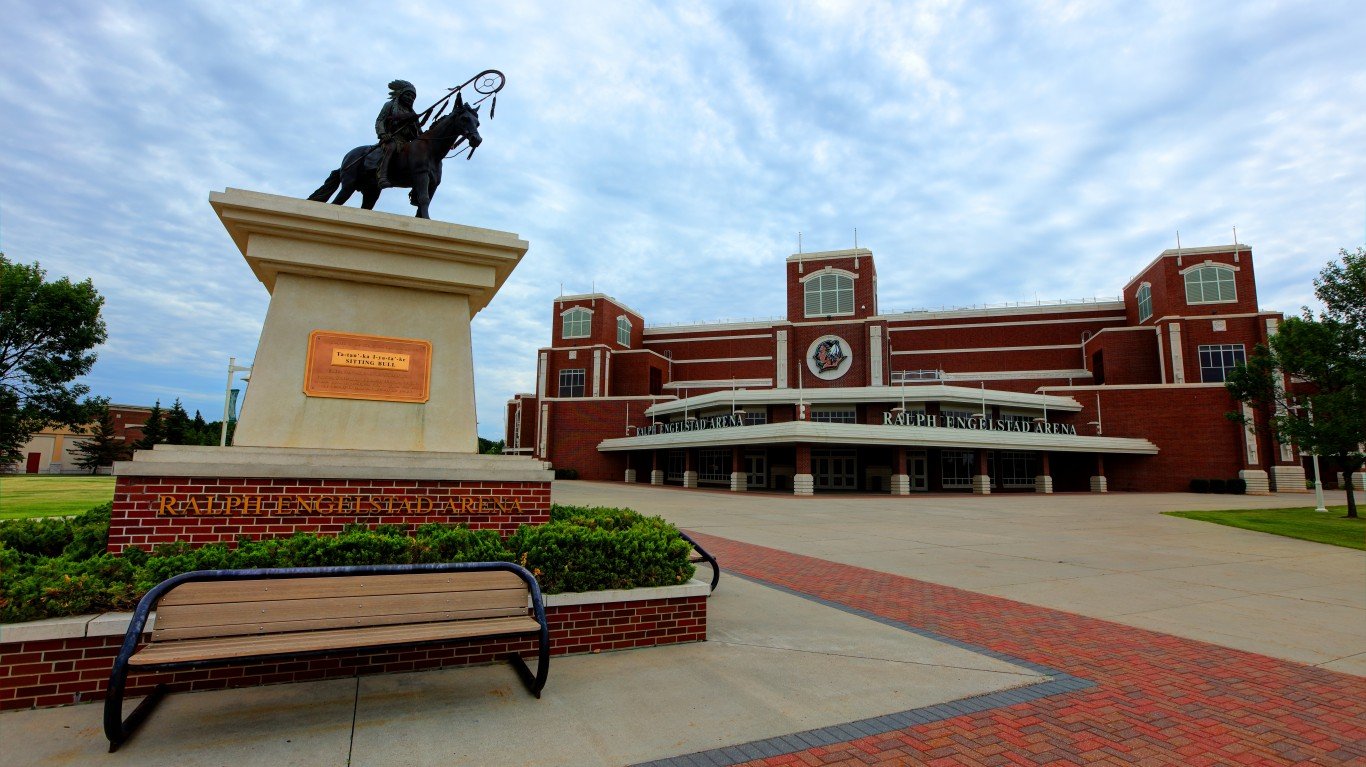
North Dakota: Grand Forks
> Population: 56,236
> Median home value: $186,500 (state: $174,100)
> Poverty rate: 19.7% (state: 11.0%)
> Violent crimes per 100,000 people: 315 (state: 281)
Though it ranks as the worst city to live in in North Dakota, Grand Forks is a far better place to live than most cities on this list. For example, the unemployment rate of 2.9% in Grand Forks, though it is the highest of any city in the state is well below the comparable 4.1% national rate. Similarly, the median annual household income of $48,241 is the lowest in the state — but, adjusting for the city’s low cost of living, the typical household’s buying power is $55,133, only slightly lower than the national median household income of $57,652.
Still, poverty is relatively high in Grand Forks. About one in every five residents live below the poverty line, a higher poverty rate than in at least 75% of American cities and the highest in the state.
See all stories featuring: North Dakota
[in-text-ad-2]
Source: PapaBear / Getty Images
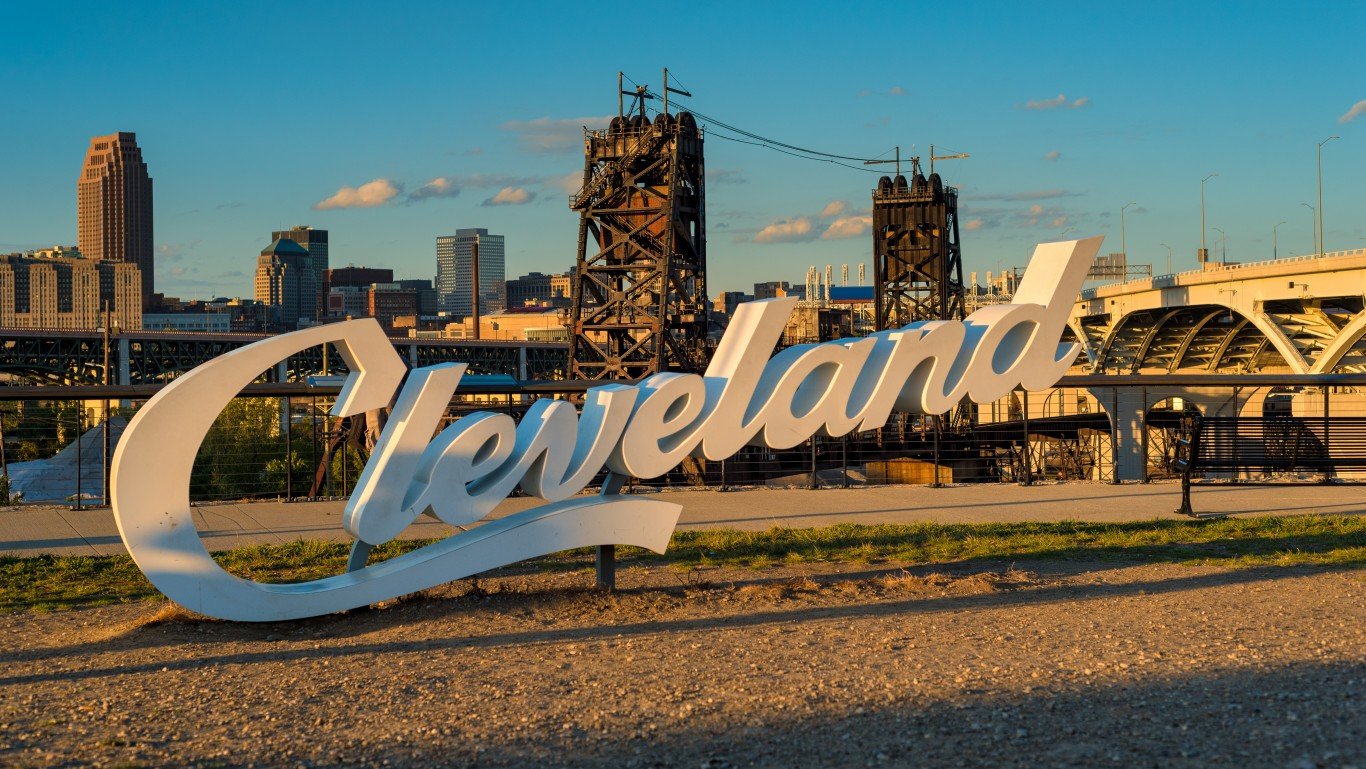
Ohio: Cleveland
> Population: 388,812
> Median home value: $67,600 (state: $135,100)
> Poverty rate: 35.2% (state: 14.9%)
> Violent crimes per 100,000 people: 1,557 (state: 297)
Most large American cities have grown in population in recent years. But Cleveland, the worst city to live in in Ohio, is not one of them. Of all the 64 U.S. cities home to 300,000 people or more, only five — including Cleveland — have a smaller population smaller now than they had five years ago. Since 2012, Cleveland’s population declined by 2.3%, even as the U.S. population grew by 3.8% over the same period.
The population decline may be partially explained by socioeconomic conditions in the city. A dangerous city, Cleveland’s violent crime rate of 1,557 incidents for every 100,000 people, is among the highest in the country and five times higher than Ohio’s violent crime rate of 298 per 100,000. Joblessness is also a problem as the city’s 9.4% unemployment rate is well above the comparable 4.1% statewide rate.
See all stories featuring: Ohio
Source: BOB WESTON / Getty Images
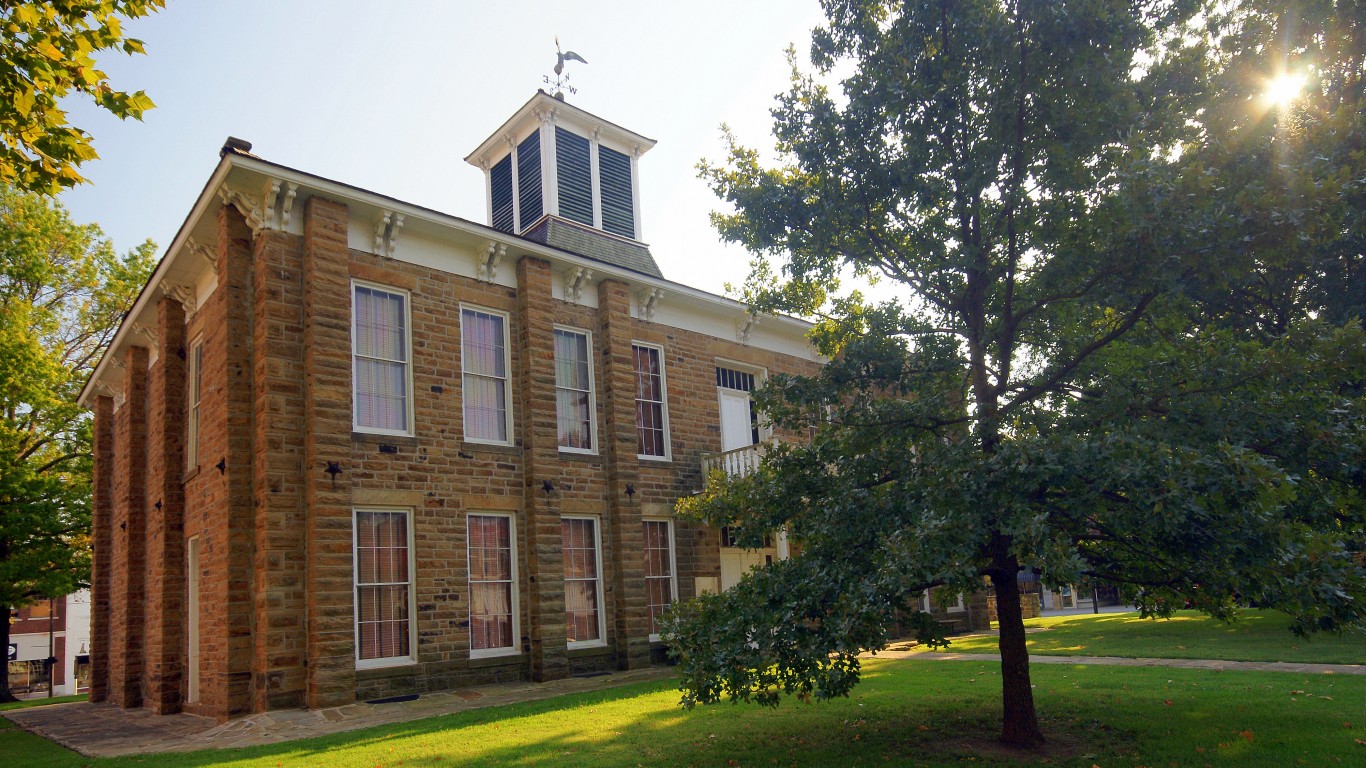
Oklahoma: Okmulgee
> Population: 12,123
> Median home value: $63,000 (state: $125,800)
> Poverty rate: 26.8% (state: 16.2%)
> Violent crimes per 100,000 people: 731 (state: 456)
Okmulgee is a small city of about 12,000 in the Tulsa metro area. Over the last five years, the city lost 2.2% of its population. The population decline and reduced housing demand have likely reduced property values. The typical Okmulgee home is worth just $63,000, about half the value of $125,800 of the typical Oklahoma home.
High crime rates may also be suppressing real estate values and detract from the overall quality of life in the city. There were 731 violent crimes for every 100,000 people in Okmulgee in 2017, well above the state violent crime rate of 456 per 100,000.
See all stories featuring: Oklahoma
[in-text-ad]

Source: 31246066@N04 / Flickr
Oregon: Sweet Home
> Population: 9,289
> Median home value: $126,400 (state: $265,700)
> Poverty rate: 22.6% (state: 14.9%)
> Violent crimes per 100,000 people: 221 (state: 282)
Sweet Home is a small city of less than 10,000 in western Oregon. Its ranking as the worst place to live in the state is due largely to economic conditions. Overall employment in the city has fallen by 9.7% over the last five years, and the Census estimates that 6.7% of the labor force in Sweet Home is unemployed, well above the 4.2% state unemployment rate.
For many of those who are working in Sweet Home, compensation is relatively low. The typical household in the city earns just $36,411 a year. Meanwhile, the typical Oregon household earns $56,119 a year.
See all stories featuring: Oregon
Source: Smallbones / Wikimedia Commons
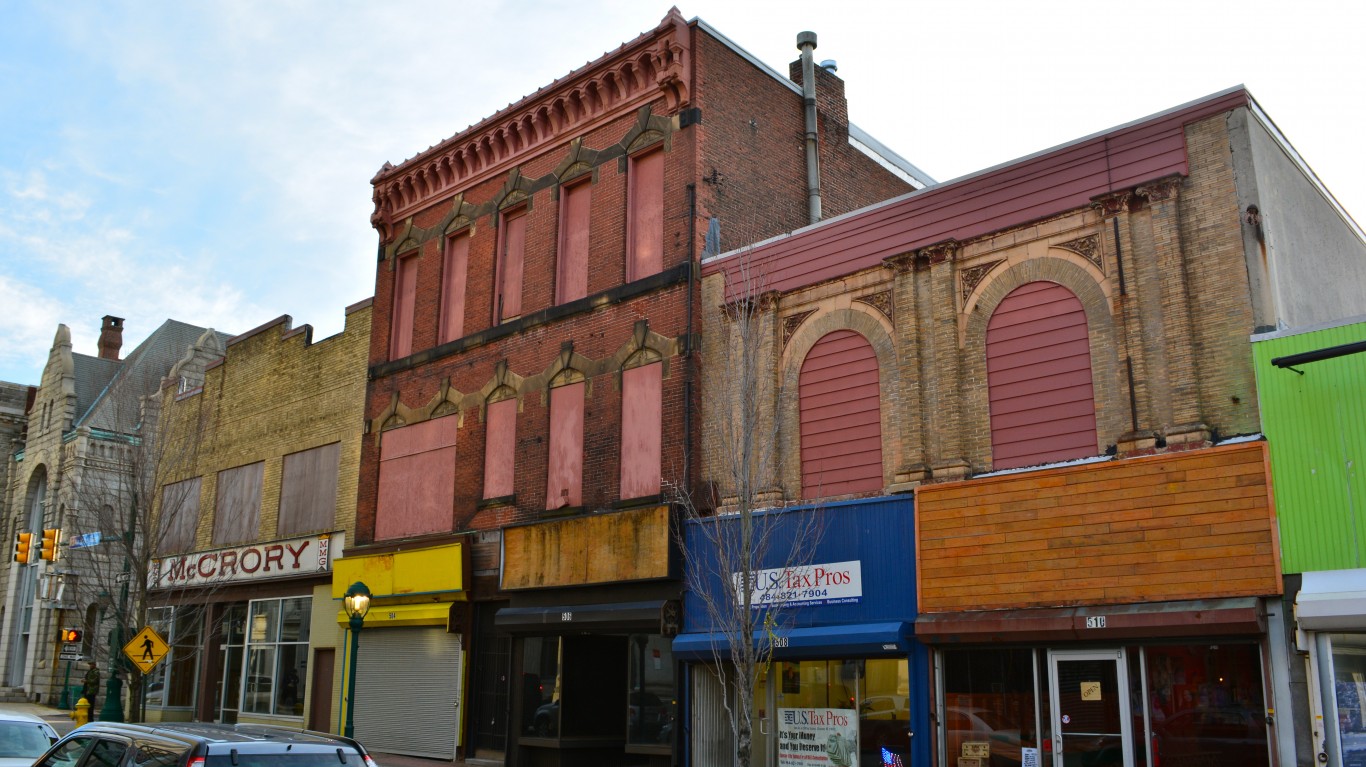
Pennsylvania: Chester
> Population: 34,102
> Median home value: $67,300 (state: $170,500)
> Poverty rate: 35.9% (state: 13.1%)
> Violent crimes per 100,000 people: 1,610 (state: 313)
Chester, a city of about 34,000 residents within the Philadelphia metro area is the worst city to live in Pennsylvania. Pennsylvania’s poverty rate of 13.1% is lower than the 14.6% national poverty rate — but in Chester, nearly 36% of the population lives on poverty level incomes. The area’s low incomes are partially attributable to the high jobless rate. Nearly one in every 10 workers in Chester are out of a job, more than double the 4.1% state unemployment rate.
Real estate values are often a reflection of what area residents can afford, and in Chester, the typical home is worth just $67,300, less than the median home value in over 90% of U.S. cities.
See all stories featuring: Pennsylvania
Source: Public Domain / Wikimedia Commons
Rhode Island: Central Falls
> Population: 19,395
> Median home value: $149,100 (state: $242,200)
> Poverty rate: 30.7% (state: 13.4%)
> Violent crimes per 100,000 people: 500 (state: 232)
The typical household in Central Falls, Rhode Island, earns just $30,794 a year, well below the national median household income of $57,652. After adjusting for the city’s high cost of living, the typical Central Falls household’s actual purchasing power is closer to about $26,000 a year. The area’s low incomes make housing particularly unaffordable. The typical Central Falls home is worth $149,100, nearly five times as much as the area’s median income. Nationwide, the typical home is worth 3.4 times as much as the median income.
See all stories featuring: Rhode Island
[in-text-ad-2]
Source: Billy Hathorn / Wikimedia Commons
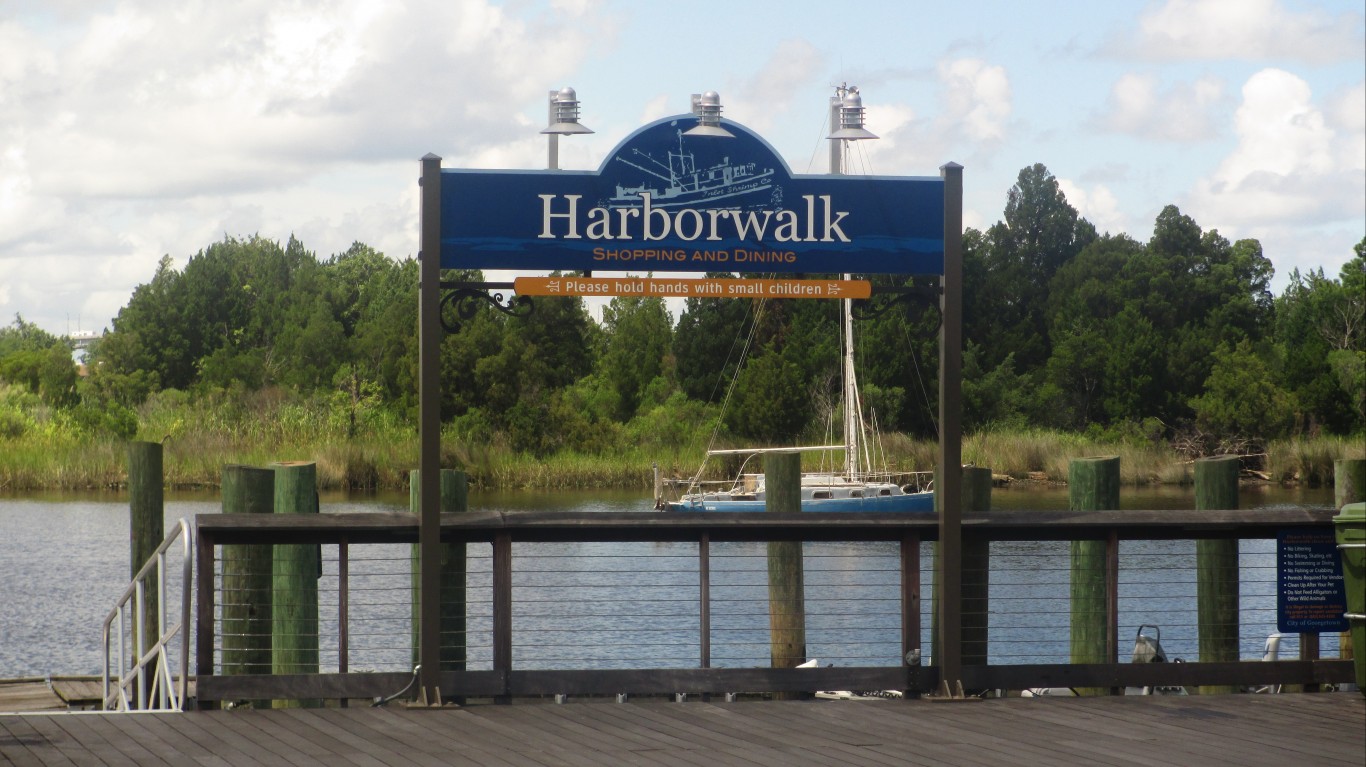
South Carolina: Georgetown
> Population: 8,960
> Median home value: $158,000 (state: $148,600)
> Poverty rate: 37.1% (state: 16.6%)
> Violent crimes per 100,000 people: 1,422 (state: 506)
Georgetown is one of the poorest cities in South Carolina and the entire United States. The city’s 37.1% poverty rate is more than double the 16.6% state poverty rate and greater than in more than 90% of all U.S. cities. Crime is often concentrated in lower-income areas, and Georgetown is not an exception. The city’s violent crime rate of 1,422 incidents per 100,000 people in 2017 is nearly triple the statewide rate of 506 per 100,000.
The high crime and widespread financial hardship may be pushing some residents out of Georgetown. In the last five years, the number of people living in the city fell by 2.4%.
See all stories featuring: South Carolina

Source: mrt77 / Flickr
South Dakota: Box Elder
> Population: 9,277
> Median home value: $130,700 (state: $152,700)
> Poverty rate: 14.5% (state: 13.9%)
> Violent crimes per 100,000 people: 333 (state: 434)
Box Elder is a small city of less than 10,000 in the Rapid City metro area. Though it ranks as the worst city to live in in South Dakota, it is a preferable place to live than the vast majority of cities on this list. Though Box Elder has a higher cost of living than every other city considered in the state, goods and services are still about 4.5% less expensive than they are nationwide on average.
Box Elder residents, however, have relatively few local entertainment and dining options. The city has a far lower than typical concentration of places like restaurants, nature parks, museums, and movie theaters.
See all stories featuring: South Dakota
[in-text-ad]
Source: Sean Pavone / Getty Images
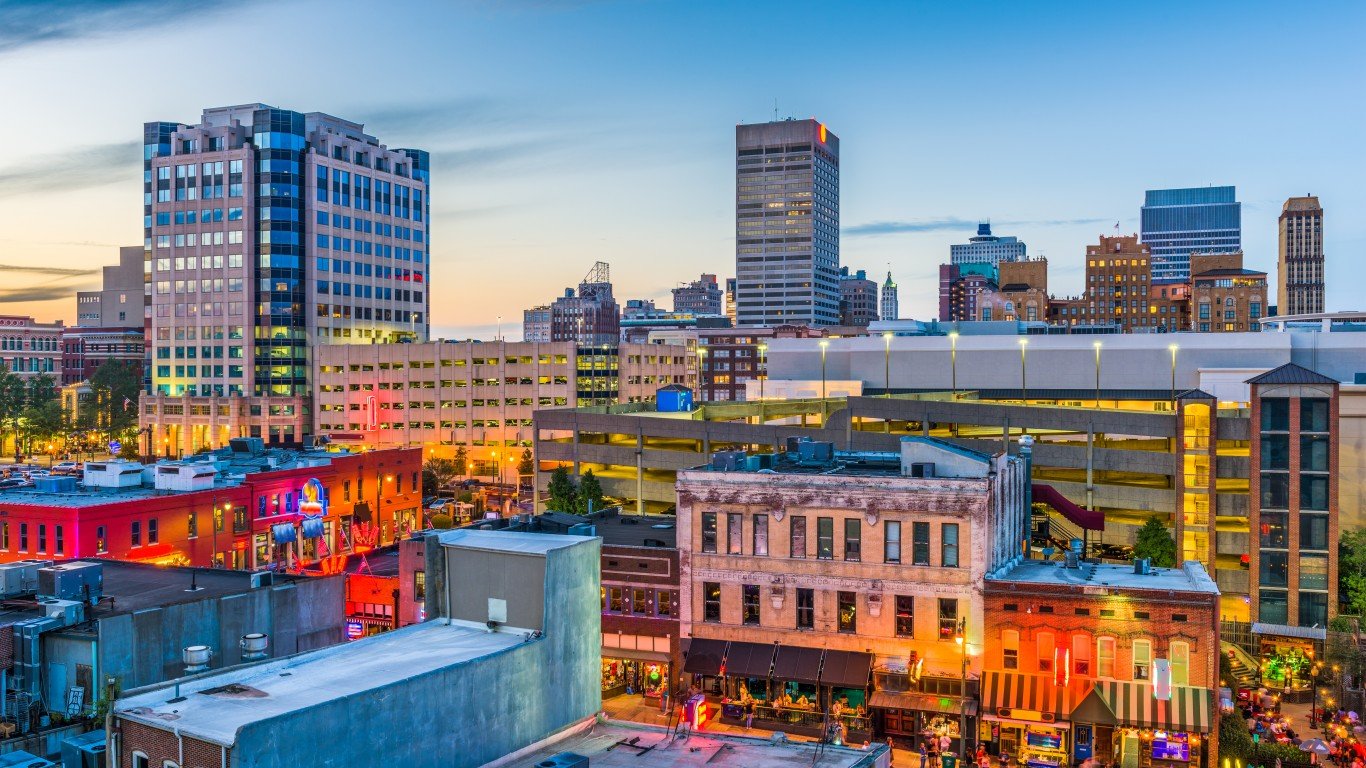
Tennessee: Memphis
> Population: 654,723
> Median home value: $94,200 (state: $151,700)
> Poverty rate: 26.9% (state: 16.7%)
> Violent crimes per 100,000 people: 2,003 (state: 652)
Memphis is the most dangerous city in Tennessee and one of the most dangerous cities in the United States. It is one of only 11 U.S. cities where the 2017 violent crime rate exceeded 2,000 incidents per 100,000 residents. As is the case in many high crime cities, Memphis is also home to a large poor population. More than one in every four Memphis residents live below the poverty line, compared to the 16.7% poverty rate across Tennessee.
Joblessness is also a problem in Memphis. The city’s unemployment rate stands at 6.6%, far higher than the 4.0% state unemployment rate.
See all stories featuring: Tennessee
Source: jayphagan / Flickr
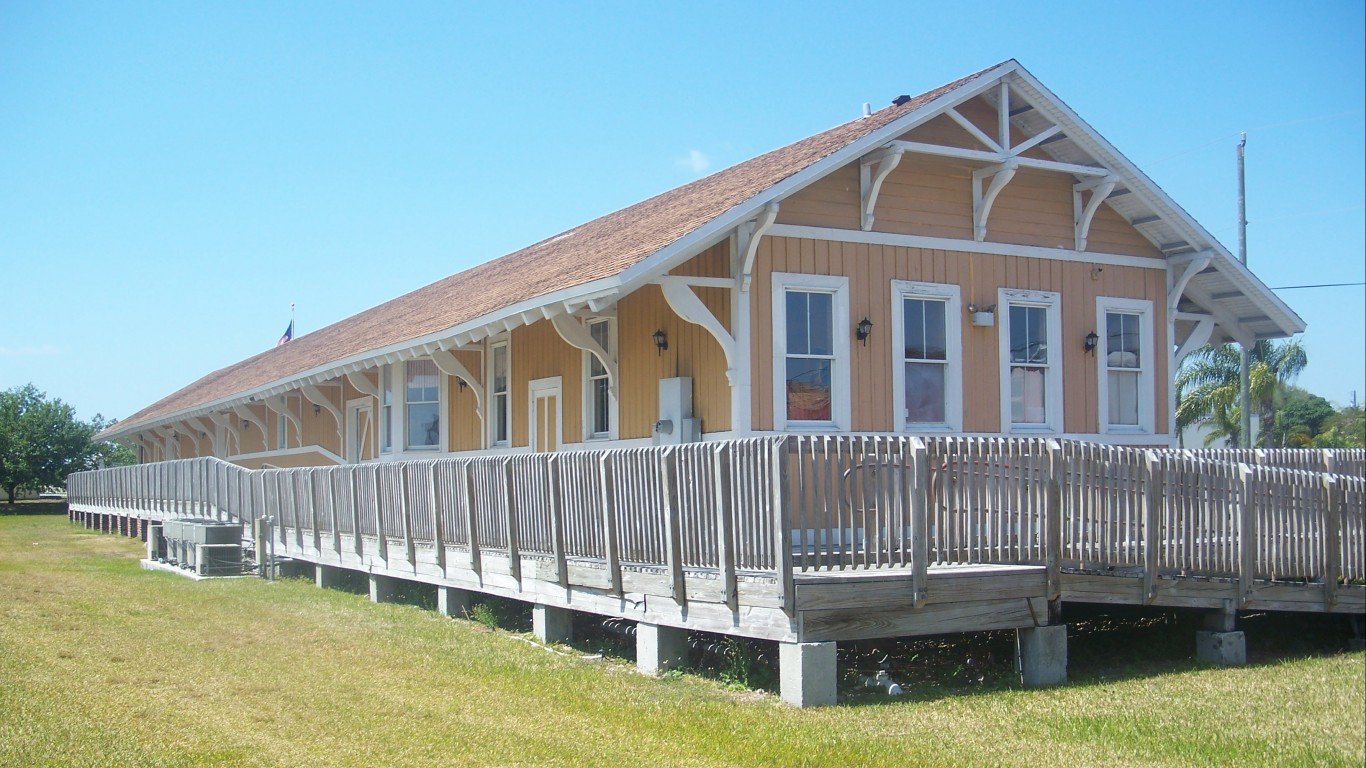
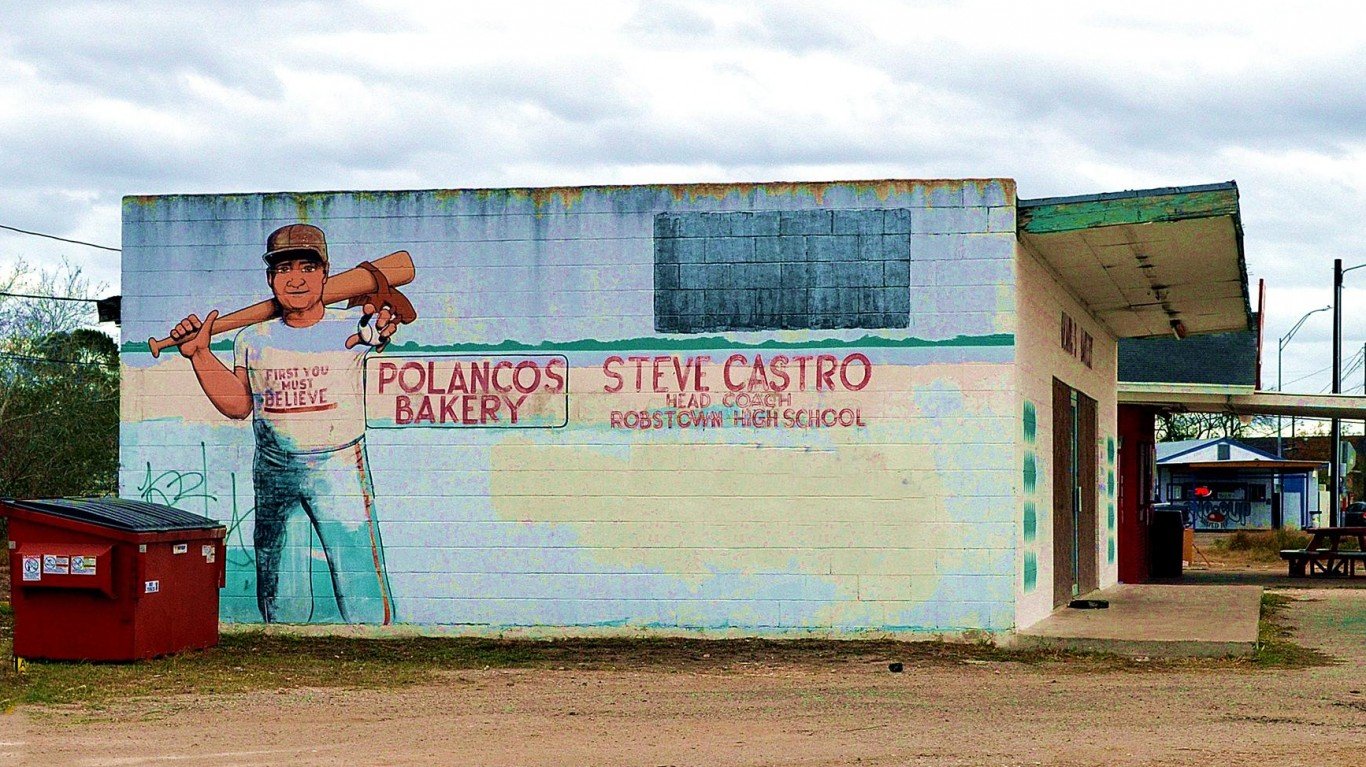
Texas: Robstown
> Population: 11,546
> Median home value: $54,300 (state: $151,500)
> Poverty rate: 35.1% (state: 16.0%)
> Violent crimes per 100,000 people: 894 (state: 439)
Robstown is a small city in southern Texas, just west of Corpus Christi. The city has struggled with high joblessness for years. The Census estimates that an average of 8.1% of the area’s labor force has been unemployed over the last five years, well above the comparable 4.1% national unemployment rate and more than double the state’s 3.7% unemployment rate. Indeed, jobs appear to be disappearing in the city. Overall employment dipped in Robstown by 6.6% between 2012 and 2017, even as U.S. employment rose by 6.1%.
Likely due in part to the weak job market, Robstown is losing residents. Even though Texas ranks as one of the fastest growing states by population, Robstown’s population shrunk by 0.2% in the last five years.
See all stories featuring: Texas
Source: David JolleyStaplegunther / Wikimedia Commons
Utah: Grantsville
> Population: 10,170
> Median home value: $212,300 (state: $238,300)
> Poverty rate: 7.7% (state: 11.0%)
> Violent crimes per 100,000 people: 280 (state: 239)
Though Grantsville ranks as the worst city in Utah, it is safer and has a lower poverty rate than the state as a whole; it is also a far preferable place than many other cities on this list. Grantsville’s status as the worst city in Utah is attributable primarily to factors relating to community and quality of life. For example, a higher than average 31.1% of the population has low access to grocery stores, and the nearest hospital is about 10 miles away. Grantsville also has a higher drug overdose mortality rate than most cities in Utah. The city also has a lower than typical concentration of entertainment options like restaurants, bars, nature parks, museums, and movie theaters.
See all stories featuring: Utah
[in-text-ad-2]
Source: John Phelan / Wikimedia Commons
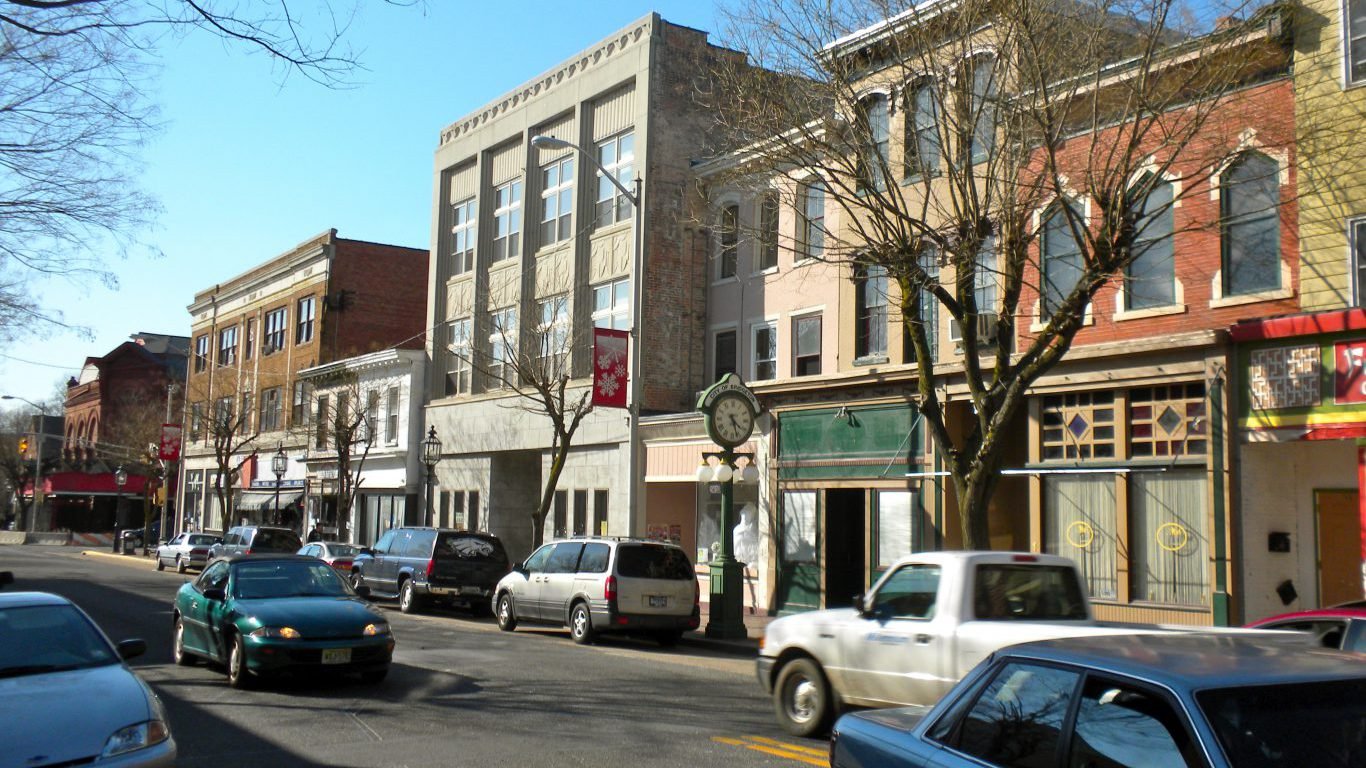
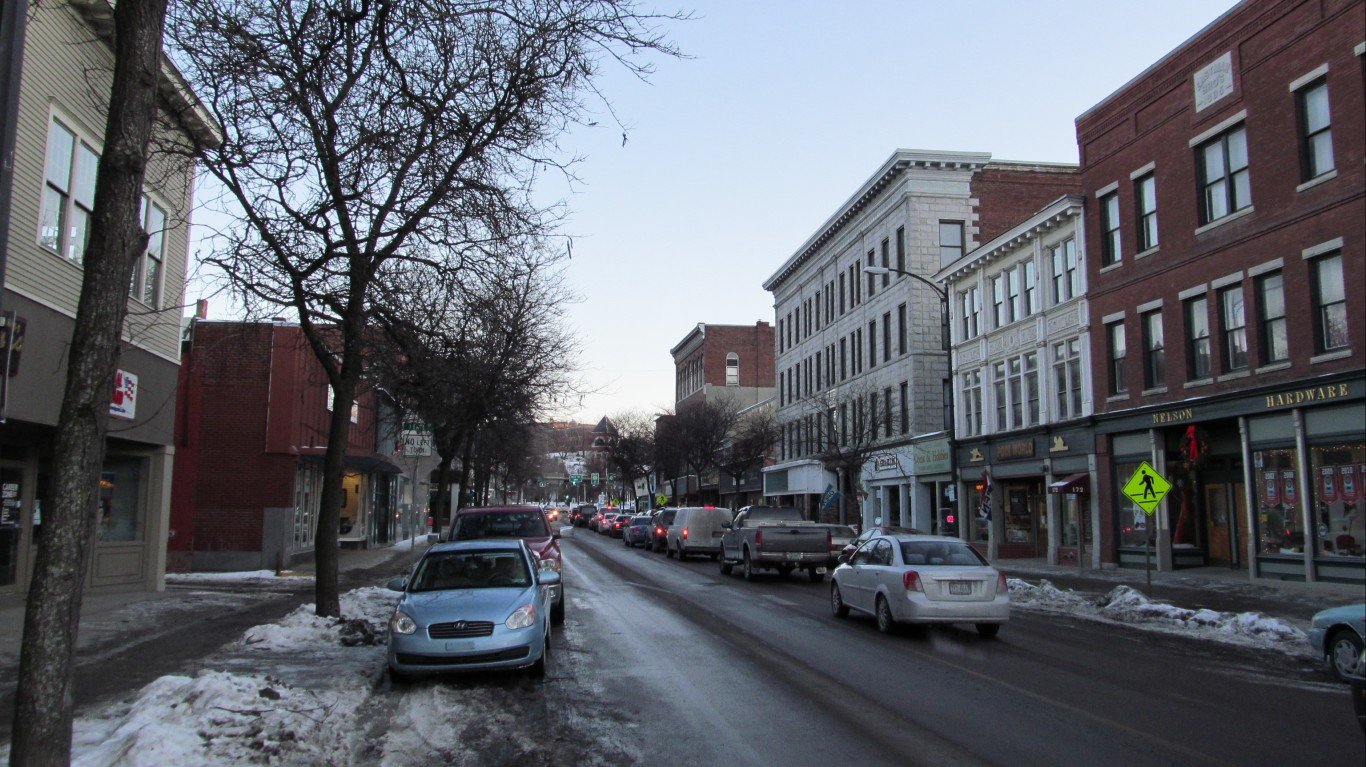
Vermont: Barre
> Population: 8,778
> Median home value: $151,500 (state: $220,600)
> Poverty rate: 27.4% (state: 11.4%)
> Violent crimes per 100,000 people: 358 (state: 166)
The unemployment rate in Barre, Vermont, of 4.6% is the highest of any city considered in the state and half a percentage point higher than the national unemployment rate. The relative lack of jobs may partially explain the city’s recent population decline. Over the last five years, the number of people living in Barre fell by 2.9%. Over the same period, the number of people working in the city fell by 4.8%.
The area’s weak job market may also partially explain widespread financial hardship in Barre. The city’s 27.4% poverty rate is higher than every other city in the state and the 14.6% national poverty rate.
See all stories featuring: Vermont
Source: andrewbain / Flickr
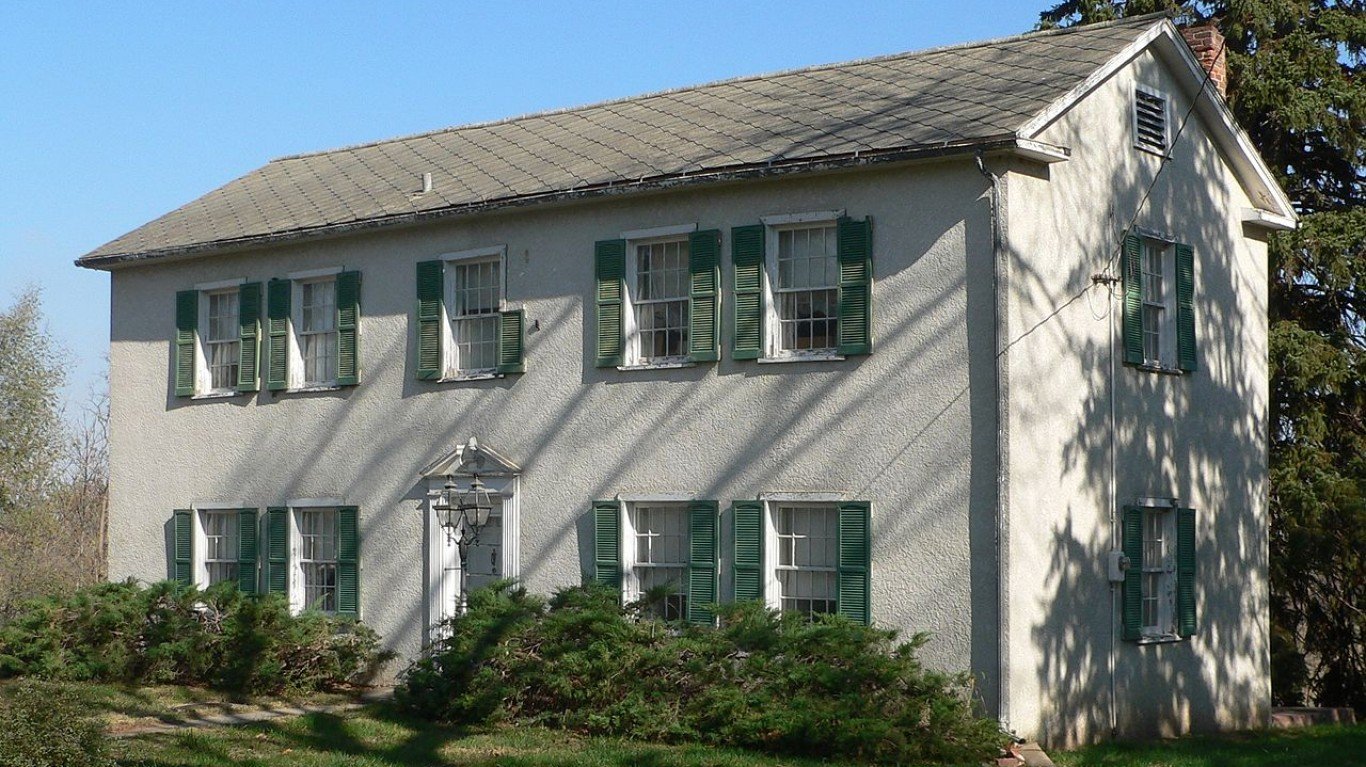
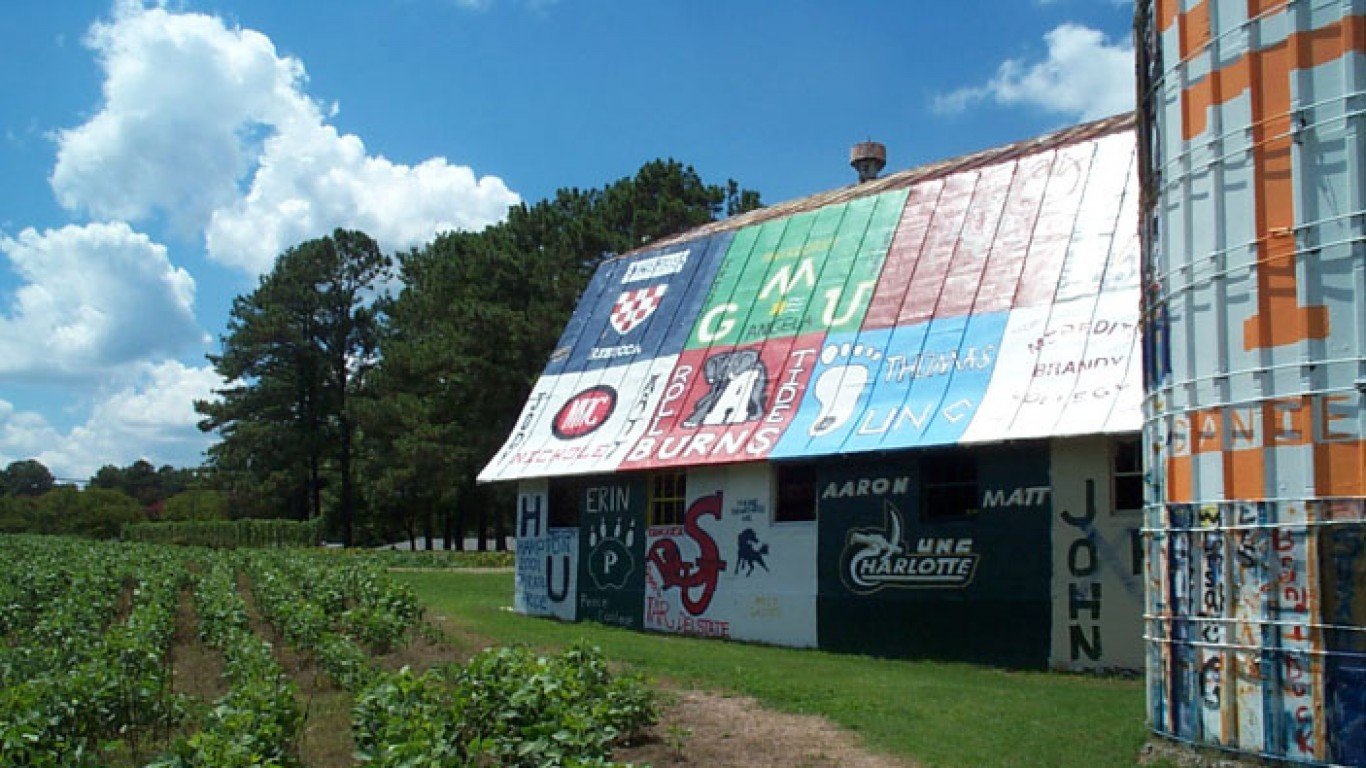
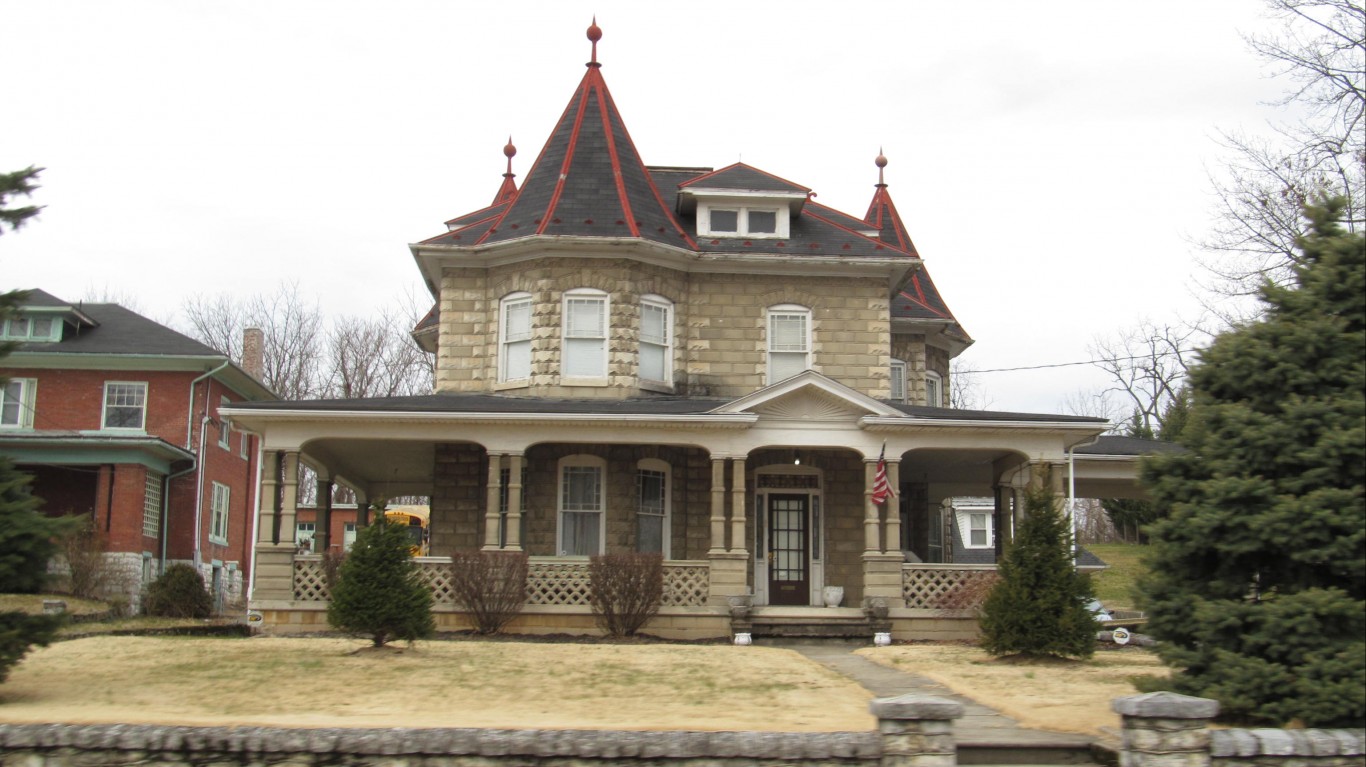
Virginia: Franklin
> Population: 8,334
> Median home value: $186,100 (state: $255,800)
> Poverty rate: 16.6% (state: 11.2%)
> Violent crimes per 100,000 people: 364 (state: 208)
An estimated 9.3% of workers in Franklin, Virginia, are out of a job, the highest unemployment rate of any city in the state and more than double the 4.1% national unemployment rate. The area’s weak job market may partially explain the population decline in Franklin. Over the last five years, the number of people living in the city fell by 2.3%.
Crime can detract from the overall quality of life in any city, and property crimes — like burglary and motor vehicle theft — are relatively common in Franklin. Franklin’s property crime rate of 5,636 incidents per 100,000 in 2017 is nearly the highest of any city in the state and well above the U.S property crime rate of 2,362 per 100,000.
See all stories featuring: Virginia
[in-text-ad]
Source: Rising*From*Ashes / Wikimedia Commons
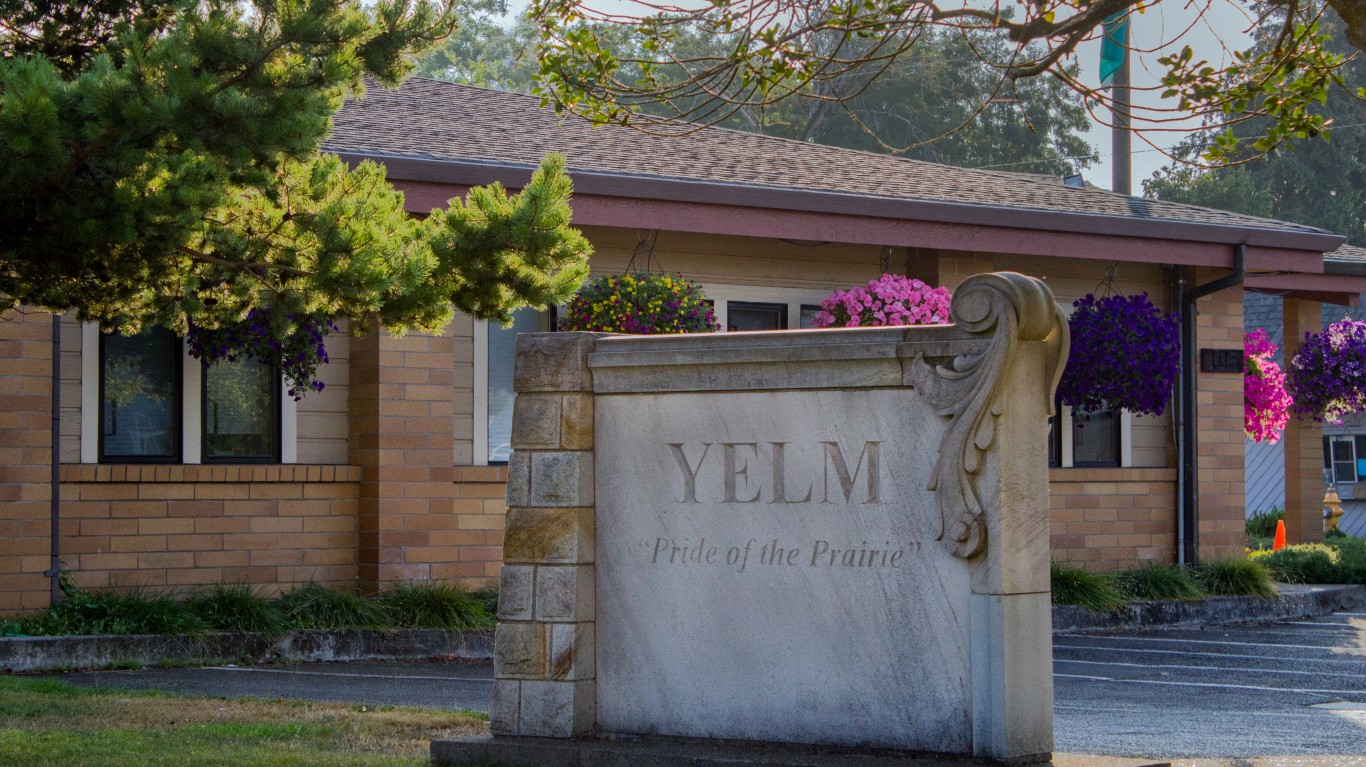
Washington: Yelm
> Population: 8,425
> Median home value: $220,100 (state: $286,800)
> Poverty rate: 13.4% (state: 12.2%)
> Violent crimes per 100,000 people: 258 (state: 304)
Though residents of Yelm, Washington, are far less likely to live below the poverty line or be the victim of a violent crime than those in most cities on this list, other conditions in the city detract from quality of life. For example, property crime — a broad category that includes burglary and motor vehicle theft — is relatively common in Yelm. The city’s property crime rate of 5,750 incidents per 100,000 in 2017 was nearly the highest of any city in the state and well above the U.S property crime rate of 2,362 per 100,000.
Unlike most cities on this list that are growing relatively slowly or losing residents in recent years, Yelm is growing rapidly. Over the last five years, the number of people living in the city increased by a staggering 24.6%. Over the same period, the U.S. population expanded by just 3.8%.
See all stories featuring: Washington
Source: dougtone / Flickr
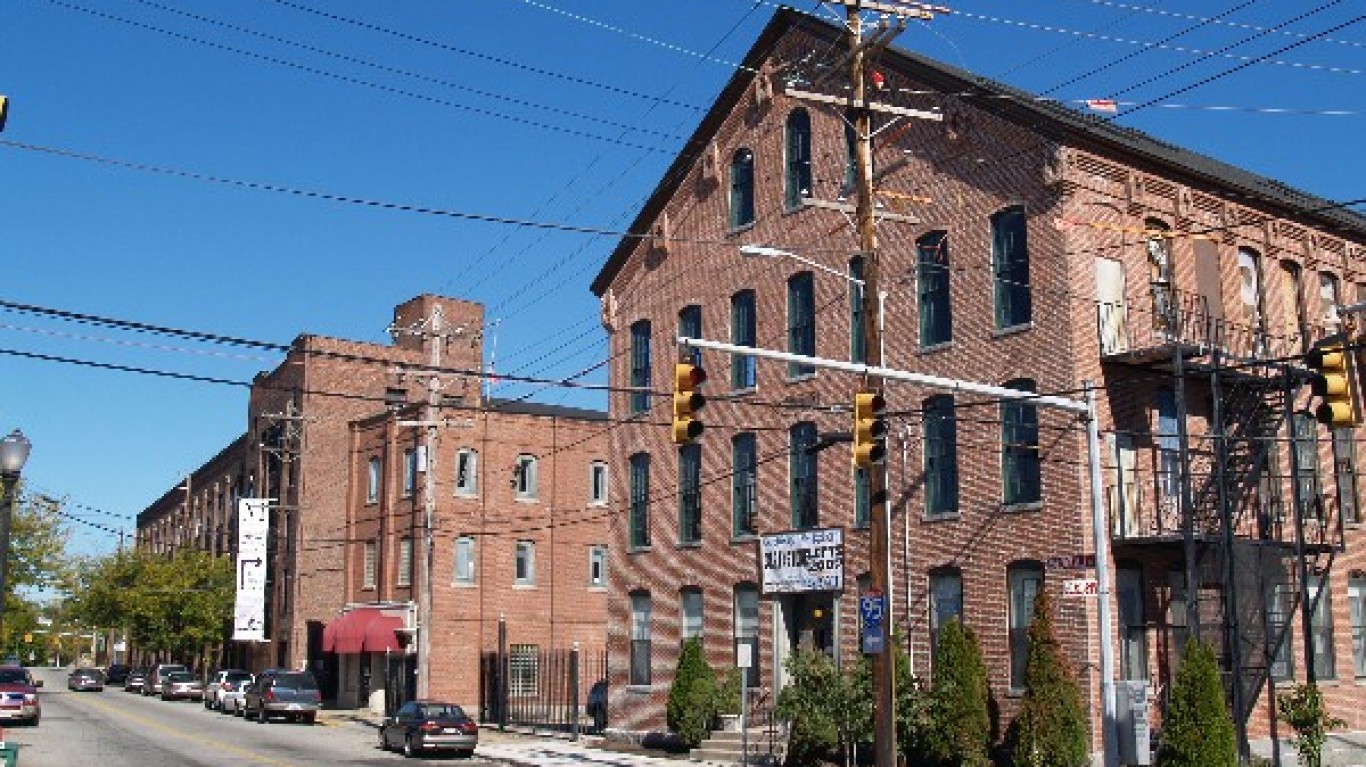
West Virginia: Martinsburg
> Population: 17,451
> Median home value: $149,800 (state: $111,600)
> Poverty rate: 27.4% (state: 17.8%)
> Violent crimes per 100,000 people: 473 (state: 351)
Martinsburg is a city of about 17,500 residents in West Virginia’s eastern panhandle. Struggling economically, the city’s unemployment rate stands at 9.0% after the number of jobs in the city has dropped by about 6.3% over the last five years. According to Census estimates, West Virginia’s unemployment rate stands at 3.8%. The lack of jobs in the area may partially explain the widespread financial hardship in Martinsburg. The city’s 27.4% poverty rate is nearly 10 percentage points higher than the state poverty rate of 17.8%.
See all stories featuring: West Virginia
Source: LawrenceSawyer / Getty Images
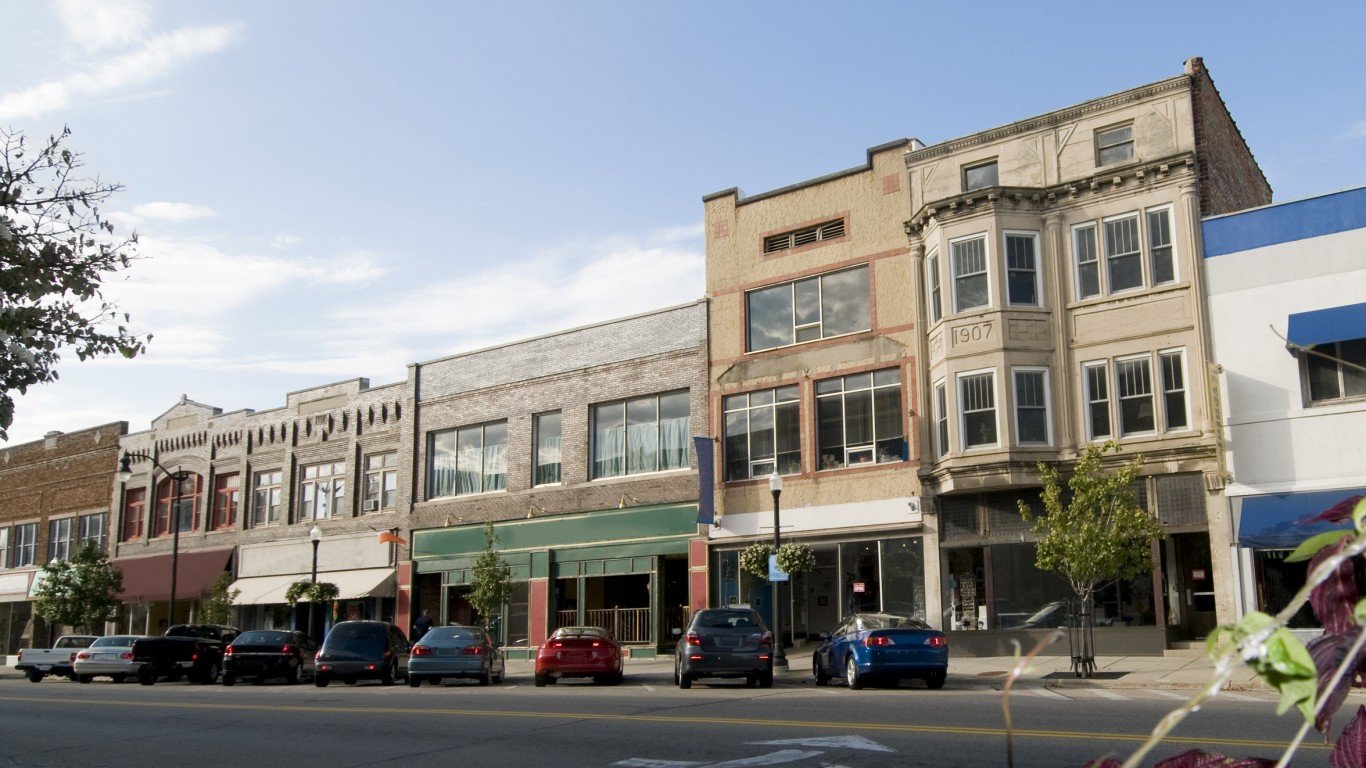
Wisconsin: Beloit
> Population: 36,733
> Median home value: $85,200 (state: $169,300)
> Poverty rate: 24.8% (state: 12.3%)
> Violent crimes per 100,000 people: 425 (state: 320)
Beloit is a small city in southern Wisconsin that sits on the Illinois state border. Nearly one in every four area residents live below the poverty line, a larger share than in over 90% of U.S. cities. In many cities, real estate values are a reflection of what area residents can afford, and in Beloit, property values are low. The typical city home is worth just $85,200, about half the value of the typical Wisconsin home.
The area’s low incomes are partially attributable to the high jobless rate. According to the Census, 6.4% of workers in Beloit are unemployed, the largest share of any city in the state and more than double Wisconsin’s 3.1% unemployment rate.
See all stories featuring: Wisconsin
[in-text-ad-2]
Source: BOB WESTON / Getty Images
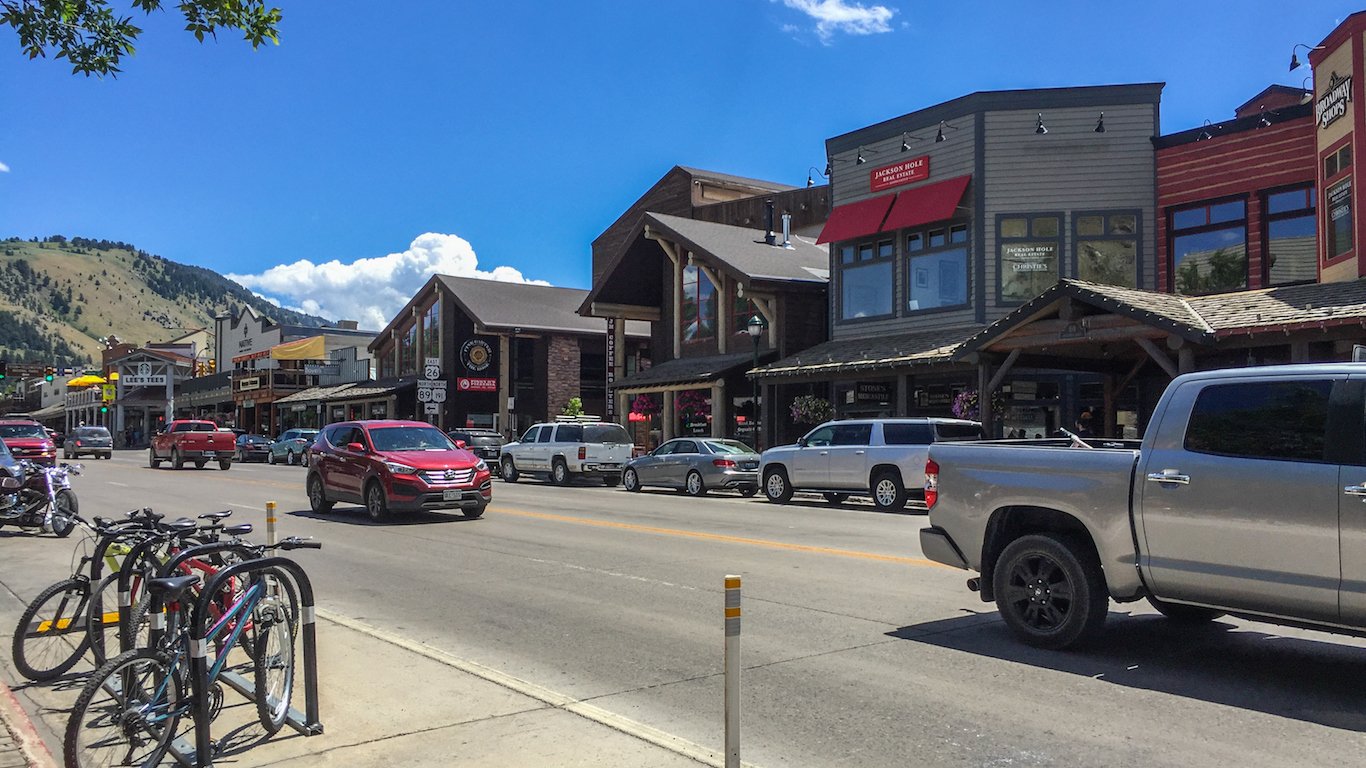
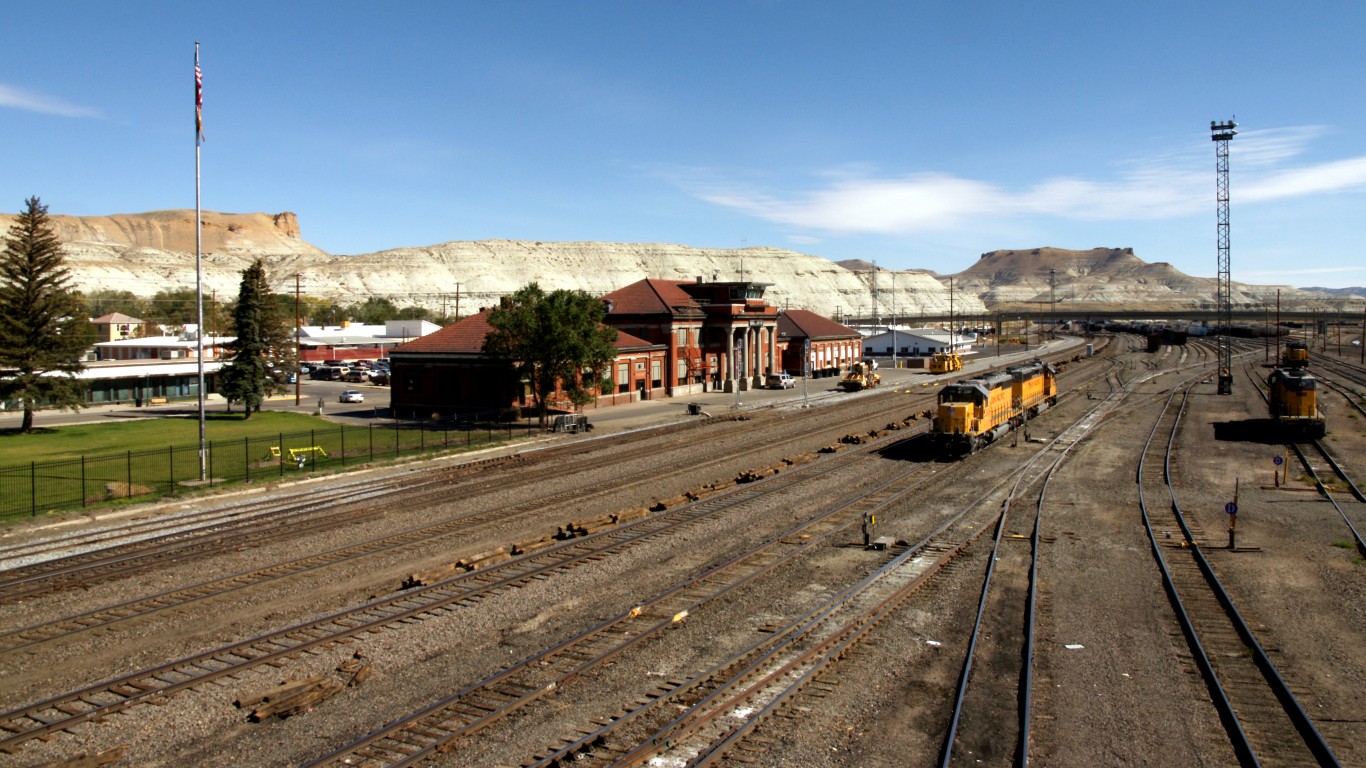
Wyoming: Green River
> Population: 12,396
> Median home value: $210,500 (state: $204,900)
> Poverty rate: 12.3% (state: 11.1%)
> Violent crimes per 100,000 people: 163 (state: 238)
Though Green River does not struggle with some of the more serious problems common in other cities on this list, like high poverty and violent crime rates, there are aspects of life in Green River that make it less preferable than other Wyoming cities. For example, area residents have little in the way of entertainment options as the city has a far lower than typical concentration of restaurants, movie theaters, museums, and nature parks as compared to other cities considered for the state. Also, the nearest hospital is about 13 miles away, while every other city in the state is within 2 miles of a hospital.
Employment options are also relatively limited in Green River. According to the Census, 4.0% of the city’s labor force is unemployed, which while lower than the comparable 4.1% national rate, is higher than the jobless rate in nearly every other city in the state.
See all stories featuring: Wyoming
Methodology
To identify the worst cities to live in, 24/7 Wall St. created a weighted index of 25 measures that fall into one of four categories: affordability, economy, quality of life, and community. The city with the worst score in every state was considered the worst city in the state to live in.
In the affordability category, the ratio of the median home value to the median income was given full weight. Cities where the median home value is closer to the median household income were rewarded. Cost of living, as determined by the average cost of goods and services in an area relative to average prices across the nation as a whole, was given a full weight. Property taxes are largely levied at the local level, and cities where residents pay more property taxes as a percentage of their home value were penalized. Property taxes were given a one-quarter weighting.
In the economy category, the unemployment rate was given a full weight. We used five-year average unemployment due to lack of comparable annual data at local levels. Five-year employment growth and the share of the total working-age population with a job were each given a half weight, favoring areas with greater employment and growing job opportunities.
In the quality of life category, the poverty rate was given a full weight, penalizing cities where poverty is more common. The share of the population that struggles to put food on the table due to distance from a grocery store, known as the food insecurity rate, was given full weight. A city’s mortality rate, calculated as the number of people who died while in hospital care per hospital by city, was also given full weight. In cases where city-level data was not available, mortality rates were imputed from county level data.
The drug overdose mortality rate was given a one-quarter weighting, as was the hospital readmission rate, defined as the share of those released from the hospital who were readmitted within 30 days. Distance from the center of the city to the nearest hospital was given full weight, with greater distances penalized.
The number of hospitalizations that would have been prevented by regularly scheduled doctor visits for every 1,000 Medicare enrollees — known as the preventable hospitalization rate — was given half weighting.
Measures used in the community category included the average travel time to work, which was given full weight. The violent crime rate — the total number of rapes, robberies, murders, and aggravated assaults adjusted per 100,000 residents per year— was given full weight. So, too, was the property crime rate, which is the total number of burglaries, larcenies, motor vehicle thefts, and incidents of arson per 100,000 residents per year.
The share of commuters either walking, cycling, or taking public transit to work was given half weight and lower shares were penalized. The total number of restaurants, bars, museums, theater companies, movie theaters, libraries, and parks per capita were each given a one-quarter weighting.
Median household income, median home value, average travel time to work, poverty rate, population, employment-to-population ratio, median property taxes paid, and average unemployment rate are all five-year estimates from the U.S. Census Bureau’s American Community Survey and are for 2017. Overall cost of living is for 2014 and comes from data analysis and aggregation company ATTOM Data Solutions.
The population-adjusted number of entertainment and cultural venues like restaurants and museums comes from the Census Bureau’s County Business Patterns data set and is for 2016.
Violent and property crime rates are from the FBI’s 2017 Uniform Crime Report. Drug overdose mortality rates are from the Centers for Disease Control and Prevention and are for the years 2014 to 2016. Mortality rates and hospital readmission rates are from the Centers for Medicare and Medicaid Services and are as of June 2015. Preventable hospitalizations are from the latest release from County Health Rankings & Roadmaps, a Robert Wood Johnson Foundation and University of Wisconsin Population Health Institute joint program.
Sponsored: Attention Savvy Investors: Speak to 3 Financial Experts – FREE
Ever wanted an extra set of eyes on an investment you’re considering? Now you can speak with up to 3 financial experts in your area for FREE. By simply
clicking here you can begin to match with financial professionals who can help guide you through the financial decisions you’re making. And the best part? The first conversation with them is free.
Click here to match with up to 3 financial pros who would be excited to help you make financial decisions.
Thank you for reading! Have some feedback for us?
Contact the 24/7 Wall St. editorial team.
Editors' Picks

